Article

Positive Energy Districts: The 10 Replicated Solutions in Maia, Reykjavik, Kifissia, Kladno and Lviv

1
VTT Technical Research Centre of Finland, 02044 Espoo, Finland
2
Fraunhofer Institute for Industrial Engineering, 70469 Stuttgart, Germany
3
University Centre for Energy Efficient Buildings, Czech Technical University, 16000 Praha, Czech Republic
4
BABLE Smart Cities Iberia, 08003 Barcelona, Spain
*
Author to whom correspondence should be addressed.
Smart Cities 2023, 6(1), 1-18; https://doi.org/10.3390/smartcities6010001
Submission received: 30 October 2022 / Revised: 2 December 2022 / Accepted: 9 December 2022 / Published: 20 December 2022

Abstract

:
Cities have an undoubted significant role in climate change mitigation. Several cities across the globe have made commitments to sustainability transitions through green strategies. In the recent past, Europe has witnessed a surge in the development of smart cities and advancement towards creating more sustainable cities. At the moment, the concept of Positive Energy Districts (PEDs) further encourages districts and cities to change their business-as-usual ways to be more carbon neutral. This paper looks at the five cities of Maia, Reykjavik, Kifissia, Kladno, and Lviv that are a part of an ongoing Horizon 2020 project. The purpose of the paper was to understand the steps the cities have taken to select the 10 solutions for replication. The information was collected through discussions, interviews and implementation plans developed by each city. It must be highlighted that each city’s circumstances differ in terms of political support, finances, technical expertise, and stakeholders’ interest, and this applies to all world cities when discussing the implementation of new efficient solutions. Cities across Europe and beyond may find themselves in a similar situation, and therefore, this paper also provides a story of the five Fellow Cities as they transition towards PEDs.

1. Introduction

Cities are the epicenters for climate mitigation strategies relating to energy, transport, buildings, industry, and agriculture [1]. While occupying only 2% of the total land, cities contribute 40% of the total energy consumption, constitute 70% of greenhouse gas emissions and about two-thirds of global energy demand [2,3,4]. Approximately 55% of the world’s population lives in urban areas at the moment, and this is expected to increase to 68% by 2050 [5,6]. The imperative role of cities in sustainability transitions is also stressed in the Sustainable Development Goal 11 that aims to “make cities inclusive, safe, resilient and sustainable”. The United Nations has adopted the ‘New Urban Agenda’ [4] and the European Union has implemented the 2016 Pact of Amsterdam to address societal challenges and include urban aspects in policies. Furthermore, the European Green Deal makes explicit references to cities to reach the European Union’s (EU) climate-neutral and circular transition objectives [3].
Nonetheless, tackling climate consequences is not the sole responsibility of the city authorities, but also lies with the citizens who act in the form of users, producers, consumers, and owners. A collective effort of citizens may have a huge impact on urban areas, associations, and homes, which will further boost climate transition, advance the economy, and preserve the environment [1,3].
Indeed, transforming the building stock, mobility systems, industries, and urban infrastructure will no doubt require heavy investment and an integrated approach across all sectors including housing, transportation, and energy systems, as well as employment, education, and other urban services. This will contribute to better well-being, business opportunities, and increased growth for all [3]. Evidence shows that the pace of urbanization will be most evident in low-income and lower-middle-income countries. Hence, focusing on the urban and rural poor, including vulnerable groups, must be incorporated in urban transformation and development processes [6].

1.1. Positive Energy Districts (PEDs)

The emerging trend of positive energy districts (PEDs) is a transition towards more conscious behavior that calls for extensive and innovative engagement approaches and co-creation practices [7,8]. The Smart Energy Transition (SET) Plan Action 3.2, JPI Urban Europe [9] and the EERA Joint Program [10] on Smart Cities describe PEDs as follows: “Energy-efficient and energy-flexible urban areas or groups of connected buildings producing net zero greenhouse gas emissions while also having an annual local or regional surplus production of renewable energy. PEDs require integration of various systems and infrastructures and interaction between buildings, users, and the regional energy, mobility, and ICT systems, while securing the energy supply and a good life for all in line with social, economic and environmental sustainability” [8]. The European Energy Research Alliance (EERA) classifies three categories of PEDs: PED autonomous, PED dynamic, and PED virtual [11,12].
In addition, Positive Energy Buildings or Plus Energy Buildings (PEBs) are also necessary in mitigating climate change. PEBs refer to energy-efficient buildings that ‘produce more energy than they consume’. However, the concept of PEB is quite difficult in terms of, for example, renewables, time span, emissions, and building type. Similar to PEDs, PEBs cannot be defined easily, and therefore there is a lack of technical solutions and business models to support the development [13].

1.2. Literature Review

Most of the existing PED projects are innovative experiments implemented at small scale. In order to respond to the ambitious climate goals, the key question is how to identify solutions that can be scaled up at wider scale and replicated in other cities [14]. The Smart City Information System (SCIS) defines the replication of PEDs as the possibility of transporting or ‘copying’ results from a pilot case to other geographical areas with potentially different boundary conditions [15]. In other words, if a pilot PED was demonstrated to work in one community or region, it could be exported to other communities or regions (indigenously or abroad), given that the boundary conditions could differ from those in the initial area. Replication may also be based on the management process that was used in the pilot scheme or the cooperation structure between critical stakeholders.
Between 2014–2019, 17 Lighthouse projects were funded under the European Commission Horizon smart city (EC-H2020-SCC) framework program. These projects involved altogether 46 Lighthouse cities that tested near-to-market energy, mobility and ICT technologies at district scale and 71 Fellow Cities that developed replication plans on selected Lighthouse city solutions [16]. A deeper look at the first projects of 2014 showed that the replication strategy had a rather mechanistic and unidirectional approach, where the Lighthouse cities direct the replication procedure with very little active decision-making by Fellow Cities. However, the projects funded later during this period had a more iterative or dynamic approach by: (1) involving the Fellow Cities since the start [17,18,19,20,21,22,23]; and (2) promoting knowledge exchange for Fellow Cities through workshops, thematic webinars, and interaction activities [24,25,26,27]. Despite this change, a few factors may be acting as an obstacle for replication on the higher level: (1) the lack of connection between the replicating technology and the local stakeholders’ interest; (2) business-as-usual approach and short term vision [28]; (3) unique city context; (4) regulations; and (5) the lack of commitment from politicians in realizing urban transformations [29]. Considering the above, Calzada [16] suggests a City-to-City Learning Program, which follows a social innovation perspective that considers the multiple stakeholders in a city (regardless of the city being a Lighthouse or a Fellow City), and also emphasizes how replication could be effectively facilitated through the city network’s multidirectional, radial, dynamic, iterative, and democratic learning process [30,31,32]. This idea is also supported by Bartels [33] and Calzada and Cobo [34], who claim that social innovation can play an active role in strengthening transformative change and support the learning trajectory for smart cities and their urban governance.
Summeren et al. [35] claims that collective generation, consumption, storage, management, and the trading of energy is needed for socio-technical change. However, in reality, many endeavors take the form of isolated events that do not contribute to energy transitions. There is little information on how replication occurs in practice and on the perspectives of actors involved. In their study, Summeren et al. [35] explore what replication of community-based Virtual Power Plant (cVPP) experiments look like in practice and how this can be achieved, emphasizing that ‘pure’ replication is not the way forward but instead, it is about the combination of processes that lead to wider diffusion. Nonetheless, there is little in-depth understanding of replication and little literature evidence on the topic [36,37]. Dialogues on replication of experiments remain mostly highly theoretical. There is little information regarding how replication happens in practice and what are the perspectives and ambitions of the participating actors [36,37,38]. This is particularly observed as an issue when looking at grassroots initiatives, which often do not strive for growth, diffusion, or system change, but are merely provide local solutions to local problems [39,40,41]. Rodriguez-Calvo et al. [42] studied the relevance of scaling-up and the replication of the impacts of the smart grid solution to address the gap between demonstration projects and widespread adoption of the smart grid. In addition, the study made use of scalability and replicability analysis (SRA) to understand what results may be expected when executing the smart grid use case at a larger scale or in different locations. Hearn [43] examined the potential of PEDs to reduce energy vulnerability. Garcia-Fuentes et al. [44] studied 41 European cities and their ability to replicate the REMOURBAN methodology for their Sustainable Urban Regeneration Model. Pulselli et al. [5] organized roadshows in 10 cities within and outside Europe as part of the EU City-zen project, in order to initiate energy transition. The roadshows engaged a group of experts in co-working activities and participative labs and also discussed energy design, urban design, and carbon accounting, making the approach highly visual, impactful, transferable, and multi-stakeholder friendly [5]. Talmar et al. [45] expanded upon Calzada [16] and introduced ‘embedded replication potential’, explained as the capacity of an original project to be either scaled up locally or replicated elsewhere. In addition, the authors formulated a checklist-based tool for assessing the embedded replication potential of a project, which can then be also used to assess the replication potential of other smart city projects. Sista and Giovanni [46] identified four key scalability factors for smart city logistics projects: economic, technical, stakeholder-related factors, as well as legislative and regulatory factors, all of which work together to achieve a full scale up. Paalosmaa and Shafie-khah [47] explored the most suitable mobility solutions to replicate in the City of Vaasa, as part of the IRIS project. Considering the city’s ambitious climate strategy, the vehicle-to-grid and second life battery schemes were identified as most replicable solutions for Vaasa. The energy optimization of buildings is also a fundamental aspect and this is a topic of continuous research. Baghoolizadeh et al. [48] showed 17–34% electricity cost savings by choosing a suitable solar shading and highlighting the role of the tilt angle of PV shading for cities located further away from the equator (distance increases the angle). Rasool et al. [49] explored the techno-reliability optimization framework to incorporate the impact of reliability constraints during the operation and planning phase of hybrid renewable energy system, while Reinert et al. [50] discuss a method to optimize and assess a sector-coupled, national energy system using dynamic Life Cycle Assessment (LCA).

1.3. Purpose of the Paper

This paper continues the research on the five cities of Maia (Portugal), Reykjavik (Iceland), Kifissia (Greece), Kladno (Czech Republic), and Lviv (Ukraine), that are a part of an ongoing Horizon 2020 smart city project Sustainable Energy Positive and Zero Carbon Communities (SPARCS) [51]. The SPARCS project has two Lighthouse cities (Espoo and Leipzig) and five Fellow Cities. Lighthouse cities, nominated once only, act as exemplars in various areas such as building energy efficiency, use of renewables, electric mobility, and ICT [52]. Fellow Cities are those that require technical competence to become a Lighthouse city. Participating as a Fellow City provides a valuable opportunity to possibly become a Lighthouse city in the future.
This study is a continuation paper from [53] that first assessed the overall energy situation within the five cities, local challenges and their capacity to adopt Positive Energy Districts (PEDs). This current paper will describe the 10 PED solutions that will be replicated in the five cities and the co-creation process that led to the selection of the 10 solutions. This is the first paper of its kind to describe the five cities’ replication efforts and in the process, showcases each city’s way of co-creation and thinking. Table 1 shows the city profile of each of the five cities.
The paper is structured as follows: Section 1 is the introduction to replication. Section 2 presents the approach and method adopted by each city to select relevant solutions. Section 3 presents the selected solutions, Section 4 provides the discussion and Section 5 is the conclusion of the paper.

2. Materials and Methods
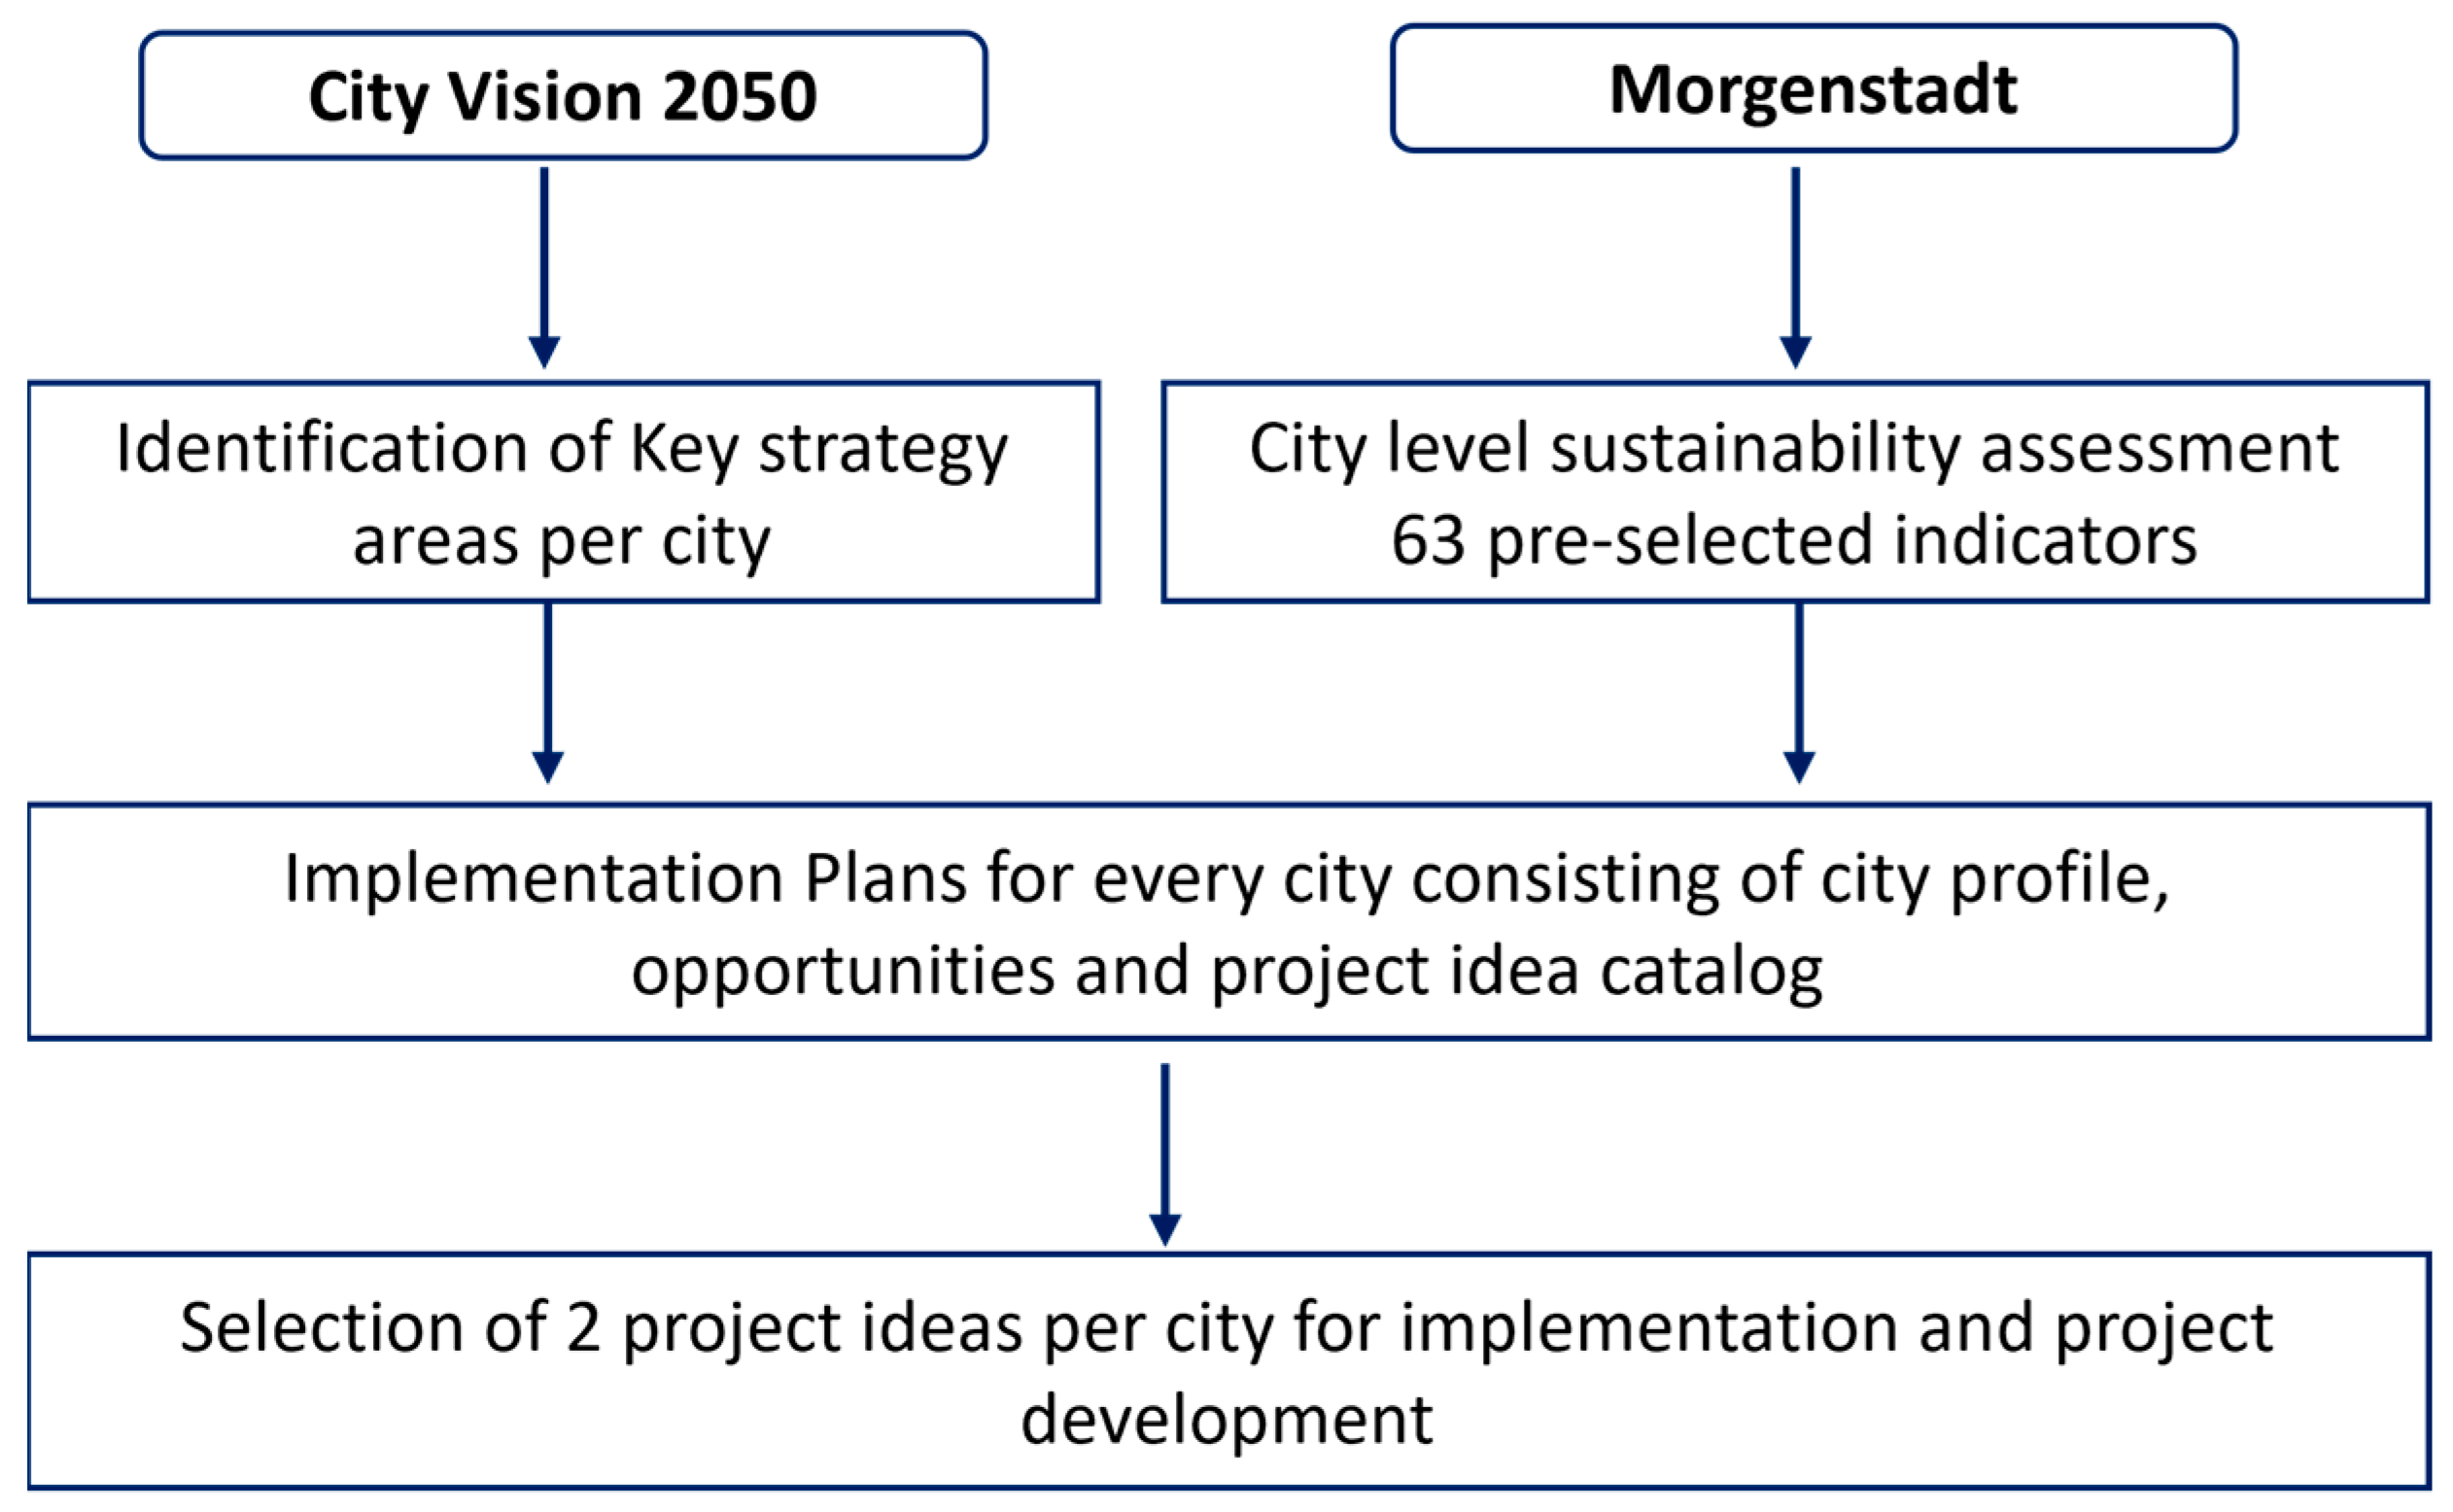
This section explains the many steps that helped and supported the cities to gain an understanding of their own city and be able to decide appropriate solutions to implement for the development of PEDs. The work spans over 24 months of the project and includes work done as part of City Vision 2050 and analysis through the Morgenstadt framework implemented by the German Institute for Applied Research Fraunhofer (Figure 1).

City Vision 2050

The City Vision 2050 covers the key strategic areas such as energy and mobility as well as any associated areas. It also involves policy makers, relevant stakeholders, citizens, and communities in developing a realistic vision [37]. A city vision asks what is the desired future? The city vision is the first step in starting transformation, usually defined by political leadership based on strong participatory processes. The city vision workshops were organized in all five cities of Maia, Reykjavik, Kifissia, Kladno, and Lviv, as well as the two Lighthouse cities during September–November 2020. The five cities, including the two Lighthouse cities, were provided with guidelines related to creating a schedule, forming a task force, selecting key strategic areas, and defining the status quo, setting up a participatory process and conducting the city vision workshops. Depending on the city, the city vision workshop duration could be one or two days. All five cities organized the city vision workshops in their local languages. Due to the pandemic, the workshops depended on the city situation whether a remote or a physical meeting suited them better. The cities will revise their vision throughout the project and beyond.

The Morgenstadt Framework in the SPARCS Project

The Morgenstadt framework was developed in 2011 by The Fraunhofer Institut for Industrial Engineering in collaboration with ten other Fraunhofer Research Institutes more than 10 municipal governments and industry partners as part of a research project. The framework consists of the City Lab Methodology that explores sustainable urban development and has been undergoing continuous adaptation and refinement to adapt it to each specific context. A full description of the method is explained by Radecki [54]. The method has been applied in several cases across Europe, Asia, and South America, including cities such as Lisbon (Portugal) [55], Coimbatore (India) [56], and Joinville (Brazil) [57]. The Morgenstadt Model is structured into three levels of analysis:
  • Key performance indicators (quantitative analysis);
  • Action fields (qualitative analysis);
  • Impact factors (qualitative analysis).
The analysis of this information showed the status quo inventory of the specific city highlighting its opportunities but also its challenges. It also answers the question: “What is the sustainability performance of the city?” Additionally, it informed about the type of data available at the city level and helped in gaining insights into the city’s challenges, plans, and opportunities.
The impact factors are related to city-specific drivers and barriers, which may be connected to for example, cultural, economic, or climatic characteristics. Impact factors thus widen the framework and adjust it according to each city’s profile.
The SPARCS project concentrates on energy and related mobility, therefore only relevant indicators and actions fields were extracted from the original framework. The responsible replication leaders provided feedback on the selected model and detailed filtering was conducted to make sure cities have access to the required data. Alongside this effort, the indicator benchmarks were cross checked and updated where needed. International indexes were also analyzed to determine reference benchmarks for the custom framework. The framework adaptation process consisted of intensive research and expert working sessions that started in September 2019 after the project began and ended in early 2021, after the collection of all relevant data. Table 2 shows an overview of the customized project framework.
All the information obtained in the process gave an understanding of the baseline sustainability city performance and resulted in an individual city profile. The process simultaneously respected the impact factors of the city such as socio-cultural dynamics or geographical location. All the information generated in this process was crucial for the co-creation sessions with key stakeholders described below. The assessment process is outlined below (Figure 2).
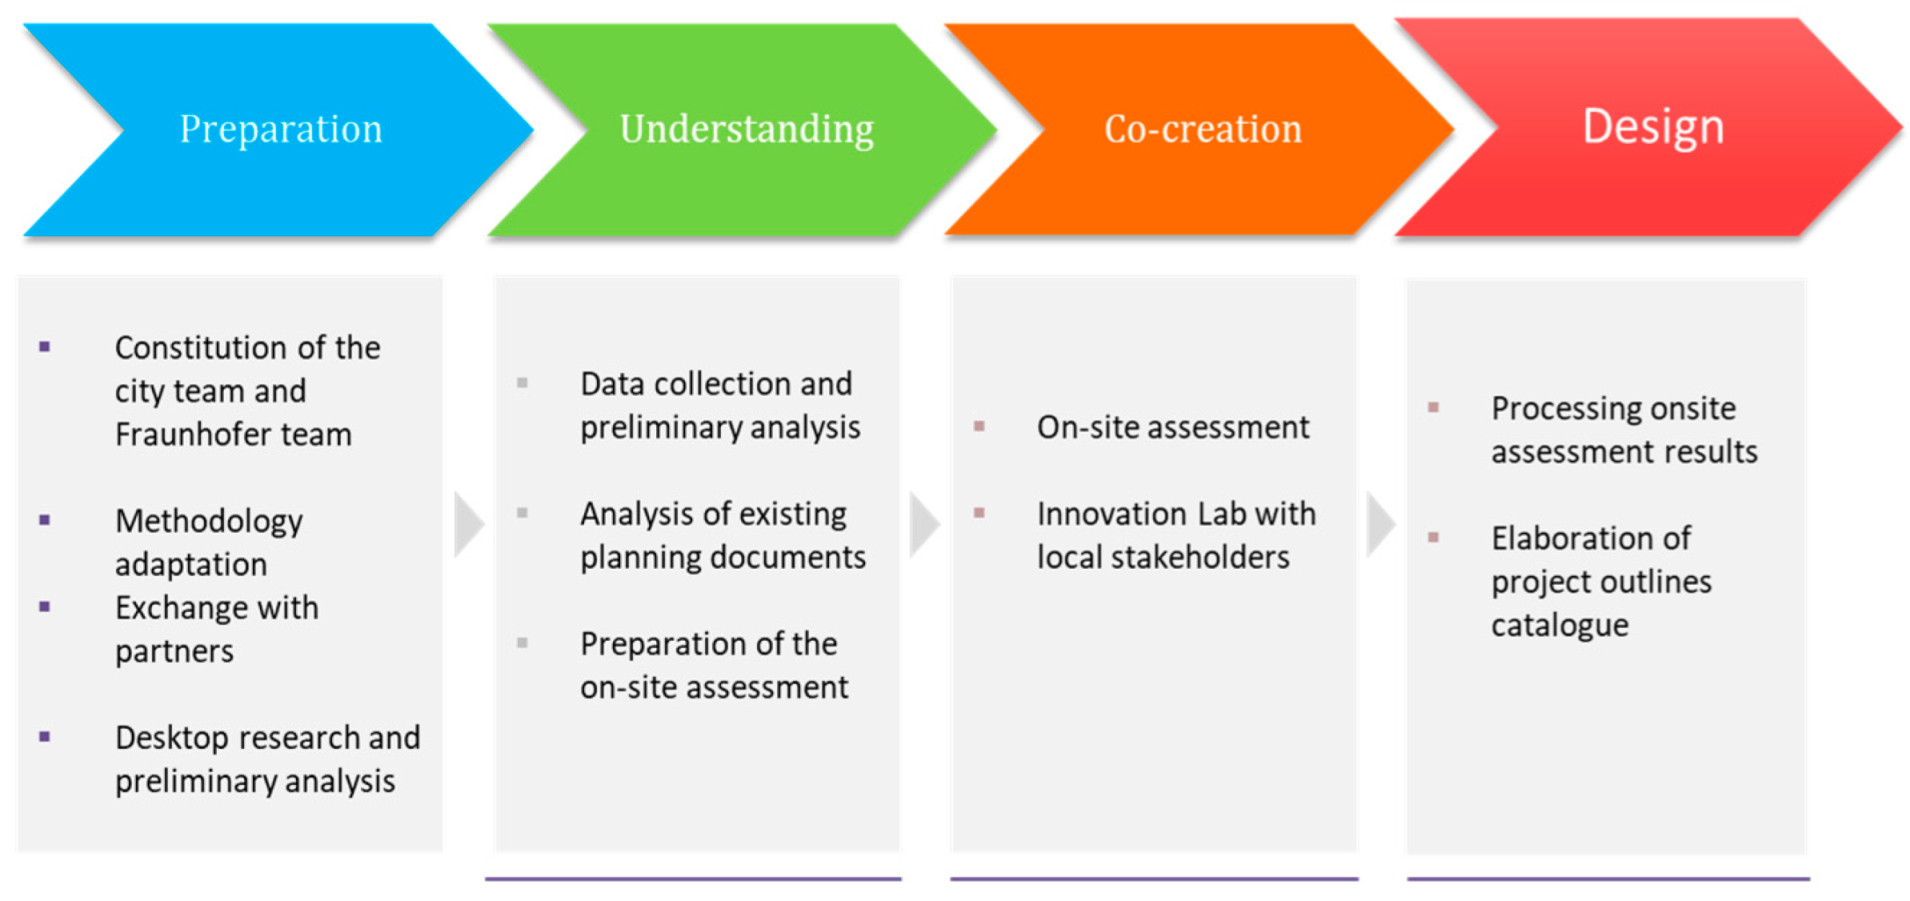
  • The understanding phase included the collection and analysis of strategic documents relevant to the energy and mobility sector. Further the defined indicators and action fields were collected by the cities. Any gaps in the information were communicated and discussed with city team. This formed the basis of the city profile.
  • The co-creation phase was defined by the onsite assessment, which due to the pandemic, had to be online. The biggest aim of this phase was the joint development of project ideas, which was carried out in collaboration with local experts via co-creative sessions. In the online format the interviews were via the Teams software and other tools such as online maps to identify possible locations for project implementations, Power Point presentations to draft the project ideas, and documentaries or videos to virtually visit and get to know the city in more detail. Guided by the Fraunhofer research team, each city arranged the interviews with key city stakeholders. In the process, it was extremely important to talk with a great variety of citizens and experts to cover all relevant areas. The interviewees where representants from the relevant departments at the city administration, but also universities, citizens associations, private and public companies, service providers, etc. During the sessions, the different tools used allowed for a fast idea development, and at the end the results obtained were as good as in other city labs carried out live during past projects. The process proved to be extremely successful and led to the co-creation of more than 10 project ideas in each city. A selection of them was then discussed and analyzed in detail during the innovation workshop. This exchange aimed to validate and further develop the selected ideas together with the stakeholders.
  • The data collected during the interviews and workshops was compiled and formatted to create Implementation Plans for each of the cities [58,59,60,61,62] that describe concrete project ideas inspired by the Lighthouse cities.
As part of the design phase, the project outlines went through some filtering in order to be able to select the projects for a detailed work. The project ideas in each city were analyzed through the categories listed below (Table 3).
It is out of the scope of this paper to describe the full sustainability assessment for each of the five cities. However, an example of the results obtained from City of Reykjavik is shown in Appendix A. A complete analysis of the cities including the full list of project outlines can be found here [58,59,60,61,62]. Nonetheless, the next section indeed provides a brief overview of the assessments and focuses on the project ideas obtained with the help of both the City Vision and the Morgenstadt framework.

3. Results

The five Fellow Cities were involved in rigorous efforts during the first 24 months of the project to discover and understand which solutions could benefit them in terms of energy transition and be aligned with SPARCS objectives and consequently, a successful implementation and replication of PED solutions.
The City Vision 2050 workshops supported the efforts to understand the priority areas for each city. Table 4 highlights the key areas for each city based on the workshops [63].
The City Lab process described in the section above resulted in further understanding of the city and identified several potential solutions per city: Maia (35), Reykjavik (26), Kladno (28), Kifissia (29), and Lviv (8). All these ideas are relevant and valid for the sustainable city development and are being considered in the ongoing city planning. The filtering process leading to the selection of only two projects per city was needed in order to perform the project development activities as defined within the SPARCS project agreement.

3.1. Maia

The sustainability assessment revealed that Maia has several Smart City initiatives to support the efforts of energy transition such as a Living Lab: Maia Net Zero Carbon City aiming at decarbonisation through the integration of different solutions. In addition, Maia has concrete strategic plans that consist of, for example, the Sustainability Strategy established in 2013, Action Plan for Urban Regeneration (2016), and Climate Adaptation Action Plan (2020) focusing on several city wide topics such as public awareness and urban development. The collected indicators showed a relatively high value of housing ownership that might be an opportunity for the city to implement big energy efficiency projects. With regard to energy, 42% is consumed by industry while transport accounts for 38%. The share of electricity demand generated by renewables is 45%. The municipality has plans to continuously encourage installation of solar panels on buildings specifically during building refurbishment. Glancing at the mobility sector revealed that the car is used for majority of the time (74%) while public transport is used for school or home trips.
The onsite assessment was arranged virtually during November 2020 and May 2021. Interviews were held with city managers, industries, SMEs, and actors of the main key strategic areas that were included in the City Vision Workshop. The group developed 35 possible project ideas during the co-creating sessions together with 30 experts. Later in May 2021, with the help of the project filtering tool, the list was narrowed down to five project ideas.
  • Improve the Competitiveness of the Public Transport System;
  • Integration of New Local Eco-Neighborhoods;
  • Pilot a Smart Grid and VPP at City District, considering an energy community;
  • City Digital Transformation;
  • Smart Waste Heat Valorization.

3.2. Reykjavik

The Reykjavik Green Deal and Climate Action Plan 2021–2025 are the main two strategies for the city. The city has several policies that support the energy efforts such as the Reykjavik Municipal (Master) Plan 2040 that received approval by the city council and the National Planning Agency in January 2022. It defines the priorities for development for the next two decades. Amongst the many other strategies, the most recent is Reykjavik being selected as a member city of the EU Mission 100 Carbon Neutral and Smart Cities which further supports innovation efforts for climate mitigation.
The virtual onsite assessment was held in September 2020. A total of twenty-five interviews were held with interviewees from various fields of practice: public sector, technology companies, service providers, universities, and logistics representatives. The originally planned site visits were replaced by video presentations and documentaries, use of Google Earth, online meetings, and workshops. A total of 26 project ideas were initially developed and filtered down to ten ideas during the final workshop in April 2021. A voting session was held at the end of the workshop to further filter the projects. The ten initial project ideas were as follows:
  • Mobility Hub;
  • Expanding EV charging network;
  • Green Blocks;
  • Reykjavik turns green app/smart transport app;
  • Showcase for energy efficiency;
  • Reykjavik Environmental Zones;
  • Pilot Smart Grid Project at Mobility Hub;
  • Park and Ride stations;
  • Autonomous Shuttles;
  • Car-pooling program.

3.3. Kladno

Kladno currently has three key strategic documents: 1. Sustainable Energy and Climate Action Plan Kladno (SECAP Kladno) (2021); 2. Sustainable Urban Mobility Plan of Kladno (SUMP Kladno) (2022); and 3. Sustainable Development Strategy (SDS) (2021) projecting the future until 2050. As in the case of Maia, the city of Kladno also has a high homeownership with 83% of residents over 25 years are homeowners. With regard to energy, only 4.75% of the electricity demand is produced by renewable sources. In addition, the use of public transport is very low (four trips compared to the global average of 200–400 trips).
During the virtual onsite assessment in April 2021, a total of 30 project ideas were developed with the help of 40 representatives. Kladno arranged several thematic sessions, such as circular economy, digital and smart city and public services, water management, and PEDs. An extra session in the form of a business roundtable attracted stakeholders from beyond Kladno city, including banks and financing institutions and provided realistic feedback on the project pre-selection. The project ideas also supported Kladno’s SECAP. The 30 project ideas were narrowed down to eight with the help of 35 representatives of the city and industry:
  • Public Retrofit and photovoltaic systems;
  • Energy from waste;
  • Smart Parking Management;
  • Mobility Hubs and Kladno Stations;
  • Charging and sharing eVehicles;
  • Smart Regulation;
  • Smart Metering Public facilities;
  • Urban Data Platform and Smart Applications.

3.4. Kifissia

The city’s efforts for climate neutrality are supported through for example the Sustainable Urban Mobility plan, SEAP, EV charging plan, and a waste management plan. New changes in laws are connected to building energy efficiency, the use of ground source energy, energy communities and installation of photovoltaics. The municipality owns less than 1% of the real estate which means working with the building owners is critical. Petrol or gas is main source of energy for households for heating while electricity is used for cooling. Solar panels are used in households, mostly for water heating, however this usually has many funding issues. At the moment, there is no centralized district heating network in the city. Moreover, private vehicles are used for most of the time (72%) while only 12% prefer walking and only 4% use bikes.
As in the other cities, the onsite assessment in Kifissia was organized online due to the COVID-19 restrictions. A total of 29 project ideas were developed during February and March 2021 sessions. In addition, 10 interviews were held with representatives from city’s environment and waste department and also the deputy mayor.
During the final innovation workshop, representatives from the municipality, citizens, engineers and experts in mobility and urban planning participated. Given the limited time, six out of the 29 solutions were selected to be discussed in detail on the day of the workshop. The selected project ideas were:
  • Bike sharing system;
  • Municipal E-busses;
  • Super blocks;
  • Energy community;
  • Waste to energy plant;
  • Energy refurbishment of private houses.

3.5. Lviv

The city level assessment revealed that Lviv is a hub for IT industry, accounting for 20.3% to Lviv’s economy. Current issues are related to air quality, traffic congestion, limited green space, land, and water resources. The creation of the Ministry of Digital Transformation of Ukraine in 2019, as a specialized central body of the executive power, provided a significant boost in the development of the implementation of information technologies in the field of public administration and e-governance. Amongst several other initiatives in 2018 the city signed a memorandum regarding the transition to 100% use of renewables in the city’s energy balance by 2050. In 2020, the Strategic Plan of “Green City” measures for the city of Lviv was approved that prioritizes solid waste, water resources, transport, energy in buildings, and the use of land resources. Approximately, 95% of the dwellings in the city are private apartments and various energy saving programs have been launched by the city, such as thermal energy consumption metering and an automatic weather adjustment system. Moreover, the city uses electric power for some of the transport fleet and 50% of the city residents use public transportation every day.
The onsite assessment for Lviv was carried out online due to the pandemic restrictions. A total of nine projects ideas were developed, however, some of the ideas had to be changed due to the ongoing crisis within the country.
  • Spatial Energy Plan;
  • Smart metering and data sharing;
  • Automated energy monitoring in homes;
  • Participatory PED ecosystem;
  • Thermal rehabilitation of buildings;
  • RES integration in the business sector;
  • Optimizing public transport;
  • City train development;
  • Extension of the tram and trolley network.
Based on the project objectives and having a practical approach, the cities selected two final projects that they could implement through project development (included as a task within the project). The cities were encouraged to select those projects where local stakeholders had demonstrated interest, with potential for political back-up, had possibility to access funding if needed, and could be initiated in less than three years. For the cities, it was important to have the projects aligned with their strategies and agendas, but to also demonstrate the results that such a broad European project could have in the city. The list of selected project ideas (two per city) is provided in Table 5.

4. Discussion

Research evidence shows that many PED projects are still in very early phases, thus there is no reliable source of reference, as highlighted by several previous studies [12,64,65]. It is known that PEDs demand a thorough understanding of the cities’ strategies and resources [66]. Additionally, it has to be acknowledged that cities are unique in nature [12,67] and each has contrasting situations in terms of governance, stakeholders and support mechanisms [3]. As highlighted in the first study of the five cities [53], it is unfair to expect cities will tackle all of their local challenges during the project. Nonetheless, as claimed by several earlier studies, most city challenges circle around governance, technology, funding and community interest [7,64,65,68,69].
This paper looked at the starting phase of the replication process in the five Fellow Cities of Maia, Reykjavik, Kladno, Kifissia, and Lviv, inspired by work being carried out in the two Lighthouse cities of Espoo and Leipzig. The five cities immersed themselves into intensive discussions during the past two years with regard to what is the best solution for municipality. This is evidence of co-creation on a large scale and leads to understanding of aspects that could otherwise remain hidden. The paper is a continuation of the first paper that studied the local conditions in the five cities, including but not limited to knowledge gaps, such as smart mobility and e-governance. The previous paper also studied local challenges across various sectors such as governance, technology, financial, and social factors [53].
The City Vision 2050 may be considered as the first step boosting urban transformation efforts. It will be continuously revised and thus acts as a baseline. With the help of the City Vision 2050, the cities distinguished key strategy areas to work upon in the coming years (Table 4). This supported the City Lab methodology to be implemented later. Mobility was marked as a key area in all five cities. Green energy was chosen by all cities, except for Reykjavik as the city is a pioneer in renewables. The other areas including efficient buildings, spatial development, and digital services also received substantial focus.
With support of the City Vision 2050 and City Lab methodology, local stakeholders, such as utility and transportation companies, were able to come together and discuss their opinions about the most appropriate solution in terms of regulations, funding potential, political support, alignment with city strategy, and the existing level of stakeholder engagement, and shed light on those projects that can be implemented within three years. In addition, the City Lab provided valuable insights into the drivers, barriers, and opportunities within the city, producing a catalog of potential solutions while connecting these to the overall project objectives. As explained earlier, the onsite assessments were carried out online because of the pandemic restrictions, which caused the groups to have quite lengthy online discussions. It was also necessary to repeat the instructions regularly so that all participants understood the process. This could have led to a certain degree to demotivation and stress among the participants. Nonetheless, the cities worked to the best of their abilities to complete the necessary steps which would help in deciding the most appropriate solutions.
With regard to how to develop the selected projects further, specific project partners had a deep exchange with all the SCC1 projects to understand better their process for replication as well as the tools and methods used to support it. All learnings were put together in a toolkit that outlines the whole process and questions that need to be answered to progressively develop a strong project concept and move forward towards implementation. This also led to the idea of assigning one person that follows the process with the city to provide advice and bring other experiences and support as needed, especially at the early stages. Nonetheless, the five cities were given freedom to choose the two projects they wanted to focus on and develop further.
It is notable that when selecting the final two projects, none of the Fellow Cities prioritized the PED. Instead, the cities prioritized city wide topics in green mobility (e.g., Reykjavik, Kladno, and Kifissia) or selected specific projects more or less relevant to PED implementation, e.g., community/decentralized energy projects (all cities). Three cities (Kladno, Maia, and Lviv) however, decided to work on their PED concepts together with their local technical partners. This signifies that PED is perceived as a complex umbrella project requiring more long term local collaboration. It also places an emphasis on the fact that it is necessary for cities to show smaller quick wins to gain the interest and attention of politicians and stakeholders. However, PED concept is appealing to the cities sufficiently enough in order to devote extra capacity for the PED design. This emphasizes that the technical support partners play an important role of being a PED driver here, which further implies that the cities are dependent on the available technical expertise and must plan the solutions around such technical skills, instead of aiming for other ideal solutions for which there is no personnel and technical capacity. In addition, it is also possible that PEDs were not immediately chosen because of the high complexity of the concept and less understanding of benefits among decision-makers, the perception of high risk with regard to technical feasibility (e.g., the feasibility of achieving the energy positive balance), and the prioritization of projects with higher expected return on investment.
Moreover, it is also evident that the cities prioritized projects that had some momentum with the local technical partners. Additionally, preliminary findings from the local PED concept feasibility assessments in Kladno and Maia show that while it is possible to reach positive balance in particular building setting, other economic performance indicators point towards municipal preference of wider building portfolios that together do not necessarily deliver positive balance of renewable energy.
The final two projects per city will be practically detailed and planned together with a project partner. The goal of this step is to support the Fellow Cities to bridge the gap between writing the Implementation Plans here [58,59,60,61,62] and starting with implementations. The project development steps include four stages: 1. initial scoping to guide the cities; 2. market consultation to find out more about the technology and funding options; 3. detailed planning to finalize the scope and business model; and 4. securing investment to attract stakeholders and calculate return on investment.
As claimed by Heijden [14], the key question is how to scale up the solutions. This is addressed in this paper with the help of the City of Vision and City Lab methodologies. The five cities had continuous help and support from within the consortium as is necessary for any replication activity, such as being involved in the project since the start [17,18,19,20,21,22,23] or participating in regular interaction activities to make sure no city is left on their own [24,25,26,27]. As the project focus was more towards energy and mobility, other aspects such as social innovation [33] were not included as a possible idea for the future.
Nonetheless, this paper is the answer to the identified gaps in the current literature regarding 1. There is little in-depth understanding and little literature evidence on the topic [36,37]; 2. dialogues on replication are only theoretical; and 3. there is little information regarding how replication actually happens in practice and what are the perspectives of the actors [36,37,38]. This paper provides the real and practical way forward to replication not only with support of City Vision and City Lab but also by putting the selected ideas into practice with the help of project development of each idea.

5. Conclusions

This paper provides evidence on how to start replication in smart cities. While acknowledging that each city profile is different, the five cities are committed to climate neutrality and are actively engaging in activities to further support the two solutions to be soon implemented within their city. The collaborative work assisted in gaining a full understanding of the local context and connecting this to the visions to draft solutions inspired by the work being done in the Lighthouse cities (Espoo and Leipzig).
The city profiles elaborated during the City Labs provided the scientific basis and gave a clear idea of the main challenges and opportunities in the five cities. The co-creation sessions with key stakeholders then allowed to design solutions specifically adapted to the respective context initiating major urban transformations and building synergies with ongoing and future city projects.
It is hoped that this paper proves to be a beneficial reference point for other cities have plans to begin their PED journey. This paper extracted essential highlights from the project ideas developed by each of the five cities as full sustainability assessments were not possible to include here. Future research will analyze how each of the 10 solutions developed into full scale projects and to what extent the cities have the potential to become pioneering Lighthouse cities.

Author Contributions

Conceptualization, Z.F.; methodology, Z.F. and M.P.; writing—original draft preparation, Z.F., G.S., and N.E.; writing—review and editing, M.P., M.K., and A.H. All authors have read and agreed to the published version of the manuscript.

Funding

This research was funded by SPARCS and the APC was waived. SPARCS project has received funding from the European Union’s Horizon 2020 research and innovation programme under Grant Agreement No. 864242. The sole responsibility for the content of this publication lies with the authors. It does not necessarily reflect the opinion of the European Communities. The European Commission is not responsible for any use that may be made of the information contained therein.

Data Availability Statement

Not applicable.

Acknowledgments

We are grateful to the representatives of the SPARCS Fellow Cities for their continuous support in providing information.

Conflicts of Interest

The authors declare no conflict of interest.

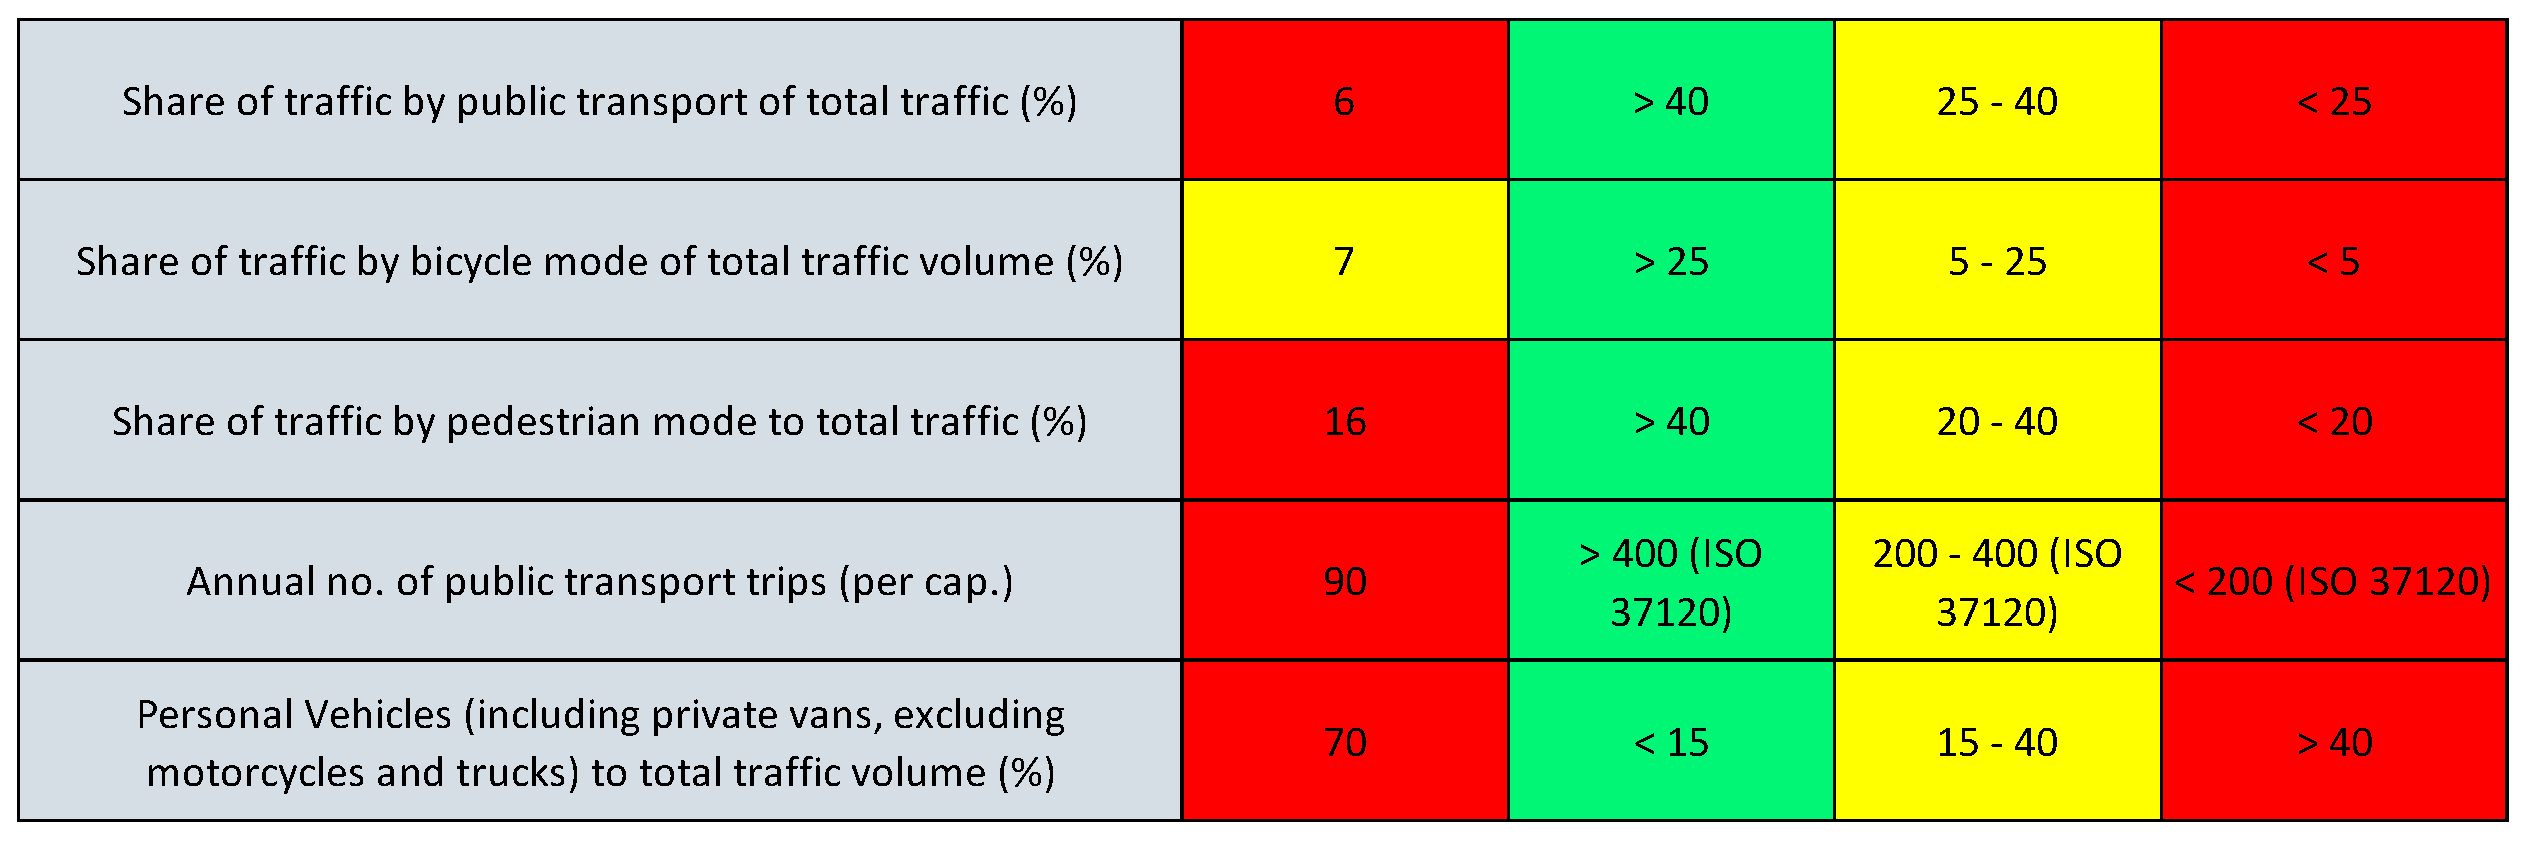
Appendix A. Sample of City Assessment Results from City of Reykjavik

Figure A1. Sample of economy and governance assessed indicators adapted for the project from Morgenstadt.
Smartcities 06 00001 g0a1
Figure A2. Sample of assessed energy indicators adapted for the project from Morgenstadt.
Smartcities 06 00001 g0a2
Figure A3. Sample of assessed mobility indicators adapted for the project from Morgenstadt.
Smartcities 06 00001 g0a3

References

  1. European Commission. Report of the Mission Board for Climate-Neutral and Smart Cities. In Proposed Mission: 100 Climate-Neutral Cities by 2030-by and for the Citizens; European Commission: Brussels, Belgium, 2020. [Google Scholar] [CrossRef]
  2. Amores, A.; Álvarez, L.; Chico, J.; Ramajo, I.; Urgel, J.M. The Future of Sustainable Cities: Urban Energy Transition to 2030. Explore the Future of Sustainable Cities and Their Role in the Energy Transition in Spain. 2019. Available online: https://www2.deloitte.com/global/en/pages/energy-and-resources/articles/future-of-sustainable-cities-urban-energy-transition-to-2030.html (accessed on 2 October 2020).
  3. OECD. Managing Environmental and Energy Transitions for Regions and Cities; OECD: Paris, France, 2020. [Google Scholar] [CrossRef]
  4. The United Nations. The New Urban Agenda; The United Nations: San Francisco, CA, USA, 2016; Available online: https://habitat3.org/the-new-urban-agenda/ (accessed on 5 July 2022).
  5. Pulselli, R.M.; Broersma, S.; Martin, C.L.; Keeffe, G.; Bastianoni, S.; van den Dobbelsteen, A. Future city visions. The energy transition towards carbon-neutrality: Lessons learned from the case of Roeselare, Belgium. Renew. Sustain. Energy Rev. 2021, 137, 110612. [Google Scholar] [CrossRef]
  6. UN. Department of Economic and Social Affairs, 68% of the World Population Projected to Live in Urban Areas by 2050, Says UN. 2018. Available online: https://www.un.org/development/desa/en/news/population/2018-revision-of-world-urbanization-prospects.html#:~:text=Today%2C55%25oftheworld’s,increaseto68%25by2050 (accessed on 5 July 2022).
  7. Bossi, S.; Gollner, C.; Theierling, S. Towards 100 Positive Energy Districts in Europe: Preliminary Data Analysis of 61 European Cases. Energies 2020, 13, 6083. [Google Scholar] [CrossRef]
  8. JPI-Urban Europe/SET-Plan Action 3.2, White paper on PED Reference Framework White Paper on Reference Framework for Positive Energy Districts and Neighbourhoods. JPI Urban Europe. 2020, pp. 1–22. Available online: https://jpi-urbaneurope.eu/ped/ (accessed on 5 July 2022).
  9. JPI Urban Europe. Available online: https://jpi-urbaneurope.eu/ (accessed on 5 July 2022).
  10. EERA. EERA European Energy Research Alliance. Available online: https://www.eera-set.eu/research/joint-programmes.html (accessed on 5 July 2022).
  11. Wyckmans, A.; Karatzoudi, K.; Brigg, D. D9.5: Report on attendance at events held by other SCC-01 co-ordinators 2. In +CityxChange: Positive City ExChange; Norwegian University of Science and Technology: Trondheim, Norway, 2018. [Google Scholar]
  12. Lindholm, O.; Rehman, H.; Reda, F. Positioning Positive Energy Districts in European Cities. Buildings 2021, 11, 19. [Google Scholar] [CrossRef]
  13. Lavikka, R. Positive Energy Buildings—Concepts, Challenges and Opportunities. 2022. Available online: https://link.springer.com/book/10.1007/978-3-030-87702-6 (accessed on 30 May 2022).
  14. van der Heijden, J. Sustainable and Climate Resilient Cities? Stop Experimenting, Start Scaling. Building Cities 2021. Available online: https://www.buildingsandcities.org/insights/commentaries/cop26-scaling.html (accessed on 28 October 2022).
  15. Ferrer, J.N.; Taranic, I.; Veum, K.; van den Oosterkamp, P.; Wilson, C. The Making of a Smart City: Replication and Scale-Up of Innovation in Europe. 2017. Available online: https://smart-cities-marketplace.ec.europa.eu/insights/publications/making-smart-city-replication-and-scale-innovation-europe (accessed on 30 July 2022).
  16. Calzada, I. Replicating Smart Cities: The City-to-City Learning Programme in the Replicate EC-H2020-SCC Project. Smart Cities 2020, 3, 978–1003. [Google Scholar] [CrossRef]
  17. CityxChange. Available online: https://cityxchange.eu/demo-projects/ (accessed on 15 August 2022).
  18. RUGGEDISED. Available online: https://ruggedised.eu/project/about/ (accessed on 15 August 2022).
  19. Stardust. Available online: http://stardustproject.eu/all-cities/ (accessed on 15 August 2022).
  20. SPARCS. Available online: https://www.sparcs.info/about (accessed on 15 August 2022).
  21. Smarter Together. Available online: https://energy-cities.eu/project/smarter-together/#:~:text=SmarterTogetherisaSmartCitiesprojectsupported,asthetwo“observer”citiesKievandYokohama (accessed on 15 August 2022).
  22. Sharing Cities. Available online: https://sharingcities.eu/ (accessed on 15 August 2022).
  23. My Smart Life. Available online: https://www.mysmartlife.eu/mysmartlife/ (accessed on 15 August 2022).
  24. SmartenCity. Available online: https://smartencity.eu/news/detail/?rx_call=124 (accessed on 15 August 2022).
  25. MatchUp. Available online: https://www.matchup-project.eu (accessed on 15 August 2022).
  26. IRIS. Available online: https://irissmartcities.eu/system/files/private/irissmartcities/d1.7_transition_strategy_commissioning_plan_for_the_demonstration_replication_v1.2.pdf (accessed on 15 August 2022).
  27. Making City. Available online: http://makingcity.eu/city-profiles (accessed on 15 August 2022).
  28. Timeus, K.; Vinaixa, J.; Pardo-Bosch, F. Creating business models for smart cities: A practical framework. Public Manag. Rev. 2020, 22, 726–745. [Google Scholar] [CrossRef] [Green Version]
  29. Vandevyvere, H. Why May Replication (Not) be Happening. Recommendations on EU R&I and Regulatory Policies, SCIS Policy Anal. 2018. Available online: https://smartcities-infosystem.eu/newsroom/news/scis-policy-analysis—Why-may-replication-not-be-happening (accessed on 15 August 2022).
  30. Potjer, S.; Hajer, M. Learning with Cities, Learning for Cities: The Golden Opportunity of the Urban Agenda for the EU. 2017. Available online: www.uu.nl/ufs%0A (accessed on 15 August 2022).
  31. Barns, S. Platform Urbanism: Negotiating Platform Ecosystems in Connected Cities (Geographies of Media); Springer Nature: Berlin, Germany, 2020. [Google Scholar]
  32. Grimm, R.; Fox, C.; Baines, S.; Albertson, K. Social innovation, an answer to contemporary societal challenges? Locating the concept in theory and practice. Eur. J. Soc. Sci. Res. 2013, 26, 436–455. [Google Scholar] [CrossRef]
  33. Bartels, K. Transforming the relational dynamics of urban governance: How social innovation research can create a trajectory for learning and change. Urban Stud. 2020, 57, 2868–2884. [Google Scholar] [CrossRef]
  34. Calzada, I.; Cobo, C. Unplugging: Deconstructing the Smart City. J. Urban Technol. 2015, 22, 23–43. [Google Scholar] [CrossRef]
  35. van Summeren, L.F.; Breukers, S.; Wieczorek, A.J. Together we’re smart! Flemish and Dutch energy communities’ replication strategies in smart grid experiments. Energy Res. Soc. Sci. 2022, 89, 102643. [Google Scholar] [CrossRef]
  36. Sengers, F.; Turnheim, B.; Berkhout, F. Beyond experiments: Embedding outcomes in climate governance. Environ. Plan. C Politi-Space 2020, 39, 1148–1171. [Google Scholar] [CrossRef]
  37. Von Wirth, T.; Fuenfschilling, L.; Frantzeskaki, N.; Coenen, L. Impacts of urban living labs on sustainability transitions: Mechanisms and strategies for systemic change through experimentation. Eur. Plan. Stud. 2018, 27, 229–257. [Google Scholar] [CrossRef]
  38. Van den Bosch, S.; Rotmans, J. Deepening, Broadening and Scaling up: A Framework for Steering Transition Experiments; Knowledge Centre for Sustainable System Innovations and Transitions (KCT): Rotterdam, The Netherlands, 2008. [Google Scholar]
  39. Hargreaves, T.; Hielscher, S.; Seyfang, G.; Smith, A. Grassroots innovations in community energy: The role of intermediaries in niche development. Glob. Environ. Chang. 2013, 23, 868–880. [Google Scholar] [CrossRef] [Green Version]
  40. Ruggiero, S.; Martiskainen, M.; Onkila, T. Understanding the scaling-up of community energy niches through strategic niche management theory: Insights from Finland. J. Clean. Prod. 2018, 170, 581–590. [Google Scholar] [CrossRef]
  41. Seyfang, G.; Hielscher, S.; Hargreaves, T.; Martiskainen, M.; Smith, A. A grassroots sustainable energy niche? Reflections on community energy in the UK. Environ. Innov. Soc. Transitions 2014, 13, 21–44. [Google Scholar] [CrossRef]
  42. Rodriguez-Calvo, A.; Cossent, R.; Frías, P. Scalability and replicability analysis of large-scale smart grid implementations: Approaches and proposals in Europe. Renew. Sustain. Energy Rev. 2018, 93, 1–15. [Google Scholar] [CrossRef]
  43. Hearn, A.X. Positive energy district stakeholder perceptions and measures for energy vulnerability mitigation. Appl. Energy 2022, 322, 119477. [Google Scholar] [CrossRef]
  44. García-Fuentes, M.; Quijano, A.; de Torre, C.; García, R.; Compere, P.; Degard, C.; Tomé, I. European Cities Characterization as Basis towards the Replication of a Smart and Sustainable Urban Regeneration Model. Energy Procedia 2017, 111, 836–845. [Google Scholar] [CrossRef]
  45. Talmar, M.; Romme, A.G.L.; Valkenburg, R. Enhancing the Replication Potential of Smart Lighting Projects. Smart Cities 2022, 5, 608–632. [Google Scholar] [CrossRef]
  46. Sista, E.; De Giovanni, P. Scaling Up Smart City Logistics Projects: The Case of the Smooth Project. Smart Cities 2021, 4, 1337–1365. [Google Scholar] [CrossRef]
  47. Paalosmaa, T.; Shafie-Khah, M. Feasibility of Innovative Smart Mobility Solutions: A Case Study for Vaasa. World Electr. Veh. J. 2021, 12, 188. [Google Scholar] [CrossRef]
  48. Baghoolizadeh, M.; Nadooshan, A.A.; Raisi, A.; Malekshah, E.H. The effect of photovoltaic shading with ideal tilt angle on the energy cost optimization of a building model in European cities. Energy Sustain. Dev. 2022, 71, 505–516. [Google Scholar] [CrossRef]
  49. Rasool, M.H.; Perwez, U.; Qadir, Z.; Ali, S.M.H. Scenario-based techno-reliability optimization of an off-grid hybrid renewable energy system: A multi-city study framework. Sustain. Energy Technol. Assess. 2022, 53, 102411. [Google Scholar] [CrossRef]
  50. Reinert, C.; Deutz, S.; Minten, H.; Dörpinghaus, L.; von Pfingsten, S.; Baumgärtner, N.; Bardow, A. Environmental impacts of the future German energy system from integrated energy systems optimization and dynamic life cycle assessment. Comput. Chem. Eng. 2021, 153, 107406. [Google Scholar] [CrossRef]
  51. SPARCS, H2020 SPARCS Project. Available online: https://www.sparcs.info/ (accessed on 5 October 2022).
  52. EU Commission. Smart Cities and Communities Lighthouse Projects. 2016. Available online: https://cordis.europa.eu/programme/id/H2020_SCC-1-2016-2017 (accessed on 5 October 2022).
  53. Fatima, Z.; Vacha, T.; Swamygowda, K.; Qubailat, R. Getting Started with Positive Energy Districts: Experience until Now from Maia, Reykjavik, Kifissia, Kladno and Lviv. Sustainability 2022, 14, 5799. [Google Scholar] [CrossRef]
  54. von Radecki, A. Transformationsmodell Für Nachhaltige Stadtsysteme: Entwicklung Und Erprobung Eines Systemischen Technologiemanagementansatzes Für Städte; Fraunhofer Verlag: Stuttgart, Germany, 2019. [Google Scholar]
  55. Wendt, W.; Padilla, M.; Fanderl, N.; Hawxwell, T. City Lab Lisbon; Hg. v. Fraunhofer IAO: Stuttgart, Germany, 2016. [Google Scholar]
  56. Padilla, M.; Shetty, N.; Mok, S.; Ravlic, I.; Latypov, V. Mobility City Lab Coimbatore. 2019. [Google Scholar]
  57. Padilla, M.; Latypov, V. The City Lab Joinville in Southern Brazil: An Innovative Approach for Addressing Sustainability in the Mobility Sector. 2018. Available online: https://publica.fraunhofer.de/entities/publication/c29784d5-2069-49e1-835b-6643c6171901/details (accessed on 5 October 2022).
  58. SPARCS. D5.4 Implementation Plan Maia. 2022. Available online: https://www.sparcs.info/ (accessed on 5 October 2022).
  59. SPARCS. D5.5 Implementation Plan Reykjavík. 2022. Available online: https://www.sparcs.info/ (accessed on 5 October 2022).
  60. SPARCS. D5.6 Implementation Plan Kladno. 2022. Available online: https://www.sparcs.info/ (accessed on 5 October 2022).
  61. SPARCS. D5.8 Implementation Plan Kifissia. 2022. Available online: https://www.sparcs.info/ (accessed on 5 October 2022).
  62. SPARCS. D5.7 Implementation Plan Lviv. 2022. Available online: https://www.sparcs.info/ (accessed on 5 October 2022).
  63. SPARCS. D1.11 City Vision 2050—Draft. 2021. Available online: https://www.sparcs.info/index.php/about/deliverables/d111-city-vision-2050-draft (accessed on 15 April 2022).
  64. Zhang, X.; Penaka, S.R.; Giriraj, S.; Sánchez, M.N.; Civiero, P.; Vandevyvere, H. Characterizing Positive Energy District (PED) through a Preliminary Review of 60 Existing Projects in Europe. Buildings 2021, 11, 318. [Google Scholar] [CrossRef]
  65. Krangsås, S.G.; Steemers, K.; Konstantinou, T.; Soutullo, S.; Liu, M.; Giancola, E.; Prebreza, B.; Ashrafian, T.; Murauskaitė, L.; Maas, N. Positive Energy Districts: Identifying Challenges and Interdependencies. Sustainability 2021, 13, 10551. [Google Scholar] [CrossRef]
  66. Aghamolaei, R.; Shamsi, M.H.; Tahsildoost, M.; O’Donnell, J. Review of district-scale energy performance analysis: Outlooks towards holistic urban frameworks. Sustain. Cities Soc. 2018, 41, 252–264. [Google Scholar] [CrossRef]
  67. Kammen, D.M.; Sunter, D.A. City-integrated renewable energy for urban sustainability. Science 2016, 352, 922–928. [Google Scholar] [CrossRef]
  68. Good, N.; Ceseña, E.M.; Mancarella, P.; Monti, A.; Pesch, D.; Ellis, K. Barriers, challenges, and recommendations related to development of energy positive neighborhoods and smart energy districts. In Energy Positive Neighborhoods and Smart Energy Districts; Academic Press: Cambridge, MA, USA, 2017; pp. 251–274. [Google Scholar]
  69. Sareen, S.; Albert-Seifried, V.; Aelenei, L.; Reda, F.; Etminan, G.; Andreucci, M.-B.; Kuzmic, M.; Maas, N.; Seco, O.; Civiero, P.; et al. Ten questions concerning positive energy districts. Build. Environ. 2022, 216, 109017. [Google Scholar] [CrossRef]
Figure 1. Method used to decide the solutions per city.
Smartcities 06 00001 g001
Figure 2. The 4 step City Lab process in SPARCS.
Smartcities 06 00001 g002
Table 1. Profile of the five Fellow Cities of Maia, Reykjavik, Kladno, Kifissia, and Lviv (improved and adapted from [53]).
MaiaReykjavikKladnoKifissiaLviv
Climate (Köppen–Geiger system)Warm and temperate (Csb)Marine West Coast Climate (Cfc)Warm and temperate (Cfb)Mediterranean climate (Cfa)Humid continental (Dfb)
Share of energy demand covered by RES (% of end energy demand)26.5 *1005%--
Share of electricity demand generated by RES (% of electricity demand)451004.75%--
Renewable energy sources in useHydro, wind, solarHydro, geothermalSolar, partially hydro and windSolar for water heating-
Other sources of energyNatural gas, oilNoneCoal, natural gasCoal, natural gas, oilNatural gas (heating)
Note *: % of RES in use in Maia depends on the national electricity production (and import) infrastructure. The values fluctuate in time and the current value is an approximate. Kifissia does not own any RES production. The first public PV systems are being established through SPARCS energy community. Lviv does not have RES production itself. The city is a part of the united energy system of Ukraine, and it is not possible to get information for Lviv separately, however, Lviv does provide heating using natural gas.
Table 2. Two analysis levels Morgenstadt framework.
Level 1: Assessment of IndicatorsExample
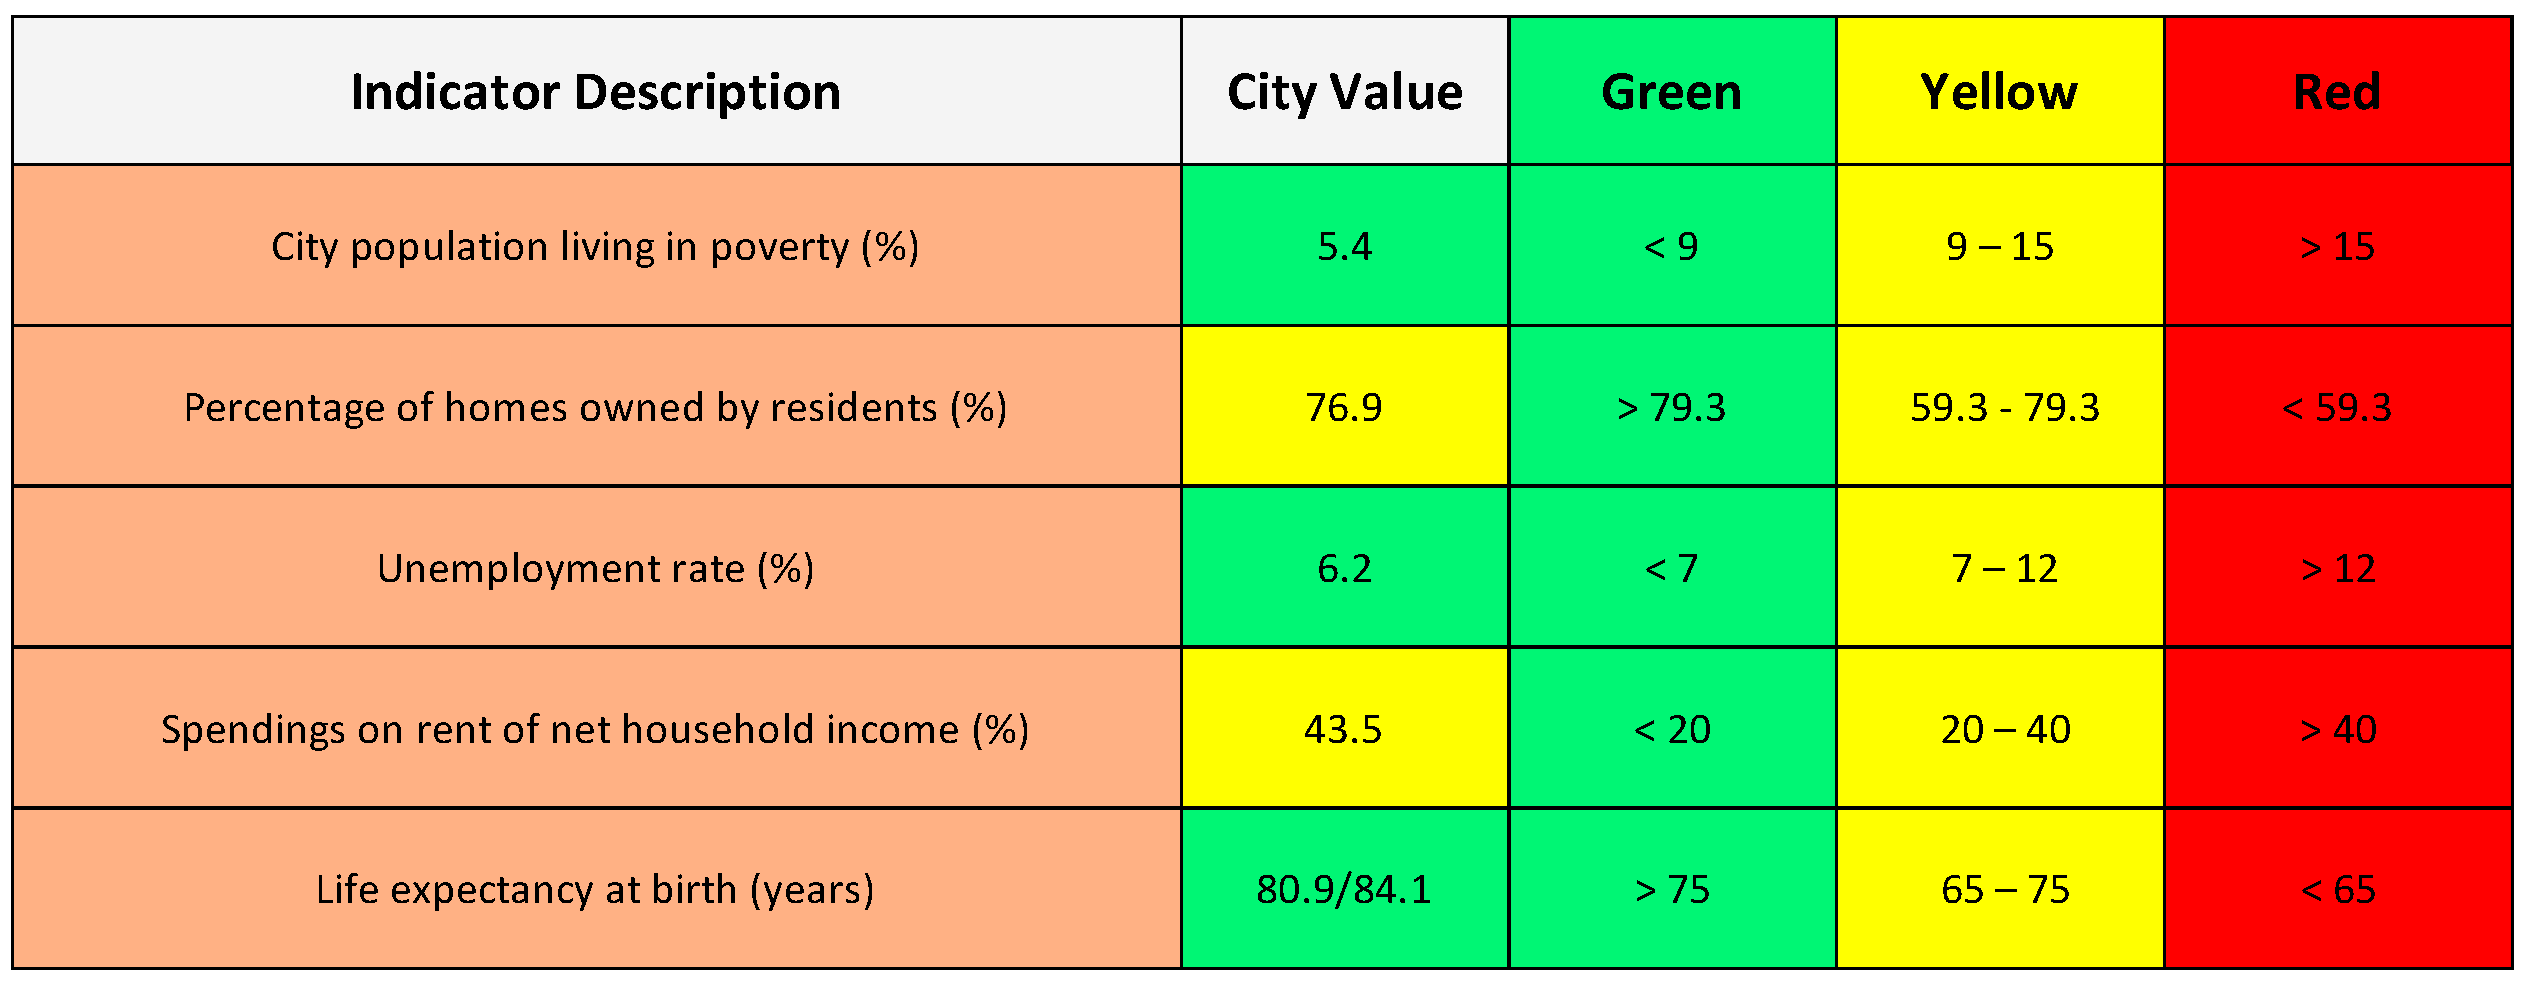
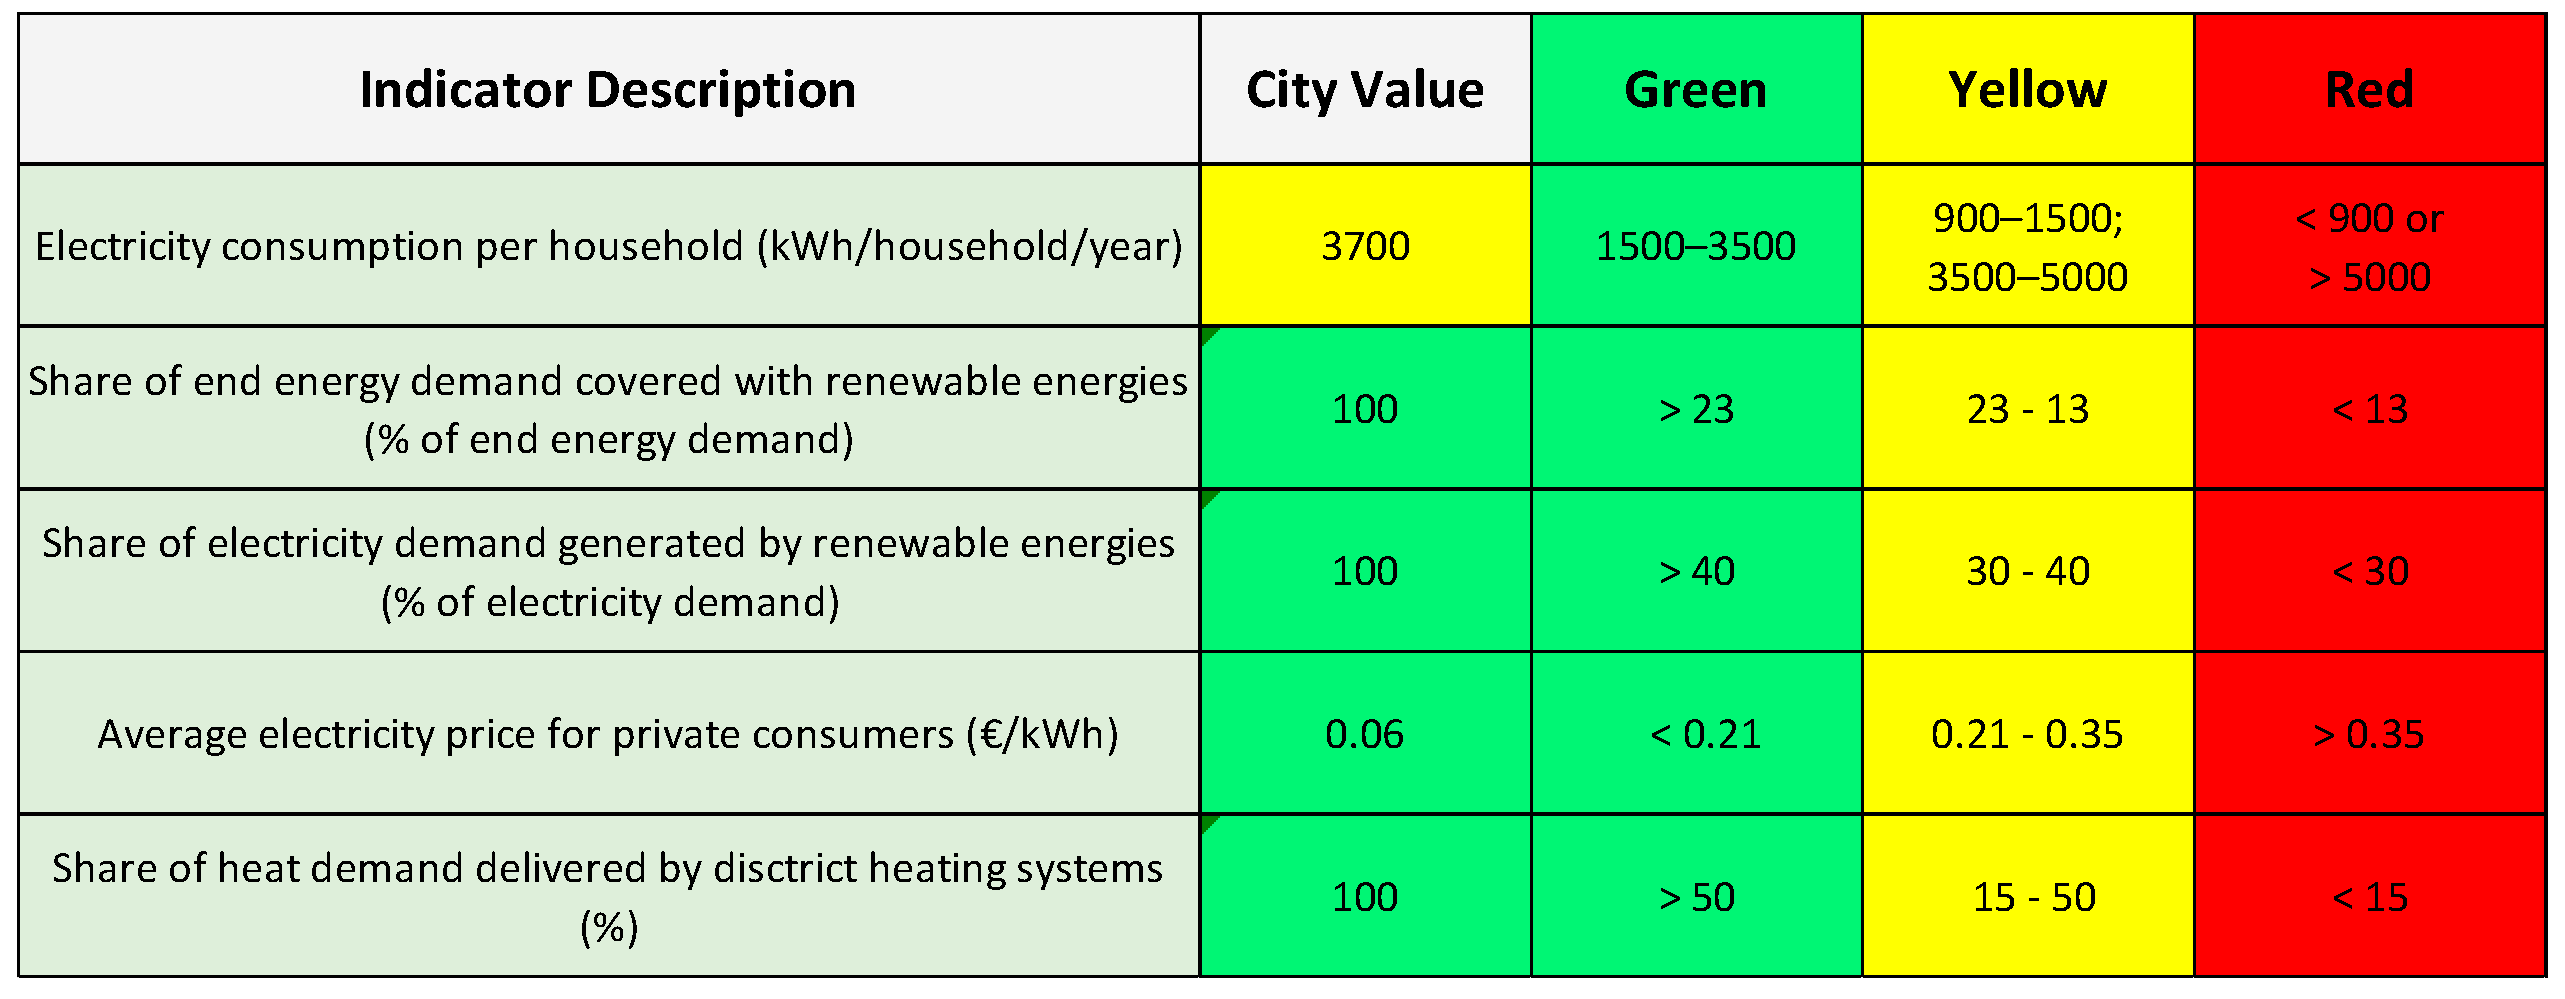
This measures the current status quo of urban systems (quantitative assessment). Out of the initial list of more than 100 Morgenstadt indicators [54], 63 were selected for SPARCS.
The indicator categories included: Economy and Governance, Urban Resilience, Zero Emissions, Innovation Leadership, Budget allocation and finance, Mobility, ICT and Energy.
  • Total energy use of the city (GWh/year) divided by inhabitants
  • Share of traffic by public transport
  • Length of bicycle path (km) per 100,000 population
Level 2: Assessment of Action Fields
These are direct yes/no type questions that the cities were asked in connection with their ICT, Governance, Mobility, Energy, Building Transformation, and Political Dynamics Performance. In total, 35 action fields were defined consisting of more than 100 questions to understand how the city is performing regarding sustainability and what is their strategy to tackle the challenges while using their opportunities. The questions were defined to address the SPARCS objectives. The model included a simple scoring system that allowed to assess each of the answers.
  • Does the city have a long term strategy and vision? (y/n)
  • Have concrete long-term sustainability goals been agreed upon? (e.g., 50% carbon dioxide until 2040) (y/n)
  • Does the city refer to higher building performance standards for own buildings than necessary? (y/n)
Table 3. Selection criteria for projects.
Stakeholder EngagementRegulation ConstraintsFunding PotentialPolitical SupportCity Strategy AlignmentQuick WinPotential to Be a Lighthouse Project
It referred to possible interest or acceptance (e.g., during interviews)If there is a need to modify or introduce a regulation to implement the projectAvailability of funds (private or public)Political interest and back-up to encourage the projectAlignment with the city agenda and goalsLevel of difficultyThe extent to which the idea can be expanded
Table 4. Key strategy areas identified through the City Vision 2050 (improved and adapted from [53]).
MaiaReykjavikKladnoKifissiaLviv
Spatial Developmentxxx x
Mobilityxxxxx
Efficient buildings and materialsx xxx
Green energyx xxx
Digital networks and eServicesx xx
Citizen Education and Participationxxxx
Circular Economy (waste management etc.)xx xx
Nature-based solutionsx x
Table 5. Final list of project ideas to be further developed (more details in the implementation plans [58,59,60,61,62].
CityFinal Project IdeaDescription
MaiaPilot a Smart Grid and VPP at City District, considering an energy communityTo become more experienced in implementing smart grids and positive energy blocks subjects, Maia will implement a PED with a virtual boundary and will study the feasibility to create a Renewable Energy Community (REC) in a social neighborhood. Within the scope of PED and still during the course of SPARCS project, Maia is aiming to install and demonstrate the feasibility of different BIPV technologies: one regular BIPV technology applied in building façades and a very recent BIPV technology with solar cells framed in the building’s fenestration. Given the low-cost of PV and its potential in Maia, the municipality is also studying, together with different stakeholders, new financing mechanisms that could fund investments in PV in many municipal buildings.
These experiments will produce helpful data that can be validated and used for further research on different smart city solutions to increase energy flexibility (e.g., peak shaving) and local energy generation, decrease overall energy consumption (e.g., through energy efficiency measures), and ultimately help the municipality find the best replication strategies for its territory.
City Digital TransformationThe city foresees the need for having a transversal/holistic platform (across the existing ‘verticals’) for collecting, processing, and integrating urban data, having in mind better citizen awareness and operation and strategic decision making based on data. Maia is already interoperating data from several sources, both owned by the Municipality (air quality, meteorology, electrical energy consumption, street parking) and in the context of protocols with stakeholders (e-chargers (Mobi.e), electrical energy consumption (e-Redes), traffic conditions (Waze) and institutional sources—e.g., National Bureau of Statistics). Available data is currently being prepared for further studies on energy consumption flexibility.
ReykjavikMobility hubRemoves obstacles that exist today that prevent more people from using public transport. A way to coordinate the infrastructure for different modes of transport. Solve the problems when going to and from work.
Green housing projectEvidence that 90% of driving trips are within 3 km. But there is a lack of space within neighborhoods for social interaction. Eco-streets can also be implemented. This can start with the unsustainable neigborhoods first that have for example, a lot of driving and less bike paths.
KladnoClean energy produced by the photovoltaic system including a business modelBy 2030, new roof PVs will be installed having a capacity of 59,410 MWh/year. Hybrid photovoltaic-thermal collectors are also a possibility. The main concern is that most of the produced electricity should be within the building and there must be a battery with sufficient storage capacity. Excess electricity could be exported to the grid, resold to other consumption points in the city or used for heating by heat pumps.
Supporting clean individual mobilityAt the moment, there is a heavy use of private and company vehicles. Ecological modes of transport are not common and there is no car sharing system, even though the bike system was partially tested. The city also needs to invest in charging points as there are only five at the moment.
KifissiaBike sharing system and smart sensorsKifissia wants to promote ecomobility as currently there is a lot of use of private cars. Also, so far Kifissia has no bike sharing system. There are bike streets approx. 14 km in length, which would need to be extended and improved. The addition of air quality monitoring sensors will make it possible to send notifications to the citizens in case the air quality drops that day so they can avoid the use of bike.
Energy communityThe municipality is working on a formation of an Energy Community with help of municipal staff and citizens. There will be an open invite for citizens to participate. The plan involves creating a photovoltaic park where members can profit from the energy produced via virtual net metering.
LvivSpatial Energy PlanGeographical information system that supports the data collection, analysis, and visualization in a format of maps of energy potential, energy supply and consumption in Lviv. As a tool for developers of energy solutions and a beta version of a digital twin of the energy infrastructure of Lviv, it provides opportunities to create algorithms for data analysis and justification of innovative actions.
Data-Driven Sustainable Mobility PlanSoftware for modelling traffic and calculating CO2 emissions from the transport that will be used for justification of mobility solutions in Lviv.
Disclaimer/Publisher’s Note: The statements, opinions and data contained in all publications are solely those of the individual author(s) and contributor(s) and not of MDPI and/or the editor(s). MDPI and/or the editor(s) disclaim responsibility for any injury to people or property resulting from any ideas, methods, instructions or products referred to in the content.

