Article

Increasing Energy Conservation Behavior of Individuals towards Sustainable and Energy-Efficient Communities

by
Rumeysa Ceylan
1,*,† and
Aysegül Özbakır
2,†
1
Department of City and Regional Planning, Faculty of Architecture, Istanbul Technical University, 34367 İstanbul, Turkey
2
Department of City and Regional Planning, Faculty of Architecture, Yıldız Technical University, 34349 İstanbul, Turkey
*
Author to whom correspondence should be addressed.
Current address: Faculty of Architecture, Department of Urban and Regional Planning, Istanbul Technical University, Sisli, Harbiye, 34367 İstanbul, Turkey.
Smart Cities 2022, 5(4), 1611-1634; https://doi.org/10.3390/smartcities5040082
Submission received: 30 September 2022 / Revised: 7 November 2022 / Accepted: 8 November 2022 / Published: 18 November 2022
(This article belongs to the Special Issue Early Career Researchers’ Contributions in Smart Cities)

Abstract

:
The energy crisis is the foremost concern for the developing world, predominantly in European countries. The global energy demand will increase significantly by 2050, while natural resources dramatically decrease every day. However, net-zero emissions targets, climate emergency calls (1.5 °C global warming limit), smart environmental transformations, and energy transition efforts bring hope for fundamental changes in climate action globally. One of the best and most cost-effective strategies to achieve reduced energy consumption is encouraging energy conservation actions, which should begin at the household level and further spread to the community level. Therefore, this study aims to point out the critical role and growing importance of the ‘human’ dimension of smart cities via a behavior-based approach. The main purpose of the study is to measure the effect of feedback and intervention mechanisms on the energy conservation behavior of 100 volunteers who live in Kadikoy, Istanbul, over eight months through a behavioral questionnaire. The findings indicate that the feedback and intervention mechanisms affect volunteers’ energy conservation behaviors in the following behavioral groups: intention (t(99) = −2.75, p = 0.00), attitude (behavioral beliefs and outcome evaluations) (t(99) = 2.29, p = 0.02), subjective norms (t(99) = −4.07, p = 0.00), and perceived behavioral control (control beliefs and influence behavior) (t(99) = 3.60, p = 0.00). Moreover, among the four variable groups, participants’ intention, subjective norms, and perceived behavioral control scores are relatively high in favor of actual energy conservation behavior. Hence, the findings of the study will provide valuable insights for the local government in terms of empowering citizen participation and data-driven feedback loops, from the bottom-up energy transition perspective, via smart technologies in smart cities.

1. Introduction

Urbanization has reached an exceptional speed and scale. According to the Global Report on Human Settlements by UN-Habitat (2022), the energy consumption of cities is over two-thirds of the world’s energy and accounts for more than 75% of global CO2 emissions as a result of economic growth and rising population [1,2,3]. In addition, it is expected that global energy-related CO2 emissions will increase from 71% in 2006 to 76% in 2030 [4]. Moreover, about half of the anthropogenic CO2 emissions released to the atmosphere since the industrial revolution have occurred in the last 40 years. Today, even if anthropogenic GHG emissions were reduced to zero, researchers believe that changes in the climate system and their potential impacts would remain as a result of the burning of fossil fuels such as coal, oil, natural gas, and land-use change such as deforestation, agriculture, etc. [5,6,7,8,9,10,11,12].
The first severe global energy crisis is currently affecting the world. The International Energy Agency (IEA) has stated that the world has never seen such an extreme energy crisis before (IEA, 2022 [13]). Moreover, recent research has suggested that 31 million Europeans lived in energy poverty in 2021 due to the COVID-19 recovery and Russia’s invasion of Ukraine [14]. In 2022, The European Commission announced its REPowerEU plan, which provides the primary steps to avoid Europe’s energy dependence [15]. Among OECD countries, Turkey has one of the highest energy demand ratios due to the population growth and increasing energy consumption patterns on the end-user side. According to the energy statistics of the IEA, Turkey’s industry accounts for 36% of the nation’s total final energy consumption, followed by transport (27%), housing (20%), and services (17%) (IEA, 2020) [4]. However, the 2023 Turkish Energy Policy aims to reduce energy dependency by up to 30% by 2023 [16] by developing new policies and standards to regulate energy use, improving energy efficiency, and lowering energy consumption. The research conducted by the Ministry of Energy shows that the energy saving potential of Turkey is considerably high; 30% in the building sector, 20% in the industrial sector, and 15% in the transportation sector in 2020 [17,18].
Within this perspective, climate change, global warming, and greenhouse gas emissions are driven by human behavior and thus could be reduced via greener behavioral and lifestyle changes. In the same vein, the IPCC’s sixth assessment report concluded that global emissions can be reduced by 40–70% by 2050 and global energy demand can decrease as a result of behavioral change [19]. In addition, the European Commission’s REPowerEU plan aims at rapidly reducing energy dependence by 2030 via three critical components: behavioral changes, diversified energy resources, and a clean energy transition [15]. Therefore, changing individual behavior to reduce energy consumption and demand could be the most cost-effective strategy to reach the goal of a sustainable, affordable, equitable, and secure energy supply in Turkey [20,21,22]. In light of this goal, there have been many attempts to rebuild cities and communities in the context of a huge transition from an agricultural and industrial economy to a knowledge-based economy (such as the wired city, informational city, virtual city, smart city, intelligent city, sharing city, etc.) [23,24,25]. As one example, smart cities and communities initiatives are more than just a matter of putting new technologies into place; instead, they are an attempt to understand how people use technology to solve their problems in more innovative ways in the information age. Moreover, smart cities and communities are utilizing technology to empower citizens to take control of their lifestyles more productively and to encourage them to participate actively and to cooperate with all stakeholders [26,27,28,29,30,31]. So, the real smart city needs to enable the use of the Internet of Things (IoT), virtual reality (VR), artificial intelligence (AI), and augmented reality (AU) approaches to increase participatory planning. Most crucially, within the scope of the crowdsourcing IoT (Crowd-IoT) paradigm, the government needs to encourage its citizens to collaborate to reduce energy consumption and carbon emissions for a sustainable urban lifestyle [32,33,34,35].
According to the wide range of studies, behavioral changes have enormous environmental benefits, as much as ecological consciousness restrictions and practices. For example, changing transportation choices such as using a bicycle or public transportation instead of a private car has greater ecological impacts than car-sharing or higher parking fees. Moreover, changing buying behavior has more positive effects on the environment than using recycled products [36,37]. Additionally, related works show that there is huge potential to improve energy conservation in public areas, public transportation, and dwellings by making use of the IoT, meters, and sensors [32,33,34,35]. However, these actions are related to various behavioral antecedents [36,38]. As a crucial part of the conceptual framework of the study, the Theory of Planned behavior (TPB) has been used to explain and predict a variety of human behaviors from different disciplines of science, but it is rarely applied in the area of energy conservation behavior in the context of smart cities and communities [39,40,41,42,43,44,45]. Therefore, one of the main aims of the study is to investigate the energy conservation behavior of individuals ‘to minimize the negative impact of one’s actions on the natural and built world’, which has been conceptualized as pro-environmental behavior [46].
In this context, the well-known guides of Ajzek (2006) and Francis et al. (2004) for operational models of the Theory of Planned Behavior (Icek Ajzen, 1985) have been adapted for this study regarding the energy conservation behavior in the light of previous studies in the pro-environmental behavior literature [47,48]. According to the Theory of Planned Behavior, although there is not always a positive correlation between behavioral intention and actual behavior, an individual’s intentions are the first precursor to performing a behavior. Moreover, as can be seen in Figure 1, behavioral intention depends on three main variables: (1) attitudes toward the behavior, (2) subjective norms, and (3) perceived behavioral control. As the first variables of TPB, attitudes toward the behavior refer to the degree of a person’s favorable or unfavorable evaluation of the behavior. Attitudes are based on two components, which are ‘behavioral beliefs’ (beliefs about consequences of the behavior), e.g., ‘reducing energy consumption will increase saving money’, and ‘outcome evaluations’ (advantages and disadvantages judgments about of the outcome of the behavior), e.g., ‘decreasing contributing to the protection of the natural resources is … desirable/undesirable’. Secondly, subjective norms are determined by the perceived social pressure to perform or not perform a behavior. ‘Normative beliefs’ (the perceived behavioral expectations of other people), e.g., ‘I feel under pressure of social media to reduce my energy consumption’) and ‘Motivation to comply’ (positive or negative evaluations about each normative beliefs) are the two supportive components to measure the subjective norms dimension. Thirdly, perceived behavioral control reflects people’s beliefs that they are capable of performing the behavior. Additionally, it can be directly measured by evaluating the individual’s self-efficacy and beliefs regarding the behavior’s controllability. It has two indirect measures, which are control beliefs (individual’s beliefs about the presence or absence of facilitators or barriers to performing the behavior), e.g., ‘the decision to reduce my energy consumption is beyond my control’, and influence behavior (perceived power of control beliefs to perform a behavior), e.g., ‘I am confident that I could reduce my energy consumption if I wanted to’ [47,48,49,50,51]. In addition, as can be seen in Figure 1, socio-cultural, demographic, environmental, and personal factors might be influential on behavioral, normative, and control beliefs of individuals about to perform a target behavior.
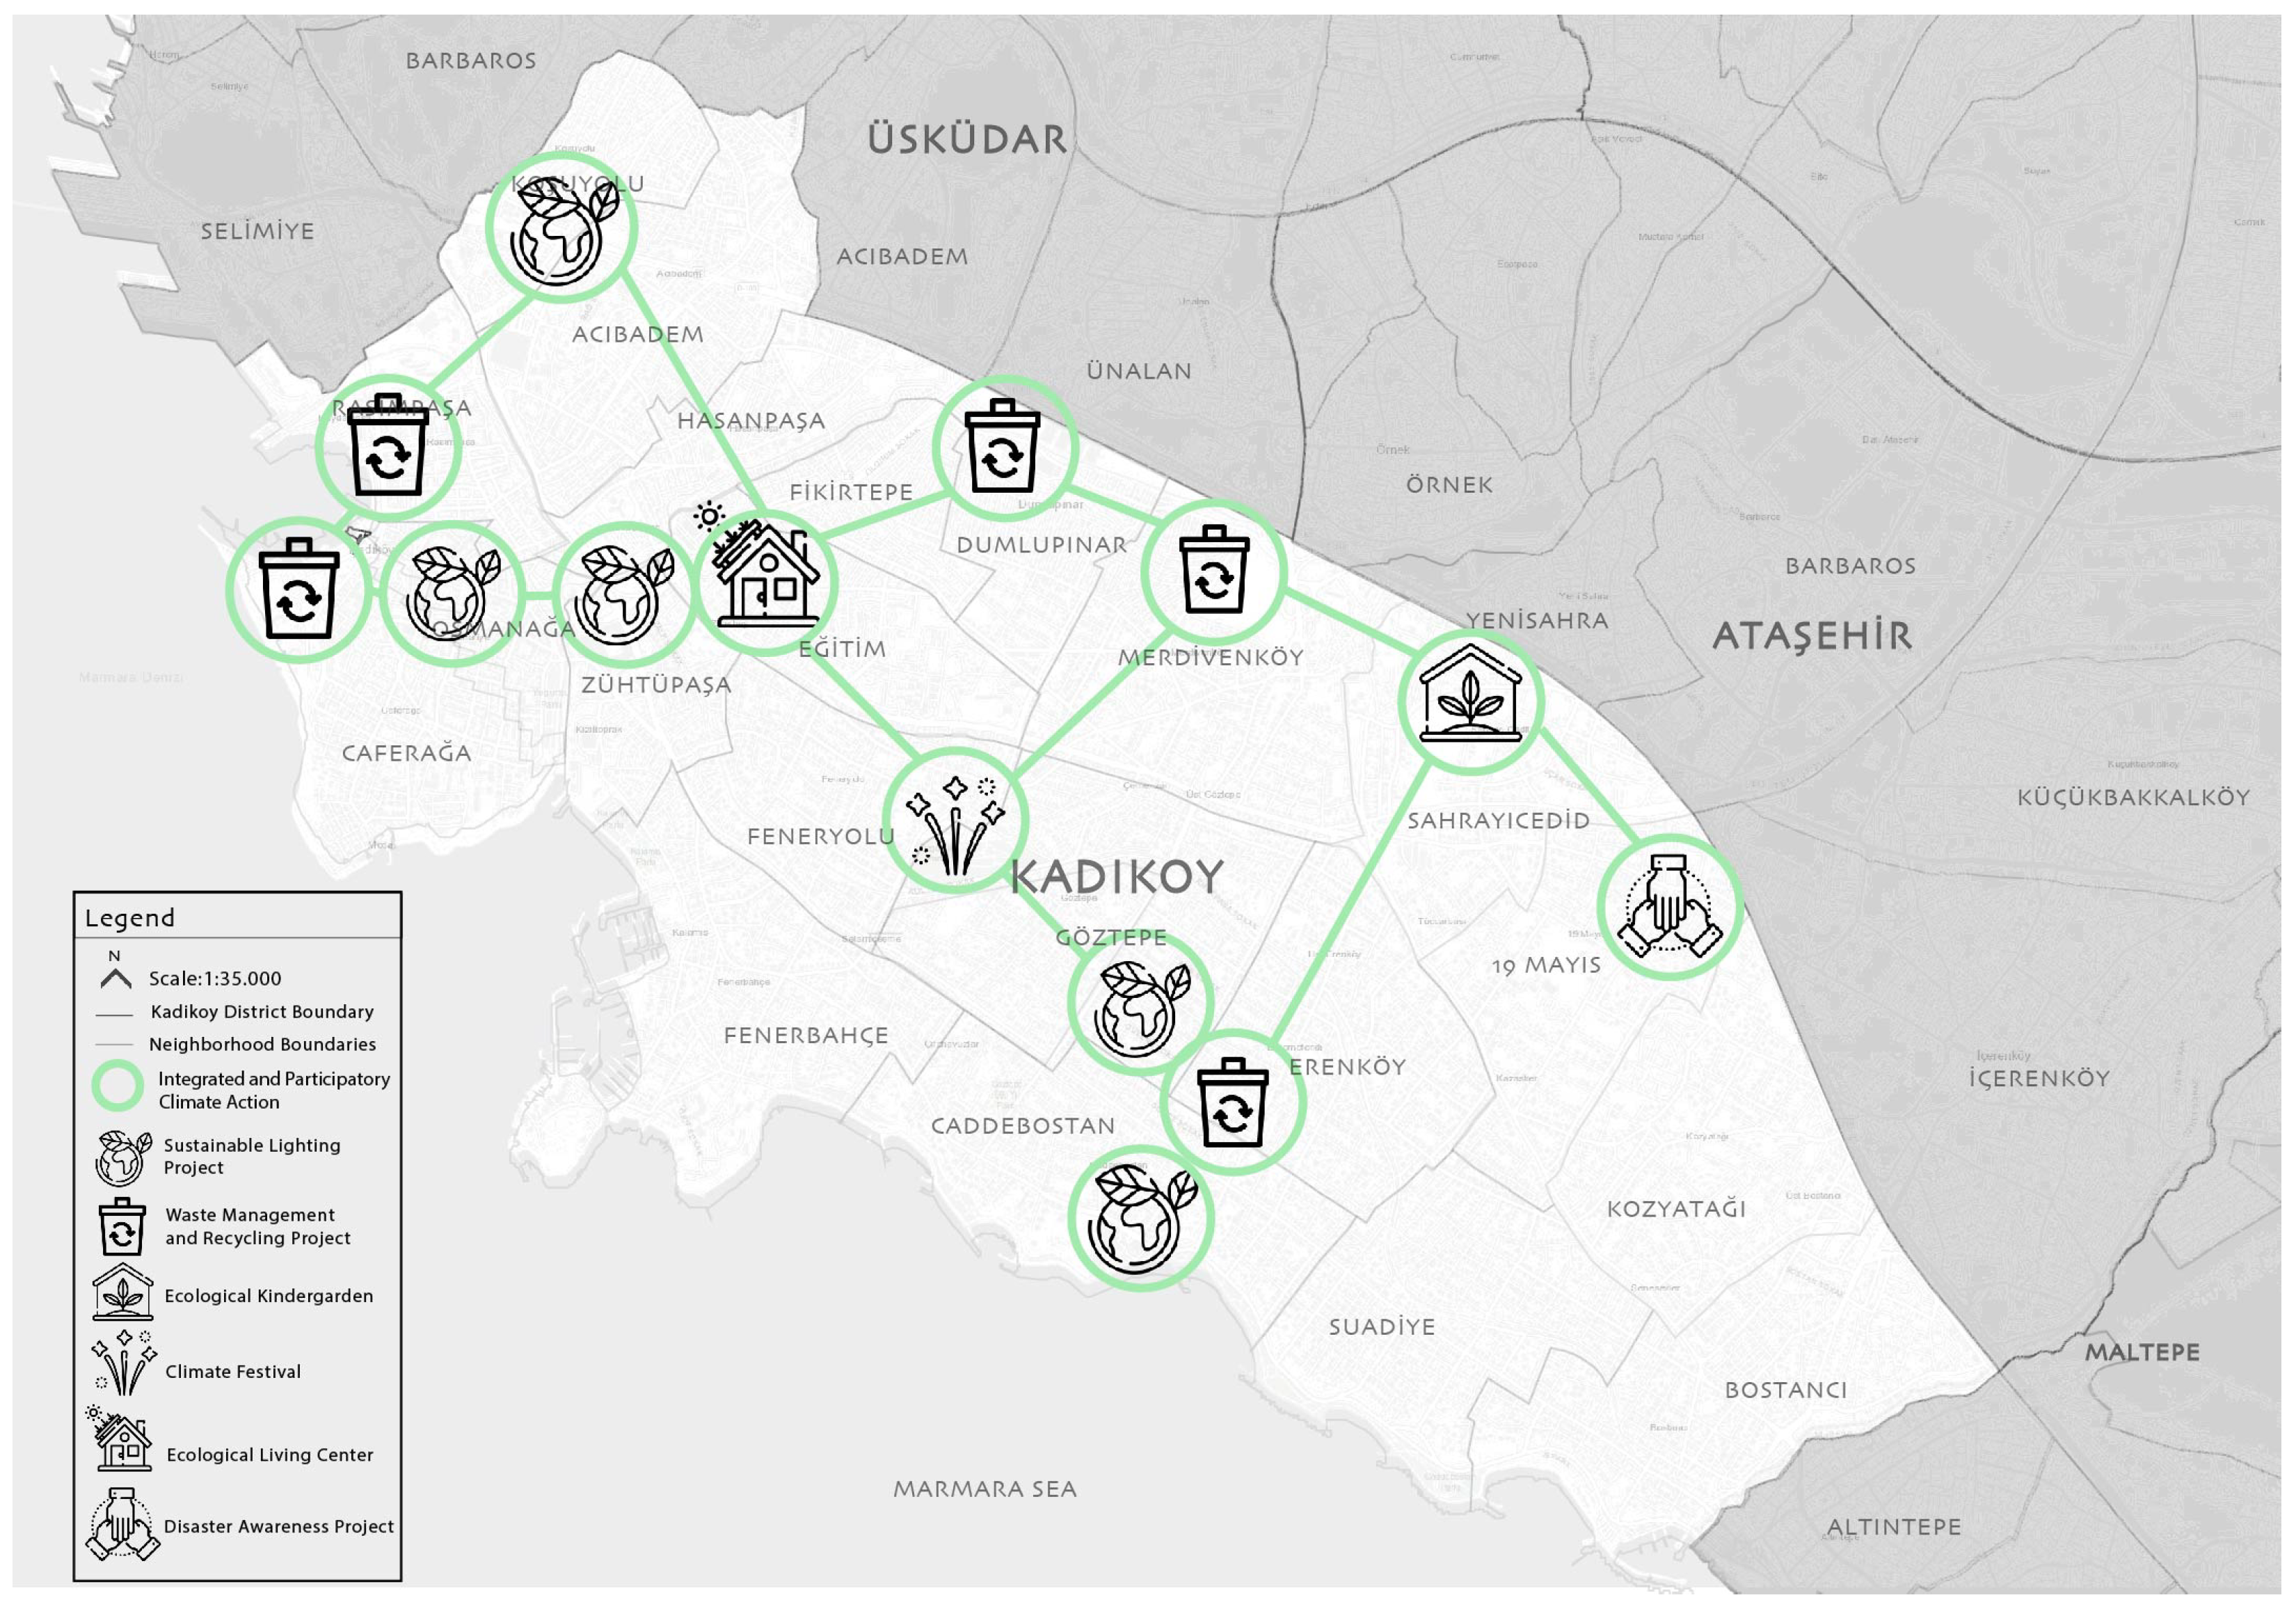
From an interdisciplinary perspective (urban planning, cognitive science, and information and communication science), this paper would like to make a contribution to the effectiveness of feedback and intervention mechanisms on energy conservation behavior towards sustainable energy communities. In this context, the impacts of energy feedback mechanisms on energy consumption behavior will be examined in the neighborhoods of the Kadikoy District in Istanbul, Turkey in 2019 (This paper is part of an EU-ERANET Co-fund (smart city) consortium project titled ‘Community Data-Loops for energy-efficient urban lifestyles (CODALoop)’ and supported by the Scientific and Technological Research Council of Turkey (TUBITAK), 116K011) Among 39 districts in Istanbul, Kadikoy has been selected as a case study area because of its diversified socio-economic structure and the initiatives of the local authority, such as building regulations and recycling policies, that aim to reduce the district’s carbon footprint and energy use. Therefore, the following sections of this paper will: (i) describe the design and implementation of the methodology of the study, including the construction of the survey, the selection of the case study area volunteer groups, data collection, and feedback and intervention mechanisms; (ii) analyze the effect of feedback and interventions on the energy consumption behavior of 100 volunteers; and (iii) discuss the potential of feedback and intervention mechanisms to encourage energy conservation behavior for sustainable and energy-efficient communities in smart cities.

2. Materials and Methods

This study will particularly focus on changing patterns of energy consumption behavior, and it aims to understand the effects of the feedback and interventions on the multidimensional structure of energy conservation behavior. In this context, the study presents a mixed methodology that integrates quantitative and qualitative research methods. As can be seen below, the methodological framework of the study is operationalized under four main steps: selection of case study area and volunteers, construction of the energy-saving behavior questionnaire, designing feedback and interventions, and procedure and data collection.

2.1. Case Study Area

Among 39 districts of the Istanbul Metropolitan Area, Kadikoy has been selected as a case district because of three main reasons. Firstly, Kadikoy is known as one of the first built-up districts of Istanbul. The district has 21 neighbourhoods, and both the population and building density of Kadikoy are quite high compared to the other 38 districts of the Istanbul Metropolitan Area (Figure 2). Additionally, Kadikoy has a diversified socio-economic structure as the cultural and commercial center of the Asian side of Istanbul. Thus, the multi-cultural, multi-ethnic, and multi-religious community characteristics of the district create a unique identity for Kadikoy. As can be seen in Figure 3, Kadikoy has high education and socio-economic development level and a higher rate of the elderly population, in comparison with the other districts in the Istanbul Metropolitan Area [52,53].
Secondly, Kadikoy Municipality is one of the two districts in Istanbul that have signed the Covenant of Mayors (CoM). As one of the CoM signatories, the local municipality aims to reduce greenhouse gas emissions of the district through “An Integrated and Participatory Climate Action Plan” in line with energy efficiency policies. As part of their climate action plans, significant ecological attempts of the local municipality can be seen in Figure 4. These ecological attempts are: the ‘Eco-Sensitive Sustainable Sites Project’, the ‘No Plastic Bag!’ campaign, the Corporate Greenhouse Gas Inventory Development Project, the Electricity Efficiency Improvement Project (EEIP), the replacement of the municipality building’s outdoor lighting to LEDs, the municipality’s head office solar collector, and the transformation to the municipality’s service vehicles to electrical vehicles [52,53]. In addition, these climate-oriented projects are conducted simultaneously and in cooperation, as can be seen as a visual abstraction in Figure 4.
Finally, the local government of the Kadikoy district has a citizen-centered approach, which includes the citizens as essential actors in the policy-making process, and has created one of the most active volunteering networks (in other words, non-profit and community-based organization networks) in Istanbul. In the context of the methodology, volunteers’ participation, commitment, and motivation to the research are consequential for the study. Therefore, the other selection criterion of the research was an active volunteering social infrastructure. So, as can be seen in Figure 5, the strong connection and organization between both the volunteer groups and the local government create an excellent opportunity to gain participants for the research.

2.1.1. The Energy-Saving Behavioral Questionnaire

The Theory of Planned Behavior (Icek Ajzen, 1985) has been used by psychologists and non-psychologists to explain and predict various human behaviors in different disciplines of science. Moreover, there is a high volume of studies using the Theory of Planned Behavior (TPB) in the behavioral change literature, which demonstrates the theory’s success in predicting and understanding individuals’ behavioral intentions and actual behavior over time. However, the TPB is rarely used in the area of energy conservation behavior in the context of smart cities and sustainable and energy-efficient communities [39,40,41,42,43,44,45,57]. Consequently, the importance and originality of this paper is that it explores through the TPB questionnaire why some individuals change their energy consumption behavior to be more sustainable while others do not. In line with this purpose, the well-known guidelines of Ajzen (2002, 2006) [47,58] and Francis et al. (2004) [48]’s ‘Constructing a Theory of Planned Behavior Questionnaire’ were used to develop an ‘Energy-Saving Behavioral Questionnaire’ (Figure S1) for this study. This part of the paper briefly explains how to construct and measure a TPB questionnaire specifically created to explore energy conservation behavior in the context of sustainable and energy-efficient communities.
According to the first step of the guidelines of Ajzen (2002 and 2006) [47,58] and Francis et al. (2004) [48], the target behavior of this study has been defined in terms of its Target, Action, Context, and Time (TACT). In this context, the target behavior of this questionnaire is described as “reducing energy consumption within the next eight months”. The target and the action of the study are determined as “100 volunteers from Kadikoy district of Istanbul Metropolitan Area” and “energy conservation actions”. Consequently, the context of the study is concluded as “Energy Conservation Behavior to building a Sustainable and Energy-Efficient Community”.
Secondly, Ajzen (2002 and 2006) [47,58] and Francis et al. (2004) [48] suggested that attitude (a), subjective norms (b), and perceived behavioral control (c) variables should be measured directly as well as indirectly to build a behavioral survey. Accordingly, the question format and procedure of the guidelines were used to construct questionnaire items about both direct and indirect measurements (i.e., a1—behavioral beliefs; a2—outcome evaluations; b1—normative beliefs; b2—motivation to comply; c1—control beliefs; c2—influence behavior). In addition to this, the question items about indirect measurements are constructed as a result of the preliminary elicitation study, which includes both the the organization of a focus group meeting (with ten respondents who are members of a Sustainable Energy Efficiency Initiative in Kadikoy) and interviews [47,48,51,57,58].
In line with the guidelines, the third step was about the questionnaire of this study, which was constructed with forty carefully worded items. In addition to the forty questions of this TPB questionnaire, seven questions about ‘socio-structural and demographic’ factors and five questions about ‘neighborhood belonging’ were asked in the context of the conceptual framework of sustainable and smart communities in this study. Additionally, as Francis and others (2004) explain, response scales of the questions are unipolar (1 to 7) or bipolar (−3 +3) depending on whether the concept to be measured is uni-directional (e.g., probability) or bi-directional (e.g., evaluation). From this point of view, the unipolar scales were used for direct measurements of predictor variables, while the bipolar scales were used for indirect measures of predictor variables [40,43,48,59,60].
In the next step, question items were translated into Turkish (the study’s target language) using ‘back-translation’ methods. In the translation stage of the study, sample questionnaires in the target language of the several Theory of Planned Behavior studies were evaluated in terms of terminology, expression, and generalizability [61,62,63,64].
In the final step, another group was organized with forty volunteer-based people, selected for the pretesting of the questionnaire. Respondents answered basic control questions related to the questionnaire, such as ‘are there any items difficult to answer?’ or ‘does the questionnaire feel too repetitive?’ [48]. After the comments of respondents on the items, the final version of the Energy-Saving Behavioral Questionnaire was structured, and question items were ordered according to the guidelines of Francis and others (2004).

2.1.2. Measuring Predictor Variables of the Energy-Saving Behavioral Questionnaire

As the first precursor to performing an energy conservation behavior, ‘intentions’ consist of expectations, desires, and decisions. Therefore, one of the most commonly used methods to measure behavioral intention, ‘generalised intention’, was used to specifically explore intentions to oppose/agree with energy-saving behavior, as detailed below. In keeping with the TACT principles of the study, behavioral intention was evaluated using three main question items (Cronbach’s α of 0.83). The intention (INT) variable was rated using 7-point Likert-type scales, ranging from 1 (strongly disagree) to 7 (strongly agree), as recommended by Francis and others [48] (Table 1). The responses to the three question items were averaged to understand the participant’s intention to perform the behavior. The higher the number, the stronger the intention of participants to reduce energy consumption within the next eight months.
Attitudes (ATT) toward the behavior refer to the degree of a person’s favorable or unfavorable evaluation of the behavior. In this context, 12 question items on the attitudes were developed for the context of this study from Francis et al. (2004), Ajzen (1985), and Ajzen (2002) [48,50,58]. Four of these question items were used to evaluate the direct measurement of attitudes toward the energy-saving behavior, with each item rated using 7-point evaluative-semantic differential scales (while a Likert scale measures agreement or disagreement with a particular statement, a semantic differential scale measures the connotative meaning of things). The four item scores were averaged, and the higher scores reflect a positive attitude to reducing energy consumption within the next eight months. Additionally, eight question items were used for the indirect measurement of attitudes (Table 2). As recommended by Francis et al. (2004) [48], for each behavioral belief, the belief score on the (1) unlikely–(7) likely scale is multiplied by the relevant evaluation score on the (−3) extremely undesirable–(+3) extremely desirable scale. Then, all of the belief scores were summed to create an overall attitude score. At the end of the calculation, a positive (+) score means that the participant is in favor of reducing their energy consumption. However, a negative (−) score means that the participant is against reducing energy consumption. In addition, items of the attitude dimension showed internal consistency with a Cronbach’s α of 0.71.
Subjective norm (SN) reflects the perceived social pressure of participant’s immediate social network, consisting of reference groups: family, friends, neighbors, or the government. In this study, five question items, which are adapted from Ajzen (2002) and Francis et al. (2004) [48,58], were used to evaluate the direct measurement of subjective norms, with each item rated using a 7-point Likert Scale as 1 (should)–7 (should not) and 1 (strongly disagree)–7 (strongly agree). The responses of the four question items were averaged to give an overall subjective norm score. The high scores consistently reflect greater social pressure to reduce energy consumption levels. Moreover, eight question items were used for the indirect measurement of subjective norms: four items for normative beliefs, and another four items for motivation to comply, as you can see in Table 3. According to Francis et al. (2004) [48], the belief score on the −3 (should not) –+3 (should) scale is multiplied by the score relating to the 1 (not at all)–7 (very much) scale for each normative belief. Finally, the outcomes were summed to calculate an overall subjective norm score. Hence, a positive (+) overall subjective norm score means that the participant experiences social pressure to reduce energy consumption. However, a negative (−) score means that the participant experiences social pressure not to reduce energy consumption. Moreover, all items of the subjective norm dimension showed high internal consistency reliability with a Cronbach’s α of 0.82.
Perceived behavioral control (PBC) reflects individuals’ perceptions of their capability to perform a behavior. In this study, perceived behavioral control is measured with twelve items adapted from Ajzen (2002) and Francis et al. (2004) [48,58]. The four items of direct measurement of perceived behavioral control were assessed using 7-point Likert-type scales, ranging from 1 (strongly disagree) to 7 (strongly agree) or 1 (easy) to 7 (difficult). Scores of the four items were averaged, with higher scores reflecting a greater level of control over the reducing energy consumption within the next eight months. In addition, eight more question items were used for the indirect measurement of perceived behavioral control: four items for control beliefs and another four items for influence behavior, as can be seen in Table 4. As recommended by Francis et al. (2004), for each behavioral belief, the belief score on the (1) unlikely–(7) likely scale is multiplied by the relevant item on the (−3) less likely–(+3) more likely scale. Finally, all of the belief scores were summed to create a total perceived behavioral control score. A positive (+) result of the overall perceived behavioral control score means that the participant feels in control of reducing energy consumption. However, a negative (−) score means that the participant does not feel in control of reducing energy consumption. Furthermore, all items of perceived behavioral control showed internal consistency, with a Cronbach’s α of 0.71.
According to the Siero et al. (1996) and Ajzen (2002) [58,65], the final questionnaire also includes measures of demographic characteristics and other background factors related to a case study of the research. Therefore, the participants were asked seven question items about socio-structural and demographic variables, as shown in Table 5. In addition, the volunteers were asked about the name of their neighborhood to observe the spatial distribution of the energy conservation behavior at the neighborhood level. Additionally, the neighborhood belonging variable was added to the questionnaire to see their attachment to the neighborhood and to understand the relationship between participant’s energy consumption behavior, community actions, and local authority attempts. Accordingly, the neighborhood belonging of the participants was measured with the five following question items, as shown in Table 6. To assess neighborhood belonging and personality variables, participants were asked to evaluate the consequences on a 7-point scale ranging from 1 (strongly disagree) to 7 (strongly agree). The responses of the five question items (Cronbach’s α = 0.74) were averaged to give an overall neighborhood belonging score.
As mentioned at the beginning of the section, there are forty-five psychological questions in the survey to measure the energy conservation behavior of volunteers. Question numbers, response format, scoring information about items, and construct measures of the behavioral questionnaire are presented in Table 7.

2.2. Selection of Volunteers

Participants of the study were identified by using critical case sampling methods. In line with the context of the study and with the lessons learned from the previous pilot and beta test meetings which were organized to test survey questions, there were five initial criteria for selecting the participants as follows: (1) living in Kadikoy district (because of the case study area selection), (2) able to commit themselves to the eight-month period of the research (to track their pattern of energy behavioral), (3) to have Internet access (to fill out energy behavioral survey), (4) to have an email address (to access online feedback and interventions), and (5) to have a social media account such as Facebook, Instagram, or Twitter (to access online feedback and interventions). Based on these selection criteria, 100 citizens living in the Kadikoy district volunteered to participate in the research study for eight months, with the support of the local municipality and local organizations.
When the socio-demographic characteristics of the 100 volunteers were examined, it was noted that the participants had heterogeneous socio-demographic characteristics in terms of age groups, ethnicity, salary, level of education, and occupation in Kadikoy. Just over half of the participants (53%) were female, whereas 47% were male. When the age distribution of the volunteers was analyzed, the majority of them were between 25 and 35 years old (27%). This was followed by the 46–55 (22%) and 36–45 (20%) age groups. Additionally, 48 percent of the volunteers had a bachelor’s degree, and 7% had higher education, such as a master’s or doctoral degree, whereas 14% only had primary school education. When occupation of the volunteers was examined, sales and marketing sector (20.7% of users), unemployed (11.8% of users), and retirees (10.8% of users) were the major groups. Moreover, the participants were divided into four groups based on their monthly income levels: 46% earned TL 2001–4000, 27% earned TL 4001–5000, and 21% earned TL 5001–6000 TL (Turkey’s average monthly income was TL 1798 in 2018. In the same year, the minimum wage was TL 1603 (Republic of Turkey Ministry of Family, Labour and Social Services (TUIK), 2018)) The household size of the volunteers was dominantly recorded as two persons (44%) and three or four persons (31%) (Figure 6).

2.3. Designing Feedback and Intervention Mechanism

According to the Feedback Intervention Theory (FIT) (Kluger and Denisi, 1996 [66]), feedback which is defined as a consequence of performance is an indispensable component of behavioral change in the transition to a sustainable lifestyle [65,67,68]. Moreover, there are a number of extensive cross-sectional studies suggesting that among different feedback types, comparative, historical, and goal-setting feedback are the most effective feedback types on changing behavior [65,69,70,71,72]. Overall, all the studies reviewed here highlight the need for comparative, goal setting, and historical feedback types when designing a feedback mechanism for behavioral change in the context of the study.
Table 8 illustrates the feedback types, frequency, objectives, participants, time periods, and target scale which are planned as dimensions of the feedback and intervention plan of the research [65,66,67,68]. From Table 8, it can be seen that the volunteers of the study received comparative, goal setting, and historical feedback via the ‘Energy Trendline Report’ intervention of the research (Figure 7). Every month, volunteers were informed about their personalized energy-saving amounts for each month (which was designed as a part of historical feedback), personalized energy-saving suggestions for the next month (designed as a part of goal-setting feedback), and were informed about energy saving amounts of other individuals in the experiment (designed as a part of comparative feedback) via the ‘Energy Trendline Report’. (Energy consumption levels and energy saving amounts of volunteers were gathered from a web-based, data-driven learning platform. The name of the web-based platform is ‘CODALoop’ (Community Data Loops for Energy-Efficient Urban Lifestyles), which was developed as a part of the EU-ERANET co-fund consortium project).
In addition to this, comparative and goal-setting feedback was also provided to the volunteers via the ‘Scientific Texts’ intervention of the research. In total, volunteers received ‘Energy Efficiency Bulletin’, ‘Energy Efficiency Control Guide’ (personalized energy-saving suggestions to provide awareness for a sustainable lifestyle) and scientific texts about social aspects and economic consequences of excessive energy consumption and global limitations for a sustainable future via email groups (Google groups which were specifically created for the research) and the social media platforms such as Facebook and Instagram accounts of the research project. Moreover, the social media platforms of the research created virtual communication spaces for the volunteers to share their knowledge and energy-saving stories with each other (designed as a part of the comparative feedback). Additionally, these feedback types were supported with face-to-face interventions in order to create a connection among the volunteers to discuss common problems regarding energy conservation. These face-to-face interventions were: (1) ‘Movie Night’ (a night for volunteers to get together to watch energy-consciousness-related movies) and (2) ‘My Energy Story Night’ (an event for volunteers to get together and share energy conservation experiences through energy diaries).

2.4. The Experiment 100: Procedure and Data Collection

The study adopted a pre-test–post-test (time 1, before the feedback and intervention program, and time 2, after the feedback and intervention program) experimental design to measure the effects of feedback and interventions on the multidimensional variable of energy-saving behavior over a period of eight months. According to the selection criteria of the study, 100 citizens volunteered to participate in the research for a period of eight months. As a part of the feedback and intervention plan, each volunteer received the ‘Energy Conscious Volunteer Kit’ after their commitment to the research project. This kit included a control guide about their energy efficiency at home, a brochure about the importance of saving energy, an energy diary to write their stories about their energy consumption experience, and a volunteer badge. Moreover, 100 volunteers received comparative, historical, and goal-setting feedback, which has proven to be the most effective feedback type, according to the literature [70,71,72,73,74].
In order to observe the effects of feedback and interventions on multidimensional variables of energy conservation behavior, the 100 volunteers filled out the ‘Energy-Saving Behavioral Questionnaire’ both at time 1 (t1) and time 2 (t2) via the Survey123 solutions from the ESRI Software Company. Then, all of the responses (with the overall response rate being 100 percent) were centralized in an online database. After that, the energy conservation behavioral data of 100 volunteers were gathered from the Survey123 platform, and the responses to the psychological questions were scored according to the guidelines of Ajzen (2002 and 2006) and Francis et al. (2004), as can be seen in Table 7 [47,48,58]. The present study was conducted with the following analyses to test the hypothesis: reliability, normality (Kolmogorov–Smirnov and Shapiro–Wilk), and paired sample t-test (using IBM SPSS Statistics V.26) to test the effect of the feedback and intervention programs on the changes in multidimensional variables of energy conservation behavior at t1 and t2.

3. Results and Findings

A paired sample t-test was conducted to evaluate the impact of the feedback and interventions on energy conservation behavior of 100 volunteers (Table 9). In this context, the null hypothesis ( H 0 ) is that the average difference in multidimensional variables of energy conservation behavior scores is 0 from t1 (intention: M = 5.76, SD = 1.30; attitude: M = 6.21, SD = 1.14, and indirect measurement M = 5.24, SD = 0.72; subjective norm: M = 3.61, SD = 1.13, and indirect measurement M = 5.13, SD = 0.99; perceived behavioral control: M = 5.20, SD = 1.26, and indirect measurement M = 4.79, SD = 0.73; neighborhood belonging: M = 4.22, SD = 1.44) to t2 (intention: M = 6.07, SD = 1.03; attitude M = 6.40, SD = 0.97, and indirect measurement M = 5.09, SD = 0.63; subjective norm: M = 4.08, SD = 1.21, and indirect measurement M = 5.25, SD = 0.96; perceived behavioral control: M = 5.28, SD = 1.22, and indirect measurement M = 4.48, SD = 0.51; neighborhood belonging: M = 4.42, SD = 1.43). However, prior to conducting the analysis, the assumption of normally distributed difference scores was examined. Then, the Shapiro–Wilk test was performed, showing no evidence of non-normality (W(100) = 0.96, intention: skewness = 0.75, kurtosis = 1.20; attitude (direct measurement): skewness = 0.20, kurtosis = 0.87 and attitude (indirect measurement): skewness = −0.18, kurtosis = 0.29; subjective norm (direct measurement) skewness = 0.16, kurtosis = 0.59 and subjective norm (indirect measurement): skewness = 0.26, kurtosis = −0.05; perceived behavioral control (direct measurement): skewness = 0.38, kurtosis = 0.56 and perceived behavioral control (indirect measurement): skewness = −0.30, kurtosis = 0.97; neighborhood belonging: skewness = 0.13, kurtosis = 0.44). According to Hair et al. (2010) [75], values for skewness or kurtosis less than ± 1.0 indicate that the skewness or kurtosis for the distribution can be considered normal. However, Tabachnick and Fidell (2013) [76] conclude that skewness or kurtosis values between ±1.5 are, in many cases, also acceptable and can be considered normal. Based on these outcomes and after visual examination of the histogram and the QQ plot, the assumption was considered satisfied, and a paired sample t-test was considered appropriate in this case.
A paired sample t-test was conducted to see the effects of feedback and intervention on the energy conservation behavior of the 100 volunteers from before the feedback and intervention program to after the feedback and intervention program. The results indicate that the null hypothesis was rejected for the intention score (t(99) = −2.75, p = 0.00), the attitude (indirect measurements) score (t(99) = 2.29, p = 0.02), the subjective norm (direct measurements) score (t(99) = −4.17, p = 0.00), and the perceived behavioral control (indirect measurement) score (t(99) = 3.60, p = 0.00). Therefore, the energy conservation behavior scores of the volunteers after the feedback and interventions (intention: M = 6.07, SD = 1.03; subjective norm: direct measurement M = 4.08, SD = 1.21; perceived behavioral control: indirect measurement M = 4.48, SD = 0.51) were statistically significantly higher than the energy conservation behavior scores of the volunteers before the feedback and interventions (intention: M = 5.76, SD = 1.30; subjective norm: M = 3.61, SD = 1.13; perceived behavioral control: indirect measurement M = 4.48, SD = 0.51). Moreover, the attitude (indirect measurement) variable of the energy conservation behavior scores of the volunteers after the feedback and interventions (M = 5.09, SD = 0.63) were statistically significantly lower than the attitude (indirect measurement) variable of the energy conservation behavior scores before the feedback and interventions (M = 5.24, SD = 0.72). Consequently, there is enough evidence to support the claim that the feedback and interventions affected the energy conservation behavioral scores of the volunteers in the following dimensions: intention, attitude (indirect measurement: behavioral beliefs and outcome evaluations), subjective norm (direct measurement), and perceived behavioral control (indirect measurement: control beliefs and influence behavior).
Interestingly, other results indicate that the null hypothesis failed to reject for the following psychological variables of energy conservation behavior: attitude (direct measurements) score: t(99) = −1.69, p = 0.09; subjective norm (indirect measurements) score: t(99) = −1.17, p = 0.24; perceived behavioral control (direct measurement) score: t(99) = −0.67, p = 0.50; and neighborhood belonging scores: t(99) = −1.45, p = 0.14. So, there was not a significant difference in the energy conservation behavior scores of volunteers after the feedback and interventions (attitude (direct measurements) score: M = 6.40, SD = 0.97; subjective norm (indirect measurements) score: M = 5.25, SD = 0.96; perceived behavioral control (direct measurement) score: M = 5.28, SD = 0.51; and neighborhood belonging score: M = 4.42, SD = 1.43) and before the feedback and interventions (attitude (direct measurements) score: M = 6.21, SD = 1.14; subjective norm (indirect measurements) score: M = 5.13, SD = 0.99; perceived behavioral control score (direct measurement): M = 5.20, SD = 0.12; and neighborhood belonging: M = 4.22, SD = 1.44). Correspondingly, as can be seen in Table 10, there is not enough evidence to support the claim that there would be an effect of the feedback and interventions on 100 volunteers’ energy conservation behavioral scores for the following dimensions: attitude (direct measurements), subjective norm (indirect measurements), perceived behavioral control (direct measurement), and neighborhood belonging scores. In addition, a graphical representation of the means and adjusted 95 % confidence intervals (CI) is displayed in Table 10.
There is strong evidence that the feedback and interventions program improves behavioral intentions (t(99) = −2.75, p = 0.00), attitudes (behavioral beliefs and outcome evaluations) (t(99) = 2.29, p = 0.02), subjective norms (t(99) = −4.07, p = 0.00), perceived behavioral control (control beliefs and influence behavior) (t(99) = 3.60, p = 0.00) variables of energy conservation behavior (Table 10). Alternatively, this can be described as an effect size given by the absolute value of the difference in means (behavioral intentions (M = −0.30); attitudes (behavioral beliefs and outcome evaluations) (M = 0.15); subjective norms (M = −0.47); perceived behavioral control (control beliefs and influence behavior) (M = 0.30)) divided by the standard deviation (behavioral intentions (SD = 1.10; attitudes (behavioral beliefs and outcome evaluations) (SD = 0.68); subjective norms (SD = 1.15); perceived behavioral control (control beliefs and influence behavior) (SD = 0.85)), which is approximately 0.27 (this is classified as a ‘small’ effect size) for behavioral intention, 0.22 (classified as a ‘small’ effect size) for attitudes (behavioral beliefs and outcome evaluations), 0.40 (‘medium’ effect size) for subjective norms, and 0.35 (‘medium’ effect size) for perceived behavioral control (control beliefs and influence behavior), as shown in Table 11 [77].

4. Discussion

It is expected that the global energy demand will continue to rise by 2050 while natural resources will dramatically decrease every day. However, the goals of decarbonization, net-zero emissions targets, climate emergency calls (1.5 °C global warming limit), smart environmental transformation, and energy transition efforts bring hope for fundamental changes in climate action all around the world, as can bee seen in the objectives of the Paris Agreement and the Kyoto Protocol. All of these efforts have proven that ‘change’ is not going to happen overnight, as it will take time, effort, and bottom-up collective actions to reach a green energy transition for all.
Among OECD countries, Turkey has had the fastest-growing energy demand ratio over the last twenty years. Thus, the current Turkish energy policies aim to reduce energy dependency and energy consumption through increased energy efficiency and energy conservation, as a smart energy transition not only involves low-carbon technologies, decentralized energy systems, infrastructure, policies, and standards, but also improving energy efficiency, adopting energy-saving techniques, changing consumption patterns in households, and urban mobility choices in a sustainable urban energy system [2,78]. According to the study conducted by the Ministry of Energy, it has been found that the energy-saving potential is considerable at 30% in the building sector, 20% in the industrial sector, and 15% in the transportation sector [17,18,79]. The findings indicate that encouraging energy conservation based on behavioral measures at an individual level could be a key strategy in the energy transition.
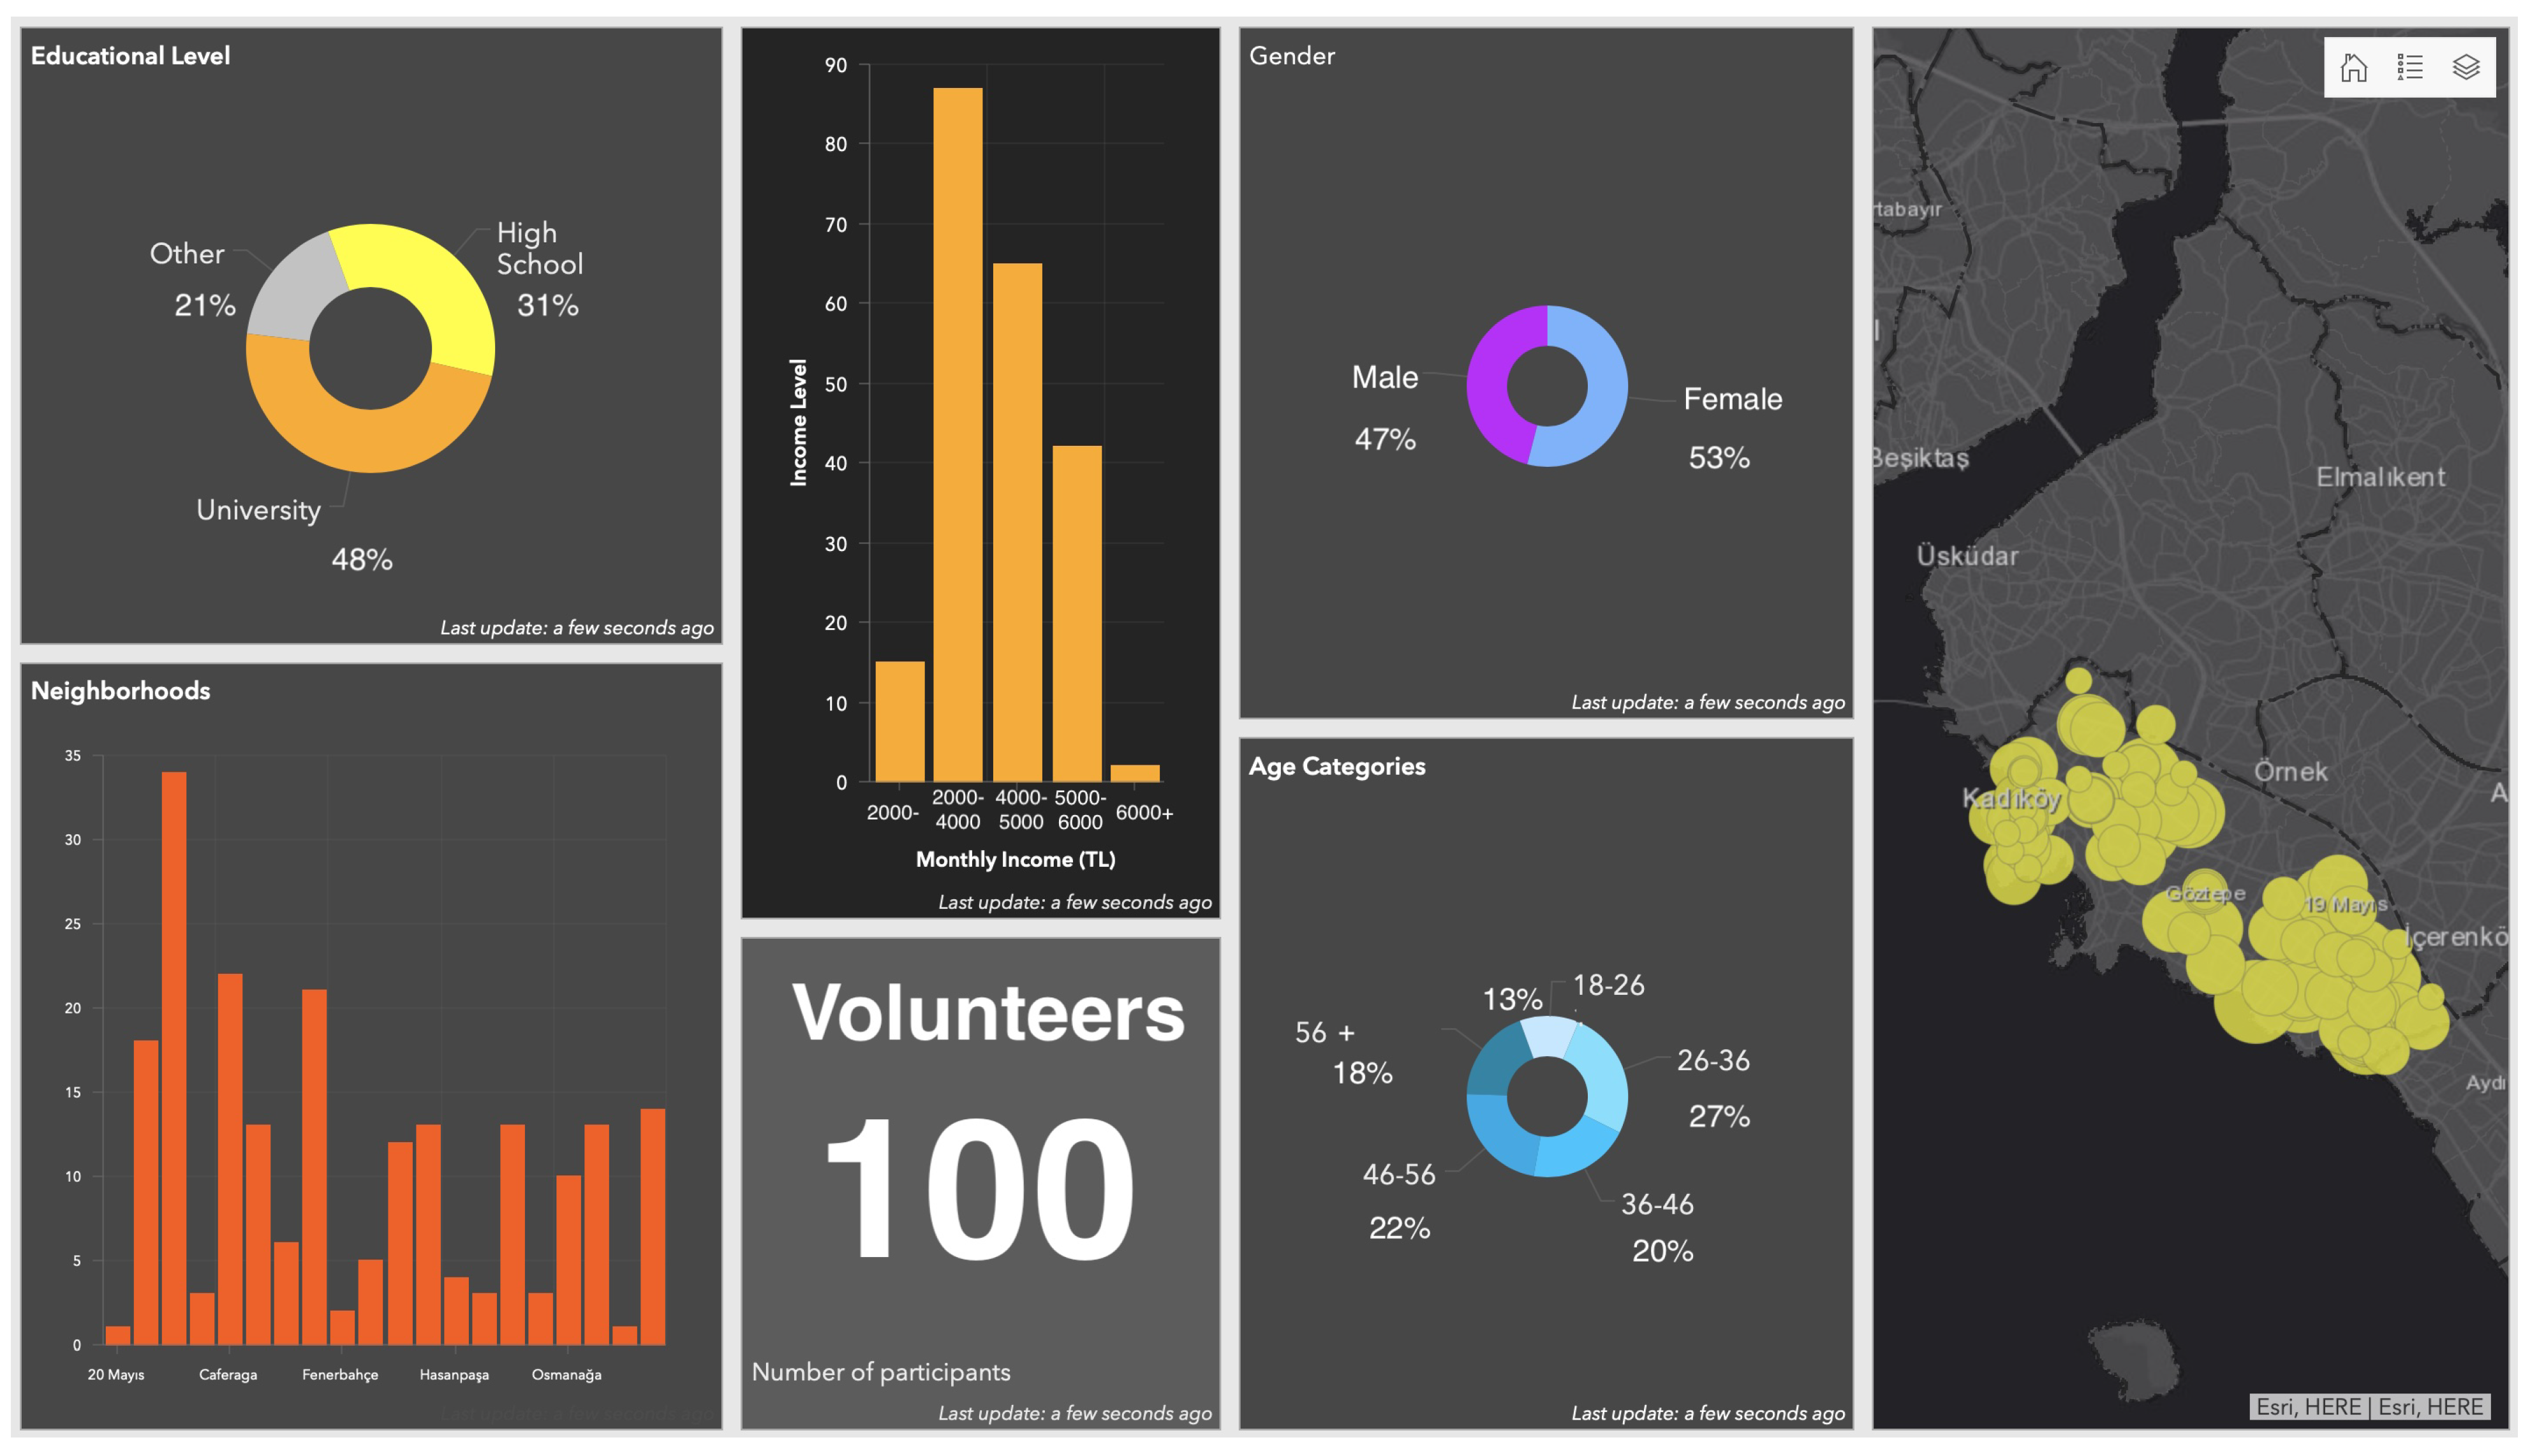
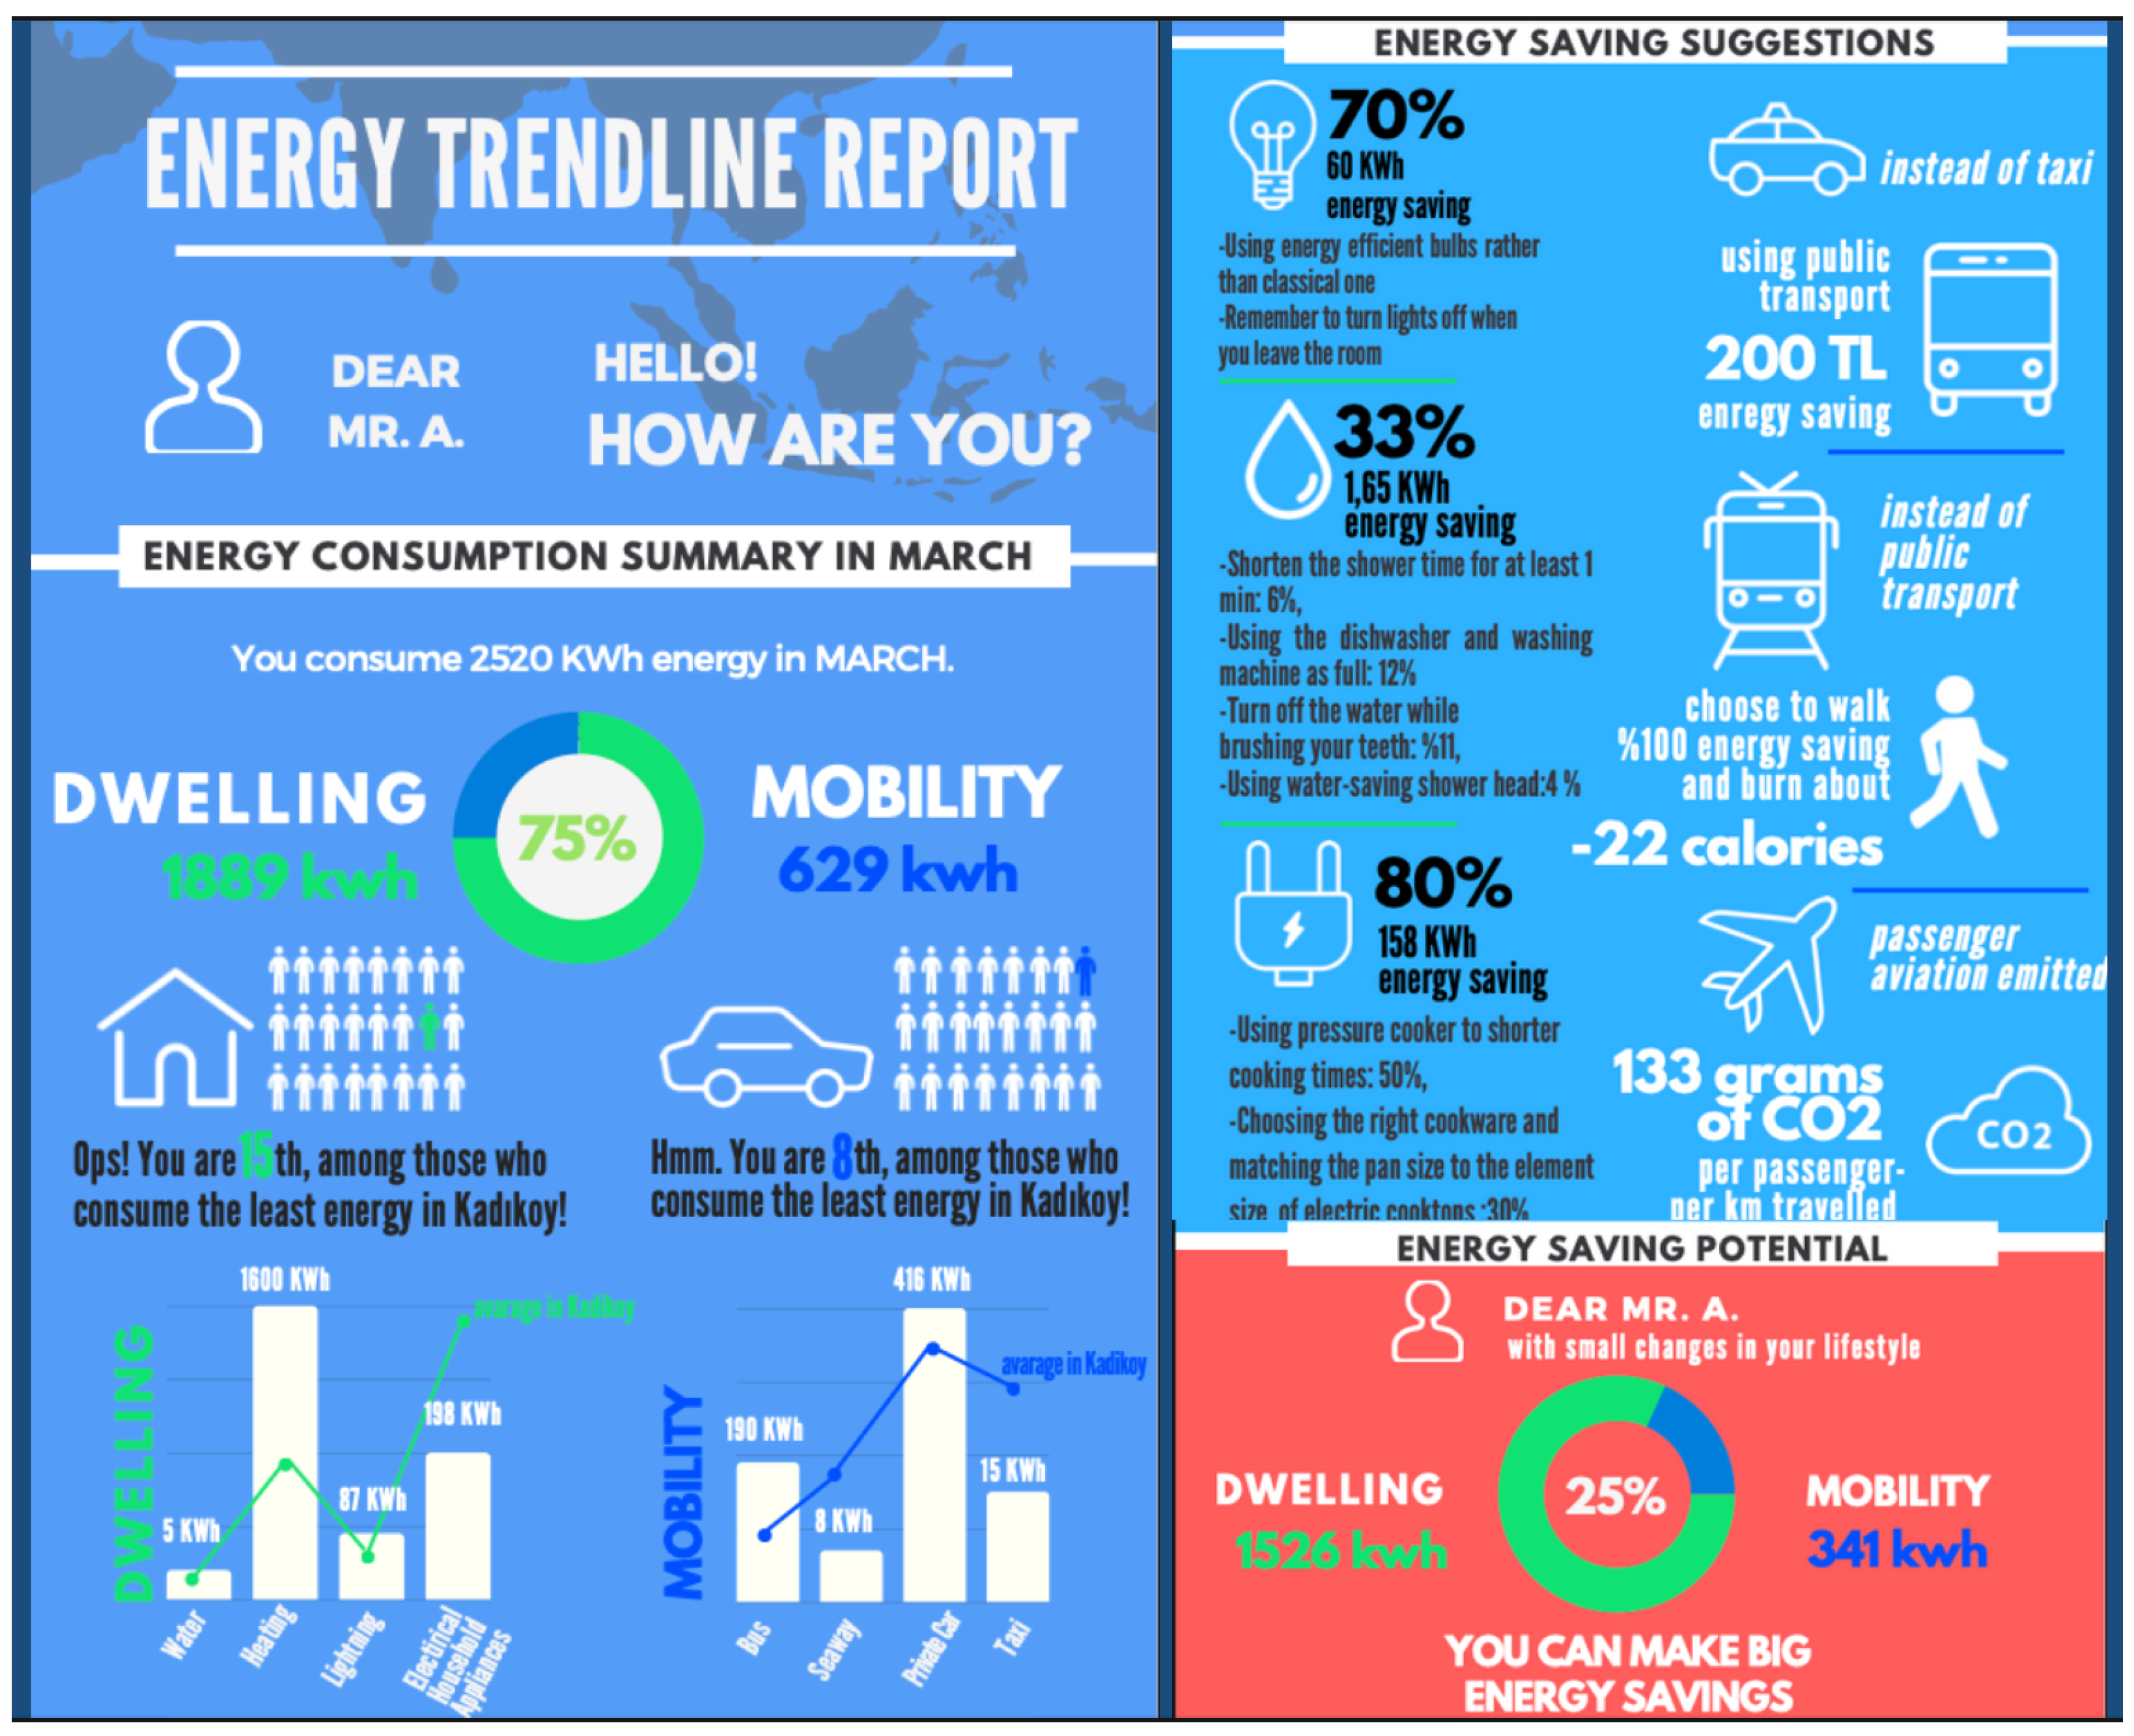
This study aims to understand the multidimensional dynamics of energy conservation behavior through feedback and interventions mechanism. In this context, the impacts of energy feedback mechanisms on energy conservation behavior are examined in the neighborhoods of the Kadikoy District in Istanbul, Turkey. Among the 39 districts in Istanbul, Kadikoy has been selected as a case study area because of its diversified socio-economic structure and due to the local authority’s initiatives, such as building regulations and recycling policies, aimed at reducing the district’s carbon footprint and energy use. According to the selection criteria of the study, 100 residents volunteered to participate in the research for a period of eight months. It is important to mention that all of the volunteers received comparative, historical, and goal-setting feedback, as well as face-to-face interventions (as a part of the feedback and intervention plan of the study) during the research period. Since the study was limited to measuring the effects of the feedback and intervention on energy conservation behavior, it was not possible to measure which feedback and interventions were more effective for volunteers. Another uncontrolled factor is whether the volunteers received the online interventions, such as emails and social media posts, or read the energy reports or energy bulletin. In addition, participation in face-to-face activities was optional. Moreover, the 100 volunteers filled out the ’Energy-Saving Behavioral Questionnaire’, specifically constructed in order to measure changing patterns of energy conservation behavior, two times: at the beginning (t1) and at the end of the experiment (t2). By the end of the survey period, energy conservation behavioral data had been collected from 100 volunteers and centralized in a database. To test the hypothesis, the present study used the following tests: reliability, normality, and paired sample t-test (using IBM SPSS Statistics V.26.) to test the effect of the feedback and interventions program on the change in multidimensional variables of energy conservation behavior at t1 and t2.
When comparing the two results, it can be seen that the energy conservation behavior scores of volunteers after the feedback and interventions (intention: M = 6.07, SD = 1.03; subjective norm: direct measurement M = 4.08, SD = 1.21; perceived behavioral control: indirect measurement M = 4.48, SD = 0.51) are statistically significantly higher than the energy conservation behavior scores of volunteers before the feedback and interventions (intention: M = 5.76, SD = 1.30; subjective norm: direct measurement M = 3.61, SD = 1.13; perceived behavioral control: indirect measurement M = 4.48, SD = 0.51). Moreover; the attitude (indirect measurement) variable of the energy conservation behavior scores of volunteers after the feedback and interventions (M = 5.09, SD = 0.63) were statistically significantly lower than the attitude (indirect measurement) variable of the energy conservation behavior scores before the feedback and interventions (M = 5.24, SD = 0.72). In summary, these results show that as a result of the feedback and intervention, volunteers reflect a relatively high behavioral intention as a first precursor to perform a behavior, which consists of expectations, wants, and decisions, in favor of energy conservation. Moreover, the subjective norm reflects the perceived social pressure of the participant’s social network groups, such as family, friends, neighbors, or the government. After feedback and interventions, 100 participants perceived slightly high social pressure about reducing their energy consumption levels.
Additionally, the effects of the feedback and intervention on the perceived behavioral control (control beliefs and influence behavior) score can be summarized as participants feeling more in control and feeling likeable to achieve reducing their energy consumption within the eight months. Another consequence of the effect of the feedback and interventions program is that the attitude (behavioral beliefs and outcome evaluations) score of the participants reflects a weak to moderate positive attitude toward reducing their energy consumption level at the end of the experiment. It is important to highlight that the participant’s attitude scores are positive at both t1 and t2. This can be explained by the fact that a positive (+) score means, overall, the participant is in favor of reducing their energy consumption level. However, there are several possible explanations for why the direct measurement of the attitude score of the participants is lower after the feedback and interventions, such as feedback frequency, external factors in the experimentation process, complexity of the tasks, etc. [66,68,72]. Further research should be undertaken to investigate when and how feedback about energy usage is more effective via a metadata analysis.
The empirical findings in this study provide a new understanding of empowering citizen participation in a smart city’s energy transition process through a data-driven feedback loop. The evidence from this study suggests that feedback and intervention mechanisms can boost or reduce an individual’s energy conservation behavior as the first level of the bottom-up energy transition approach in smart cities. Moreover, the study results can be used to develop targeted feedback and intervention mechanism aimed at dimensions of energy conservation behavior. In parallel with this, a special focus should be given to smart city applications, which are powerful tools for local governments to enable such a feedback and intervention mechanisms within the smart energy domain. However, considerably more work will need to be performed to determine the relationship between behavioral intention as the dependent variable and attitude, subjective norms, and perceived behavioral control as the predictor variables through a multiple regression procedure. Moreover, further research could clarify the link between actual energy consumption data and energy conservation behavior. This bottom-up energy transition approach will provide useful insights for the local government in empowering citizen participation and data-driven feedback loops.

Supplementary Materials

The following supporting information can be downloaded at: https://www.mdpi.com/article/10.3390/smartcities5040082/s1. Figure S1: The Energy-Saving behavioral Questionnaire.

Author Contributions

Conceptualization, R.C. and A.Ö.; methodology, R.C. and A.Ö.; software, R.C. and A.Ö.; validation, R.C. and A.Ö.; formal analysis, R.C. and A.Ö.; investigation, R.C. and A.Ö.; resources, R.C. and A.Ö.; data curation, R.C. and A.Ö.; writing—original draft preparation, R.C. and A.Ö.; writing—review and editing, R.C. and A.Ö.; visualization, R.C. and A.Ö.; supervision, R.C. and A.Ö.; project administration, R.C. and A.Ö. All authors have read and agreed to the published version of the manuscript.

Funding

This study did not receive external funding.

Institutional Review Board Statement

The study was approved by the Institutional Ethics Committee of Yildiz Technical University (E.1512290552 and 29 December 2015).

Informed Consent Statement

Informed consent was obtained from all volunteers involved in the study.

Data Availability Statement

The data presented in this study are available on request from the corresponding author. The data are not publicly available due to ethical restrictions and both EU’s and Turkey’s General Data Protection Regulation (GDPR) provisions.

Acknowledgments

This paper is part of an EU-ERANET co-fund (smart city) consortium project titled ‘Community Data-Loops for energy-efficient urban lifestyles (CODALoop)’ and supported by the Scientific and Technological Research Council of Turkey (TUBITAK), 116K011. We wish to thank TUBITAK, our CODALoop Partners, the Codaloop Turkey Research Team, the Yıldız Technical University Faculty of Architecture, and the Kadıkoy Municipality for their support in this research. We would also like to thank Zeynep Enlil and Selahattin Adil Sarıbay for their valuable insights and encouragement throughout the study.

Conflicts of Interest

The authors declare no conflict of interest.

Abbreviations

The following abbreviations are used in this manuscript:
UN-HabitatUnited Nations Human Settlements Programme
IEAInternational Energy Agency
CoMCovenant of Mayors
EEIPElectricity-Efficiency Improvement Project
TUIKTurkey Statistical Institute
ESRIEnvironmental Systems Research Institute
FITFeedback Intervention Theory
TPBTheory of Planned Behavior
INTIntention
ATTAttitude
PBCPerceived Behavioral Control
NBNeighborhood Belonging
CIConfidence Interval
IoTInternet of Things
VRVirtual Reality
AIArtificial Intelligence
AUAugmented Reality
Crowd-IoTCrowdsourcing Internet of Things

References

  1. United Nations Human Settlements Programme (UN-Habitat). Cities and Climate Change: Global Report on Human Settlements; Routledge: London, UK, 2011. [Google Scholar]
  2. United Nations Human Settlements Programme (UN-Habitat). Strategies for Improving The Urban Energy Situation. 2022. Available online: https://unhabitat.org/topic/energy#:~:text=To%20run%20their%20activities%2C%20cities,the%20world’s%20total%20greenhouse%20gases (accessed on 16 September 2022).
  3. Ceylan, R.; Velioğlu, A.; Hatipoğlu, I.; Ozbakir, A.; Enlil, Z. Building a smart community in Kadiköy, Istanbul. From Efficiency to Reduction: Tackling Energy Consumption in Across Disciplinary Perspective in Planning; Savini, F., Pineda Revilla, B., Pfeffer, K., Bertolini, L., Eds.; InPlannning: Utrecht, The Netherlands, 2019; pp. 39–67. [Google Scholar]
  4. The International Energy Agency (IEA). Largest End Uses of Energy by Sector in Selected IEA Countries. 2018. Available online: https://www.iea.org/data-and-statistics/charts/largest-end-uses-of-energy-by-sector-in-selected-iea-countries-2018-2 (accessed on 3 April 2022).
  5. Donella, M.; Jorgen, R.; Dennis, L. Limits to Growth. The 30-Year Update; Chelsea Green Publishing Company: Chelsea, MI, USA, 2004. [Google Scholar]
  6. Beatley, T. Green Urbanism: Learning from European Cities; Island Press: Washington, DC, USA, 2012. [Google Scholar]
  7. Field, C.B.; Barros, V.R.; Mastrandrea, M.D.; Mach, K.J.; Abdrabo, M.A.-K.; Adger, N.; Anokhin, Y.A.; Anisimov, O.A.; Arent, D.J.; Barnett, J.; et al. Summary for policymakers: Impacts, Adaptation, and Vulnerability. Part A: Global and Sectoral Aspects. Contribution of Working Group II to the Fifth Assessment Report of the Intergovernmental Panel on Climate Change (IPCC); Cambridge University Press: Cambridge, UK; New York, NY, USA, 2014; pp. 3–30. [Google Scholar]
  8. Khansari, N.; Mostashari, A.; Mansouri, M. Conceptual Modeling of The Impact of smart cities On Household Energy Consumption. Procedia Comput. Sci. 2014, 28, 81–86. [Google Scholar] [CrossRef] [Green Version]
  9. Wheeler, S.; Beatley, T. Sustainable Urban Development Reader, 3rd ed.; Routledge: London, UK, 2014. [Google Scholar]
  10. Yeldan, E.; Voyvoda, E. Low Carbon Development Pathways and Priorities for Turkey; WWF Turkey And Istanbul Policy Center: Istanbul, Turkey, 2015; pp. 11–47. [Google Scholar]
  11. Hoegh-Guldberg, O.; Jacob, D.; Bindi, M.; Brown, S.; Camilloni, I.; Diedhiou, A.; Djalante, R.; Ebi, K.; Engelbrecht, F.; Guiot, J.; et al. Global Warming of 1.5 °C: Impacts of 1.5 Degree Global Warming on Natural and Human Systems; Intergovernmental Panel on Climate Change, IPCC Secretariat: Helsinki, Finland, 2018; pp. 14–36. [Google Scholar]
  12. McLaren, D.; Agyeman, J. Sharing Cities: A Case for Truly Smart And Sustainable Cities; MIT Press: Cambridge, MA, USA, 2015. [Google Scholar]
  13. International Energy Agency (IEA). IEA’s Executive Director Fatih Birol Speech: Decarbonisation, Energy Security, and the Scale and Pace of the Transition. In Proceedings of the Sydney Energy Forum, Sydney, Australia, 12–13 July 2022. [Google Scholar]
  14. Jong, M.; Graaf, T. Europe’s energy transition will disarm Putin. GIES Occas. Pap. 2022, 1, 41–44. [Google Scholar]
  15. European Commission. REPowerEU: Joint European Action for More Affordable, Secure and Sustainable Energy. 2022. Available online: https://ec.europa.eu/commission/presscorner/detail/en/ip_22_1511 (accessed on 21 September 2022).
  16. Ministry of Energy and National Resources (MENR), Strategic Plan. 2018. Available online: https://www.enerji.gov.tr/tr-TR/Stratejik-Plan (accessed on 10 August 2019).
  17. TMMOB Elektrik Mühendisleri Odası. Enerji Verimliliği Raporu; EMO Yayınları: Ankara, Turkey, 2012; pp. 35–45. [Google Scholar]
  18. Doğan, H.; Yılankıran, N. Türkiye’nin Enerji Verimliliği Potansiyeli Ve Projeksiyonu. Gazi Univ. J. Sci. Part C Des. Technol. 2015, 3, 375–384. [Google Scholar]
  19. Shukla, P.R.; Skea, J.; Slade, R.; Khourdajie, A.A.; Van Diemen, R.; McCollum, D.; Pathak, M.; Some, S.; Vyas, P.; Fradera, R.; et al. Climate Change 2022: Mitigation of Climate Change; Cambridge University Press: Cambridge, UK; New York, NY, USA, 2020; pp. 1516–1519. [Google Scholar]
  20. Frei, C.; Whitney, R.; Schiffer, H.; Rose, K.; Rieser, D.; Al-Qahtani, A.; Ayed, T.; Philip, T.; Hal, D.; Panos, E.; et al. World Energy Scenarios: Composing Energy Futures to 2050; Conseil Francais de l’energie: Paris, France, 2013. [Google Scholar]
  21. Clemencon, R. The Two Sides of The Paris Climate Agreement: Dismal Failure or Historic Breakthrough? J. Environ. Dev. 2016, 25, 3–24. [Google Scholar] [CrossRef] [Green Version]
  22. Dall-Orsoletta, A.; Cunha, J.; Araújo, M.; Ferreira, P. A systematic review of social innovation and community energy transitions. Energy Res. Soc. Sci. 2022, 88, 102625. [Google Scholar] [CrossRef]
  23. Hollands, R. Will The Real smart city Please Stand Up?: Intelligent, Progressive or Entrepreneurial? In The Routledge Companion to Smart Cities; Routledge: London, UK, 2020; pp. 179–199. [Google Scholar]
  24. Nam, T.; Pardo, T. Conceptualizing smart city with Dimensions of Technology, People, And Institutions. In Proceedings of the 12th Annual International Digital Government Research Conference: Digital Government Innovation in Challenging Times, College Park, MD, USA, 12–5 June 2011. [Google Scholar]
  25. Townsend, A. Smart Cities: Big Data, Civic Hackers, and the Quest for a New Utopia; WW Norton & Company: New York, NY, USA; London, UK, 2013; pp. 93–115. [Google Scholar]
  26. Eger, J. The Creative Community: Forging the Links between Art Culture Commerce & Community; San Diego State University: San Diego, CA, USA, 2003; pp. 4–31. [Google Scholar]
  27. Eger, J. Smart communities, Universities, and Globalization: Educating The Workforce For Tomorrow’s Economy. Metrop. Univ. 2005, 16, 28–38. [Google Scholar]
  28. Budde, P. Smart Cities of Tomorrow. In Cities for Smart Environmental and Energy Futures. Energy Systems; Rassia, S., Pardalos, P., Eds.; Springer: Berlin/Heidelberg, Germany, 2014; pp. 9–20. [Google Scholar]
  29. Komninos, N. Intelligent Cities: Innovation, Knowledge Systems and Digital Spaces; Routledge: New York, NY, USA, 2013; pp. 181–201. [Google Scholar]
  30. Borsekova, K.; Vanova, A.; Vitalisova, K. The Power of communities In Smart Urban Development. Procedia-Soc. Behav. Sci. 2016, 223, 51–57. [Google Scholar] [CrossRef] [Green Version]
  31. Colding, J.; Barthel, S.; Sörqvist, P. Wicked problems of smart cities. Smart Cities 2019, 2, 512–521. [Google Scholar] [CrossRef] [Green Version]
  32. Nasralla, M. Sustainable virtual reality patient rehabilitation systems with IoT sensors using virtual smart cities. Sustainability 2021, 13, 4716. [Google Scholar] [CrossRef]
  33. Sobnath, D.; Rehman, I.; Nasralla, M. Smart cities to improve mobility and quality of life of the visually impaired. In Technological Trends in Improved Mobility of the Visually Impaired; Springer: Cham, Switzerland, 2020; pp. 3–28. [Google Scholar]
  34. Ang, K.; Seng, J.; Ngharamike, E. Towards crowdsourcing internet of things (crowd-iot): Architectures, security and applications. Future Internet 2022, 14, 1–50. [Google Scholar] [CrossRef]
  35. Motta, G.; You, L.; Sacco, D.; Ma, T. City feed: A crowdsourcing system for city governance. In Proceedings of the 2014 IEEE 8th International Symposium on Service Oriented System Engineering, Oxford, UK, 7–11 April 2014; pp. 439–445. [Google Scholar]
  36. Steg, L.; Vlek, C. Encouraging Pro-Environmental behavior: An Integrative Review and Research Agenda. J. Environ. Psychol. 2009, 29, 309–317. [Google Scholar] [CrossRef]
  37. Heiskanen, E.; Johnson, M.; Robinson, S.; Vadovics, E.; Saastamoinena, M. Low-Carbon communities as a Context For Individual behavioral Change. Energy Policy 2010, 38, 7586–7595. [Google Scholar] [CrossRef]
  38. Abrahamse, W.; Steg, L. How Do Socio-Demographic And Psychological Factors Relate To Households’ Direct and Indirect Energy Use And Savings? J. Econ. Psychol. 2009, 30, 711–720. [Google Scholar] [CrossRef]
  39. Van Raaij, W.; Verhallen, T. A Behavioral Model of Residential Energy Use . J. Econ. Psychol. 1983, 3, 39–63. [Google Scholar] [CrossRef] [Green Version]
  40. Becker, L.; Seligman, C.; Fazio, R.; Darley, J. Relating Attitudes To Residential Energy Use. Environ. Behav. 1981, 13, 590–609. [Google Scholar] [CrossRef]
  41. Abrahamse, W.; Steg, L.; Vlek, C.; Rothengatter, T. The Effect of Tailored Information, Goal Setting, And Tailored Feedback on Household Energy Use, Energy-Related Behaviors, and behavioral antecedents. J. Environ. Psychol. 2007, 27, 265–276. [Google Scholar] [CrossRef]
  42. Tonglet, M.; Phillips, P.; Read, A. Using the Theory of Planned behavior To Investigate The Determinants of Recycling behavior: A Case Study from Brixworth, UK. Resour. Conserv. Recycl. 2004, 41, 191–214. [Google Scholar] [CrossRef]
  43. Macovei, O. Applying The Theory of Planned Behavior In Predicting Proenvironmental behavior: The Case of Energy Conservation. Œconomica 2015, 11, 15–32. [Google Scholar]
  44. Stieninger, P. Changing Human Behavior Towards Energy Saving Through Urban Planning: Creation of A New Planning Approach. Lessons Learned From Europe And North America. Ph.D. Thesis, Vienna University of Technology, Vienna, Austria, 2013. [Google Scholar]
  45. Kano, C. Behavioral Change For Energy Conservation: Case Study of Post-Fukushima Experience in Japan. Master’s Thesis, Uppsala University, Uppsala, Sweden, 2013. [Google Scholar]
  46. Kollmuss, A.; Agyeman, J. Mind The Gap: Why Do People Act Environmentally and What Are the Barriers to Pro-Environmental Behavior? Environ. Educ. Res. 2002, 8, 239–260. [Google Scholar] [CrossRef] [Green Version]
  47. Ajzen, I. Constructing A Theory of Planned behavior Questionnaire. 2006. Available online: https://www.researchgate.net/publication/235913732_Constructing_a_Theory_of_Planned_Behavior_Questionnaire (accessed on 18 February 2020).
  48. Francis, J.; Eccles, M.; Johnston, M.; Walker, A.E.; Grimshaw, J.M.; Foy, R.; Kaner, E.F.S.; Smith, L.; Bonetti, D. Constructing Questionnaires Based on the Theory of Planned Behavior: A Manual for Health Services Researchers; Centre for Health Services Research, University of Newcastle upon Tyne: Newcastle upon Tyne, UK, 2004; pp. 2–43. [Google Scholar]
  49. Fishbein, M.; Ajzen, I. Belief, Attitude, Intention and behavior: An Introduction to Theory and Research; Addison-Wesley: Reading, MA, USA, 1975; pp. 129–381. [Google Scholar]
  50. Ajzen, I. From Intentions to Actions: A Theory of Planned Behavior. In Action Control; Kuhl, J., Beckmann, J., Eds.; SSSP Springer Series in Social Psychology; Springer: Berlin/Heidelberg, Germany, 1985; pp. 11–39. [Google Scholar]
  51. Ajzen, I.; Fishbein, M. The Influence of Attitudes on Behavior. In The Handbook of Attitudes; Albarracín, D., Johnson, B.T., Zanna, M.P., Eds.; Lawrence Erlbaum Associates Publishers: Mahwah, NJ, USA, 2005; pp. 173–221. [Google Scholar]
  52. Kadikoy Municipality. Sustainable Energy Action Plan 2010–2020. 2013. Available online: https://mycovenant.eumayors.eu/docs/seap/4492_1372677782.pdf (accessed on 19 September 2020).
  53. Istanbul Büyükşehir Belediyesi (IBB); Iklim Istanbul; ISTAC. Istanbul Climate Change Action Plan Summary Report. 2018. Available online: https://www.iklim.istanbul/wp-content/uploads/_Raporu.pdf (accessed on 19 December 2020).
  54. Turkey Statistical Institute (TUIK). Demographic Database of Istanbul. 2019. Available online: https://www.tuik.gov.tr/ (accessed on 12 July 2019).
  55. Veri Arastirma Consulting Firm. Istanbul Neighborhood Database. 2014. Available online: https://veriarastirma.com/en/main-page/ (accessed on 19 December 2018).
  56. Kadikoy Municipality. Participants and Volunteering Network of Kadikoy District. 2005. Available online: https://www.kadikoybelediyesigonulluleri.com/altsayfa.aspx?id=2592 (accessed on 6 June 2022).
  57. Ajzen, I. The Theory of Planned behavior: Reactions and Reflections. J. Econ. Psychol. 2011, 26, 1113–1127. [Google Scholar]
  58. Ajzen, I. Perceived Behavioral Control, self-efficacy, locus of control, and the theory of planned behavior. J. Appl. Soc. Psychol. 2002, 32, 665–683. [Google Scholar] [CrossRef]
  59. Read, D.; Brown, R.; Thorsteinsson, E.; Morgan, M.; Price, I. The theory of planned behavior as a model for predicting public opposition to wind farm developments. J. Environ. Psychol. 2013, 36, 70–76. [Google Scholar] [CrossRef]
  60. Huong, N.; Anderson, D.; Dunne, M. Development and validation of a questionnaire to mmeasure health professionals’ attitudes toward identification of female victimes of domestic violence. Health 2015, 7, 596–605. [Google Scholar]
  61. Kağıtçıbaşı, Ç. Gençlerin Tutumları: Kültürler Arası bir Karşılaştırma; Orta Doğu Teknik Üniversitesi Geliştirme Vakfı, Orta Doğu Üniversitesi: Ankara, Türkiye, 1973; pp. 36–132. [Google Scholar]
  62. Dervişoğlu, S.; Kılıç, D. Planlanmış Davranış Teorisi Çerçevesinde Geliştirilen Su Tasarrufu Davranışı Anketi. In Proceedings of the Ulusal Fen Bilimleri Ve Matematik Eğitimi Kongresi, Niğde, Turkey, 27–30 June 2012. [Google Scholar]
  63. Tekkaya, C.; Kılıç, D.; Şahin, E. Geri dönüşüm davranışının Planlanmış Davranış Teorisi ile açıklanması: Sürdürülebilir Bir Kampüs İçin Geri Dönüşüm Anketi. In Proceedings of the 2nd International Conference on New Trends in Education and Their Implications, Antalya, Turkey, 27–29 April 2011. [Google Scholar]
  64. Erten, S. Kız ve erkek öğrencilerin evde enerji tasarrufu yapma davranış amaçlarının planlanmış davranış teorisi yardımıyla araştırılması. Hacettepe Üniversitesi Eğitim Fakültesi Derg. 2002, 22, 67–73. [Google Scholar]
  65. Siero, F.; Bakker, A.; Dekker, G.; Gerda, B.; Van Den, B.; Marcel, T. Changing organizational energy consumption behavior through comparative feedback. J. Environ. Psychol. 1996, 16, 235–246. [Google Scholar] [CrossRef] [Green Version]
  66. Kluger, A.; DeNisi, A. The effects of feedback interventions on performance: A historical review, a meta-analysis, and a preliminary feedback intervention theory. Psychol. Bull. 1996, 119, 254–284. [Google Scholar] [CrossRef]
  67. Hattie, J.; Timperley, H. The power of feedback. Rev. Educ. Res. 2007, 77, 81–112. [Google Scholar] [CrossRef]
  68. Karlin, B.; Zinger, J.; Ford, R. The effects of feedback on energy conservation: A meta-analysis. Psychol. Bull. 2015, 141, 1205–1227. [Google Scholar] [CrossRef]
  69. McCalley, L.; Midden, C. Energy conservation through product-integrated feedback: The roles of goal-setting and social orientation. J. Econ. Psychol. 2002, 23, 589–603. [Google Scholar] [CrossRef]
  70. Tang, T.; Bhamra, T. Changing Energy Consumption behavior Through Sustainable Product Design. In Proceedings of the 10th International Design Conference, Dubrovnik, Croatia, 19–22 May 2008. [Google Scholar]
  71. Petkov, P.; Köbler, F.; Foth, M.; Krcmar, H. Motivating Domestic Energy Conservation Through Comparative, Community-based Feedback in Mobile and Social Media. In Proceedings of the 5th International Conference on Communities and Technologies, Brisbane, Australia, 29 June–2 July 2011. [Google Scholar]
  72. Darby, S. The effectiveness of feedback on energy consumption. Rev. Defra Lit. Metering Billing Direct Displays 2006, 486, 1–22. [Google Scholar]
  73. Geels, F.; Elzen, B.; Green, K. General introduction: System innovation and transitions to sustainability. In System Innovation and the Transition to Sustainability: Theory, Evidence And Policy; Edward Elgar Cheltenham: Cheltenham, UK, 2004; pp. 1–16. [Google Scholar]
  74. Switzer, A.; Bertolini, L.; Grin, J. Transitions of mobility systems in urban regions: A heuristic framework. J. Environ. Policy Plan. 2013, 15, 141–160. [Google Scholar] [CrossRef]
  75. Hair, J.; Black, W.; Babin, B.; Anderson, R.E. Multivariate Data Analysis; Pearson Education Limited: Upper Saddle River, NJ, USA, 2010. [Google Scholar]
  76. Tabachnick, B.; Fidell, L.; Ullman, J. Using Multivariate Statistics, 6th ed.; Pearson: Boston, MA, USA, 2007. [Google Scholar]
  77. Cohen, J. Statistical Power Analysis for the Behavioral Sciences; Academic Press: New York, NY, USA, 1988. [Google Scholar]
  78. Steg, L.; Perlaviciute, G.; Werff, E. Understanding the human dimensions of a sustainable energy transition. Front. Psychol. 2015, 6, 1–17. [Google Scholar] [CrossRef] [PubMed]
  79. Yumurtaci, Z.; Dönmez, A. Konutlarda enerji verimliliği. Mühendis Ve Makina 2013, 2, 38–43. [Google Scholar]
Figure 1. The Theory of Reasoned Action and Theory of Planned Behavior (the figure was created by using resource of Ajzen and Fishbein, 2005 [51]).
Smartcities 05 00082 g001
Figure 2. Population Classification (Equal Interval) of Neighborhoods in Kadikoy District (map was produced based on demographic database of TUIK, 2019 [54]).
Smartcities 05 00082 g002
Figure 3. Demographic Indicators of Case Study Area (Figure was produced based on demographic databases of Turkey Statistical Institute (TUIK) (2019) [54] and Veri Arastirma Consulting Firm (2014) [55]).
Smartcities 05 00082 g003
Figure 4. Integrated and Participatory Climate Action Plan of Kadikoy District (map was created based on database of Kadikoy Municipality, 2013 [52]).
Smartcities 05 00082 g004
Figure 5. Participants and Volunteering Network of Kadikoy District (map was created by using Survey123 location data of 100 volunteers (via ESRI software) and Volunteer House data [56]).
Smartcities 05 00082 g005
Figure 6. Socio-demographic characteristics of volunteers—a screenshot from dashboard of Survey123 (Figure was created by using Survey123 system of ESRI software).
Smartcities 05 00082 g006
Figure 7. Energy Trendline Report was designed as a part of the feedback and interventions of the study.
Smartcities 05 00082 g007
Table 1. Intention (the table was created by using resource of Ajzen and Fishbein, 2005) [51].
Predictor VariableQuestionnaire ItemsScaleAdapted From
Intention (INT)I expect to reduce my energy consumption within the next 6 months7-point Likert Scale: 1 (strongly disagree)–7 (strongly agree)Francis et al. (2004), Ajzen (2002) [48,58]
I want to reduce my energy consumption within the next 6 months
I intend to reduce my energy consumption within the next 6 months.
Table 2. Attitude (the table was created by using resource of Ajzen and Fishbein, 2005 [51]).
Predictor VariableQuestionnaire ItemsScaleAdapted From
Direct measurement of: Attitude (ATT)Reducing my energy consumption within the next 6 months would be...7-point Semantic Differential: 1 harmful–7 beneficial/7-point Semantic Differential: 1 pleasant–7 unpleasant/7-point Semantic Differential: 1 the wrong thing to do–7 the right thing to do/7-point Semantic Differential: 1 good practice–7 bad practiceFrancis et al. (2004), Ajzen (1985), Ajzen (2002) [48,50,58]
Components of Attitude: Behavioral BeliefsIf I reduce my energy consumption, I will contribute to the protection of the natural resources./If I reduce my energy consumption, I will be saving money./If I reduce my energy consumption, I have to change my lifestyle./It causes a lot of worry and concern about the future of natural resources, if I reduce my energy consumption7-point Likert Scale:1 unlikely–7 likelyFrancis et al. (2004), Ajzen (1985), Ajzen (2002) [48,50,58]
Components of Attitude: Outcome EvaluationsContributing to the protection of the natural resources is.../Saving money is.../Changing my lifestyle is.../Causing a lot of worry and concern about the future of natural resources is...7-point Likert Scale: −3 extremely undesirable–+3 extremely desirableFrancis et al. (2004) [48]
Table 3. Subjective Norms (the table was created by using resource of Ajzen and Fishbein (2005) [51]).
Predictor VariableQuestionnaire ItemsScaleAdapted From
Direct measurement of Subjective Norms (SN)Most people who are important to me think that I should or should not reduce my energy consumption.7-point Likert Scale: 1 should–7 should notFrancis et al. (2004) [48]
Direct measurement of Subjective NormsIt is expected of me that I reduce my energy consumption./I feel under pressure of social media to reduce my energy consumption./I feel under social pressure to reduce my energy consumption./People who are important to me want me to reduce my energy consumption.7-point Likert Scale: 1 strongly disagree–7 strongly agreeFrancis et al. (2004) [48]
Components of Subjective Norms: Normative BeliefsMy family thinks I should/should not reduce my energy consumption./The government/Municipality would approve/disapprove of my reducing energy consumption./My friends would approve/disapprove of my reducing energy consumption./My neighbors do/do not reduce their energy consumption.7-point Likert Scale: −3 should not–+3 shouldFrancis et al. (2004), Ajzen (2002) [48,58]
Components of Subjective Norms: Motivation to complyDoing what my family thinks I should do is important to me./The government/Municipality’s approval of reducing my energy consumption is important to me./The approval of my friends is important to me./Doing what other neighbors do is important to me.7-point Likert Scale: 1 not at all–7 very much (extremely)Francis et al. (2004) [48].
Table 4. Perceived Behavioral Control (the table was created by using resource of Ajzen and Fishbein (2005) [51]).
Predictor VariableQuestionnaire ItemsScaleAdapted From
Direct measurement of Perceived Behavioral Control (PBC): Self efficacyI am confident that I could reduce my energy consumption if I wanted to/For me to reduce my energy consumption is..7-point Likert Scale: 1 should–7 should not /7-point Likert Scale: 1 easy–7 difficultFrancis et al. (2004) [48]
Direct measurement of Perceived Behavioral Control: ControllabilityThe decision to reduce my energy consumption is beyond my control/Whether I reduce my energy consumption or not is entirely up to me.7-point Likert Scale: 1 strongly disagree–7 strongly agreeFrancis et al. (2004) [48]
Components of Perceived Behavioral Control: Control BeliefsEnergy calculator of the Platform is complicated for me./Using alternative energy resources is very important for reducing energy consumption./When I am reducing my energy consumption I feel that I am forced to change my habits./Energy efficient appliances do not have reasonable prices.7-point Likert Scale: 1 unlikely–7 likelyFrancis et al. (2004), Ajzen (2002) [48,58]
Components of Perceived Behavioral Control: Influence BehaviorI am ... to reduce my energy consumption if the energy calculator platforms are complicated for me./I am ... to reduce my energy consumption if I try energy-saving suggestions./I am...to reduce my energy consumption if I feel that I am forced to change my habit./I am ... to reduce my energy consumption if energy efficient appliances do not have reasonable price.7-point Likert Scale: −3 less likely–+3 more likelyFrancis et al. 2004 [48]
Table 5. Socio-structural and Demographic Questions (the table was created by using resource of Ajzen and Fishbein, 2005 [51]).
Predictor VariableQuestionnaire ItemsScaleAdapted From
Socio-structural and Demographic QuestionsWhat gender do you identify as?/What is your age?/What is your current employment status?/What is the highest degree or level of school you have completed?/What is your monthly household income?/How many people are in your household?/What is the name of your neighborhood?Multiple ChoiceFrancis et al. (2004), Ajzen (2002), Siero et al. (1996) [48,58,65]
Table 6. Neighborhood Belonging (the table was created by using resource of Ajzen and Fishbein, 2005 [51]).
Predictor VariableQuestionnaire ItemsScaleAdapted From
Neighborhood Belonging (NB)If I have to act with my neighbors, I can reduce my energy consumption./I am curious about energy consumption of other neighborhoods in Kadıkoy./Energy consumption level of other neighborhoods affects my energy consumption./My social media network affects me to reduce my energy consumption./Government support and approval is very important for me to reduce my energy consumption.7-point Likert Scale: 1 strongly disagree–7 strongly agree/7-point Likert Scale: 1 not at all–7 very much (extremely)Siero et al. (1996), Ajzen, (2002) [58,65]
Table 7. Scoring Key for Energy-Saving Behavioral Questionnaire (the table was created by using the resource of Ajzen and Fishbein, 2005 [51]).
Question NumbersResponse FormatItems Requiring MultiplicationConstruct Measured
33, 18, 401 to 7 Generalized Intention
20 to 231 to 7 Attitudes (Direct Measure)
1 to 41 to 71 × 9; 2 × 10;Behavioral Beliefs
9 to 12−3 to +33 × 11; 4 × 12Outcome evaluations
5 to 81 to 75 × 28; 6 × 29;Control Belief Strength
28 to 31−3 to +37 × 30; 8 × 31Control Belief Power
24 to 271 to 713 × 24; 14 × 25;Motivation to comply
13 to 16−3 to +315 × 26; 16 × 27Normative Beliefs
32, 38, 17, 34, 191 to 7 Subjective Norms (Direct Measure)
41 to 451 to 7 Neighborhood Belonging
39, 36, 37, 351 to 7 Perceived Behavioral Control (direct measure)
Table 8. Feedback and Intervention Plan.
Intervention NameObjective of the InterventionTotal Number of Interventions and FrequencyNumber of ParticipantsFeedback TypeTarget Scale
Energy Trendline ReportProviding personalized energy-saving suggestions for the next month8/every month100Comparative, Goal-SettingAt individual scale.
Scientific Text on energy efficient lifestyle (news, papers, etc.) via emails and social media postsProviding awareness on energy efficiency through scientific knowledge.32/every week100Comparative, Goal-SettingAt individual scale.
Movie NightProviding consciousness on energy efficient lifestyle through visual feedbacks1/once10–20InteractiveAt community scale.
My Energy Story NightOffering a stage to express their energy saving story.1/once10–20InteractiveAt community scale.
Table 9. Paired Samples Statistics between Pre-feedback and interventions and Post-feedback Scores of the Experimental Group.
Direct Measuresn 1Mean 1SD 1n 2Mean 2SD 2tdfSig. (2-Tailed)
INT1005.761.31006.071.03−2.75990.00 *
ATT1006.211.141006.400.97−1.69990.09
SN1003.611.131004.081.21−4.07990.00 *
PBC1005.201.261005.281.220.67990.50
NB1004.221.441004.421.43−1.45990.14
Indirect Measures (Belief-Based Measures)n1Mean1SD1n2Mean2SD2tdfSig. (2-Tailed)
ATT/Behavioral Beliefs and Outcome Evaluations1005.240.721005.090.632.29990.02 *
SN/Normative Beliefs and Motivation to Comply1005.130.991005.250.96−1.17990.24
PBC/Control Beliefs and Influence Behavior1004.790.731004.480.513.60990.00
1 t1 (before the feedback and interventions program). 2 t2 (after the feedback and interventions program). * Significant at a confidence level of p < 0.05. Statistical results are reported in APA style using the symbol n for the total sample size, SD for the standard deviation, t for t-statistic df for degrees of freedom, and Sig. (2-tailed) for two-tailed p-value.
Table 10. Results of the Paired Samples t-tests between Pre-feedback and interventions and Post-feedback Scores of the Experimental Group.
Direct MeasuresMeanSDSE95% CI Lower95% CI UppertdfSig. (2-Tailed)
INT−0.301.100.11−0.520.08−2.75990.00 *
ATT−0.191.150.11−0.420.03−1.69990.09
SN−0.471.150.11−0.690.24−4.07990.00 *
PBC−0.081.180.11−0.310.150.67990.50
NB−0.201.370.13−0.470.07−1.45990.14
Indirect Measures (Belief-Based Measures)MeanSDSE95% CI Lower95% CI UppertdfSig. (2-Tailed)
ATT/Behavioral Beliefs and Outcome Evaluations0.150.680.060.200.292.29990.02 *
SN/Normative Beliefs and Motivation to Comply−0.121.060.100.330.08−1.17990.24
PBC/Control Beliefs and Influence Behavior0.300.850.080.130.473.60990.00 *
* Significant at a confidence level of p < 0.05. Statistical results are reported in APA style using the symbol SD for the standard deviation, SE for Std Error Mean, 95% CI Lower and 95% CI Upper for 95% Confidence Interval of the Difference, t for t-statistic df for degrees of freedom, and Sig. (2-tailed) for two-tailed p-value.
Table 11. Results of the Paired Samples t-tests between Pre-feedback and interventions and Post-feedback Scores of the Experimental Group.
Cognitive Measures of Energy Conservation BehaviortnSig. (2-Tailed)Effect Size(d)Effect Size Groups
INT−2.751000.00 *0.27Small
ATT/Behavioral Beliefs and Outcome Evaluations2.291000.024 *0.22Small
SN−4.071000.00 *0.40Medium
PBC/Control Beliefs and Influence Behavior3.601000.00 *0.35Medium
* Significant at a confidence level of p < 0.05. Statistical results are reported in APA style using the symbol t for t-statistic, n for the total sample size, and Sig. (2-tailed) for two-tailed p-value.
Publisher’s Note: MDPI stays neutral with regard to jurisdictional claims in published maps and institutional affiliations.

