Article

Perceptions on Smart Gas Meters in Smart Cities for Reducing the Carbon Footprint

1
Information Technology Group, Wageningen University and Research, Leeuwenborch, Hollandseweg 1, 6706 KN Wageningen, The Netherlands
2
Department of Electrical, Electronic and Computer Engineering, Central University of Technology, 20 President Brandt Street, Bloemfontein 9300, South Africa
*
Author to whom correspondence should be addressed.
Smart Cities 2020, 3(4), 1173-1186; https://doi.org/10.3390/smartcities3040058
Submission received: 17 September 2020 / Revised: 8 October 2020 / Accepted: 8 October 2020 / Published: 13 October 2020
(This article belongs to the Special Issue Feature Papers for Smart Cities)

Abstract

:
Carbon emission is a prominent issue, and smart urban solutions have the technological capabilities to implement change. The technologies for creating smart energy systems already exist, some of which are currently under wide deployment globally. By investing in energy efficiency solutions (such as the smart meter), research shows that the end-user is able to not only save money, but also reduce their household’s carbon footprint. Therefore, in this paper, the focus is on the end-user, and adopting a quantitative analysis of the perception of 1365 homes concerning the smart gas meter installation. The focus is on linking end-user attributes (age, education, social class and employment status) with their opinion on reducing energy, saving money, changing home behaviour and lowering carbon emissions. The results show that there is a statistical significance between certain attributes of end-users and their consideration of smart meters for making beneficial changes. In particular, the investigation demonstrates that the employment status, age and social class of the homeowner have statistical significance on the end-users’ variance; particularly when interested in reducing their bill and changing their behaviour around the home.

Graphical Abstract

1. Introduction

Our urban and residential areas have become far more technological and digitally revolutionised [1]. Long-standing amenities have now become enhanced, driven by data analytics. Examples include the smart grid for optimised energy management integrated with information communication technologies [2]; multifaceted intelligent control systems for traffic flow control [3]; emergency management and public security systems [4]; electronic health records for both hospital management systems and efficient patient processing [5]; and Internet of Things (IoT) sensor integration for multifaceted data collection opportunities [6]. Other less mainstream services, such as e-grocery, referring to the online ordering of produce being directly delivered to the customer [7] (the benefits of which were particularly evident as a supply solution during the Covid-19 pandemic) and drone-based delivery for food products and parcels (direct from the supplier to the customer), are capable of improving delivery times and transforming the way distribution networks operate [8]. Both of which are regularly documented in the media and pose urban logistical challenges for the future.
The technological changes are the product of many complex social paradigms. One of which being the need to reduce our carbon footprint, creating cleaner sources of energy or energy efficient services. As countries begin to adapt to climate change and consider the impact they have on the environment (for example the UK government’s ambition to have a net zero emission by 2050 [9]), smart-city technologies provide an ideal solution for creating energy-efficient and sustainable cultures [10]. Smart systems have resulted in more opportunities than ever before for data scientists and technologists to create intelligent services which have significant advantages for reducing carbon emissions. The smart meter, as part of the smart grid, is a particular example [11]. Evidence suggests that residential buildings are responsible for contributing significantly towards global energy consumption [12]. As an integral (and well known) part of the smart grid infrastructure, smart meters now have a core role in reducing costs for the consumer and utility company and tremendous environmental benefits. Therefore, research into the recognition of human behavioural patterns in residential settings using only smart meter data has gained significant traction over the last five years [13,14], which could lead to the development of automation services to support large-scale reductions in emissions.
The datasets produced by smart meters are granular, and behaviour profiling is achieved typically by one of three techniques: (1) aggregated load monitoring, (2) disaggregation using high-frequency sampling and (3) a hybrid approach, combined with IoT sensors within a wider smart home environment context.
However, as residential homes are core contributors to the carbon emission levels, it is the end-user that ultimately should make changes to their own carbon footprint. Whilst real-time information services can be provided (e.g., using In-Home Displays (IHD)) to make citizens more situationally aware of their consumption, there are limitations for the provision of autonomous services on a global/mass scale. This is because of two considerations: (1) the big data capabilities to provide autonomous transformation on a mass scale are still insufficient, bearing in mind that one smart meter produces 175 MBs of data a year on average [15]; (2) not everyone has a smart meter and, excluding governmental policy changes, some may never have one. Smart meters have a tendency to polarise opinion due to the considerations surrounding privacy issues and the attractiveness of the data for cyber-criminals [16]; therefore, some home owners are averse to having a smart meter installed. However, this is not unique to the smart metering technology. There are considerable privacy concerns relating to wider smart home technologies in general, particularly with the increasing ubiquity in wireless technologies for home automation (and the sensitivity surrounding remote patient monitoring applications [17]).
Therefore, this paper considers the perspective of the individual home by presenting an investigation into their view of the smart meter installation within the smart cities’ context. Considering the polarised view of the smart meter installation, coupled with the popularity of implementing green technology initiatives, the public opinion concerning the smart meter installation is complex. Yet if the greener society and energy revolution goals are to be met, a greater expansion of smart urban initiatives, such as the smart metering infrastructure, is required. Whilst related research shows differing opinions on the potential reduction in energy consumption by means of a smart meter installation (2–15% [11,18]); there is nonetheless a unanimous acknowledgement of a decrease in consumption, which is ultimately beneficial.
The quantitative investigation in this paper aims to contribute to the discussion by means of the following research empirical hypotheses; (1) H1: Certain end-user characteristics (such as age, social class, employment status and education) have a statistically significant impact on the consideration of using smart meters for reducing the energy bill; (2) H2: Age, social class, employment status and education can be statistically attributed to adopting smart meters due to concerns about the environment. (3) H3: Users within a particular age group, social class, education level or employment status are statistically interested in changing their home behaviour by using a smart meter; (4) H4: Certain end-user characteristics are linked to how individuals feel about using smart meters to save energy. The corresponding Null hypotheses would be the inverse of the H1–H4 statements and are labelled as H01–H04. For example, H01 would be there is no link between the users’ characteristics and their interest in using a smart meter to reduce their energy bills.
This work is uniquely poised as the focus is principally on gas smart meter data. Gas smart meters are primarily used for automatic billing applications. They have known uses in an industry setting for the detection of anomalies (e.g., leaks or violations), remote reading and preventative maintenance. However, the majority of similar research in this domain has a core focus on the electricity metering infrastructure [11,19] or water smart meters [20]. To achieve this investigation, the Commission for Energy Regulation’s (CER) smart meter gas dataset is used, which is comprised of readings taken from 1026 gas smart meters in Ireland between 2010 and 2011 [21]. The dataset is accompanied by a granular pre- and post-survey consisting of both qualitative and quantitative data relating to the demographics and usage profile of the bill payer. This paper is structured as follows. Section 2 provides a background discussion on related work. Section 3 outlines the mixed methodology used in this research. Section 4 discusses the results achieved, and the paper is concluded in Section 5.

2. Background

Research articles frequently promote the smart metering infrastructure within a wider smart city context, as an approach to the mitigation of climate change [19,22]. The technology, which is often freely installed for the consumer, is often promoted as having the ability to reduce fuel consumption costs for the end-user and improve energy efficiency.

2.1. Smart Meters for Low Carbon

However, reducing the carbon footprint is not typically the sole benefit of installing a smart meter in the home, even though research shows that, in the UK, it would be possible to achieve an 11% reduction of the 2050 carbon emissions target if every household adopted energy efficiency technologies (e.g., a smart meter) [23]. Fredericks et al. investigate the effectiveness of smart meters, in-home display devices and energy feedback perceptions. The insights are provided through the collection of data from a series of post-graduate level focus groups [11]. Their research details that energy feedback is failing to prompt users to make significant changes in behaviour. However, the data collection employed in their research is from a limited test group of post-graduate students. The survey group is relatively restricted and, as the authors themselves suggest, post-graduate students are often in a transitionary period in terms of living arrangements. Yet, the authors note that consumers are incentive-driven; this is in line with other researchers, who suggest that consumer behavioural change is often financially motivated [24] rather than solely driven by the goal of reducing the carbon footprint. Incentive-driven consumer behaviour is also recognised by wider national organisations and has led to promotions (e.g., Smart Energy GB), who put forward monetary-driven initiatives. For example, (i) energy-free time, (ii) cooking efficiency, (iii) stop using standby, (iv) shorten showers and (v) the 10p challenge [23], to highlight the benefits of a smart meter and visualising the cost-saving changes on the IHD.
Fahin et al. highlight that an understanding of the occupants’ characteristics can result in more suitable energy saving campaigns [25]. Their research presents a system for observing user profiles to support efficient energy management schemes that could lead to reduced carbon emissions [25]. This includes identifying wastage, such as when the heating is activated despite being unoccupied. With a knowledge of household behavioural characteristics, it is possible to optimise fuel consumption, and thus optimise the energy management process. Fahin et al. employ four machine learning classifiers (decision tree, k-nearest neighbour, random forest and a support vector machine) to analyse load profiles from 20 homes in the UK. The detection of household characteristics (e.g., number of bedrooms, number of appliances and employment status) has merit for tailored energy saving feedback.
Outside of the UK, there are widespread initiatives regarding the promotion of smart meters. Alkawsi et al., for example, highlight the benefits offered globally in terms of improved market competition, service quality and liberalised markets [19]. The focus of the research conducted by Alkawsi et al., however, is specific to the influential factors towards consumers’ acceptance of smart meters in Malaysia [19]. Yet there are significant synergies: the authors recognise the potential of smart meters for the regulation of energy consumption and the support of climate change; and the promotion of energy-efficient lifestyles for reducing CO2. Their investigation involves questionnaire data comprised of 318 responses. The authors employ a quantitative social science process to assess ten hypotheses regarding the consumers’ behavioural intention, habits and expectancy when using a smart meter. Their investigations revealed that environmental awareness was significant to the consumers’ behavioural intentions when using smart meters. In other words, individuals who had a more in-depth awareness of environmental issues were more likely to adopt smart meters. It is also worth noting that similar results were presented to individuals who had the ambition of saving electricity for financial purposes. In summary, their findings demonstrate that an understanding of the consumer allows for the development of products and initiatives with better user requirements, which have the potential to increase user engagement with the smart meter rollout.

2.2. Data Privacy

Yet, the polarised view of smart meters is a product of the concern regarding privacy intrusions. There is evidence to suggest that the data collected have the potential to be exploited for negative social purposes [26,27,28]. As Pham et al. outline, wealth, religion, health and behaviour are all extractable from an aggregated smart meter data stream [28]. However, as a digital product, the smart metering infrastructure is also susceptible to attempted cyber-attacks [29]. This has led to a multitude of investigations into smart meter data security applications and the cyber-security of the wider smart grid. For example, Tellbach et al. discuss the implications of cyber-attacks on a household and the cascading effect on the wider distribution grid [30]. Their research investigates the impact of several different attack types, including availability, replay and distributed denial of service. Simulation models are adopted for assessing the impact of the attack types. Whilst the research is somewhat constrained by the use of simulation for the experimentation, the investigation found three dimensions of possible impacts based on the attack types: (1) monetary impacts, (2) interruption of smart meter communication and (3) communication delay. The most notable impacts uncovered in the experimentation include the possibility of halting smart meter communication.
Nabil et al. outline their privacy-preserving scheme for the detection of energy theft [29]. The aim of the work is to allow utility providers to detect electrical theft, provide billing and monitor load usage without consumers’ privacy being violated. Their approach caters for the masked sharing of energy readings. Their approach is able to detect fraudulent users whilst maintaining the privacy of other users. The investigation adopted by Nabil et al. also makes use of the Irish Smart Energy Trials for the evaluation process. However, in their case, the focus is on the electricity dataset rather than the gas set used in this research.
Many works are also adopting the use of sophisticated cryptography approaches, such as blockchain technologies, for ensuring secure communications [31,32,33]. For example, Gao et al. discuss how a sovereign blockchain-based solution, when coupled with smart contracts, can be used for protecting consumers. By adopting a sovereign blockchain-based approach, the authors demonstrate how the technique ensures that the data is immutable [33]. Similarly, Wang et al. propose a system which ensures privacy-preservation my means of both blockchain and homomorphic encryption. Their blockchain processes adopts a two-tier hierarchical method with multiple regional cluster blockchains coupled with a wide area blockchain. The system functions by grouping smarter meters on the client-side into geographic clusters. Here, the users act as nodes within the regional-cluster blockchains, where each cluster is provided a cluster gateway as a link to the wide-area blockchain. By means of this approach, the system is able to track regional energy consumption information, whilst maintaining the security of the information being transmitted [31]. There is clearly a trade-off between using smart meters within the future smart cities domain, due to (1) the aforementioned benefits and (2) the risks posed by privacy issues [34]. In this research, the authors endeavour to further the discussion into the opinion of the end user regarding the smart metering infrastructure, through the testing of the hypotheses outlined in Section 1.

3. Investigation Methodology

To support this investigation, the survey dataset which accompanies the CER gas smart meter dataset [21] is employed and outlined in this section.

3.1. Data Overview

The dataset is comprised of 125 quantitative social science questions completed (both before and after a smart meter trial period of 12 months) by 1576 homes in Ireland. An overview of the participants is displayed in Figure 1, showing the social class, employment status, age group, education level and type of dwelling.
The x-axis for each chart displays the grouping. For example, Age is grouped as (1) 18–25, (2) 26–35, (3) 36–45, (4) 46–55, (5) 56–65, (6) 65+, (7) Refused, as outlined in Table 1 (the social class classifications are official definitions, as in [35]).
Questions in the pre-trial survey collate information relating to user motivation for joining the smart meter trial. Overall, consumers have a positive outset, considering the cost saving advantages and environmental impact benefits brought by the smart meter trial, as demonstrated in a sample from four questions in Figure 2. The x-axis in each graph is a corresponding Likert scale ranging from strongly agree (1) to strongly disagree (5). For example, in plot 1, a significant majority of participants state reducing their bill as the main reason for taking part in the survey. Changing the environment, home behaviour and saving energy also are key factors for the participants, yet to a somewhat lesser extent than reducing the bill (in line with the background discussion in Section 2).

3.2. Multiple Regression and Predictor Variables

In order to address the hypotheses outlined in Section 1, a multiple regression model is adopted. Multiple regression allows for multiple predictor variables and can be expressed in matrix form, as in (1).
Y = X β + ε
where X is a matrix of values of the predictors, Y refers to a vector of values of the outcome variable, ε is a vector of errors and β is a vector of coefficients. As a measure of statistical significance, the p and t values are considered in the evaluation of the multiple regression model. The p-value is used as a measure of statistical significance, indicated by a score of 0.05 or less. The t-value is calculated as in (2).
t = β s β
where s is the standard error (referring to the estimate of the sample regression compared with the population regression line) and β is again a vector of coefficients. The t-test is a measure of statistical significance, where a value >2 is conventionally defined as the threshold. The model includes four predictor variables: (1) social class (Question401); (2) employment status (Question310); (3) age group (Question300); (4) education (Question 5418). The variables are selected as empirical evidence suggesting that they have the potential to have a statistically significant impact on the outcome variable.
However, gender is not factored in as a predictor variable. This is because in our initial investigation gender produced mixed results. For example, initial experiment using t-test displayed a p value of 0.992, indicating there is a low statistical difference between the opinion of men and women when considering the impact of reducing the billing (as p > 0.05). However, when considering the environmental implications, the t-test produced a p value of 0.015, meaning that there is a statistically significant difference between men’s and women’s feelings when it comes to the consideration of the environmental impact of smart meters, but not for cost saving benefits. This is reflected in the Likert scale, where men provide a mean value of 1.79, while women produce 1.41 (with a value closer to 1 being ‘strongly agree’ that the user is interested in changing the way they use gas if it helps the environment). Therefore, the focus of the evaluation is on the four predictor variables, and in the following section the results are outlined.

4. Results

In this section, each of the hypotheses outlined in Section 1 are evaluated in order. The data is pre-filtered to check for missing values, with the final resulting dataset comprised of 1365 respondents, reduced down from 1576. The expectation in the evaluation is to uncover subtle influences. This is because the data used is from the pre-trial conducted in 2011–2012. During this time, the smart meter technology was less known and an emerging technology. Furthermore, whilst energy/carbon reduction has been debated for many years, it has gained prominence and momentum in more mainstream media outlets in recent years; in line with government-led policies such as the aforementioned UK government’s aim to reach net zero emissions by 2050.

4.1. Hypothesis 1 Evaluation—Reducing the Bill

Hypothesis 1 involved experimenting with a multiple linear regression model, with Question43323 (I am interested in changing the way I use gas if it reduces the bill) set as the outcome variable. The results are outlined in Table 2, which provides the estimate standard deviation, error, t-value and p-value.
Two predictor variables have a statistically significant impact on the respondents’ attitude towards reducing their energy bill. Social class (Question401) and age group (Question300) have t-values of 2.217 and 3.162, with p-values of 0.268 and 0.0016, respectively (where a t-value above 2 and p-value below 0.05 imply statistical significance). Education has a negative impact, meaning that respondents with a higher education qualification are more likely to have a higher interest in reducing their bill (as the grading system for education in the survey is the inverse of the Likert scale for interest in reducing billing). As age and social class both have positive effects, the assumption is that as age and social class increase, the participants are more likely to have an interest in the cost benefits of the smart metering infrastructure.
However, overall, the above model explains 3.65% of the variance, where the multiple R2 value is 0.03651 and the p-value for the f-test is 2.681e−10, well below 0.05. Survey data, when compared with census data, tends to produce lower R2 values; however, the p-value is well below 0.05, demonstrating that the social class and age group are statistically significant considerations when reducing the bill is the outcome variable. 
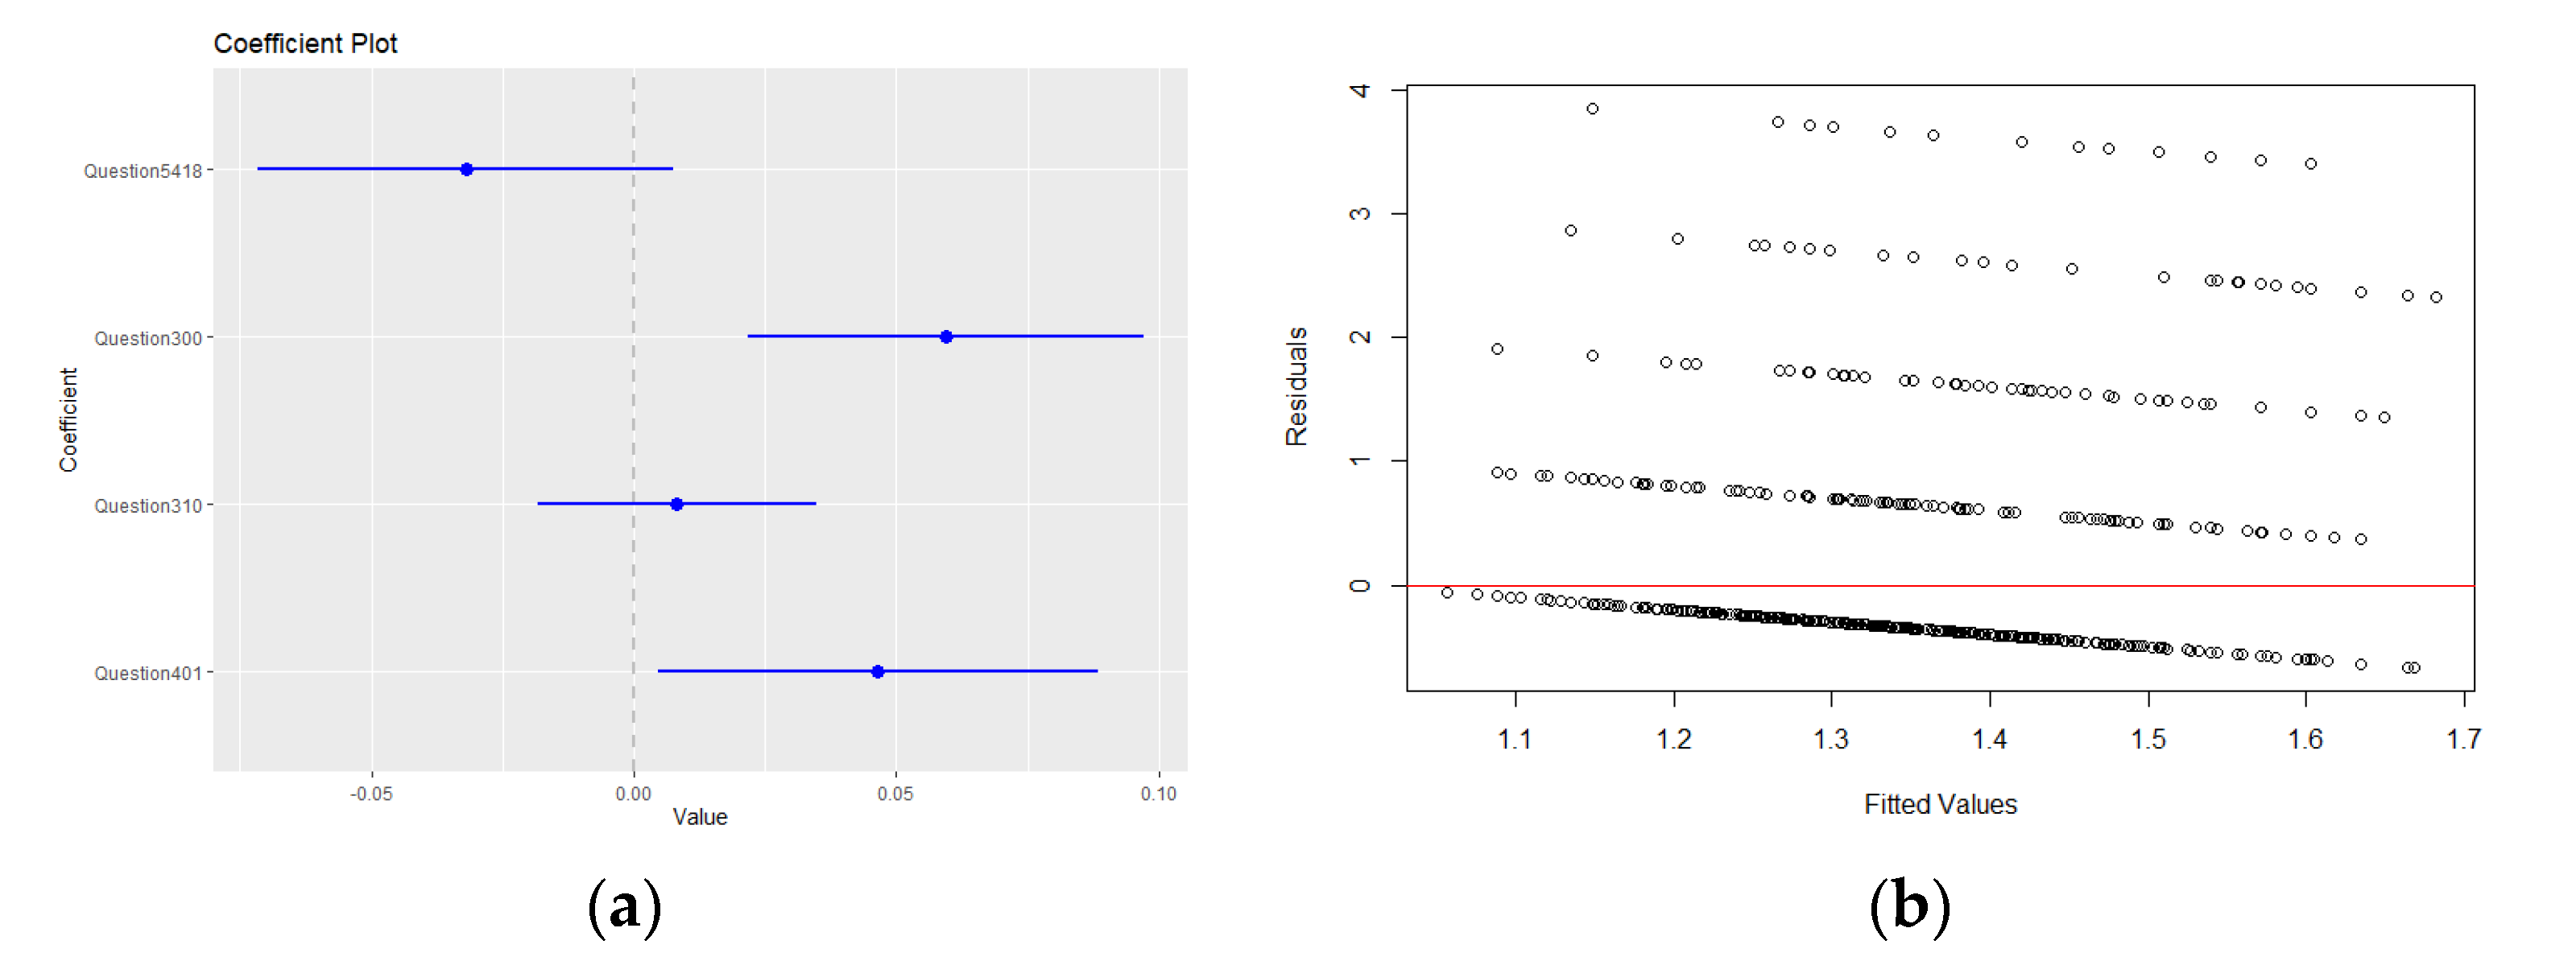
Figure 3 displays (a) the co-efficient plot and (b) a visualisation of the fitted values. As (b) displays, the residuals do not have a local mean of 0, indicating that functional form has been violated. However, as the residuals are downward sloping, heteroscedasticity is checked using the Breusch–Pagan (bp-test) test, where a p-value of 4.487e−09 is generated. The values are therefore checked using the coef-test (linear regression with robust standard errors). This confirms the results and produces p-values of 0.001602 for Question300 and 0.026791 for Question401, confirming the results.
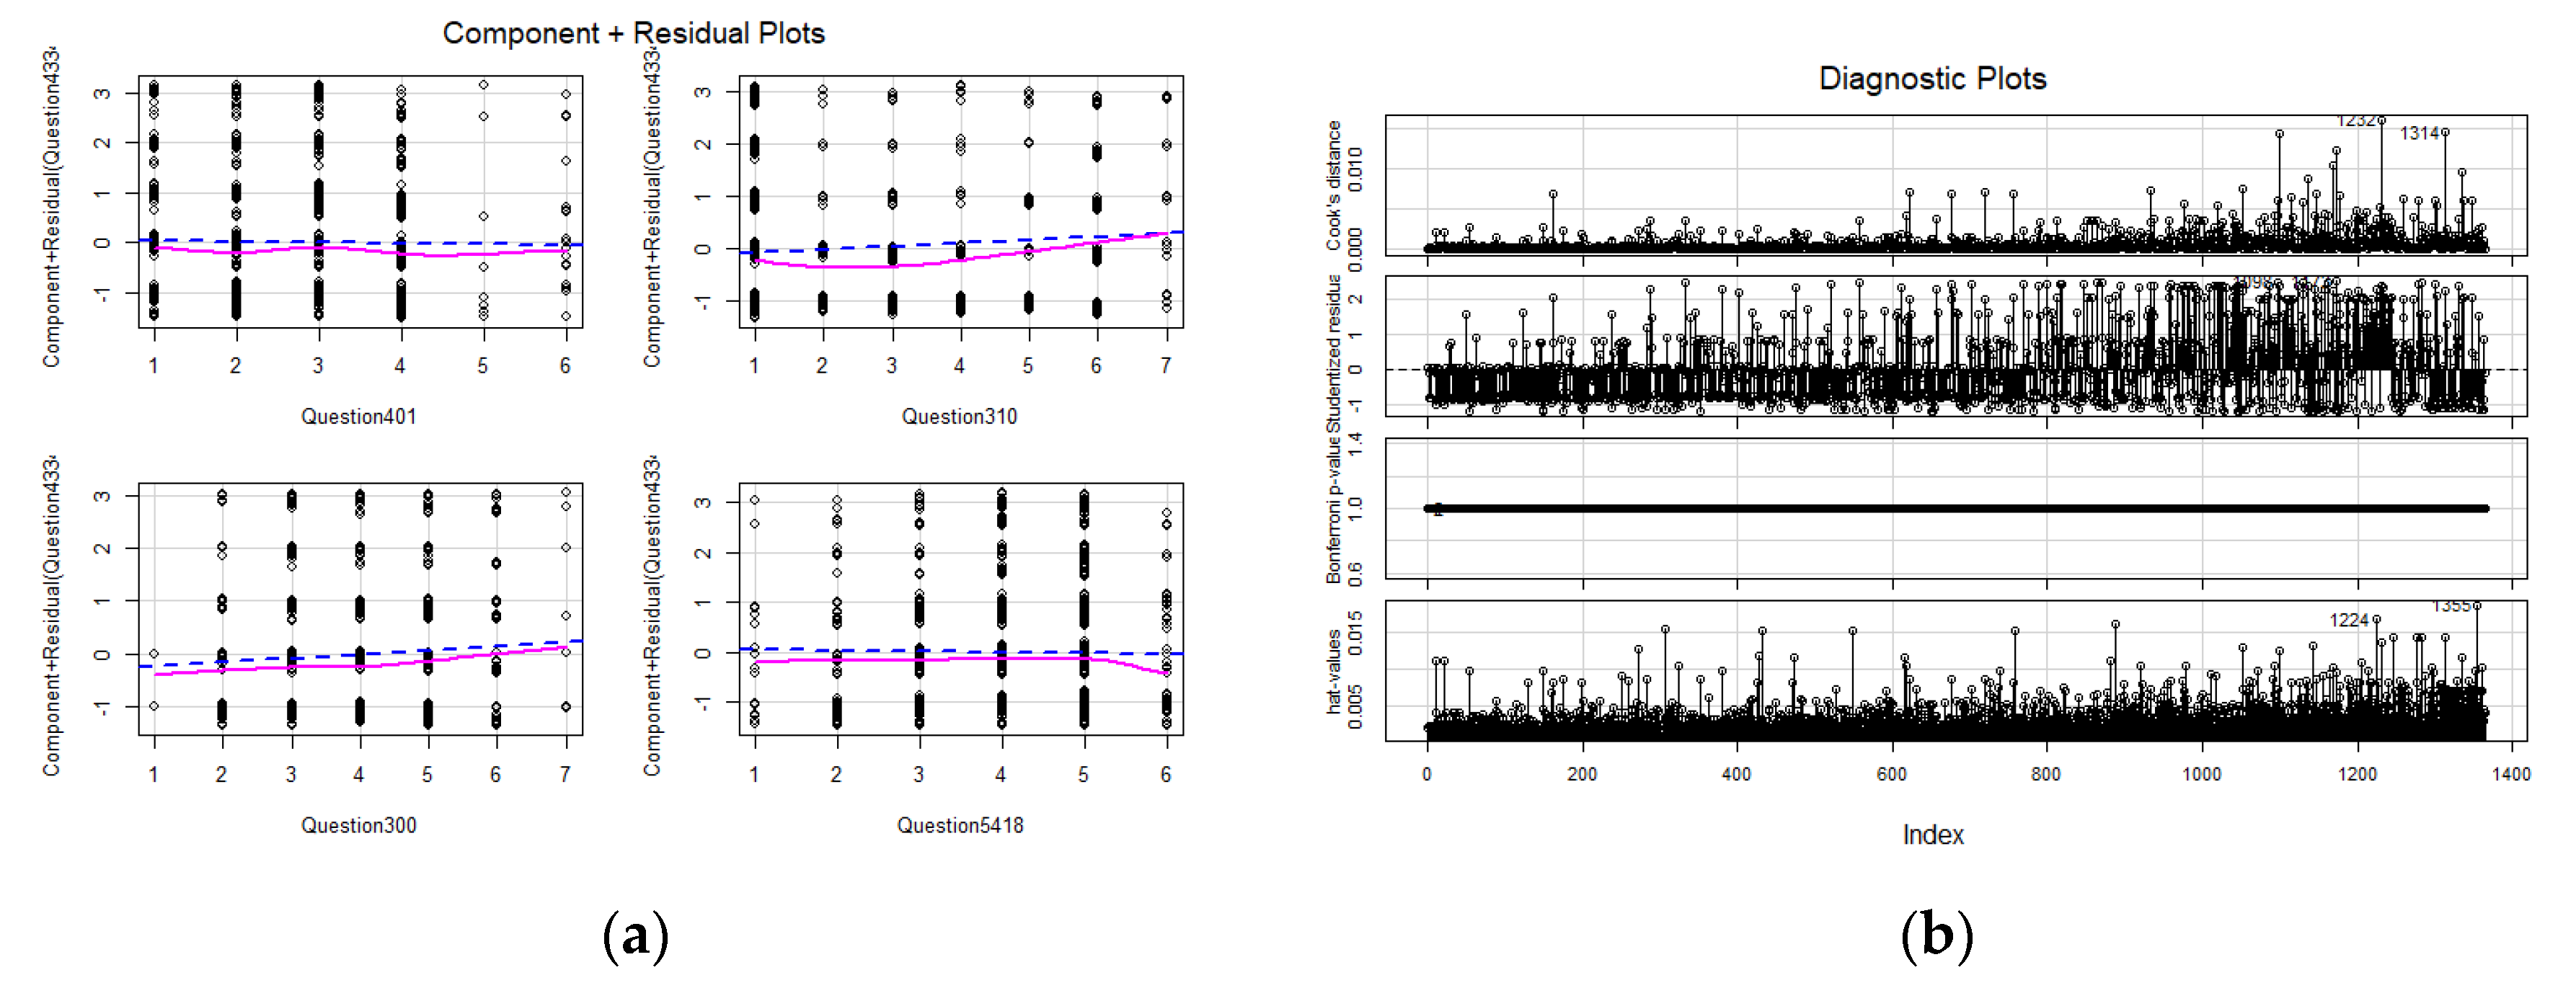
Figure 4a displays the component-plus-residuals plot, where the blue line represents where the linear relationship should be. The purple line refers to the estimated linear relationship. Question5418 (when compared with the other three) appears to be the least accurate. This would be in line with the survey data overview presented in Table 2. Figure 4b displays the influence index plot, where outlier values are depicted.

4.2. Hypothesis 2 Evaluation—Enviromental Impact

This experiment is concerned with how users consider changing the environment as a factor in their decision to adopt a smart meter. Question4333 (“am interested in changing the way I use gas if it helps the environment”) is the outcome variable with a Likert scale of 1 (strongly agree) to 5 (strongly disagree). The evaluation results are presented in Table 3. None of the predictor variables appear to have a statistical significance for the outcome variable; with Question300 having the lowest p-value (0.0916), which is well above 0.05. Therefore, it could be inferred from this experiment that whilst changing the environment might be of interest to the end-users (as outlined in Section 3, Figure 2), there appears to be little individual relationship between the end-users’ age, employment status, social class or education. It is not possible to disprove H02.
However, as a collective, the predictor variables produced a 2.806 f-test and 0.02455 p-value, with an R2 of 0.0082. The co-efficient is plotted in Figure 5a, with the fitted values displayed in Figure 5b (given the low impact, the component, residuals and diagnostics results are not plotted for this experiment).

4.3. Hypothesis 3 Evaluation—Behaviour Change

Question4334 asks if end-users are interested in changing their behaviour around the home. According to Figure 2 (in Section 3), there is a strong level of interest, but less so than when compared with having an interest in reducing the bill or helping the environment. For example, 44.9% select 1 (strongly agree), as displayed in the frequency distribution Table 4. However, 117 participants also display no interest (i.e., 5 in the Likert scale) in changing their home routine.
In this experiment, the relationship between age, class, education, employment status and the end-users’ feelings towards changing their behaviour is examined. Using multiple linear regression, a p-value of 8.974e−07 displays that there is statistical significance, confirmed by the f-test, which is 8.5. However, the R2 value of 2.44% shows that the variance is relatively low. The results are presented in Table 5, where, similarly to the H1 experiment, Age (Question300 (p = 0.0242)), but also Employment Status (Question310 (p = 0.0086)) have the most statistically significant impact on the respondents’ attitude towards changing their home behaviour.
Figure 6a displays the Co-efficient Plot. Due to the downward sloping trend, heteroscedasticity is checked again using the bp-test, which produces a p-value of 0.1353. Therefore, the results are checked with the coef-test, which produces 0.008577 for Question310 and 0.024216 for Question300, confirming the conclusions achieved with the multiple linear regression. The results are plotted in Figure 6, with the co-efficient plot displayed in 6a and the fitted values in 6b. Figure 6a shows the linear relationship and estimated linear relationship for H3. Figure 6b has relatively few outliers present (d-values), meaning there appears to be a minimal level of influential data points, which may have distorted the results.
Record 1232, in Figure 7b, appears to have the highest outlier value. Therefore, conducting an investigation into the survey responses of the individual may offer insight into the premise for the high outlier score. Observation 1232 in the dataset corresponds to User 2235, who is in the 26–35 age group, unemployed (actively seeking work) and refused to provide information relating to their social class. The individual also left education at the third level (the lowest level). The individual responded with 3 in the Likert scale for Questions 4333 and 4334, showing a lukewarm interest in reducing their bill and changing the environment. The user also had no interest in either changing their home behaviour or saving energy, responding with 5, strongly disagree, to both. This may be an indication for the high outlier score, as very few individuals both strongly disagreed with having an interest in saving energy and changing their home behaviour.

4.4. Hypothesis 4 Evaluation —Save Energy

Concerned specifically with saving energy, Question5011c displayed a highly positive response from the participants, particularly when compared with changing home behaviour. The general trend displayed in Figure 2 (Section 3) is that the respondents are overwhelmingly positive. 961 people (which is 70.4%) of the participants selected 1 (strongly agree) in being interested in reducing energy. The multiple linear regression experiment produced an R2 score of 1.64%, with a t-test score of 5.6 and a p-value of 0.0002, showing there is statistical significance between the users’ characteristics and their interest in saving energy; however, the results show that there are no specific characteristics which can be linked to the users’ interest in saving energy. None of the t-test scores are above two. Similarly, none of the p-values are below 0.05. The authors conclude from the results for H4 (Table 6) that there is no statistical significance between age, social class, employment status or education when displaying an interest in saving energy. The regression results are visualised in Figure 8.

4.5. Discussion

With smart meters polarising opinion, due to the aforementioned privacy concerns, the perspective of the end-user is important within the climate change discussion. The privacy factor could have a separate impact on the end-user perspective of the smart metering installation. However, investigating this consideration falls out of the remit of the survey data available using the CER dataset. Typically, applications relating to data mining algorithms (such as machine learning or deep learning) are used to invade the privacy of consumers in sophisticated manners [36]. However, the questions available in the survey data do not cater for the end-users’ knowledge of advanced techniques such as time pattern analysis, consumer profiling or appliance/occupancy detection. Therefore, in the experimentation, the authors aimed to further the conversation into the end-users’ perspective when considering whether to adopt a smart meter, and how certain attributes may affect their decision towards (1) reducing the energy bill, (2) helping the environment, (3) changing their home behaviour and (4) saving energy.
In the related work discussed in Section 2, Fredericks et al. focus in one level of education in their investigation; but as demonstrated in the experimentation results in this paper, education has a varied impact depending on the question. For example, in H1 social class (p = 0.268) and age group (p = 0.0016) are statistically significant contributors to the positive opinion towards the smart meter installation when considering a reduction in energy billing, whereas education has a lesser impact. Similarly, in H4 there is a cross-spectrum interest in reducing energy, whereas no core attributes, such as education, play a role in this interest.
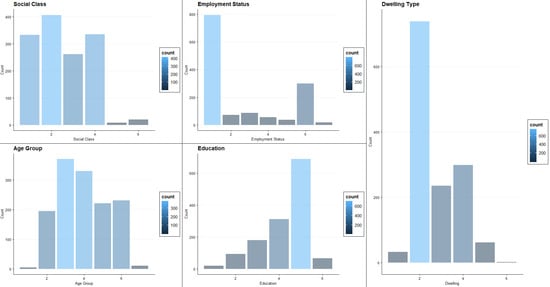
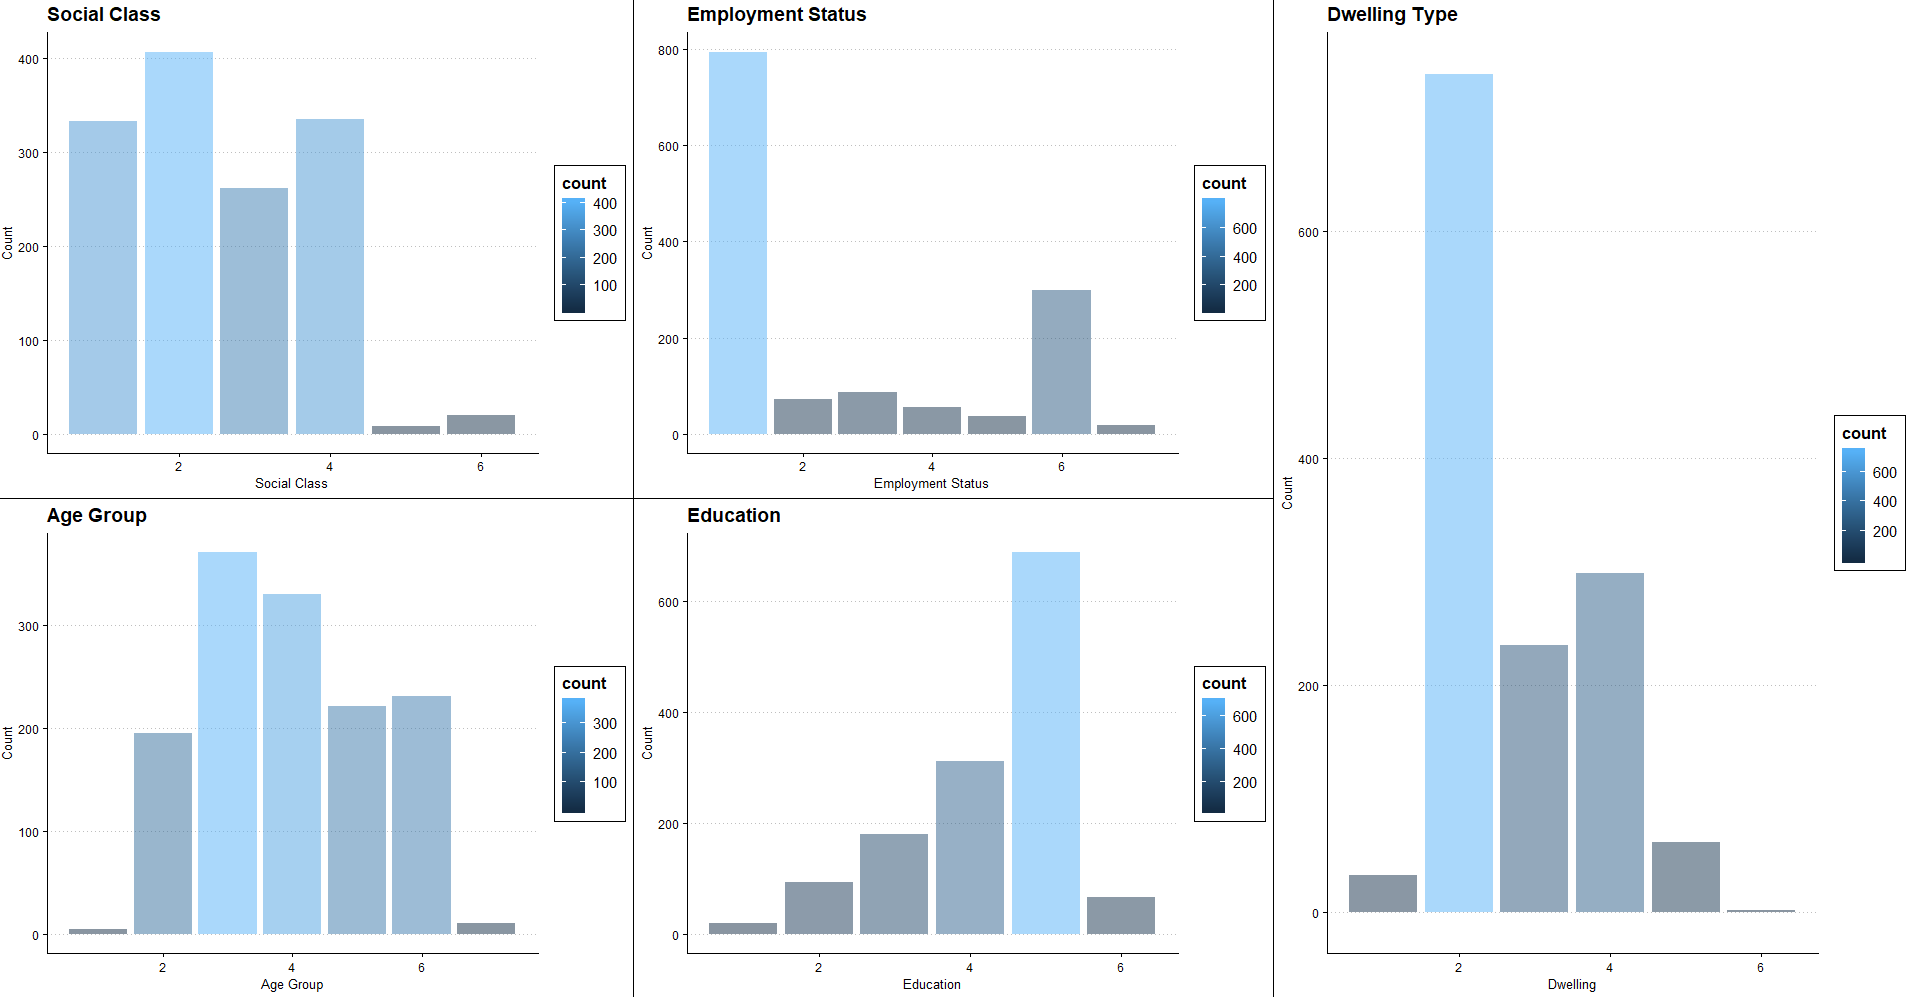
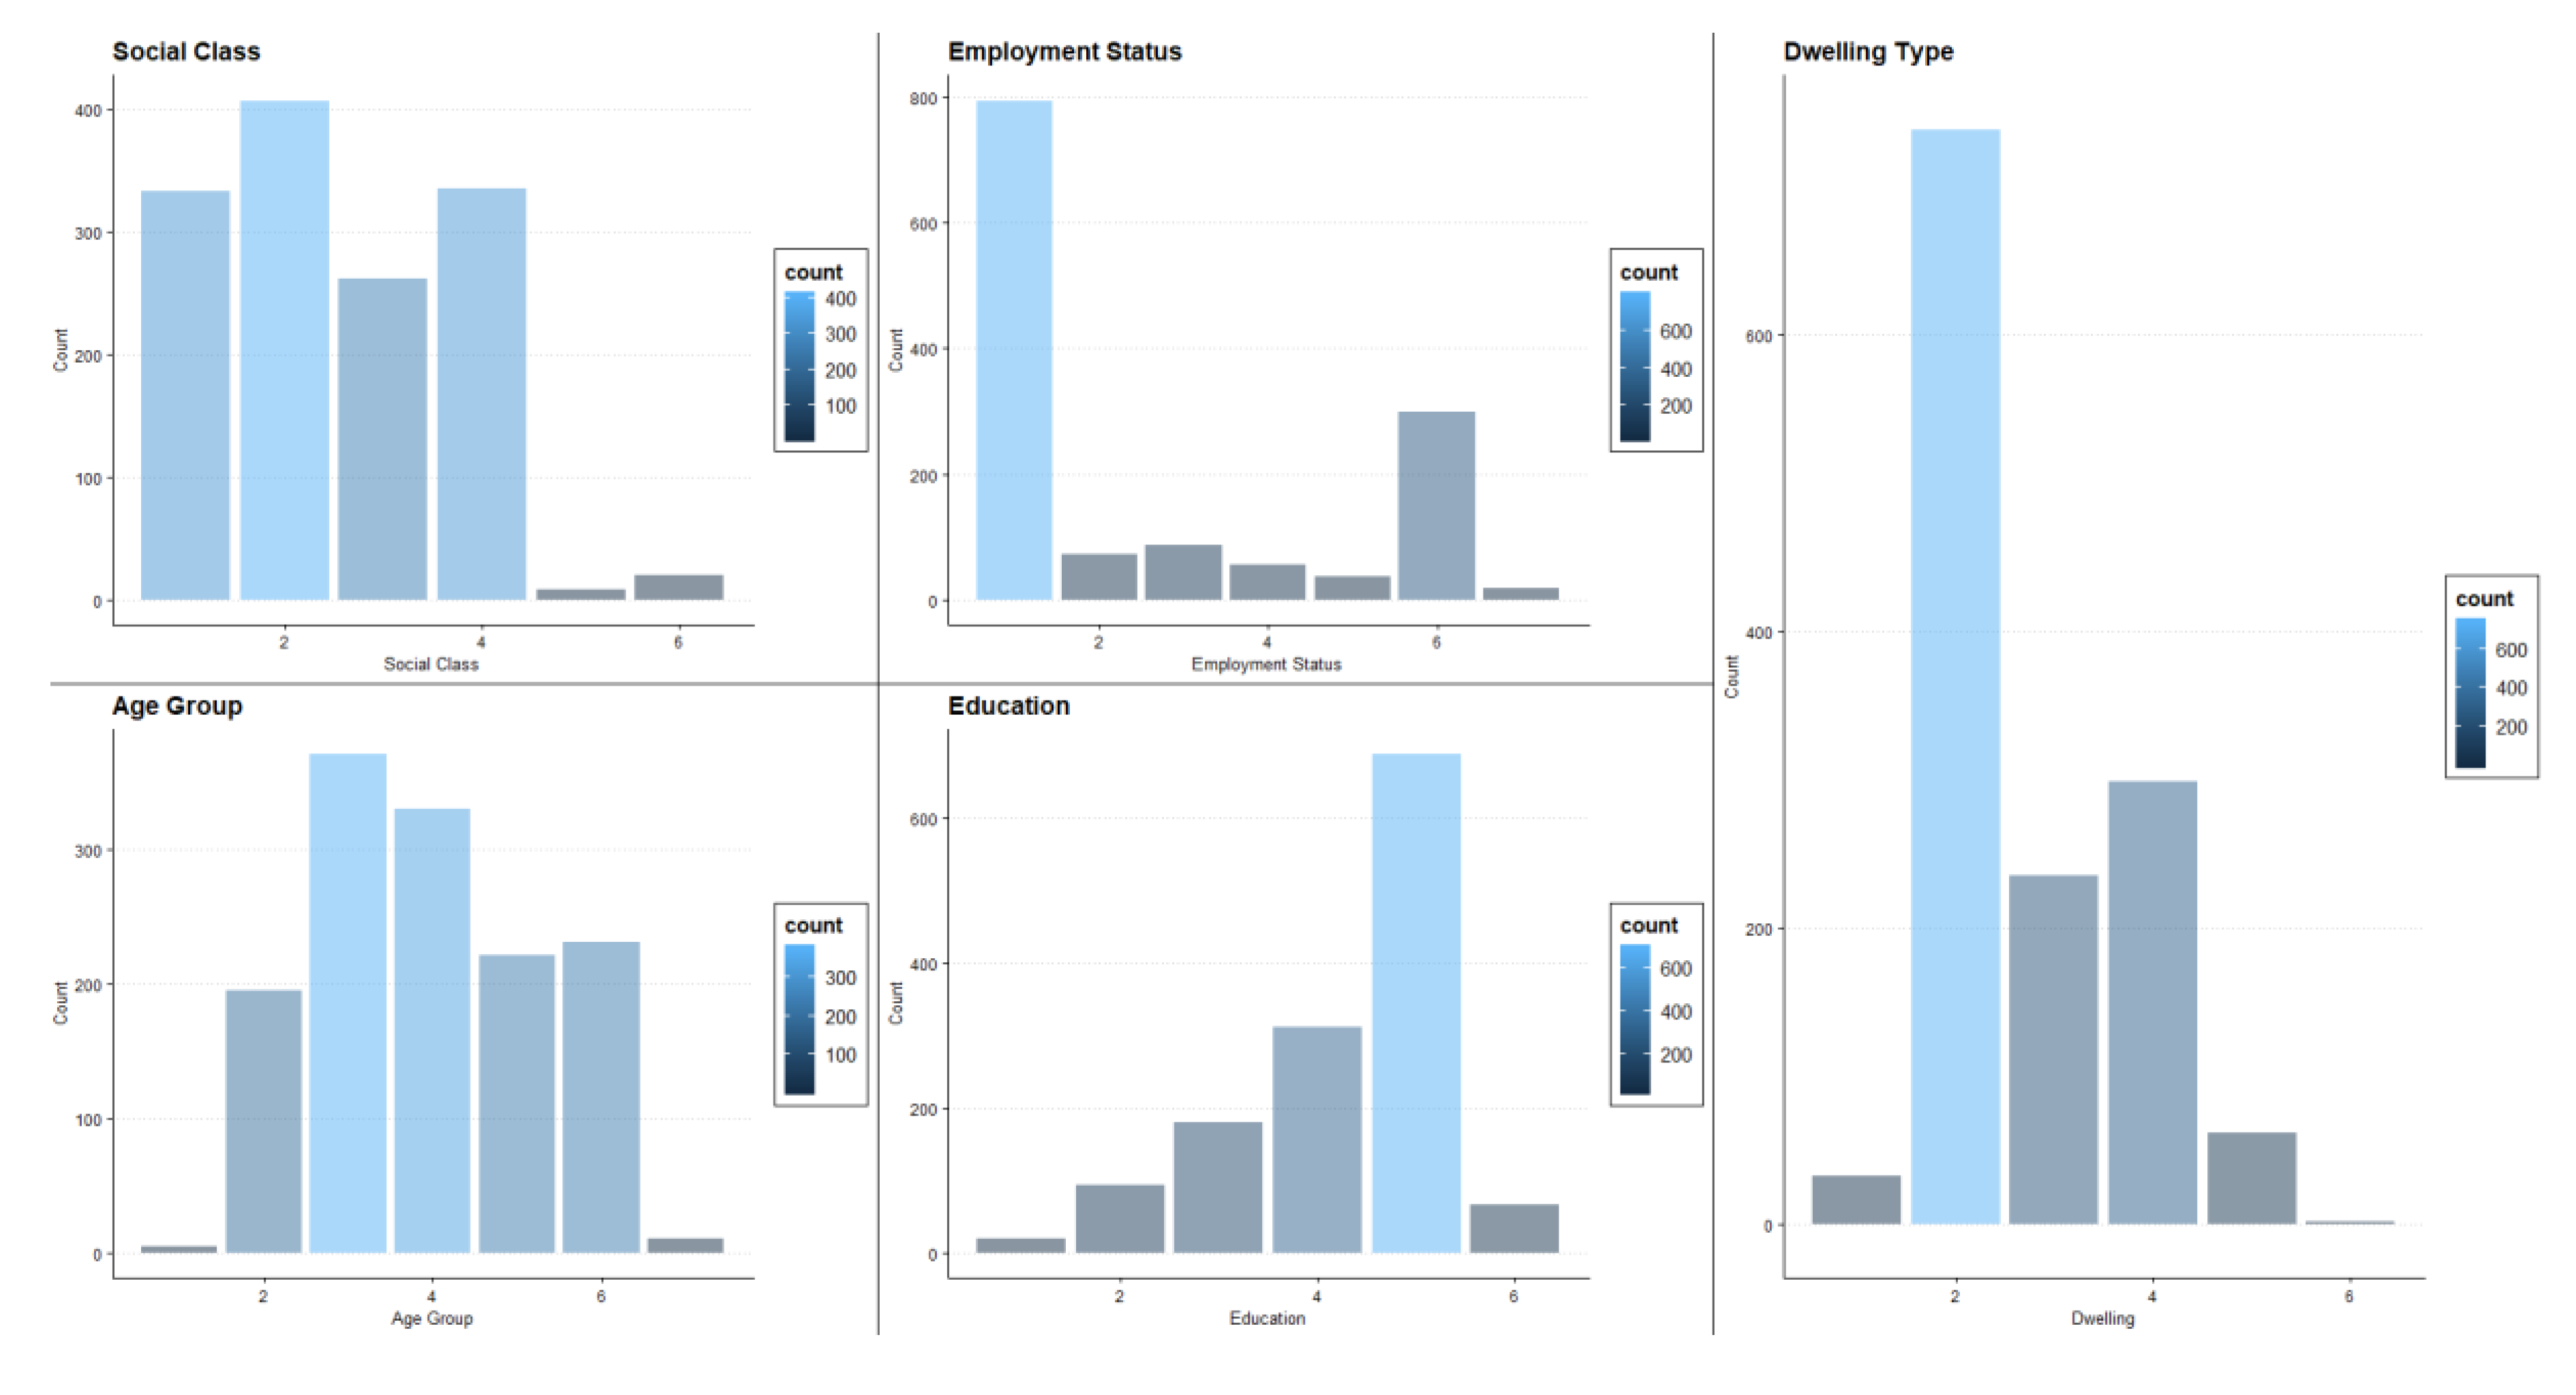
Concerning the end-user perspective on adopting the smart metering technology to change the environment, H2 shows that there is a statistical significance, which supports the background investigation (for example, 0.8% variance in respondents regarding the reduction carbon emissions). As previously discussed, Fahin et al. outline that by understanding the household occupants’ characteristics, it would be possible to implement targeted change through suitable energy saving campaigns. Yet, as demonstrated in H2, it is a challenge to link homeowner characteristics to their opinions on changing the environment. Since none of the predictor variables had a significant impact on the outcome variable, future works might include further predictor variables (such as dwelling type). This makes targeted advertising a challenge without load profiling, using real-time analytics such as clustering or supervised learning. However, in H3, when the focus is not purely on reducing carbon emissions, the results demonstrate that age (p = 0.0242) and employment status (p = 0.0086) have a statistically significant effect on the attitude towards changing home behaviour.
The main limitations of this work are linked to the dataset. While the information within is comprehensive and the survey is granular, some opinions on energy conservation might have changed since the trial took place, during 2011–2012. However, worldwide, the technology is still very much in its infancy, and many are unfamiliar with it and with what can be achieved by means of its installation. For that reason, the opinions reflected in this survey may be apparent for other nations currently in a stage of deployment similar to that of the CER trial in 2012.

5. Conclusions

As part of the industry/city 4.0 evolution, smart city technologies have the potential to both raise awareness concerning local environmental challenges and promote the use of future renewable energy technologies. In this paper, four hypotheses were investigated related to the end-users’ perspective on the installation of smart meters to reduce billing, change the environment, save energy and change home behaviour. The results demonstrated that there is a statistical significance between user characteristics and their opinions on the benefits offered by smart metering technologies. Specifically, (1) (H1) the authors are able to infer that the characteristics of age, social class and education have a statistically significant impact on the consideration of using smart meters for reducing the energy bill; (2) (H2) The results from H2 demonstrate that it is not possible to disprove the null hypothesis (H02), and therefore it is not apparent that age, social class, employment status and education can be statistically attributed to adopting smart meters due to concerns about the environment; (3) (H3) The third experiment demonstrated that users within a particular age group or employment status are statistically interested in changing their home behaviour by using a smart meter. However, employment and social class have no statistical significance on the users’ interest in changing behaviour; and (4) (H4) It is very clear that there is no end-user characteristic in the experimentation that can be attributed to how individuals feel about using smart meters to save energy.
In our future work, we will incorporate data from the post-survey to compare with the opinions held before the smart meter trial took place. Morever, adding additional variables to the multiple regression models related to the dwelling type (e.g., #Question450—dwelling type, #Question452—rent vs own, #Question460—number bedrooms), could offer further insights into linking the end-users’ perspective on the smart metering infrastructure to their attributes.

Author Contributions

Conceptualization, W.H.; methodology, W.H.; software, W.H.; validation, W.H.; formal analysis, W.H.; investigation, W.H.; resources, W.H., B.T.; data curation, W.H.; writing—original draft preparation, W.H., B.T., B.K.; writing—review and editing, W.H., B.T., B.K.; visualization, W.H.; All authors have read and agreed to the published version of the manuscript.

Funding

This research received no external funding support.

Acknowledgments

The data used in this paper is available for request from the Commission for Energy Regulation (CER) (2012). CER Smart Metering Project—Gas Customer Behaviour Trial, 2009-2010 [dataset]. 1st Edition. Accessed via the Irish Social Science Data Archive. SN: 0013-00. www.ucd.ie/issda/CER-gas.

Conflicts of Interest

The authors declare no conflict of interest.

References

  1. Browne, N. Regarding Smart Cities in China, the North and Emerging Economies—One Size Does Not Fit All. Smart Cities 2020, 3, 186–201. [Google Scholar] [CrossRef] [Green Version]
  2. Caballero, V.; Vernet, D.; Zaballos, A. A Heuristic to Create Prosumer Community Groups in the Social Internet of Energy. Sensors 2020, 20, 3704. [Google Scholar] [CrossRef]
  3. Lin, C.; Yu, Y.; Wu, D.; Gong, B. Traffic Flow Catastrophe Border Identification for Urban High-Density Area Based on Cusp Catastrophe Theory: A Case Study under Sudden Fire Disaster. Appl. Sci. 2020, 10, 3197. [Google Scholar] [CrossRef]
  4. Chen, Y.; Zhang, J.; Tadikamalla, P.R.; Zhou, L. The Mechanism of Social Organization Participation in Natural Hazards Emergency Relief: A Case Study Based on the Social Network Analysis. Environ. Res. Public Health 2019, 16, 4110. [Google Scholar] [CrossRef] [Green Version]
  5. Jose, T.; Ohde, J.W.; Hays, T.; Burke, M.V.; Warner, D.O. Design and Pilot Implementation of an Electronic Health Record-Based System to Automatically Refer Cancer Patients to Tobacco Use Treatment. Environ. Res. Public Health 2020, 17, 4054. [Google Scholar] [CrossRef]
  6. Cirillo, F.; Wu, F.-J.; Solmaz, G.; Kovacs, E. Embracing the Future Internet of Things. Sensors 2019, 19, 351. [Google Scholar] [CrossRef] [Green Version]
  7. Leyerer, M.; Sonneberg, M.-O.; Heumann, M.; Breitner, M.H. Shortening the Last Mile in Urban Areas: Optimizing a Smart Logistics Concept for E-Grocery Operations. Smart Cities 2020, 3, 585–603. [Google Scholar] [CrossRef]
  8. Kim, J.; Moon, H.; Jung, H. Drone-Based Parcel Delivery Using the Rooftops of City Buildings: Model and Solution. Appl. Sci. 2020, 10, 4362. [Google Scholar] [CrossRef]
  9. GOV.UK. UK Becomes First Major Economy to Pass Net Zero Emissions Law, June 2019. Available online: https://www.gov.uk/government/news/uk-becomes-first-major-economy-to-pass-net-zero-emissions-law (accessed on 2 August 2020).
  10. Fernández, C.G.; Peek, D. Smart and Sustainable? Positioning Adaptation to Climate Change in the European Smart City. Smart Cities 2020, 3, 511–526. [Google Scholar] [CrossRef]
  11. Fredericks, D.; Fan, Z.; Woolley, S.; Quincey, E.D.; Streeton, M. A Decade On, How Has the Visibility of Energy Changed? Energy Feedback Perceptions from UK Focus Groups. Energies 2020, 13, 2566. [Google Scholar] [CrossRef]
  12. Hock, D.; Kappes, M.; Ghita, B. Entropy-Based Metrics for Occupancy Detection. Entropy Inf. Theory Probab. Stat. 2020, 22, 731. [Google Scholar]
  13. Sinitsyna, K.; Petrochenkov, A.; Krause, B. Identification of Electric Power Consumption Patterns in Relation to Standard Load Profiles. In IEEE International Conference on Computational Science and Engineering (CSE), and IEEE International Conference on Embedded and Ubiquitous Computing (EUC), 1–3 August 2019; IEEE: New York, NY, USA, 2019. [Google Scholar]
  14. Haben, S.; Singleton, C.; Grindrod, P. Analysis and Clustering of Residential Customers Energy Behavioral Demand Using Smart Meter Data. IEEE Trans. Smart Grid 2016, 7, 136–144. [Google Scholar] [CrossRef]
  15. Cotton, J. The Data Impact, 03 April 2014. Available online: https://www.ibi.com/blog/james-cotton/16610 (accessed on 8 June 2020).
  16. Plenz, M.; Dong, C.; Grumm, F.; Meyer, M.F.; Schumann, M.; McCulloch, M. Framework Integrating Lossy Compression and Perturbation for the Case of Smart Meter Privacy. Electronics 2020, 9, 465. [Google Scholar] [CrossRef] [Green Version]
  17. Mehmood, G.; Khan, M.Z.; Waheed, A.; Zareei, M.; Mohamed, E.M. Trust-Based Energy-Efficient and Reliable Communication Scheme (Trust-Based ERCS) for Remote Patient Monitoring in Wireless Body Area Networks. IEEE Access 2020, 8, 131397–131413. [Google Scholar] [CrossRef]
  18. Department for Business, Energy and Industrial Strategy. Delivering a Smart System: Consultation on a Smart Meter Policy Framework Post 2020; Department for Business, Energy and Industrial Strategy: London, UK, 2019. [Google Scholar]
  19. Alkawsi, G.A.; Ali, N.; Baashar, Y. An Empirical Study of the Acceptance of IoT-Based Smart Meter in Malaysia: The Effect of Electricity-Saving Knowledge and Environmental Awarenes. IEEE Access 2020, 8, 42794–42804. [Google Scholar] [CrossRef]
  20. Luciani, C.; Casellato, F.; Alvisi, S.; Franchini, M. Green Smart Technology for Water (GST4Water): Water Loss Identification at User Level by Using Smart Metering Systems. Water 2019, 11, 405. [Google Scholar] [CrossRef] [Green Version]
  21. Irish Social Science Data Archive. Commission for Energy Regulation Smart Metering Project—Gas Customer Behaviour Trial, 2009–2010; SN: 0013-00; Irish Social Science Data Archive: Dublin, Ireland, 2012; Available online: www.ucd.ie/issda/CER-gas (accessed on 9 October 2020).
  22. Verdejo, H.; Becker, C. The Erratic Implementation of Measuring, Monitoring and Control System (MMCS) in Chile: The crisis on smart meters. Elsevier Energy Rep. 2020, 6, 2140–2145. [Google Scholar] [CrossRef]
  23. Smart Energy GB, The Missing Piece in Climate Conversations. Available online: https://www.smartenergygb.org/en/smart-living/the-missing-piece-in-the-climate-conversation (accessed on 10 August 2020).
  24. Van den Broek, K.L.; Walker, I. Exploring the perceptions of drivers of energy behaviour. Elsevier Energy Policy 2019, 129, 1297–1305. [Google Scholar] [CrossRef]
  25. Fahim, M.; Sillitti, A. Analyzing Load Profiles of Energy Consumption to Infer Household Characteristics Using Smart Meters. Energies 2019, 12, 773. [Google Scholar] [CrossRef] [Green Version]
  26. Zhang, X.-Y.; Kuenzel, S.; Córdoba-Pachón, J.-R.; Watkins, C. Privacy-Functionality Trade-Off: A Privacy-Preserving Multi-Channel Smart Metering System. Energies 2020, 13, 3221. [Google Scholar] [CrossRef]
  27. Zhang, L.; Zhang, J. EPPRD: An Efficient Privacy-Preserving Power Requirement and Distribution Aggregation Scheme for a Smart Grid. Sensors 2017, 17, 1814. [Google Scholar] [CrossRef] [Green Version]
  28. Pham, C.; Månsson, D. A Study on Realistic Energy Storage Systems for the Privacy of Smart Meter Readings of Residential Users. IEEE Access 2019, 7, 150262–150270. [Google Scholar] [CrossRef]
  29. Nabil, M.; Ismail, M.; Mahmoud, M.M.E.A.; Alasmary, W.; Serpedin, E. PPETD: Privacy-Preserving Electricity Theft Detection Scheme with Load Monitoring and Billing for AMI Networks. IEEE Access 2019, 7, 96334–96348. [Google Scholar] [CrossRef]
  30. Tellbach, D.; Li, Y.-F. Cyber-Attacks on Smart Meters in Household Nanogrid: Modeling, Simulation and Analysis. Energies 2018, 11, 316. [Google Scholar] [CrossRef] [Green Version]
  31. Wang, Y.; Luo, F.; Dong, Z.; Tong, Z.; Qiao, Y. Distributed meter data aggregation framework based on Blockchain and homomorphic encryption. IET Cyber Phys. Syst. Theory Appl. 2019, 3, 30–37. [Google Scholar] [CrossRef]
  32. Afzal, M.; Huang, Q.; Amin, W.; Umer, K.; Raza, A.; Naeem, M. Blockchain Enabled Distributed Demand Side Management in Community Energy System with Smart Homes. IEEE Access 2020, 8, 37428–37439. [Google Scholar] [CrossRef]
  33. Gao, J. GridMonitoring: Secured Sovereign Blockchain Based Monitoring on Smart Grid. IEEE Access 2018, 6, 9917–9925. [Google Scholar] [CrossRef]
  34. Giaconi, G.; Gunduz, D.; Poor, H.V. Privacy-Aware Smart Metering: Progress and Challenges. IEEE Signal Process. Mag. 2018, 35, 59–78. [Google Scholar] [CrossRef] [Green Version]
  35. Social Grade|National Readership Survey. 2016. Available online: http://www.nrs.co.uk/nrs-print/lifestyle-and-classification-data/social-grade/ (accessed on 13 August 2020).
  36. Asghar, M.R.; Dan, G.; Miorandi, D.; Chlamtac, I. Smart Meter Data Privacy: A Survey. IEEE Commun. Surv. Tutor. 2017, 19, 99. [Google Scholar] [CrossRef]
Figure 1. Survey Participants.
Smartcities 03 00058 g001
Figure 2. Smart Meter Motivation.
Smartcities 03 00058 g002
Figure 3. H1 (a) Co-efficient Plot, (b) Fitted Values Plot.
Smartcities 03 00058 g003
Figure 4. H1 (a) Component and Residuals Plot, (b) Diagnostics Plot.
Smartcities 03 00058 g004
Figure 5. H2 (a) Co-efficient Plot, (b) Fitted Values Plot.
Smartcities 03 00058 g005
Figure 6. H3 (a) Co-efficient Plot, (b) Fitted Values Plot.
Smartcities 03 00058 g006
Figure 7. H3 (a) Component and Residuals Plot, (b) Diagnostics Plot.
Smartcities 03 00058 g007
Figure 8. H4 (a) Co-efficient Plot, (b) Fitted Values Plot.
Smartcities 03 00058 g008
Table 1. Plot Grouping Definitions.
LabelDwellingEducationEmployment StatusSocial ClassAge
1ApartmentNo formal educationAn employeeAB18–25
2Semi-detached housePrimarySelf-employed (with employees)C126–35
3Detached houseSecondary to Intermediate Cert Junior Cert levelSelf-employed (no employees)C236–45
4Terraced houseSecondary to Leaving Cert levelUnemployed (actively seeking work)DE46–55
5BungalowThird levelUnemployed (not actively seeking work)Farmer56–65
6RefusedRefusedRetiredRefused65+
7//Carer Worker/Refused
Table 2. Results for H1.
Estimate Std.Errort ValuePr(>|t|)
(Intercept)1.0747850.1303908.2433.92 × 10−16
Question4010.0465040.0209762.2170.0268
Question3100.0081760.0132440.6170.5371
Question3000.0595170.0188233.1620.0016
Question5418−0.0319830.019811−1.6140.1067
Table 3. Results for H2.
Estimate Std.Errort ValuePr(>|t|)
(Intercept)1.3958960.1559328.9522 × 10−16
Question4010.0288560.0250851.1500.2502
Question310−0.0043340.015838−0.2740.7844
Question3000.0379980.0225101.6880.0916
Question5418−0.0253600.023692−1.0700.2846
Table 4. Results for H2.
Likert ScaleFrequencyPercentageCumulative Percentage
161344.90844.91
232824.02968.94
321615.82484.76
4916.66791.43
51178.571100.00
Table 5. Results for H3.
Estimate Std.Errort ValuePr(>|t|)
(Intercept)1.769120.225377.8508.39 × 10−15
Question401−0.015750.03626−0.4350.66398
Question3100.060260.022892.6320.00858
Question3000.073400.032532.2560.02422
Question5418−0.017840.03424−0.5210.60255
Table 6. Results for H4.
Estimate Std.Errort ValuePr(>|t|)
(Intercept)1.311630.149108.797<2 × 10⁻¹⁶
Question4010.014160.023990.5900.5551
Question3100.018070.015141.1930.2329
Question3000.041180.021521.9130.0559
Question5418−0.026550.02265−1.1720.2414

