Article

Big Data Analytics in Australian Local Government

1
72 Glenburnie Rd, Vermont, VIC 3133, Australia
2
Defence Science & Technology Group, Fishermans Bend, VIC 3207, Australia
*
Author to whom correspondence should be addressed.
Smart Cities 2020, 3(3), 657-675; https://doi.org/10.3390/smartcities3030034
Submission received: 6 May 2020 / Revised: 6 July 2020 / Accepted: 7 July 2020 / Published: 9 July 2020

Abstract

:
Australian governments at all three levels—local (council), state, and federal—are beginning to exploit the massive amounts of data they collect through sensors and recording systems. Their aim is to enable Australian communities to benefit from “smart city” initiatives by providing greater efficiencies in their operations and strategic planning. Increasing numbers of datasets are being made freely available to the public. These so-called big data are amenable to data science analysis techniques including machine learning. While there are many cases of data use at the federal and state level, local councils are not taking full advantage of their data for a variety of reasons. This paper reviews the status of open datasets of Australian local governments and reports progress being made in several student and other projects to develop open data web services using machine learning for smart cities.

1. Introduction

Open datasets are now being collected by many local governments in Australia such as City of Melbourne (COM), City of Adelaide [1], and City of Wyndham [2]. However, while Australia’s federal and state government departments are embracing the new data age, it appears that most local councils are not taking advantage of the massive amounts of data they collect and manage to operate more efficiently [3]. Some councils do not have automated work systems, instead relying on manual approaches; others do not utilize their systems properly. In either case, these councils lack the information needed to make the best decisions for their community. Section 2 of this paper briefly reviews projects being undertaken in other countries which use data science and big data techniques to assist local government councils. Section 3 briefly reviews the local government open datasets in Australia, and those for the state of Victoria in particular. Section 4 examines how open datasets can be analyzed by predictive machine learning (ML) models and the results deployed on the Internet to better support decision makers.
Several student projects making use of Australian local government open datasets have been sponsored by the authors. One of these was undertaken in 2019 by final year Business students at Swinburne University of Technology in Melbourne, Victoria. Two projects are currently being undertaken by final year Software Engineering students at Swinburne and Monash Universities. Section 5 of the paper gives an overview of this work. Our conclusions are summarized in Section 6.

2. Local Government Big Data Projects in Other Countries

“Big data” is an amorphous, catch-all label for a wide selection of data [4]. It is often considered to be data that possesses certain broad characteristics (volume, velocity, variety, etc.), but many other descriptors such as value and veracity have been applied. It has been considered to be a breakthrough technological development of recent years, but we have as yet limited understanding of how organizations translate its potential into actual social and economic value [5].
Another amorphous term popular in recent years is “smart city”. Cities worldwide are attempting to transform themselves into smart cities, which are composed of and monitored by pervasive information and communication technology (ICT) [6]. Many definitions of a smart city and indicators of smartness have been given in the literature [7]. Many of these definitions include the concept of sustainability, which itself has many definitions. According to Sodiq et al., sustainability includes energy conservation and efficiency, building standards, water security, efficient waste management, and social and economic equity [8]. As discussed by Bibri, sensor data transmitted by Internet of Things (IoT) networks can play a significant role in facilitating environmentally sustainable smart cities [9]. Further, many city operations can be automated with minimal human interaction by feeding IoT sensor data to actuators, which thus form an automatic control system [10].
Standards are important for evaluating the smartness of cities. As pointed out by Huovila et al. [11], these standards must strike a balance between hard smartness, which relates to tangible assets such as ICT, other types of technology, and physical infrastructure, and soft smartness, which relates to intangible assets and people.
The use of urban big data contributes to the creation of information for stakeholders to perform their processes better and create value. Glaesner et al.’s comprehensive review examined big data in urban environments and explored the potential and limitations of big data for improving urban life [12]. They stressed the need for targeted collection of big data linked with other methods to achieve its full potential.
Big data has traditionally been stored offline and analyzed in batch mode, but increasingly real-time collection and analysis of data is being used to enable more timely decision making [13]. In the public sector, big data has not traditionally been much used, although governments are becoming increasingly aware of the value to be gained from it [14]. The big data technologies of potential value in the public sector include real-time data applications, predictive analytics, and natural language analytics.
A detailed survey was conducted by the Oxford Internet Institute to examine the extent of data science and big data application in local UK government [15]. Key findings were that data science is still in an embryonic stage with few councils willing to perform ML or artificial intelligence (AI) on their collected big data. Budgetary restrictions combined with lack of skilled staff have prevented progress in many cases although there are some encouraging developments. Many councils have concerns about privacy and ethics with uncertainty about compliance with current legal frameworks.
A key barrier for most organizations is improving existing infrastructure to allow better access to the data that is already being collected. One important shift is a move to predictive analytics using ML [16]. This shift is noted by de Souza et al.’s bibliographic study of data mining and ML applications in smart cities [17], which found that predictive analytics was the most common technique. Sutcliffe [18] reviewed barriers to use of big data with reference to Malamo and Sena’s study on UK local government [19].
Symons reviewed the state of big data in UK local government councils, listing comprehensive sets of applications and use cases [20]. Emerging trends were noted including predictive government, integrated data, smart places, geospatial analysis, and open data.
The increasing trend towards releasing government data in the USA, and in particular local government data, has been reviewed by Zanmiller [21]. She notes that “while national and state governments have more financial and technical capacity to develop large programs, local governments are uniquely positioned to create long lasting partnerships and citizen buy-in through agility and understanding”. The benefits for local government, who often operate within small budgets, include efficiency, as well as greater citizen participation, accountability, and transparency. However there are barriers for both local government and citizens, the former including privacy issues, and the latter the so-called digital divide, which can make the data virtually useless to a majority of possible users without the technical skills and resources to use it.
Recent Korean research on big data in government is reported in [22,23]. Kim et al. analyzed the role of big data in the governments of leading nations including the US, UK, Japan, Korea, Australia, and Singapore [22]. They found that all leading nations (including Australia) are exploiting big data approaches to the vast amounts of data they collect and have initiated large projects to enhance the efficiency of government operations. Hong et al. described the Seoul metropolitan transport system’s application of big data to optimize public transport [23].

3. Australian Government Open Data

The Commonwealth of Australia is constituted as a federation of states and territories with power divided between the federal government (centered in the Australian capital city of Canberra) and the six state and two territory governments. Each state is further divided into councils. Thus, there are three levels of government—federal, state, and council with differing levels of responsibility. Australia is moving into the big data age at all three levels.
Australian government open data is stored and managed on the data portal: https://data.gov.au [24]. Anyone can access this public data published by federal, state, and local government agencies. It is a national resource that holds considerable value for growing the economy, improving service delivery, and transforming policy outcomes. In addition to government data, there is publicly funded research data and datasets from private institutions that are in the public interest. The site has over 30,000 publicly available datasets from federal, state, and local levels of government and continues to grow. The federal government’s public data policy statement [25] requires all government agencies to make nonsensitive data open by default. In addition to free, open datasets, data.gov.au now includes information about unpublished data and data available for purchase.
The website data.gov.au is managed by the Australian Digital Transformation Agency (DTA). The redeveloped platform MAGDA (Making Australian Government Data Available) was developed in partnership with the Australian Commonwealth Scientific & Industrial Research Organization (CSIRO)’s data and digital specialist data sciences arm, Data61 (https://data61.csiro.au/). MAGDA is a fully open source project. Australian states also maintain their own websites for state-related data. The state of Victoria, for example, has a data portal, DataVic, at: https://data.vic.gov.au. Similarly, New South Wales has an open data portal at: https://data.nsw.gov.au/, as do the other states and territories. Further, some local councils maintain open data portals, although open data are generally stored on data.gov.au. Several open data platforms are in use in Australia, including CKAN, OpenDataSoft, Socrata, and ArcGIS [26]. Most of these come within the MAGDA project.
Australian local councils from all states and the ACT had published 2441 datasets as at 11 April 2020, the largest number (967) being from Victoria. The Victorian datasets are all published on data.gov.au, which includes a link to the COM’s open data portal (https://data.melbourne.vic.gov.au/). Figure 1 below shows the numbers of open datasets published by all Victorian local councils. These open datasets mainly cover operational areas of local government including roads and footpaths, libraries, council property, and garbage collection, although some published datasets relate to more strategic matters such as population projections and long-term regional development. The COM has the largest number of open datasets (193) amongst Victorian local councils, and they include datasets derived from IoT sensors such as pedestrian traffic counters [27], which is a trend which can be expected to increase in the future.
The numbers of most Victorian local council open datasets have been counted by the authors using a Microsoft Excel® spreadsheet, and the most common names are shown graphically in Figure 2 below.
Many of these datasets can be visualized using built-in mapping tools. Datasets that contain a geospatial field (such as latitude and longitude) can be mapped and viewed in the visualization utility NationalMap. The City of Boroondara, for example, has a database of significant trees as shown in Figure 3 below.

4. Analysis of Big Data by Machine Learning

While collecting data is important, web services (also termed web Application Programming Interfaces—APIs) using ML are needed to answer “what if” questions and make predictions about future needs. These can be developed using Python [28] or machine-learning-as-a-service (MLaaS), which may enable code-free development. The major players in this space are Amazon, Microsoft, Google, and IBM, [29] but there are smaller players including DataRobot® [30], RStudio® [31], and BigM®L [32]. Development may be cloud-based, such as IBM Cloud®, or using local hardware and software. A ML project comprises several stages: strategy, dataset preparation and preprocessing, dataset splitting, modeling, and model deployment [33]. Note, however, that these MLaaS services are generally not free.

4.1. Data Analytics with Python Libraries

One approach to big data analytics and ML is the application of python analytics and the ML libraries Pandas, Numpy, and Scikit-learn [34]. The process to analyze the data follows the steps as depicted in Figure 4 below:
  • download the relevant datasets (in this case, from the relevant portal)
  • read the dataset and check what data types it contains
  • refine the data by replacing coded values and NaN (not a number) values with appropriate numeric values
  • use the matplotlib and seaborn libraries to perform visualization of the data (such as shown in Figure 4 below)
  • explore dependencies of target outcome (such as accident severity) on relevant features such as road type, lighting, speed zone
A pilot study using ML was performed by one of the authors using road accident statistics from Victoria [35]. Figure 5 below shows some outcomes of this initial analysis: the number of persons killed for accidents in different speed zones and the severity of accident in each speed zone within Victoria.

4.2. Predictive Machine Learning with Python Libraries

An ML model can then be created using the python scikit-learn libraries as reported in [34,36,37] following these steps:
  • predict outcomes using Naïve Bayes, Linear Support Vector Classification, K Neighbors Classifier, Random Forest, or other models
  • compare model accuracy which can then inform the appropriate ML model
  • save the model using the joblib library
  • create an API using the flask framework
  • test the model over the web using the Postman® client.
The different models achieved the following scores indicating that the Random Forest Classifier provided the highest predictive accuracy as shown in Table 1. A higher score indicates a higher predictive accuracy.
The next stage is to determine how much each feature contributed to the model accuracy. For the sample data, the main features of importance were then found to be as shown in Table 2. This shows that the speed zone is of the greatest importance for this model with light condition and road geometry also of significance.
The model can then be tested over the web using the Postman® client. In the request screen, usually at the top, the query is entered in JavaScript Object Notation (JSON) format. On entering Send, the prediction is output in the response screen, usually at the bottom, also in JSON format. As an example:
  • Input:
    • {“LIGHT_CONDITION”:5, “SPEED_ZONE”:110, “ROAD_GEOMETRY”:5},
    • {“LIGHT_CONDITION”:9, “SPEED_ZONE”:30, “ROAD_GEOMETRY”:9}
  • Output:
    •    {“prediction”: “[2, 3]”}
Note: Accident Severity 2 means Serious Injury, Accident Severity 3 means Other Injury.
The API used for this pilot study was very similar to that given by Paul [37]. The endpoint was http://IPaddress:12345/predict, and the Request and Response parameters were as above.

5. Big Data Projects Sponsored by the Authors

The authors have recently sponsored and themselves worked on several big data projects:
  • Analysis of pedestrian traffic in the COM (Swinburne University)
  • Victorian local government open datasets web APIs (Swinburne University)
  • Development of web APIs to assist local government manage waste disposal and recycling (being done by one of the authors and Monash University)
  • Analysis of COM social indicator survey (currently being done only by one of the authors)
These are discussed in the following subsections.

5.1. City of Melbourne Pedestrian Traffic Analysis

As an example of local council initiatives, analysis of pedestrian traffic in the COM was reported by Carter at al. [27]. While COM is not a suburban council, it is still the local council for the inner-city Central Business District (CBD). The work was sponsored by the authors and carried out by a Swinburne University team. This used COM datasets and Microsoft Power BI® for data analysis and visualization. Sample analysis is shown in Figure 6. below, where the average pedestrian count by quarter over the past five years (2014–2019) is shown. The COM has a network of pedestrian sensors that upload their data regularly to a COM server thus enabling analysis. The aim of the project was to inform COM on options to improve pedestrian mobility in the city.
Future work was suggested that could link these pedestrian flow data with social media data from smartphones and potentially wearable devices such as fitness monitors to correlate pedestrian satisfaction with traffic flow. The ’happiness’ effect of pedestrians passing through green areas such as city parks can also be quantified. Expansion of the sensor network to include more of the city and to extend the pedestrian counting system to include more features such as age and sex of pedestrians was also suggested.

5.2. Victorian Local Government Web API Project

A Swinburne University student team was assigned to develop one or more web APIs using Victorian local government open datasets. A web API is an interface for software applications analogous to a graphical user interface used by humans [38]. The Victorian road accident analysis described above used the python scikit-learn library to develop an ML model and deployed the model using the python flask API. The Swinburne student team assigned to this project are planning to use MLaaS, and have learned to use IBM Watson® Studio [39]. As no funding is available for this project, they initially worked with the free (Lite) version of Watson Studio, but unfortunately this has proven to be unsuitable for this project. Similar experience was encountered with Microsoft Azure® Machine Learning Studio: the free version quickly expired. Both IBM Watson® Studio and Microsoft Azure® have comprehensive analytics and ML capabilities, however, no funding was available for paid subscriptions. Other MLaaS packages being evaluated include DataRobot®, RStudio®, and BigML®. RStudio® is most likely to be adopted as it is free software and has an integrated development environment for the R programming language, which is good for visualization and statistical analysis.
This project is currently a work in progress, and the team is considering traffic, transport, and parking as the preferred use cases. As far as we know, not much work of this nature has been undertaken in Australia, so it will potentially be of great benefit to Australian local government councils and members of the public who must deal with them.
A prototype web system focused on transport operations has been developed with the home page shown in Figure 7. When complete, users will be able to access predictive models for traffic, transport, and parking, based on ML from open COM datasets.

5.3. Waste Management Web API Project

This project, which is being undertaken by several student project teams at Monash University, is planned to apply ML or other big data analytics techniques to local council waste management problems. Waste management is one of the biggest challenges posed by the rapid growth of urban populations. This project is thus of potentially great benefit to the environment as well as local government councils.
A waste management system has many stakeholders including the local council administration, waste truck owners, and managers of dumps and recycling factories [40]. These are depicted in Figure 8 below. Many decisions need to be made, including when to collect waste from bins (scheduling) and what route trucks will follow (routing). A survey on the various decisions needed and supporting IoT-based models proposed is given by Anagnostopoulos et al. [41]. As discussed by Esmaeilian et al. [42], waste management should really be seen as part of the whole product life-cycle, and IoT-based data collected to enable tracking of products from production to disposal. Further, many barriers exist to adoption of smart waste management systems, including lack of standards and policy norms, as well as lack of knowledge by policy makers [43].
Big data analytics including ML and AI can be applied to many aspects of waste management. Gupta et al. [44] reviewed ML models of the scheduling of waste collection from bins and the sorting and recycling of waste. Another comprehensive review of waste management models in the literature is given by Pardini et al. [45]. A case study of applying ML techniques to predicting fill levels of rubbish bins is reported by Rutqvist et al. [46]. This study showed that ML methods greatly improved the detection accuracy of emptying recycling containers using data from sensors mounted on top. Further, Al-Masri et al. [47] describe an IoT-enabled waste management system, recycle.io, that uses the Microsoft Azure® IoT hub that enables councils to better regulate waste disposal. Idwan et al. [48] developed a garbage truck optimal routing algorithm using IoT data and agent-based models. Chaudhari and Bhole [49] described an application using IoT data to monitor real-time garbage bin status and enable collection trucks to find efficient routes. This application is implemented on the Android® operating system and uses the ThingsSpeak® platform to visualize the data. An assessment of the savings resulting from a similar system in an Indian city is given by Fataniya et al. [50].
The Monash University student projects are at the time of writing still in the planning stage, but two which should be mentioned are one relating to optimizing garbage collection routes based on the type of garbage and urgency of collection, and one about identification and classification of recyclables using image recognition. The authors of this paper plan to evaluate the products produced by these project teams and seek to present them for consideration by local government councils.
Smart bin systems have been adopted by many local councils throughout the world, including the City of Bristol, UK [51]. In Australia, they have been adopted by the City of Hobart, Tasmania [52], and by the Victorian cities of Melbourne, Wyndham, and Hume [53]. Wyndham is a council in the western suburbs of Melbourne, and the council-administered area includes the older suburb of Werribee, plus several newly developed suburbs including Point Cook. The City of Wyndham’s smart bins data are stored in three datasets on the data.gov.au portal. A smart city maturity assessment [54] found that this council has a strong smart city culture, and is rapidly developing new technologies and embedding them in its business processes.
A preliminary analysis of the Wyndham City Council (WCC) smart bins data has been carried out by one of the authors. These bins are currently only located in the Werribee CBD and in Point Cook near Boardwalk Park. The datasets include the fill levels and other data about 32 large bins, which are used for either waste or recyclables such as bottles and cans. The fill levels recorded by sensors each day are stored on one dataset, and another dataset stores daily records going back to 2018. The analysis included visualization of the bin fill levels over time, and geospatial maps of bin locations. Figure 9 below shows a histogram of fill levels of all the smart bins on one day in 2020. Figure 10 below shows the fill levels of one of the bins over a 13-day period in 2018. The data appears to be very coarse grained, and therefore may not lend itself to the ML techniques discussed in [46]. Further investigation of this smart bins system is planned.
A program to draw geospatial maps of the WCC smart bin locations and type (waste or recyclables) was written using the python libraries basemap and matplotlib. This uses a python flask API which can be accessed by a Representational State Transfer (REST) client such as Postman® using the GET command. The endpoint is:
On sending the GET command, this API returns a street map of the Werribee CBD with the smart bins shown, as in Figure 11 below. The full python code is given below:
#API to download map of Werribee CBD with smart bin locations plotted
#Needs to be adapted to your python environment
#Author: Richard Watson
#import libraries
import pandas as pd
import numpy as np
import matplotlib.pyplot as plt
from pandas import DataFrame
from flask import Flask, request, abort, jsonify, send_from_directory
import os
os.environ[’PROJ_LIB’]=’C:/Users/Miniconda/Library/share’
from mpl_toolkits.basemap import Basemap
UPLOAD_DIRECTORY = "/project/api_uploaded_files"
if not os.path.exists(UPLOAD_DIRECTORY):
   os.makedir(UPLOAD_DIRECTORY)
DOWNLOAD_DIRECTORY = "C:/Python37/project/myapidirectory"
if not os.path.exists(DOWNLOAD_DIRECTORY):
   os.makedir(DOWNLOAD_DIRECTORY)
#URL for Wyndham smart bins dataset
#Read json file into dataframe
bins_json=pd.read_json(url)
newdf=pd.json_normalize(bins_json[’features’])
#Make a list of bin locations
newlist=newdf[’geometry.coordinates’].tolist()
#Make a dataframe out of the list & add 2 new columns
coordsdf=DataFrame(newlist,columns=[’lond’,’latd’,’null’])
coordsdf1=coordsdf.join(newdf[’properties.Streams’])
coordsdf2=coordsdf1.join(newdf[’properties.ID1’])
#Make lists out of column values
lon=coordsdf2[’lond’].values
lat=coordsdf2[’latd’].values
type=coordsdf2[’properties.Streams’].values
no=coordsdf2[’properties.ID1’].values
#Make map of specified area and plot bin locations and numbers
fig = plt.figure(figsize=(10, 10))
m=Basemap(llcrnrlon=144.6570,llcrnrlat=-37.905,urcrnrlon=144.6621,urcrnrlat=-37.8998,resolution=’h’,width=400,height=400,epsg=3110)
m.arcgisimage(service=’World_Street_Map’,xpixels=1000,ypixels=None,dpi=400)
m.scatter(lon,lat,latlon=True)
for i in range(0,32):
 x,y=m(lon[i],lat[i])
 if(type[i]==’Bottles/Cans’):
  col=’y’
 else:
  col=’r’
 if(i % 2==0):
  plt.text(x,y,no[i],va=’bottom’,color=col)
 else:
  plt.text(x,y,no[i],va=’top’,color=col)
plt.title(’WCC Smart Bins Map Werribee’)
#Save plot as jpeg file, so can be plotted by Postman
plt.savefig(’plot.jpeg’)
#Serve plot with flask
app=Flask(__name__)
@app.route("/plot/<path:path>")
def get_file(path):
  """Download plot."""
  return send_from_directory( DOWNLOAD_DIRECTORY, path, as_attachment=True)
if __name__=="__main__":
  app.run(debug=True, host=’0.0.0.0’, port=80, ssl_context=’adhoc’)
It is planned to develop an API which extracts smart bin fill levels from the WCC open datasets and works out when emptying is due for each bin, and the optimal route for trucks which empty the bins and transport waste to landfill and recyclables to recycling factories. The above API is only the start of what we intend to produce; many further stages of development have still to be carried out. The final set of APIs will probably need to be containerized and deployed on a cloud [55]. A bespoke client for accessing the APIs, probably a REST one suitable for mobile as well as PC, will also be needed.

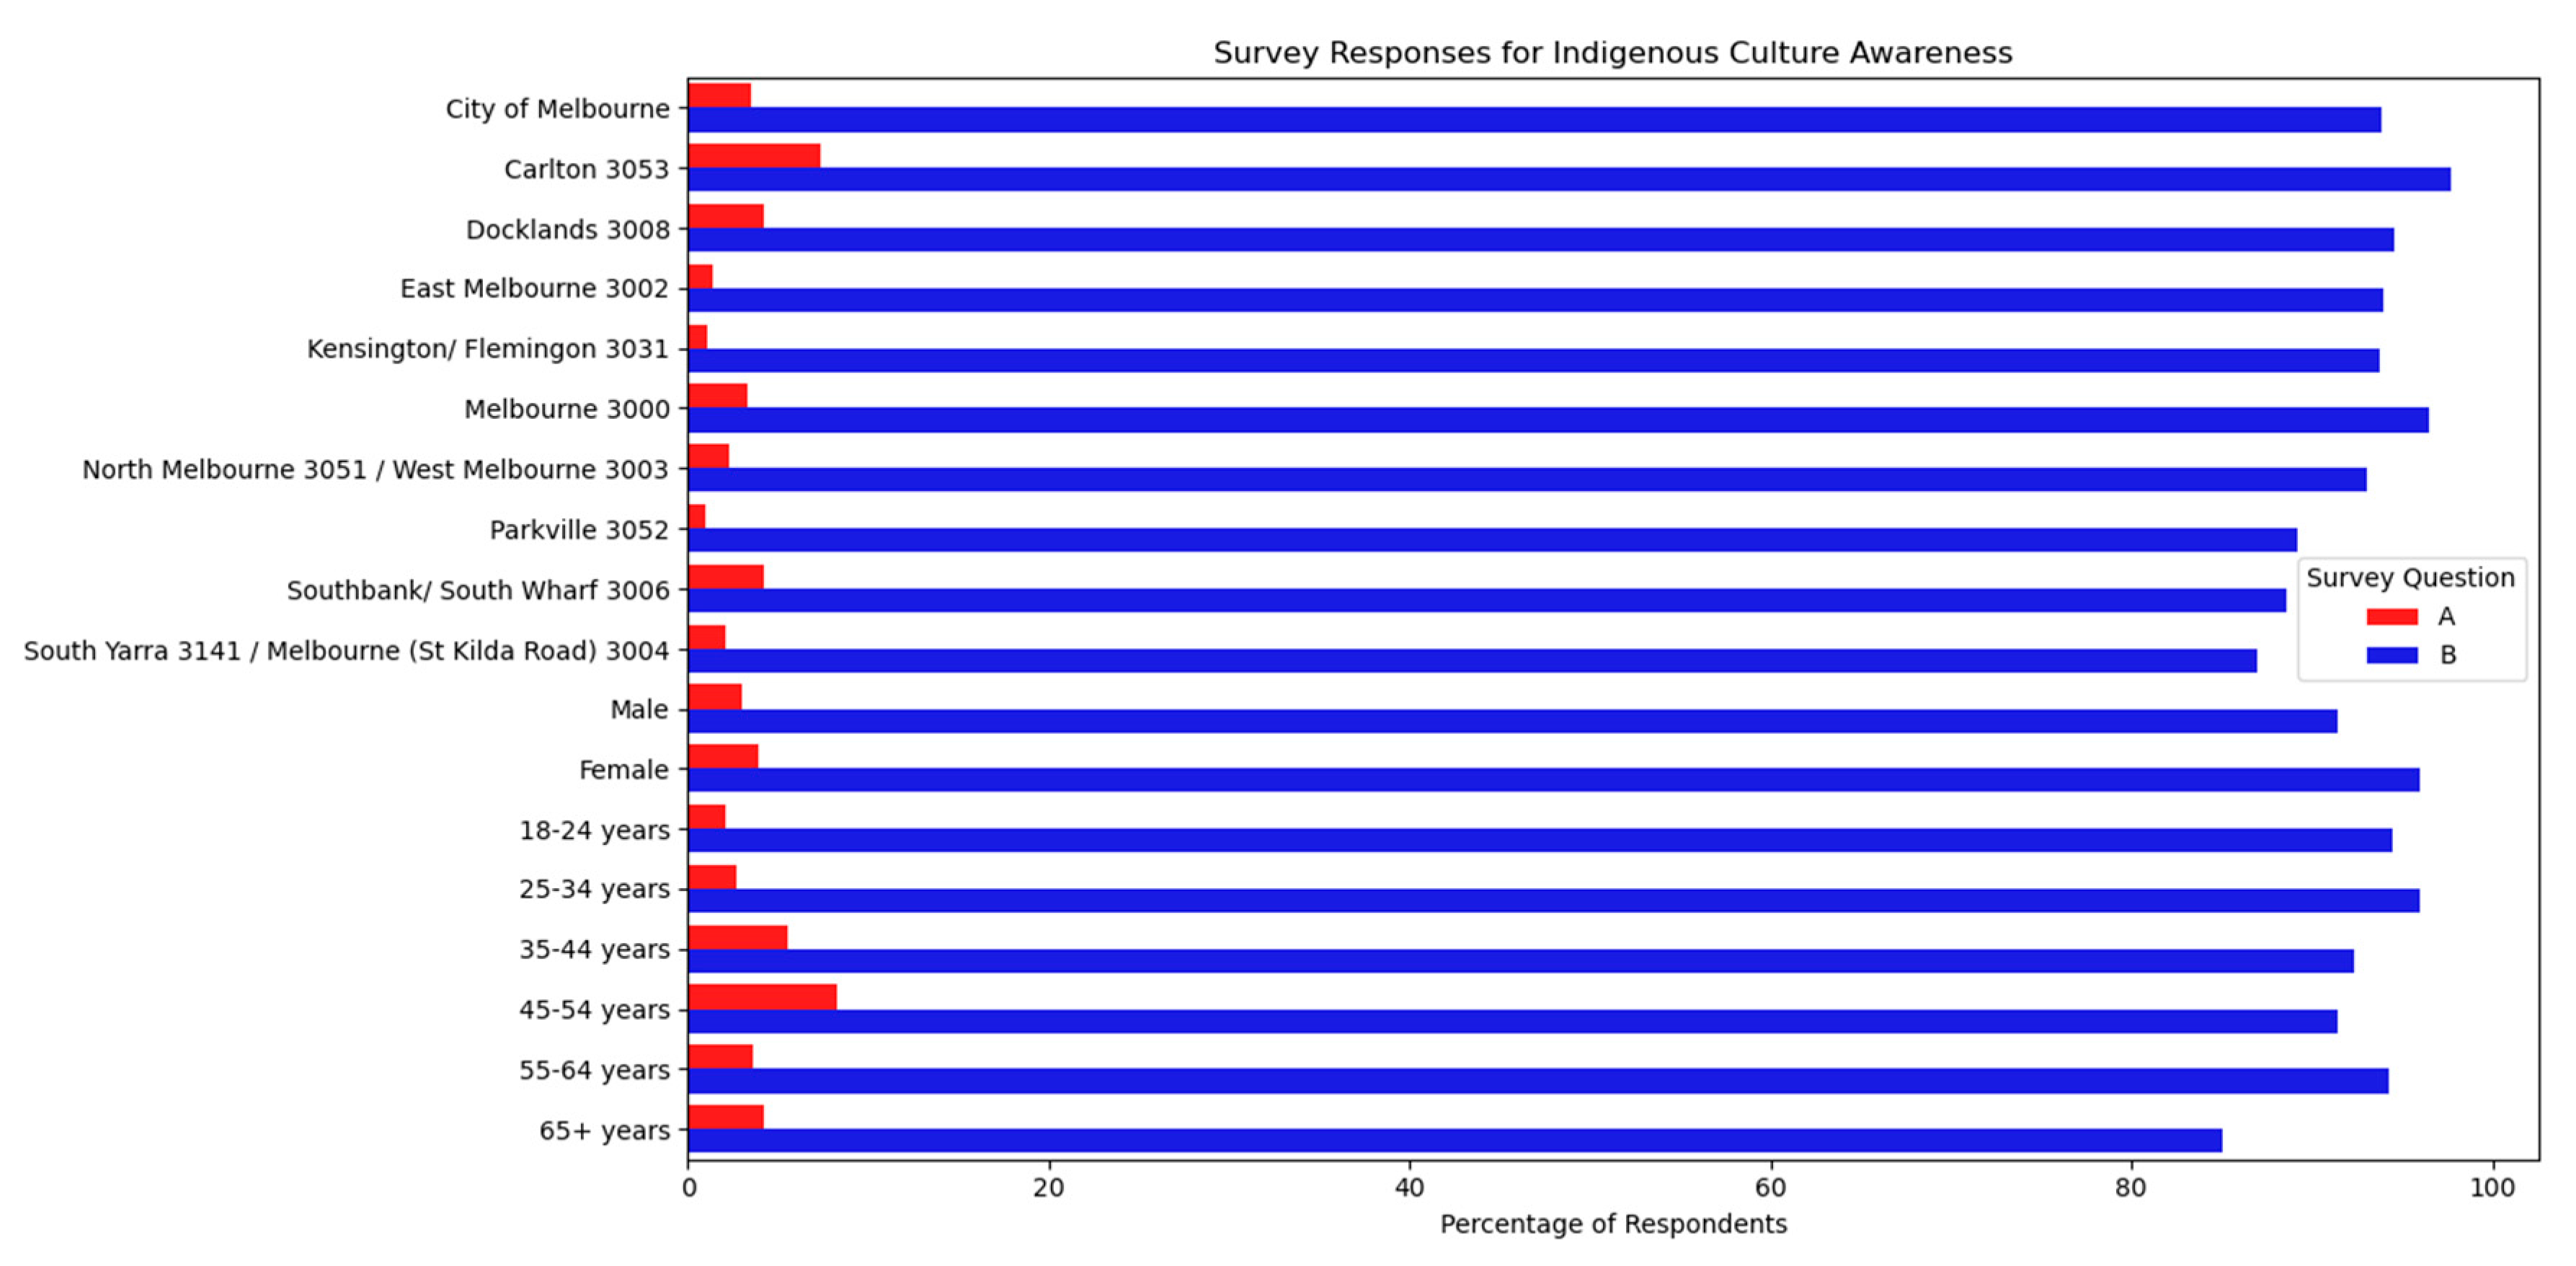
5.4. Analysis of City of Melbourne Social Indicator Survey and Livability Datasets

ML is beginning to be applied to social surveys. Buskirk et al. provided an introduction to the potential for ML techniques for survey research [56]. Ramirez et al. applied ML to public health surveys to explore the use of language for English and non-English responses [57]. This study showed that there are differences between responses in different languages with heterogeneity among the Asian languages. These authors also applied ML to interpret the 2016 US Presidential Election, concluding that registration and voting procedures along with political issues were significant features but that only the age demographic factor was strongly linked to voter participation [58].
Recently, the COM has conducted a survey and related study to measure city performance in regard to health, wellbeing, participation, and connection of its communities. The COM Social Indicators Survey (CoMSIS) [59] was conducted in 2018 while the COM Liveability and Social Indicators study [60] was conducted in 2019. The latter dataset includes social indicators determined from the ComSIS. These data were recorded into two medium-sized open datasets, one that contains responses to questions about lifestyle and health while the other focuses on livability indicators for city services. A third smaller dataset provides indicators of wellbeing by year [61]. The COM uses these datasets to measure city performance against other cities that are members of the World Council on City Data (https://www.dataforcities.org/wccd/).
The first dataset CoMSIS is structured as a CSV file with 666 rows and 10 columns with mainly text data. There are 18 groups of respondents for the survey. Note that while these datasets are not strictly big data, the same analysis techniques can be applied as described in Section 4. Indeed, these datasets are complex: for example, there are 14 topics with one, physical activity, having 108 rows for the following 6 questions asked to each of the 18 groups.
  • Participate in adequate physical activity
  • Participate in sports and exercise activities
  • Participate in sports and exercise activities in COM
  • Participate in organized physical activity
  • Participate in physical activity organized by a fitness, leisure, or indoor sports center
  • Participate in physical activity organized by a sports club or association
A sample of the CoMSIS data analysis is shown in Figure 12 for indigenous cultural awareness. The fraction (%) for each of the 18 surveyed groups that correctly identified the two traditional indigenous tribes in the Melbourne area (Wurundjeri and Boonwurrung) is displayed (in red) with an average value of 3.5%. The blue bars denote the percentage of each group that rated the relationship between indigenous Aboriginal and Torres Strait Islander peoples and other Australians as very important with a much higher average value of 92.7%.
This difference in response may be likely due to the difference between a specific question that is challenging and a more generalized question on culture. It also indicates that most residents are unaware of the two local indigenous tribes or at least cannot name them both. Indeed, the Wurundjeri tribe was historically more populous and has a far higher profile in the modern city than the Boonwurrung. For example, there is a famous 25 m eagle sculpture in the Docklands area, Bunjil, the spirit creator of the Wurundjeri people (https://www.onlymelbourne.com.au/bunjil).
Can ML also be applied here? One area of interest would be to develop an ML model to predict physical activity indicators based on respondent group, sample size, and other features. A preliminary investigation was carried out setting the ’’physical activity" result as the goal state, with several standard algorithms tested on the COM data. Both Random Forest and Naïve Bayes achieved over 98% accuracy for predicting physical activity; however, the sample size is small. This analysis also showed that the features of importance included the respondent group and the sample size.
The second dataset is formatted as a 319-row x column 10 CSV file. Unlike the first dataset, these data were not collected from a people survey but rather from a variety of sources such as the Australian Bureau of Statistics. Similar to CoMSIS, this is a complex dataset with 15 topics each with multiple indicators. Figure 13 shows the 15 livability topics studied and the number of questions (indicators) for each topic.
Further analysis and ML combining the two datasets is planned. This will be presented in a separate paper.

6. Conclusions

Australian governments at all three levels—local (council), state, and federal—are exploiting their open datasets to enable Australian communities to benefit from smart city initiatives. These datasets are amenable to big data analytics and ML techniques to assist governments to improve the efficiency of their operations and planning. In this paper, we briefly reviewed the open datasets published to date by Australian local government councils. We then explored the fields of big data analytics and ML and demonstrated how local councils can benefit from these. A pilot study using python-based data analytics and ML on a Victorian road accident dataset was described. This produced a prototype model that could be used to predict crash probabilities given various factors.
Student projects sponsored by the authors in two Melbourne Universities relating to waste management, traffic, transport, and parking were then described and preliminary results of a social indicators survey analysis (performed by one of the authors) were also provided. It was found that the MLaaS systems, while having great potential, were only available free for limited application and required paid subscriptions for their full services. While these projects are yet to deliver usable applications, the potential is enormous. A smart city or council would benefit from a web-served system that hosted a set of big data analytics models to manage its operations such as waste disposal, parking, and energy consumption.

Author Contributions

Conceptualization, R.B.W. and P.J.R.; software, R.B.W.; investigation, R.B.W. and P.J.R.; writing-original draft preparation, R.B.W. and P.J.R.; writing-review and editing, R.B.W. and P.J.R.; project administration, P.R and R.B.W. All authors have read and agreed to the published version of the manuscript.

Funding

This research received no external funding. The research was done in the authors’ own time out of interest in the topic. One of the authors is an Honorary Research Fellow at the Australian Defence Science and Technology Group (DSTG) and some research was carried out within that organization.

Acknowledgments

The authors acknowledge the work of the Swinburne and Monash University student teams who have worked on the projects described in this paper.

Conflicts of Interest

The authors declare no conflict of interest.

References

  1. City of Adelaide. Ten Gigabit Adelaide. 2018. Available online: https://www.cityofadelaide.com.au/business/ten-gigabit-adelaide/ (accessed on 28 May 2020).
  2. Australian Government. Find, Explore and Reuse Australia’s Public Data. 2020. Available online: https://data.gov.au/ (accessed on 5 April 2020).
  3. Criterion Conferences. How Data Analytics can Improve Local Government. 2016. Available online: https://www.criterionconferences.com/blog/government/data-analytics-can-improve-local-government/ (accessed on 5 April 2020).
  4. Kitchin, R.; McArdle, G. What makes Big Data, Big Data? Exploring the ontological characteristics of 26 datasets. Big Data Soc. 2016, 3, 1–10. [Google Scholar] [CrossRef]
  5. Günther, W.A.; Mehrizi, M.H.R.; Huysman, M.; Feldberg, F. Debating big data: A literature review on realizing value from big data. J. Strat. Inf. Syst. 2017, 26, 191–209. [Google Scholar] [CrossRef]
  6. Lim, C.; Kim, K.-J.; Maglio, P.P. Smart cities with big data: Reference models, challenges, and considerations. Cities 2018, 82, 86–99. [Google Scholar] [CrossRef]
  7. Albino, V.; Berardi, U.; Dangelico, R.M. Smart Cities: Definitions, Dimensions, Performance, and Initiatives. J. Urban Technol. 2015, 22, 3–21. [Google Scholar] [CrossRef]
  8. Sodiq, A.; Baloch, A.A.; Khan, S.A.; Sezer, N.; Mahmoud, S.; Jama, M.; Abdelaal, A. Towards modern sustainable cities: Review of sustainability principles and trends. J. Clean. Prod. 2019, 227, 972–1001. [Google Scholar] [CrossRef]
  9. Bibri, S.E. The IoT for smart sustainable cities of the future: An analytical framework for sensor-based big data applications for environmental sustainability. Sustain. Cities Soc. 2018, 38, 230–253. [Google Scholar] [CrossRef]
  10. Silva, B.N.; Khan, M.; Han, K. Towards sustainable smart cities: A review of trends, architectures, components, and open challenges in smart cities. Sustain. Cities Soc. 2018, 38, 697–713. [Google Scholar] [CrossRef]
  11. Huovila, A.; Bosch, P.; Airaksinen, M. Comparative analysis of standardized indicators for Smart sustainable cities: What indicators and standards to use and when? Cities 2019, 89, 141–153. [Google Scholar] [CrossRef]
  12. Glaeser, E.L.; Kominers, S.D.; Luca, M.; Naik, N. Big data and big cities: The promises and limitations of improved measures of urban life. Econ. Inquir. 2018, 56, 114–137. [Google Scholar] [CrossRef]
  13. Silva, B.N.; Khan, M.; Jung, C.; Seo, J.; Diyan, M.; Han, J.; Yoon, Y.; Han, K. Urban Planning and Smart City Decision Management Empowered by Real-Time Data Processing Using Big Data Analytics. Sensors 2018, 18, 2994. [Google Scholar] [CrossRef] [Green Version]
  14. Munné, R. Big Data in the Public Sector. In New Horizons for a Data-Driven Economy; Cavanillas, J.-M., Curry, E., Wahlster, W., Eds.; Springer Science and Business Media LLC: Berlin, Germany, 2016; pp. 195–208. [Google Scholar]
  15. Bright, J.; Ganesh, B.; Seidelin, C.; Vogl, T.M. Data Science for Local Government. SSRN Electron. J. 2019. [Google Scholar] [CrossRef] [Green Version]
  16. Oates, J. Big Data and Local Government. 2018. Available online: https://www.cbronline.com/opinion/big-data-local-government (accessed on 8 April 2020).
  17. de Souza, J.T.; de Francisco, A.C.; Piekarski, C.M.; Prado, G.F. Data mining and machine learning to promote smart cities: A systematic review from 2000 to 2018. Sustainability 2019, 11, 1077. [Google Scholar] [CrossRef] [Green Version]
  18. Sutcliffe, D. What are the Barriers to Big Data Analytics in Local Government? 2017. Available online: https://blogs.oii.ox.ac.uk/policy/what-are-the-barriers-to-big-data-analytics-in-local-government/ (accessed on 5 April 2020).
  19. Malomo, F.; Sena, V. Data Intelligence for Local Government? Assessing the Benefits and Barriers to Use of Big Data in the Public Sector. Policy Internet 2016, 9, 7–27. [Google Scholar] [CrossRef]
  20. Symons, T. Datavores of Local Government: Using Data to Make Services More Personalised, Effective and Efficient. 2016. Available online: https://media.nesta.org.uk/documents/local_datavores_discussion_paper-july-2016.pdf (accessed on 16 January 2020).
  21. Zanmiller, A. The State of Open Data in American Local Governments. Digital Commons @ Cal Poly, California Polytechnic State University—San Luis Obispo, US. 2015. Available online: https://digitalcommons.calpoly.edu/crpsp/128/ (accessed on 2 June 2020).
  22. Kim, G.-H.; Trimi, S.; Chung, J.-H. Big-data applications in the government sector. Commun. ACM 2014, 57, 78–85. [Google Scholar] [CrossRef]
  23. Hong, S.; Kim, S.H.; Kim, Y.; Park, J. Big Data and government: Evidence of the role of Big Data for smart cities. Big Data Soc. 2019, 6, 1–11. [Google Scholar] [CrossRef]
  24. Open Knowledge Australia. Who is Publishing Open Data in Australia. 2016. Available online: https://opencouncildata.org/australia/ (accessed on 10 April 2020).
  25. Australian Government. Australian Government Public Data Policy Statement. 2015. Available online: https://www.pmc.gov.au/sites/default/files/publications/aust_govt_public_data_policy_statement_1.pdf (accessed on 8 June 2020).
  26. The World Bank. Open Data Toolkit Technology Option. 2019. Available online: http://opendatatoolkit.worldbank.org/en/technology.html (accessed on 10 April 2020).
  27. Carter, E.; Adam, P.; Tsakis, D.; Shaw, S.; Watson, R.; Ryan, P. Enhancing pedestrian mobility in Smart Cities using Big Data. J. Manag. Anal. 2020, 7, 173–188. [Google Scholar] [CrossRef]
  28. Nelli, F. Python Data Analytics; Springer Science and Business Media LLC: Berlin, Germany, 2018. [Google Scholar]
  29. Cross, B. Comparing Machine Learning as a Service: Amazon, Microsoft Azure, Google Cloud AI, IBM Watson. 2018. Available online: https://www.altexsoft.com/blog/datascience/comparing-machine-learning-as-a-service-amazon-microsoft-azure-google-cloud-ai-ibm-watson/ (accessed on 7 April 2020).
  30. DataRobot. Enabling the AI-Driven Enterprise. 2020. Available online: https://datarobot.com (accessed on 1 May 2020).
  31. Rstudio. Open Source & Professional Software for Data Science Teams. 2020. Available online: https://rstudio.com (accessed on 16 January 2020).
  32. BigML. Machine Learning Made Beautifully Simple for Everyone. 2020. Available online: https://bigml.com/ (accessed on 16 January 2020).
  33. Altexsoft. Machine Learning Project Structure: Stages, Roles, and Tools. 2018. Available online: https://www.altexsoft.com/blog/datascience/machine-learning-project-structure-stages-roles-and-tools/ (accessed on 7 April 2020).
  34. Brownlee, J. How to Make Predictions with Scikit-learn. 2018. Available online: https://machinelearningmastery.com/make-predictions-scikit-learn/ (accessed on 5 April 2020).
  35. Watson, R.; Ryan, P. Visualization and Prediction of Road Accident Data Using Python Machine Learning Version 2. (Unpublished work). 2020; (Watson, R. unaffiliated; Ryan, P. Defence Science & Technology Group). [Google Scholar]
  36. Brownlee, J. How to Connect Model Input Data With Predictions for Machine Learning. 2019. Available online: https://machinelearningmastery.com/how-to-connect-model-input-data-with-predictions-for-machine-learning/ (accessed on 5 April 2020).
  37. Paul, S. Turning Machine Learning Models into APIs in Python. 2018. Available online: https://www.datacamp.com/community/tutorials/machine-learning-models-api-python (accessed on 18 January 2020).
  38. Berlind, D. What Are APIs and How Do They Work? 2015. Available online: https://www.programmableweb.com/api-university/what-are-apis-and-how-do-they-work (accessed on 16 January 2020).
  39. IBM. Overview: Watson Machine Learning. 2020. Available online: https://dataplatform.cloud.ibm.com/docs/content/wsj/analyze-data/ml-overview.html (accessed on 13 January 2020).
  40. Medvedev, A.; Fedchenkov, P.; Zaslavsky, A.; Anagnostopoulos, T.; Khoruzhnikov, S. Waste Management as an IoT-Enabled Service in Smart Cities. In Intelligent Tutoring Systems; Springer Science and Business Media LLC: Berlin, Germany, 2015; Volume 9247, pp. 104–115. [Google Scholar]
  41. Anagnostopoulos, T.; Zaslavsky, A.; Kolomvatsos, K.; Medvedev, A.; Amirian, P.; Morley, J.; Hadjieftymiades, S. Challenges and Opportunities of Waste Management in IoT-Enabled Smart Cities: A Survey. IEEE Trans. Sustain. Comput. 2017, 2, 275–289. [Google Scholar] [CrossRef]
  42. Esmaeilian, B.; Wang, B.; Lewis, K.; Duarte, F.; Ratti, C.; Behdad, S. The future of waste management in smart and sustainable cities: A review and concept paper. Waste Manag. 2018, 81, 177–195. [Google Scholar] [CrossRef]
  43. Sharma, M.; Joshi, S.; Kannan, D.; Govindan, K.; Singh, R.; Purohit, H. Internet of Things (IoT) adoption barriers of smart cities’ waste management: An Indian context. J. Clean. Prod. 2020, 270, 122047. [Google Scholar] [CrossRef]
  44. Gupta, P.K.; Shree, V.; Hiremath, L.; Rajendran, S. The Use of Modern Technology in Smart Waste Management and Recycling: Artificial Intelligence and Machine Learning. In Advances in Intelligent Information and Database Systems; Springer Science and Business Media LLC: Berlin, Germany, 2019; Volume 823, pp. 173–188. [Google Scholar]
  45. Pardini, K.; Rodrigues, J.J.P.C.; Kozlov, S.; Kumar, N.; Furtado, V. IoT-Based Solid Waste Management Solutions: A Survey. J. Sens. Actuator Netw. 2019, 8, 5. [Google Scholar] [CrossRef] [Green Version]
  46. Rutqvist, D.; Kleyko, D.; Blomstedt, F. An Automated Machine Learning Approach for Smart Waste Management Systems. IEEE Trans. Ind. Inf. 2020, 16, 384–392. [Google Scholar] [CrossRef]
  47. Al-Masri, E.; Diabate, I.; Jain, R.; Lam, M.H.; Nathala, S.R. Recycle.io: An IoT-Enabled Framework for Urban Waste Management. In Proceedings of the 2018 IEEE International Conference on Big Data (Big Data), Seattle, WA, USA, 10–13 December 2018; pp. 5285–5287. [Google Scholar]
  48. Idwan, S.; Mahmood, I.; Zubairi, J.A.; Matar, I. Optimal Management of Solid Waste in Smart Cities using Internet of Things. Wirel. Pers. Commun. 2019, 110, 1–17. [Google Scholar] [CrossRef]
  49. Chaudhari, S.S.; Bhole, V.Y. Solid Waste Collection as a Service using IoT-Solution for Smart Cities. In Proceedings of the 2018 International Conference on Smart City and Emerging Technology (ICSCET), Mumbai, India, 5 January 2018; pp. 1–5. [Google Scholar]
  50. Fataniya, B.; Sood, A.; Poddar, D.; Shah, D. Implementation of IoT based Waste Segregation and Collection System. Int. J. Electron. Telecommun. 2019, 65, 579–584. [Google Scholar]
  51. Bristol City Council. Towards a Zero Waste Bristol: Waste and Resource Management Strategy. 2016. Available online: https://www.bristol.gov.uk/documents/20182/33395/Towards+a+Zero+Waste+Bristol+-+Waste+and+Resource+Management+Strategy/102e90cb-f503-48c2-9c54-689683df6903 (accessed on 2 May 2020).
  52. MacDonald, L. Smart Bins Detecting Smelly Rubbish and Wi-Fi Benches, All Part of Hobart’s Hi-Tech Future. 2018. Available online: https://www.abc.net.au/news/2018-09-13/smart-bins-in-hobart-will-let-you-know-when-full/10238770]. (accessed on 26 April 2020).
  53. Waste Management Review. Councils Benefit from Solar Bins Australia. 2018. Available online: https://wastemanagementreview.com.au/smart-bins/ (accessed on 27 April 2020).
  54. Wyndham City Council. Benchmarking Wyndham as a Smart City. 2019. Available online: https://www.wyndham.vic.gov.au/sites/default/files/2019-03/Benchmarking%20Wyndham%20as%20a%20Smart%20City.pdf (accessed on 16 January 2020).
  55. Docker. What is a Container? A standardized Unit of Software. 2020. Available online: https://www.docker.com/resources/what-container (accessed on 3 June 2020).
  56. Buskirk, T.D.; Kirchner, A.; Eck, A.; Signorino, C.S. An Introduction to Machine Learning Methods for Survey Researchers. Surv. Pr. 2018, 11, 1–10. [Google Scholar] [CrossRef] [Green Version]
  57. Ramirez, C.M.; Abrajano, M.A.; Alvarez, R.M. Using Machine Learning to Uncover Hidden Heterogeneities in Survey Data. Sci. Rep. 2019, 9, 16061. [Google Scholar] [CrossRef] [Green Version]
  58. Kim, S.-Y.S.; Alvarez, R.M.; Ramirez, C.M. Who Voted in 2016? Using Fuzzy Forests to Understand Voter Turnout. Soc. Sci. Q. 2020, 101, 978–988. [Google Scholar] [CrossRef] [Green Version]
  59. City of Melbourne. Social Indicators for City of Melbourne Residents. 2018. Available online: https://data.melbourne.vic.gov.au/People/Social-Indicators-for-City-of-Melbourne-Residents-/n9ie-cp6t (accessed on 1 April 2020).
  60. City of Melbourne. City of Melbourne Liveability and Social Indicators. 2019. Available online: https://data.melbourne.vic.gov.au/People/City-of-Melbourne-Liveability-and-Social-Indicator/nyr3-sees (accessed on 3 April 2020).
  61. City of Melbourne. Indicators of Wellbeing by Year (Future Melbourne). 2020. Available online: https://data.melbourne.vic.gov.au/People/Indicators-of-wellbeing-by-year-Future-Melbourne-/khvg-gtaq (accessed on 6 April 2020).
Figure 1. Numbers of open datasets published by Victorian local councils (numbers as at 11 April 2020, from https://opencouncildata.org).
Smartcities 03 00034 g001
Figure 2. Numbers of Victorian local councils publishing some common datasets (from https://data.gov.au, City of Melbourne datasets on link https://data.melbourne.vic.gov.au/).
Smartcities 03 00034 g002
Figure 3. Significant trees (shown in red) in the City of Boroondara (from https://data.gov.au/dataset/ds-dga-14e2b87e-c733-4071-b604-c0cb33d14a42/details?q=boroondara).
Smartcities 03 00034 g003
Figure 4. Software modules used by the authors for big data analytics with python libraries.
Smartcities 03 00034 g004
Figure 5. (a) Number of persons killed in each speed zone in state of Victoria, and (b) severity of accident in each speed zone (from [35]).
Smartcities 03 00034 g005
Figure 6. Weekday pedestrian count by quarter over past five years in City of Melbourne (adapted from [27]).
Smartcities 03 00034 g006
Figure 7. Home page of prototype Smart City website developed by Swinburne University student project team.
Smartcities 03 00034 g007
Figure 8. Stakeholders of the waste management system (reproduced with permission from [40]).
Smartcities 03 00034 g008
Figure 9. Histogram of fill levels of Wyndham City Council’s 32 smart bins on one day.
Smartcities 03 00034 g009
Figure 10. Example of Wyndham City Council smart bin fill levels over a 13-day period in 2018.
Smartcities 03 00034 g010
Figure 11. Map of Wyndham City Council smart bins located in Werribee CBD.
Smartcities 03 00034 g011
Figure 12. Fractions of respondents from each surveyed cohort who could (a) identify traditional indigenous tribes in the City of Melbourne (marked A) and (b) who rated the relationship with indigenous peoples as significant (marked B).
Smartcities 03 00034 g012
Figure 13. Topics for livability survey and number of questions for each topic.
Smartcities 03 00034 g013
Table 1. Scores achieved by four machine learning models applied.
ModelScore
Random Forest0.634
Naïve Bayes0.629
K-Neighbors Classifier0.586
Linear Support Vector Classification0.451
Table 2. Feature importance using Random Forest Classifier.
FeatureImportance
LIGHT_CONDITION0.344
ROAD_GEOMETRY0.175
SPEED_ZONE0.480

