1. Introduction
Urban public space is a place for the daily activities of residents and can provide residents with a comfortable living environment and improve their quality of life [
1,
2]. As the city continues to develop, the demand for public space from urban residents is growing, too [
3]. People begin to pay more attention to the various factors of public space—including the impact on natural and artificial factors on human behavior—and pay more attention to human needs and motivation. Urban design is also increasingly rationalized and humanized [
4]. The Multi-Agent System (MAS) studies the macroscopic laws of the system as a whole by simulating and observing the microscopic behavior of a large number of agents. The MAS provides a more reasonable and accurate interpretation of the evolution mechanism of complex systems, such as behaviors, in many fields and has great applications in the fields of biology, economics, architectural urban planning, and ecology [
5]. The use of the MAS for the simulation of urban crowd activities provides a variety of possibilities for providing accurate predictions and evaluations of urban public space and urban design [
6].
Agent-based modeling has been used successfully in behavioral and social sciences as well as many practical applications for a long time [
7]. Currently, the MAS is widely used in crowd evacuation, traffic simulation and other indoor simulations, mostly in airports and railway stations. Alessandro et al. studied the MAS in the museum, assessing the museum’s carrying capacity for tourists and its safety during emergencies [
8]. He derived the optimal range for the quantity of visitors and developed a contingency plan for the museum. At present, the related research on the MAS method of indoor environments is more common. Because of the simple influencing factors of an indoor environment, such methods are highly accurate. Furthermore, it can be better fitted to the actual situation and has developed well. However, outdoor environments are relatively complex; various factors include building height differences, surrounding traffic, visual obstacles, and weather conditions [
5]. This indicates that the constructed model must contain complexity parameters, and the difficulty of the main system simulation is greatly increased compared to that of the indoors.
In urban public spaces, people walk, rest, watch or participate in fitness, all of which are activities in pursuit of spiritual pleasure [
1]. The Danish architect Jan Gehl proposed that spontaneous and social activities such as conversation, lounging, and resting increased when external conditions were appropriate and when weather and places were attractive [
9]. High-quality public open spaces can increase the frequency of public activities. Obviously, the thermal comfort of the outdoor environment is an important factor that can influence people’s outdoor activities. The urban microclimate is closely related to thermal comfort. Nikolopoulou hosted the European Urban Open Space Renaissance Project; the statistical analysis of the project showed that the urban microclimate has an important relationship with thermal comfort [
10]. Under the influence of the urban microclimate, thermal comfort is very important to urban residents’ lives, work and activities [
11].
Currently, most MAS algorithms consider the characteristics and group interaction characteristics of agents such as seeking, collision avoidance, and wandering as well as how people find the obstacles to the environment and destination-oriented abilities [
12,
13]. The MAS algorithms hardly consider the outdoor physical environment. However, in the crowd activity simulation of outdoor public spaces, such algorithm rules inevitably make the simulation results appear mechanical and outside of reality. In outdoor spaces, people’s activities are highly correlated with the thermal comfort of the environment. In a manner of speaking, microclimate is an indispensable parameter for MAS simulation.
The urban microclimate is the local climate formed by the urban cover layer during urbanization, and it encompasses the most direct relationship to the comfort of urban outdoor spaces [
14]. In addition to sunshine, wind, temperature and humidity, microclimate is also affected by factors such as vegetation, buildings, surface properties, and urban planning [
9]. Appropriate urban microclimates can effectively prolong people’s activity time in public spaces, increase people’s outdoor travel rate, and improve the utilization of public space. There are many models for measuring the thermal comfort of the outdoor environment [
2]. This study uses the Predicted Mean Vote (PMV) model, which is one of the most widely used thermal comfort evaluation models and makes calculation easy [
15]. The PMV model mainly considers the climate and heat balance of the human body. The former includes temperature, relative humidity and wind speed, while the latter includes clothing’s thermal resistance and human metabolic rates. In addition, sunshine is also an important factor of the microclimate influencing people’s outdoor activities [
16,
17]. In cold outdoor spaces during winter, sufficient sunshine can encourage people to stay and rest. In the hot summer, people prefer to stay in the shade.
Therefore, we transformed these microclimate factors into urban thermal comfort perception and sunlight perception, combined with the visual perception conditions, to form a new MAS algorithm, which simulates the behavior characteristics of people in outdoor spaces more reasonably. Taking the Gulou Square in Nanjing, China, as a case, this study simulated the behavior of people in Gulou Square under different seasons and different time conditions. The simulation results presented the impact of seasonal environmental changes on people’s activities, and proved the optimization effect of the new algorithm.
2. Materials and Methods
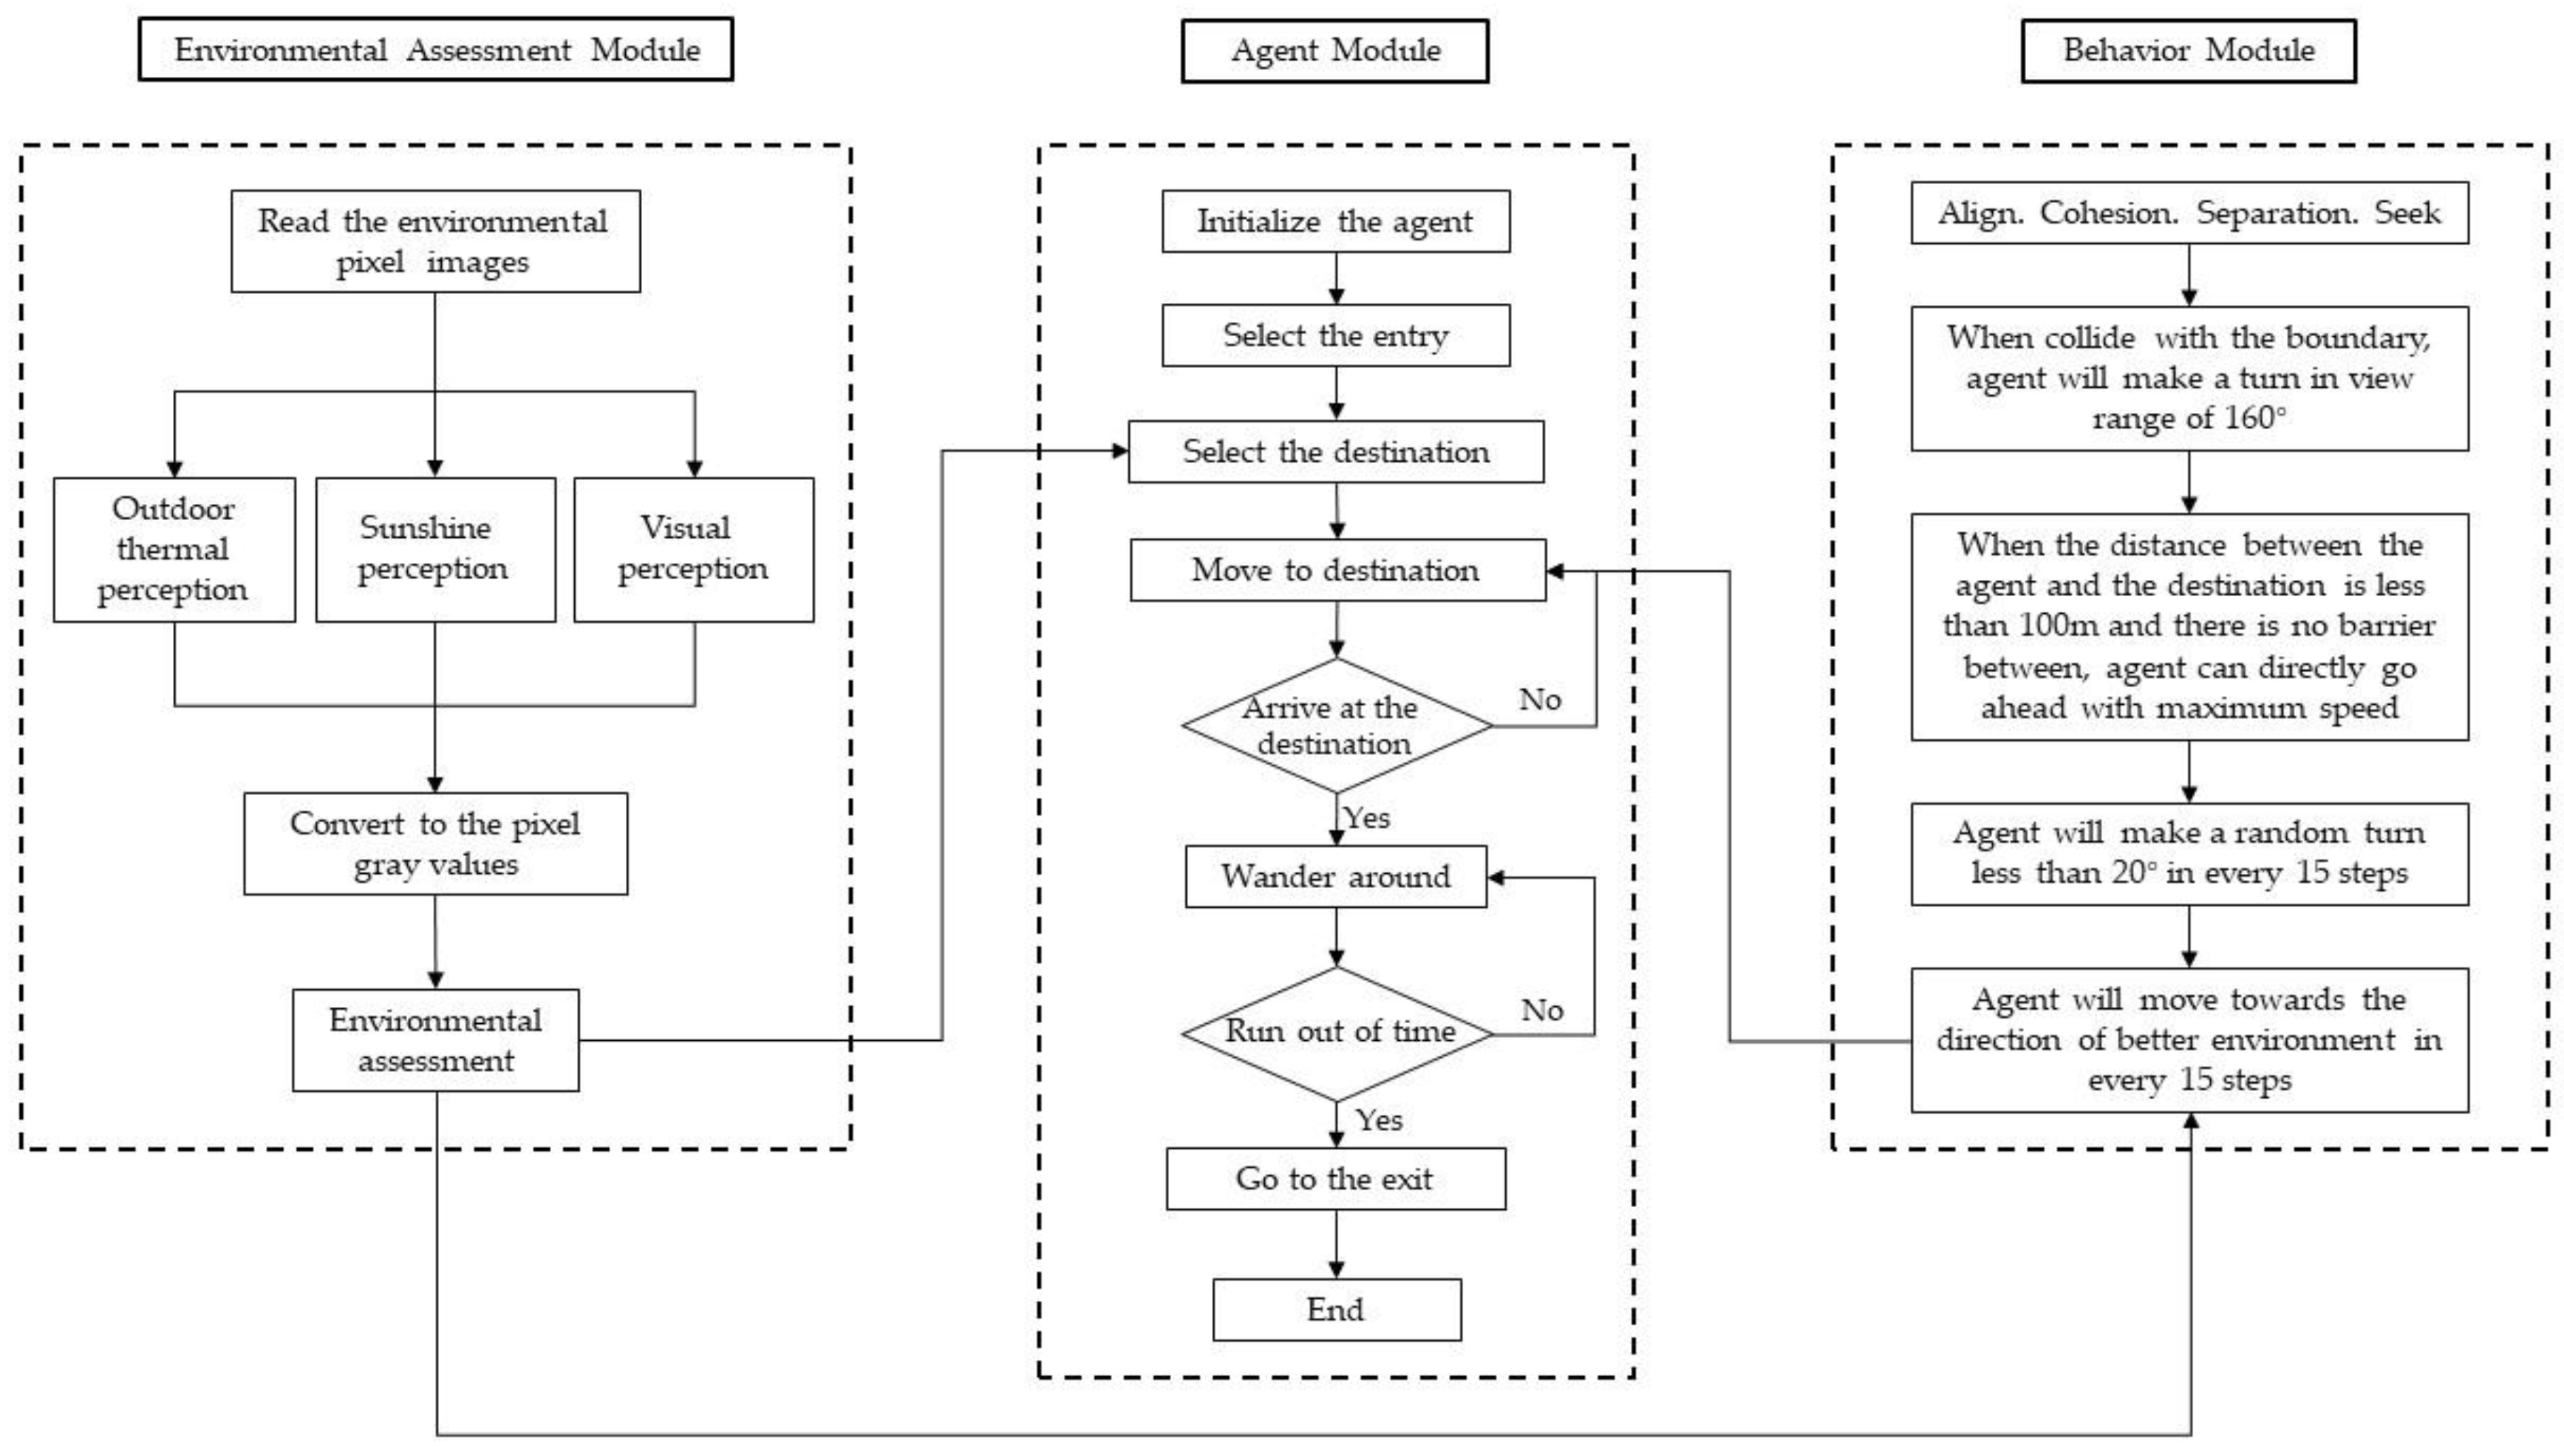
In general, the framework of the MAS consists of the following parts: subject, environment, rules and parameters, interactive interfaces, and simulation platform [
5]. The MAS can develop in the interaction between agent and environment through individual rules and environmental parameters to show a complex evolution process. This study uses the processing programming platform as an interactive simulation platform, focusing on the impact of environmental and spatial factors on the activities of people.
2.1. Environmental Parameters
Regarding the environment, our study focuses on the effects of environmental and spatial factors such as outdoor thermal perception, sunshine perception, and the extension of vision on the activities of the agents.
2.1.1. Outdoor Thermal Perception
Thermal comfort is the idea that people are satisfied with the thermal environment [
17]. The environmental thermal comforts evaluation model adopted in this method is the PMV. The closer the PMV value is to 0, the more comfortable it is. The PMV values can be calculated by using the microclimate simulation software: ENVI-met [
18,
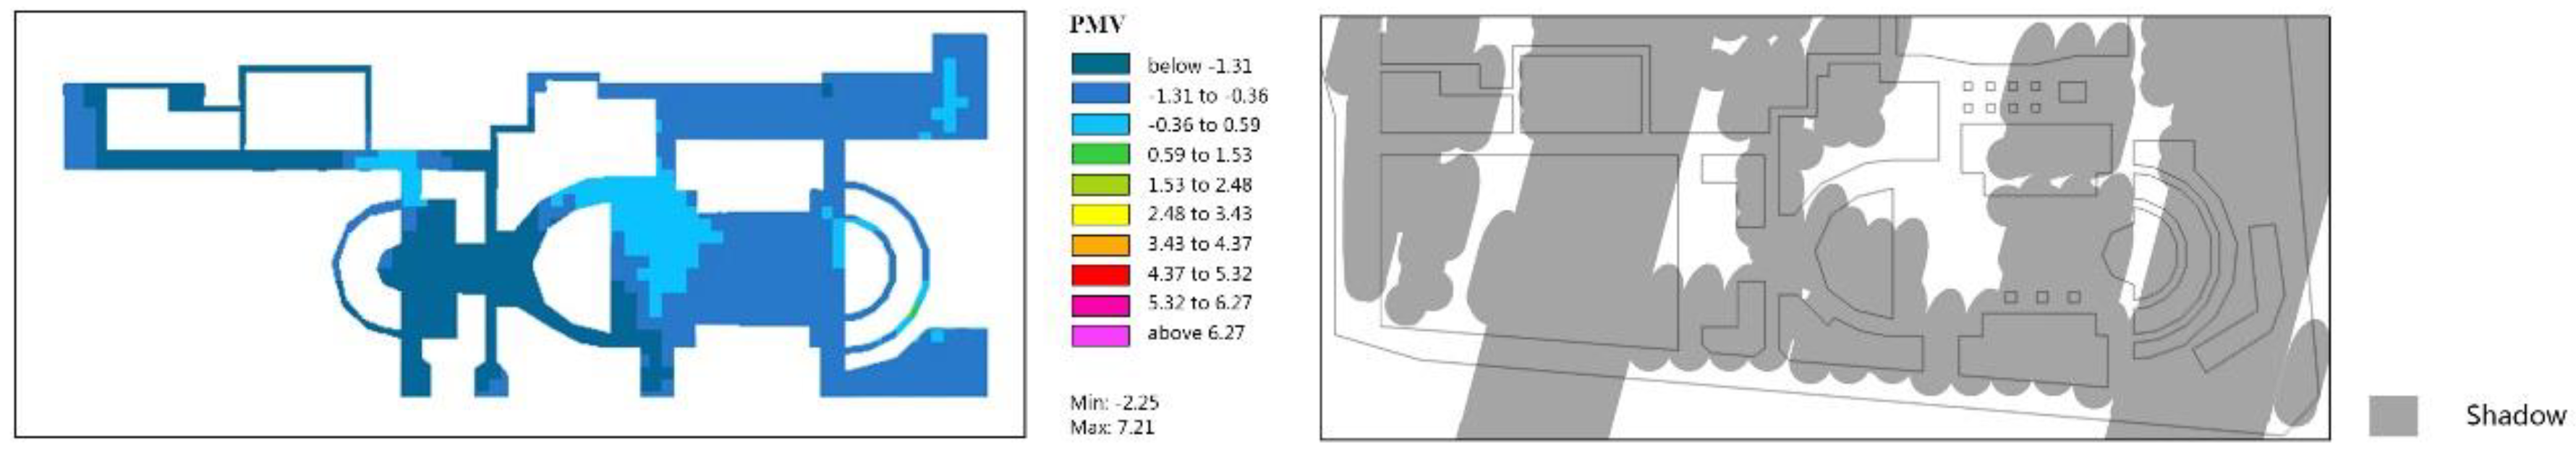
19]. The simulation times of the method are usually the summer solstice day, the winter solstice day and the spring equinox day. The summer solstice day and winter solstice day are the two days when the temperature in China is the highest and lowest in a year, respectively. On the summer solstice day and winter solstice day, people have the highest demand for a comfortable environment while they are taking activities in the open air. On the spring equinox day, the weather is very comfortable, and people have no obvious need for sunshine and temperature regulation in outdoor spaces. Therefore, it is suitable to compare the spring equinox day with the winter or summer solstice days in order to analyze the relationship between thermal environmental factors, the extension of vision and people’s activities. This methodology needs to obtain the site information first, then construct the site model in the ENVI-met and finally use the ENVI-met to simulate and export the PMV table data. The PMV values changed into absolute values and mapped to pixel gray values of 0–255 to form raster images. Among them, in the places with lighter color, the PMV value of this area is closer to 0, so they are more comfortable.
2.1.2. Sunshine Perception
In both hot and cold seasons, sunshine has a great influence on people’s outdoor activities. Sunshine can be calculated by many methods. This method uses SketchUp software for modeling and calculation [
16]. By accurately positioning the geographical location of the model and setting the simulation time, the sunshine shadow of the site at that time can be obtained.
2.1.3. Visual Perception
We introduce spatial syntax to measure people’s visual perception. Spatial syntax is a theory about studying the spatial organization of quantitative descriptions of the spatial structure of human settlements such as buildings, settlements, cities, and even landscapes [
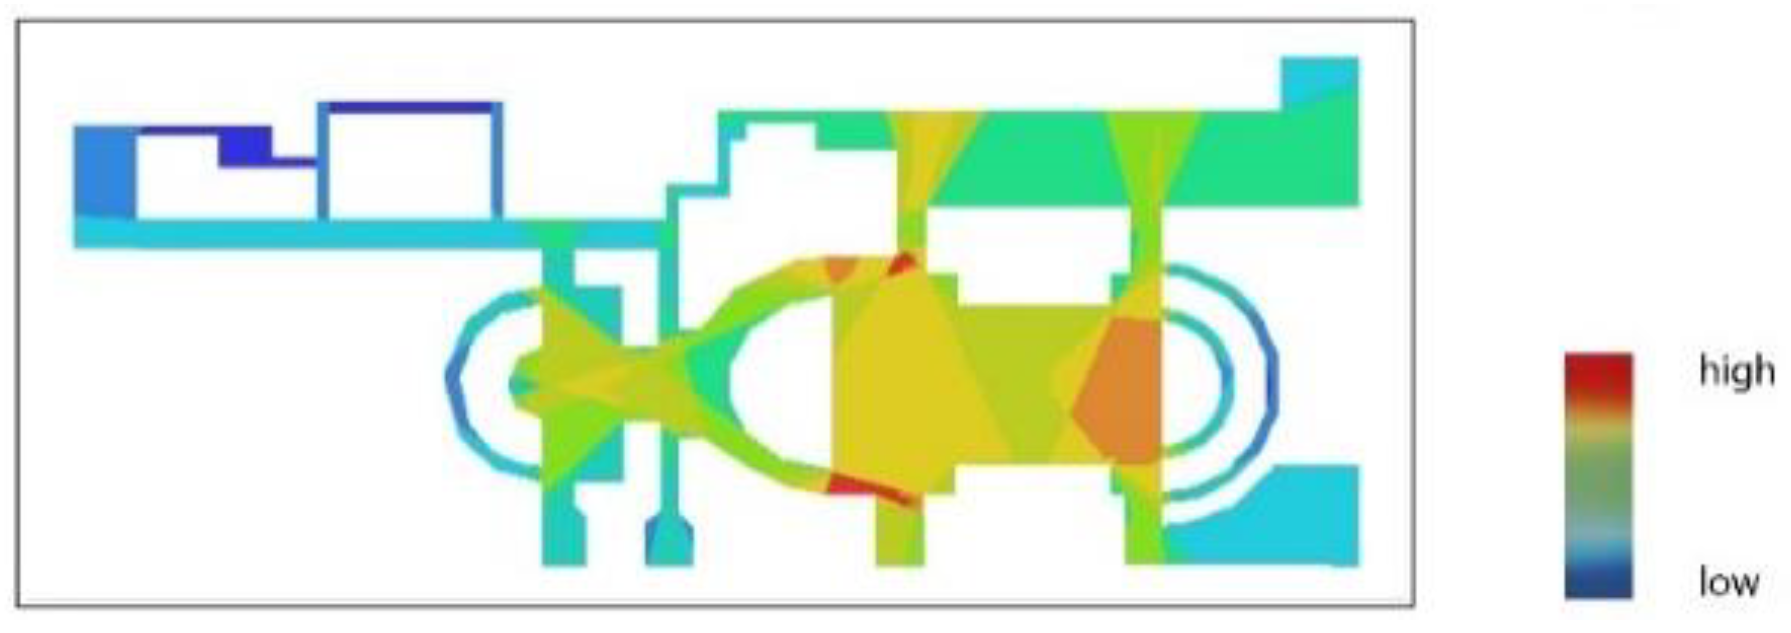
20]. Depthmap software, as a specialized analysis software for spatial syntax, can be used to analyze the field of visual integration and connectivity in the site [
21]. There are many scholars doing research using Depthmap software to analyze people’s activities in public spaces. Bendjedidi used Depthmap software to analyze Elhouria square and combined this with the field pedestrian count [
22]. He found that the behavior of people in the square space is highly dependent on the visibility, accessibility and connectivity to its surroundings. Additionally, there is a high correlation between the behavior of people choosing places for activities and the syntactic theory. Previously, we have also done research on the combination of space syntax and multiple agents [
23].
The results of these data show the accessibility with which people can arrive at a certain point. The higher the values are, the wider the field of view, and the easier it is for people to get there. The Visual Integration (HH) [
23,
24,
25,
26] values are exported as tabular data, which are read on the programming platform and mapped to pixel gray values of 0–255 to form raster images. Among them, in the places with lighter color, the HH value shows that the place is bigger and the extension of vision is wider.
2.2. Rules for Human Activities
In the basic algorithmic languages of search, collision avoidance, roaming, and destination guidance, we add the human activities rules function and the environment function, both of which are written by ourselves. The environment function includes the influence of the environment on human walking direction, movement speed, the choice of pedestrian resting positions, boundary of collisions, and random turning. The rules of human activity functions determine the results of human choice, including the degree of human choice of the environmental factors, the time people stay in their destination, and the choice of entrance and exit.
2.2.1. Agent Destination Selection Rule
We assume that agents are local residents who are familiar with the site and that they can accurately find the location in which to stay that suits their preferences. When an agent is created, his or her sensitivity to the environment is generated, too. We use four parameters to express the sensitivity weight of the agent: the need for extension of vision, sunshine, environmental comfort and time spent outdoors. We convert the first three parameters into data, of the range 0–1. For the parameters about needing either shadow or sunlight are the Boolean contents TRUE and FALSE. TRUE is recorded as 1 and FALSE is recorded as 0. The time spent staying in the destination is between 300 and 500, and it will be converted into the number of times the program loops. Once the loop is repeated, the agent will take a step forward.
After obtaining the four sensitivity weight parameters, the program rereads the pixel data of the outdoor thermal environment, sunshine, and extension of vision parameters and obtain the comprehensive evaluation figure of the environment of the subject person at each place. The position with a higher value is considered more suitable for the agent. Since the environment data is imported from the form of a raster figure, the program calculates the pixel as the unit, and one pixel represents 1 m2. However, in the real word, people generally evaluate the environment based on regions. Although the regional division and regional boundaries are vague, it is not reasonable to divide the region with a size of 1 m2. To make the simulation results more realistic, we need to divide the site into several regions, regarding the average environmental assessment value of the region as the basic unit for comparison. The program divides the site geometrically according to the results of the extension of vision. We sort the regional evaluation from high to low, and the five regions with the highest evaluation data will have a probability of becoming the destination of the agent’s choice, and the probability decreases with the regional average rating. The agent will select the area to which it wants to walk. The destination is a random coordinate within the area. After the agent arrives at the destination, it will stay for a while, and the agent can move slightly from the destination.
2.2.2. Agent Motion Rule
In this study, the agent will randomly select one entrance through which to enter the square and determine where to go according to its own parameters. While walking, the agent will continue to obtain the environmental data information and evaluate the environment. The agent has a certain probability to walk in a more suitable direction in the 160° field of vision. To simulate people’s movement more reasonably, we also set a certain probability of turning 20° randomly toward the direction of movement every 15 steps. If the agent collides with an obstacle during this movement, it will turn toward the direction without the obstacle. After the agent reaches the destination, it will spend a certain time staying there and wandering near the destination. After this time is over, the agent will choose an exit through which to leave the site. In addition, the algorithm also included the alignment with cohesion, separation, etc.
Figure 1 is the flow chart of the agent.
2.3. Processing Programming Platform
At present, the main MAS simulation platforms include StartLogo, NetLogo, Ascape, TNGLab, and Depthmap. Each simulation platform has its own advantages and disadvantages [
27]. NetLogo and Depthmap are commonly used in architecture. However, the flexibility of the two is extremely poor. They cannot freely debug the main parameters and add environmental parameters, and people cannot exactly understand its algorithm and logic, which greatly reduces the credibility of the results of the analysis. Therefore, this paper adopts Processing as the programming platform. The Processing is a software and a programming language. It is free and open source, and is a flexible language to code within the context of the visual arts [
28]. Processing can read multilayer environmental data, which is more scalable than the aforementioned platform. Additionally, it can show the process of agent operation in real time while running the program.
3. Case Study
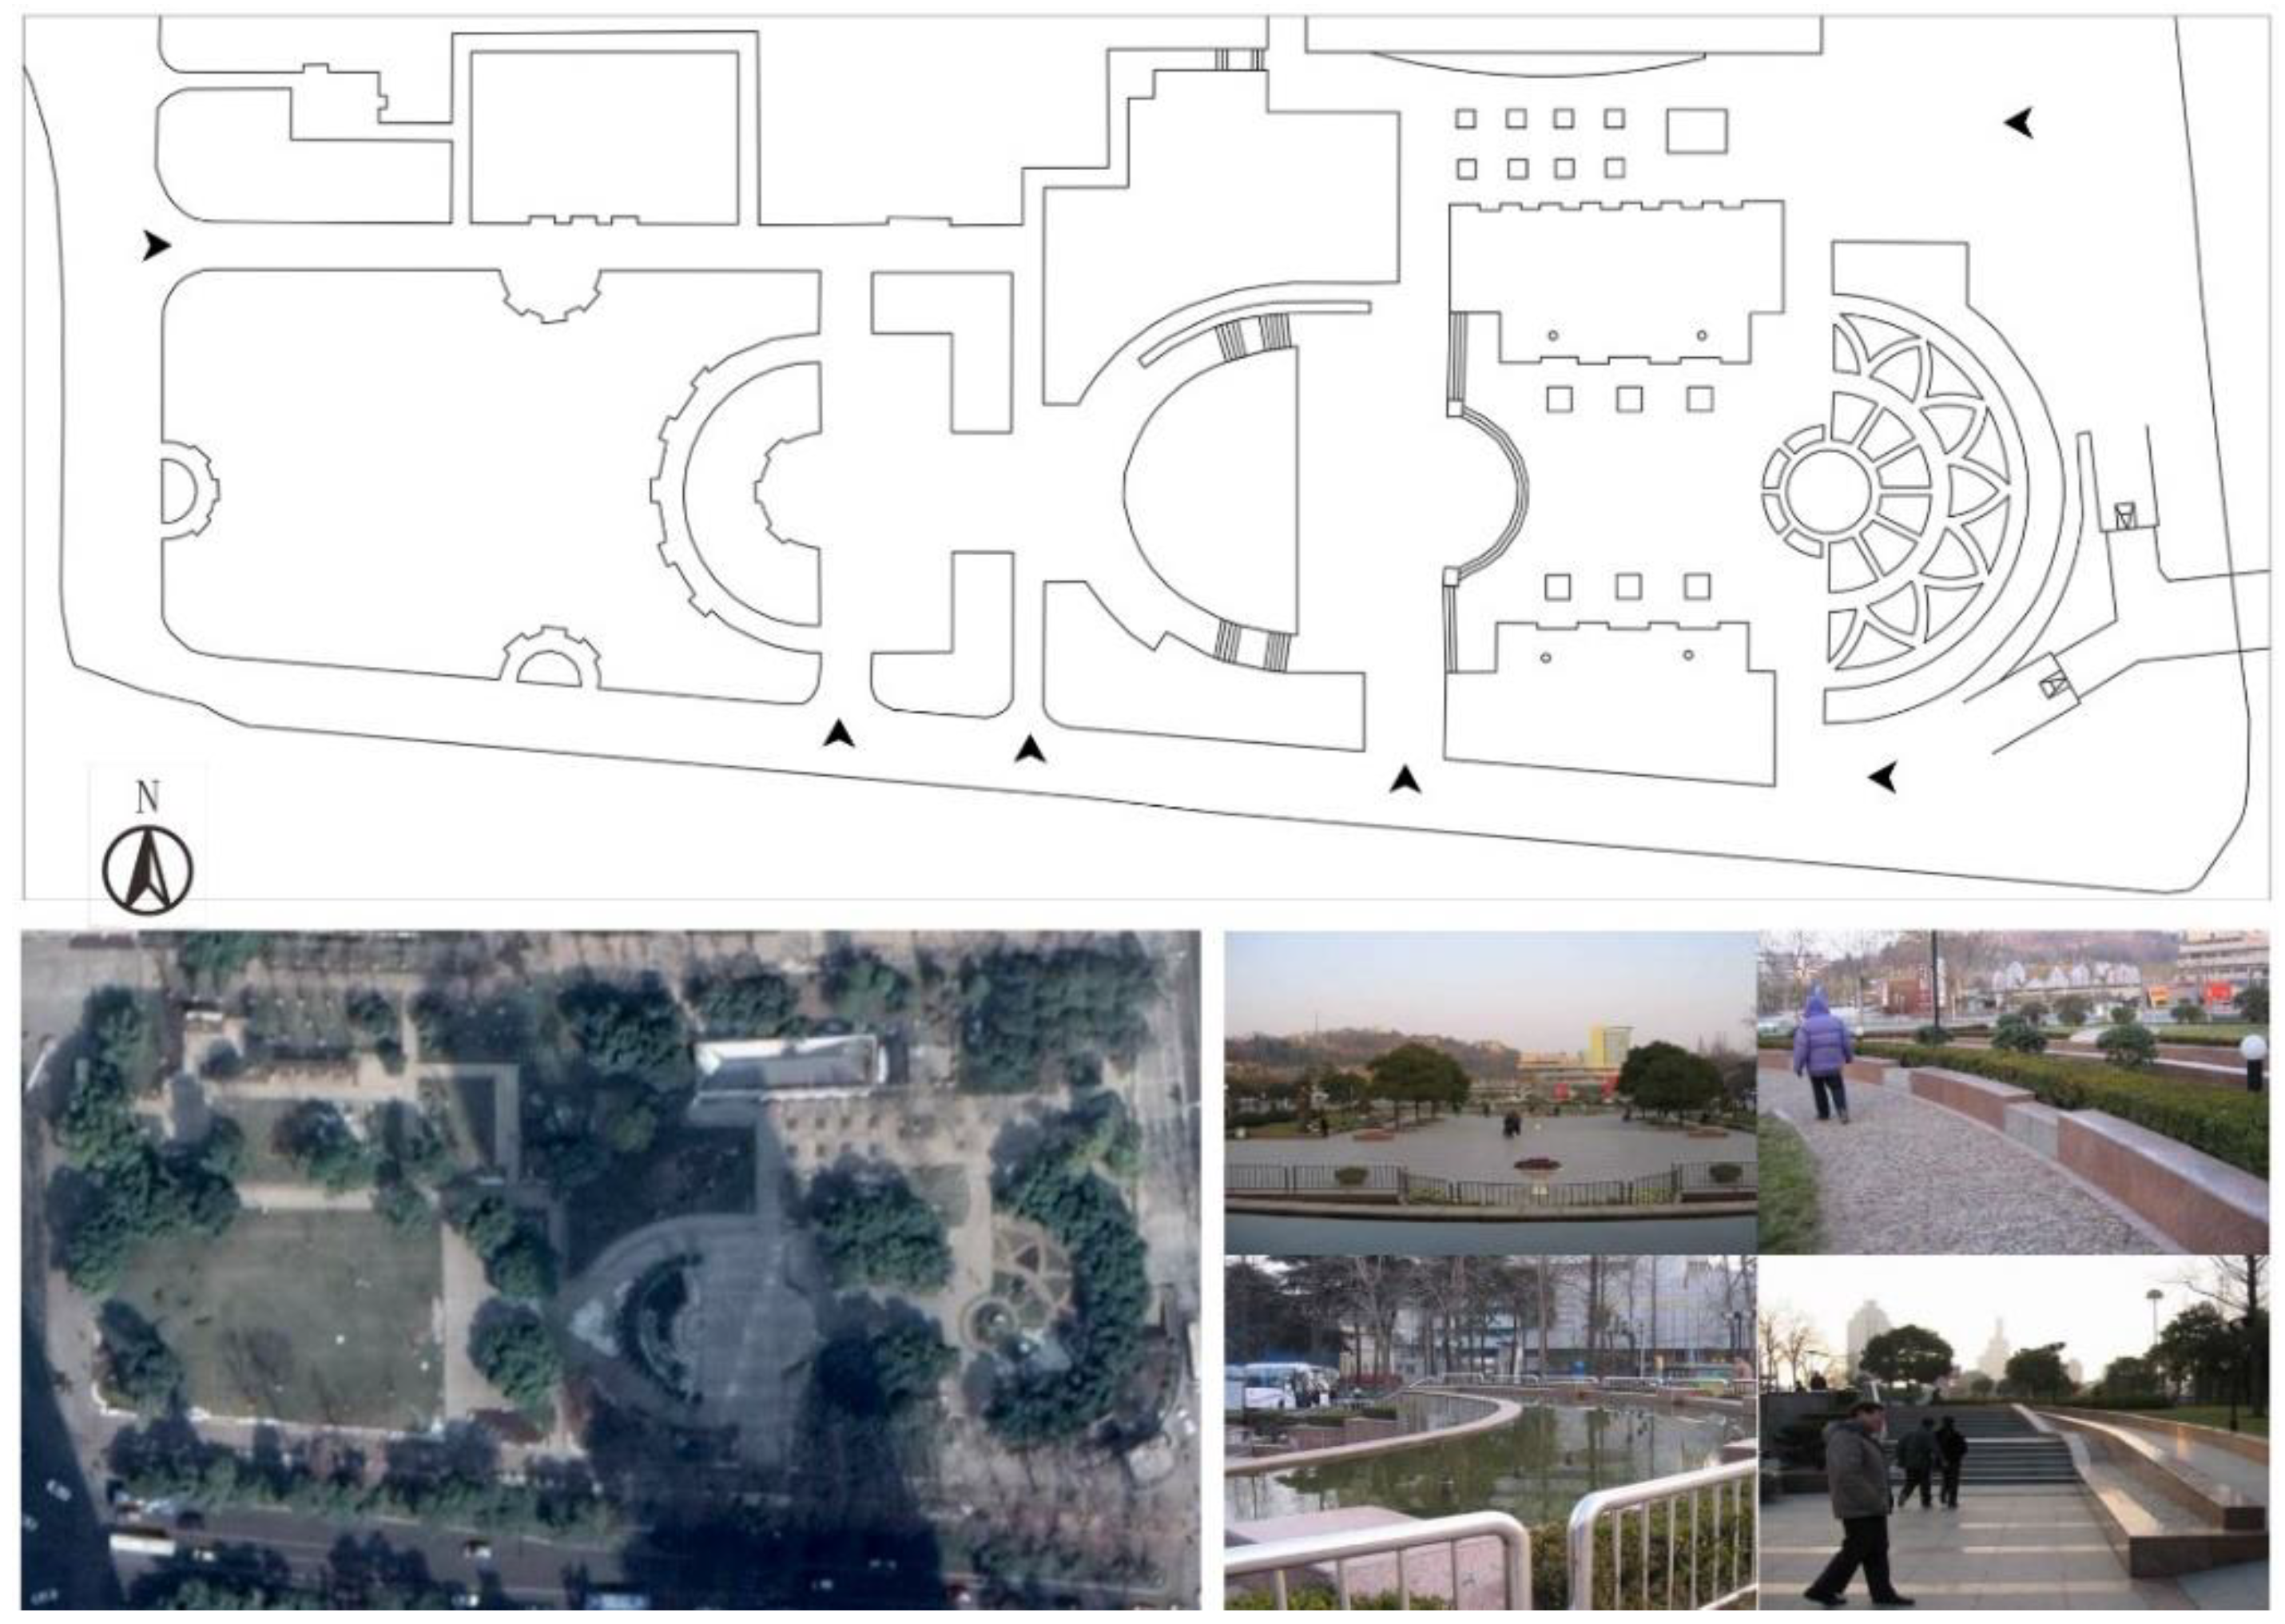
The site is located in Gulou Square, Nanjing, China. The square is a rectangle of 112 m from east to west and 47 m from north to south. There are two entrances to the east side, one on the west side and three on the south side (
Figure 2). The square has many trees and lawns, and has some paved places for people’s activities. The main users of the square are local residents. Therefore, the prototype of the predetermined agents is the local resident who is familiar with the layout and environment of the square and who can easily find a more comfortable space to stay.
3.1. Environmental Parameters Calculating
To study the impact of microclimate on people’s behaviors in outdoor spaces, we set several scenarios at specific times for the simulation: the spring equinox, the summer solstice, and the winter solstice in 2018.
The weather is hot on the summer solstice, and people usually go outside in the morning, afternoon or night. We set the simulation time of summer solstice at 3 p.m., set 90% of the people who want to stay in the shade and 10% who want to stay in the sunshine. In winter, the sun sets early, so we set 1 p.m. as the simulation time of the winter solstice, set 90% of people who want to stay in the sunshine and 10% who are willing to stay in places without sunshine. On the spring, the climate is comfortable, and people’s demand for sunshine is not obvious. We set the simulation time of spring equinox at 4 p.m. The percentage of people who need sunshine and those who do not is equal.
We carried out microclimate simulation of Gulou square in ENVI-met V4.3.1 Science.
Table 1 shows the input parameters in ENVI-met simulation. The climate data comes from the weather website [
29]. Accordingly, the PMV data at three specific time was calculated and extracted from ENVI-met.
Then, in SketchUp software, we calculated sunshine data at three specific time.
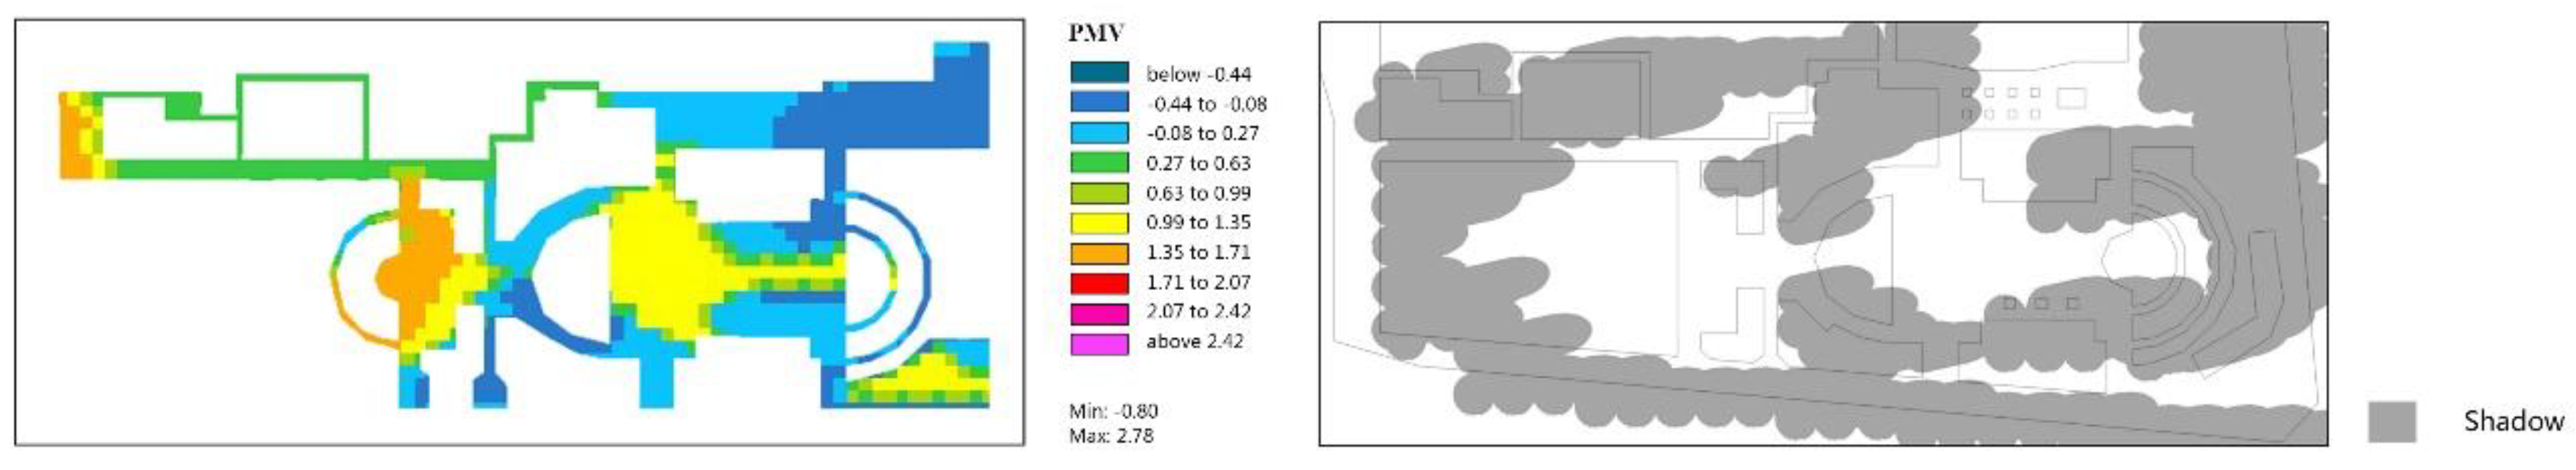
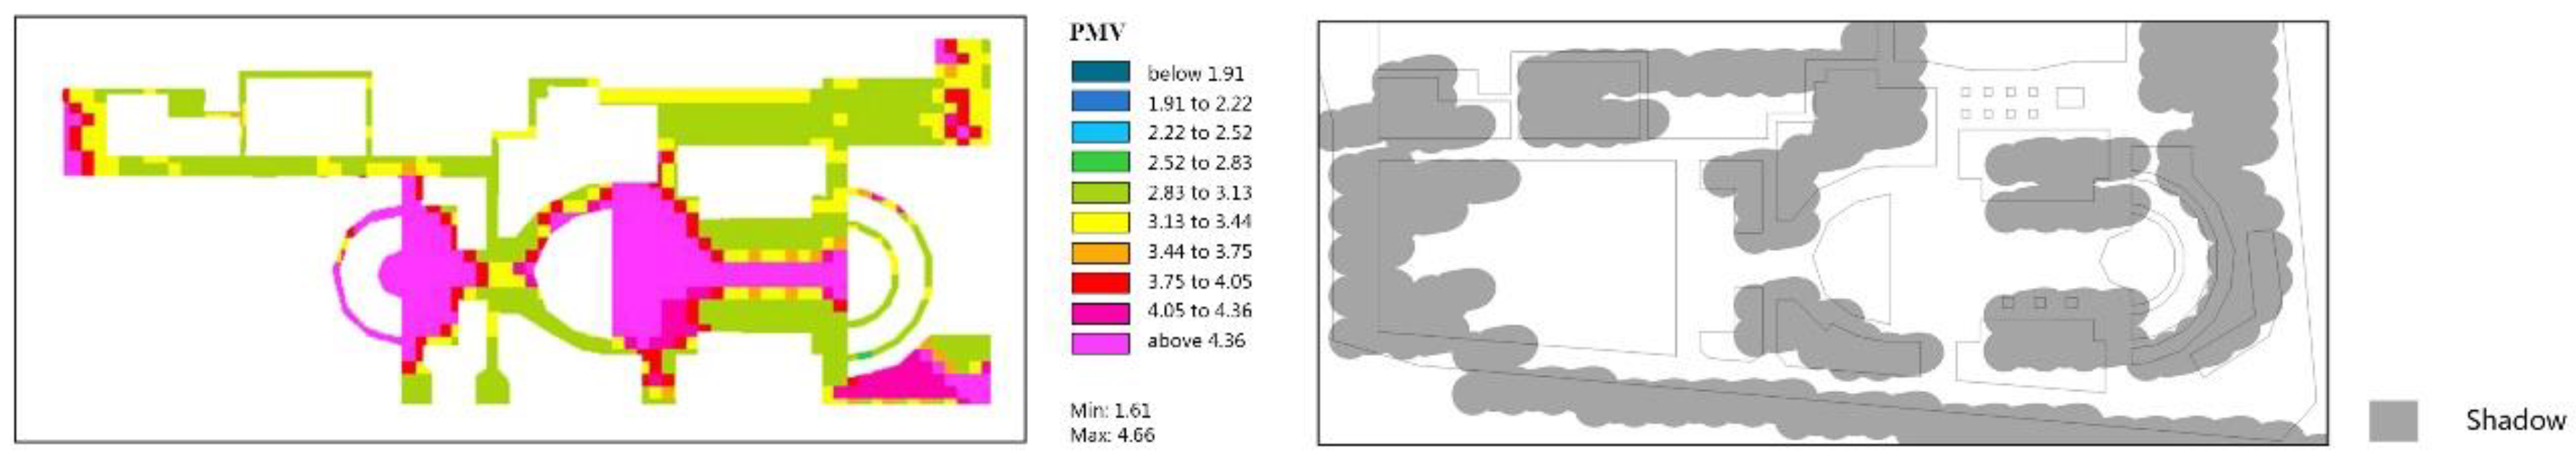
Figure 3,
Figure 4 and
Figure 5 contain the PMV data and sunshine data on the spring equinox day at 4 p.m., the summer solstice day at 3 p.m., and the winter solstice day at 1 p.m., respectively.
At last, we calculated the HH data in Depthmap software. It is not affected by the seasons and climate. Therefore, the calculated results is the same in different scenarios.
Figure 6 is the calculated HH data.
3.2. Simulation Results Analysis
All these PMV, sunshine, and HH data were imported into the Processing program as the environmental parameters. In different simulation scenarios, we used the relevant parameters. And 80 agents were created at a certain time interval in every scenario.
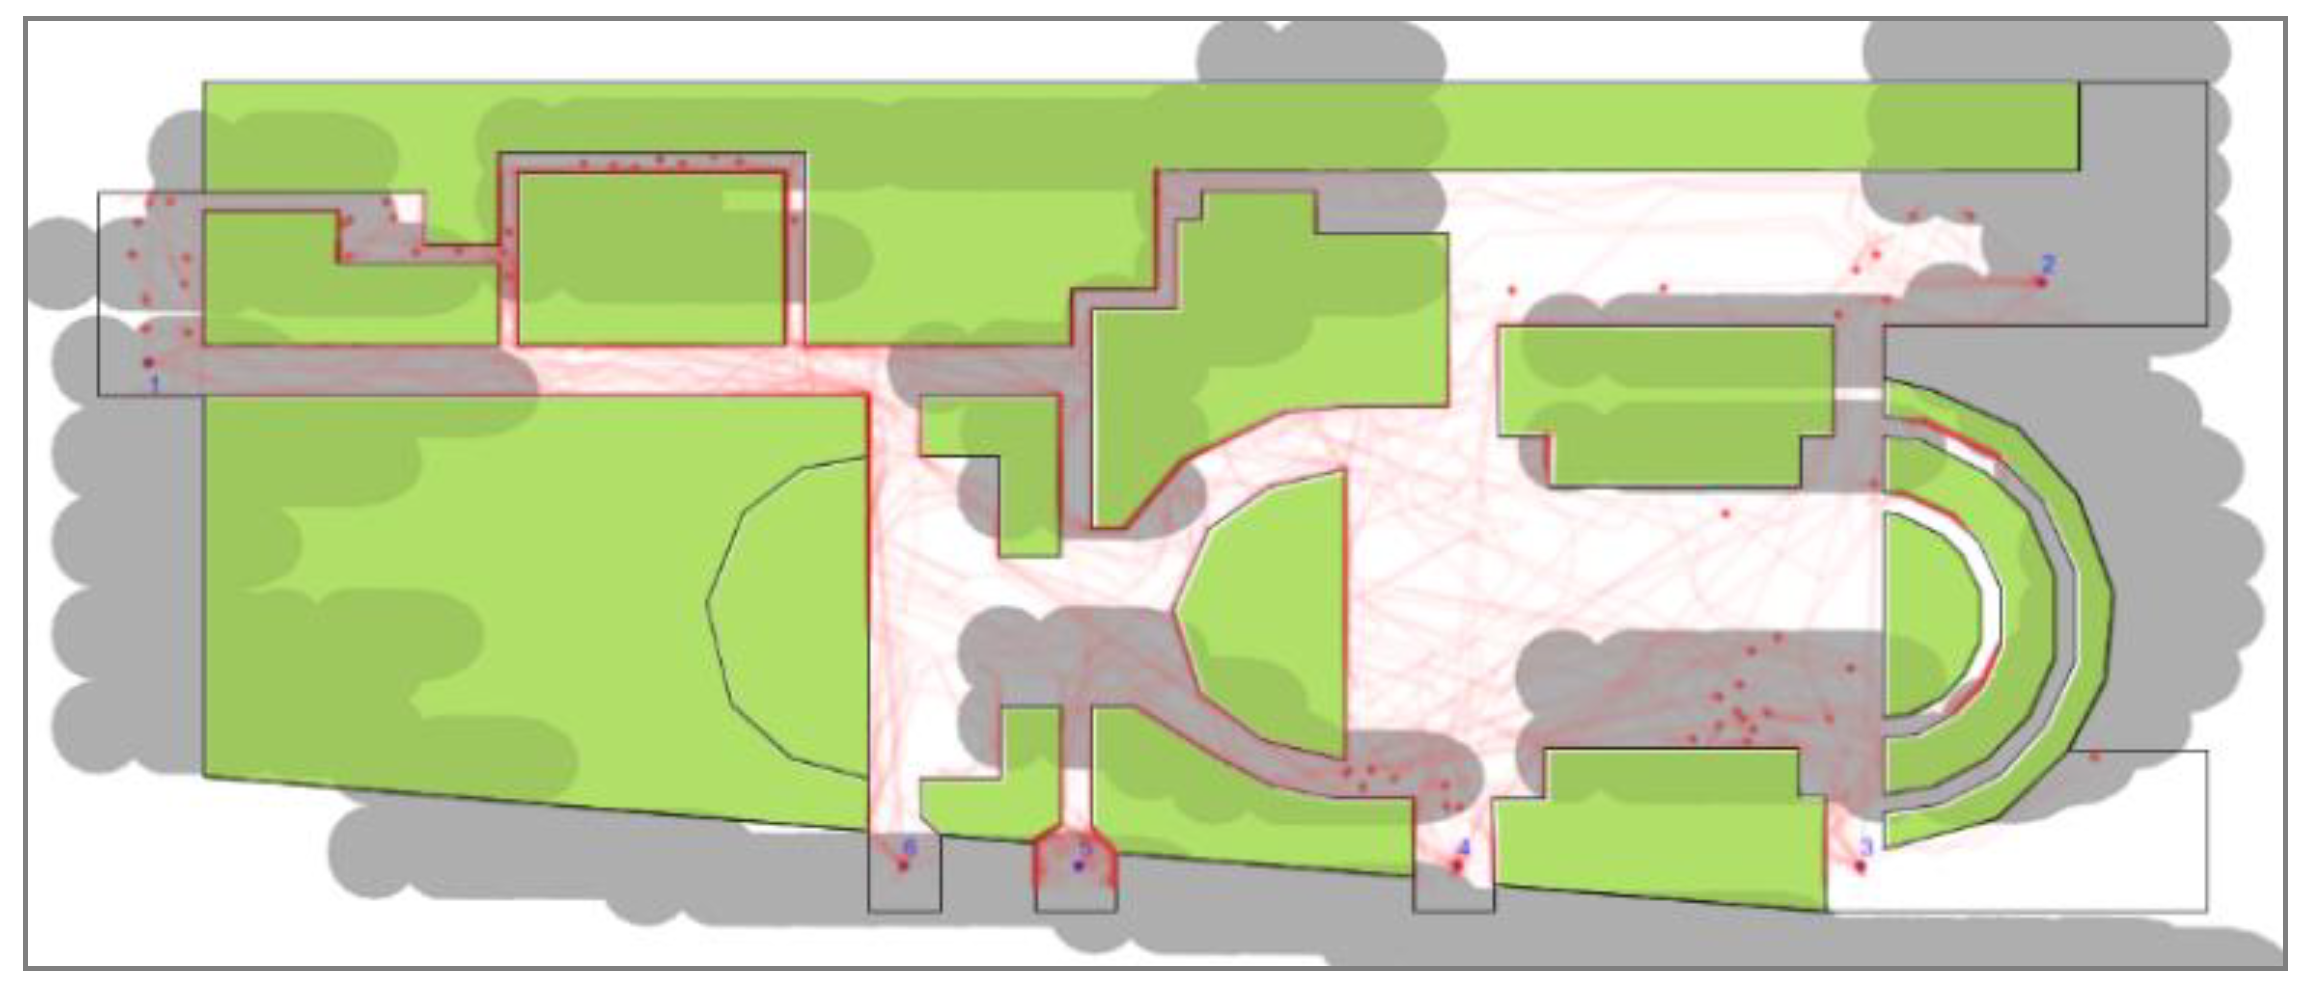
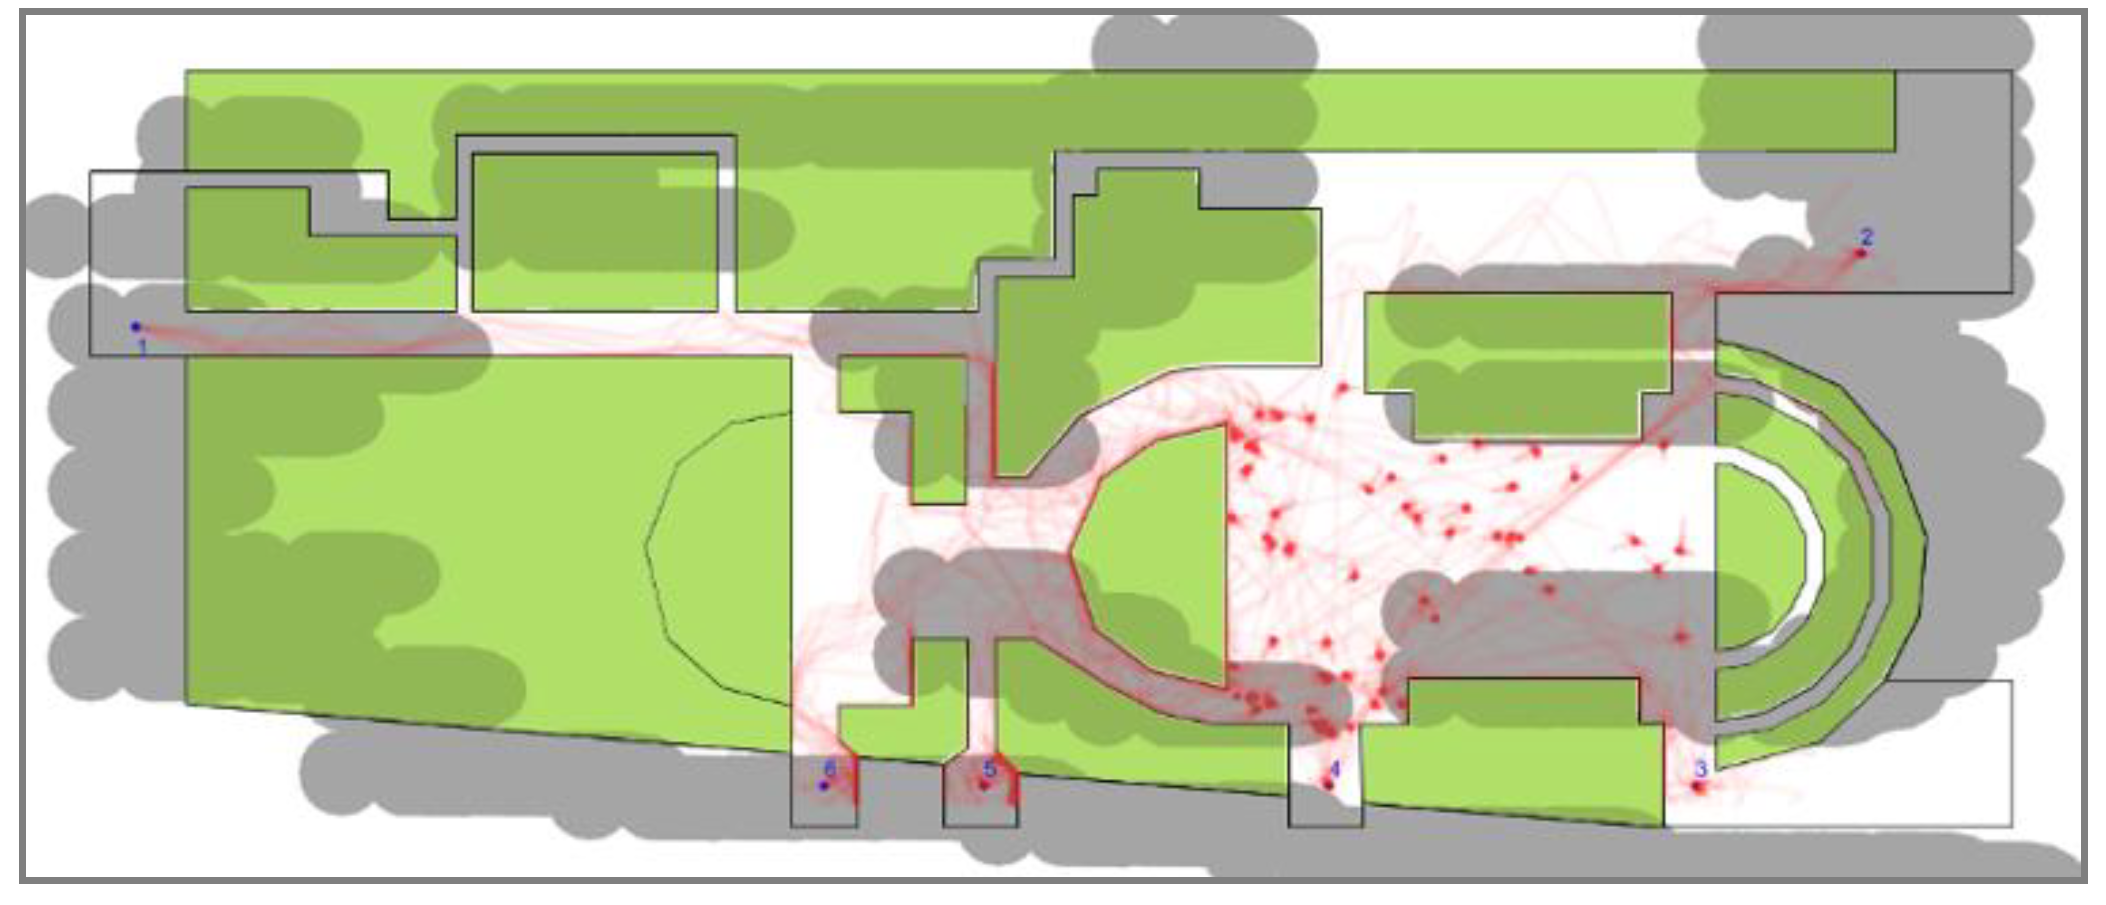
Taking the summer solstice at 3 p.m. in the afternoon as an example, we analyzed the movement of the people in the square.
Figure 7 shows simulation result. The path is indicated by a red transparent line, and the staying position is indicated by a red dot.
The actual observation of the site shows that on the summer solstice, people tend to stay in the shade of the comfortable microclimate environment, in a place with a wide view and which is full of shade. Comparing the environmental data with the agent motions path in the above figure, we found that the observation results are consistent with the results of the program, which proves that our program is effective. The
Figure 7 shows that most of the agents choose to stay in the shade, only 5/80 agents choose to stay in the sunshine, and those five agents stay in the northeast of the site because the view is nice and the environmental conditions are good. The destinations of the agents are also regular. Thirty-five of eighty agents choose to stay in the shade on the northwest side of the site, 27/80 agents stay in the shade on the south side of the site, and a small number of the agents stay in the shade on the northeast side of the site. The view of the trail on the north side of the site is relatively narrow, but many agents choose to stay there because of flourishing trees and a microclimate environment in which is suitable for them to stay. A few of the agents are willing to stay in the open space at the center of the site because it is not suitable for them to stay in the direct light.
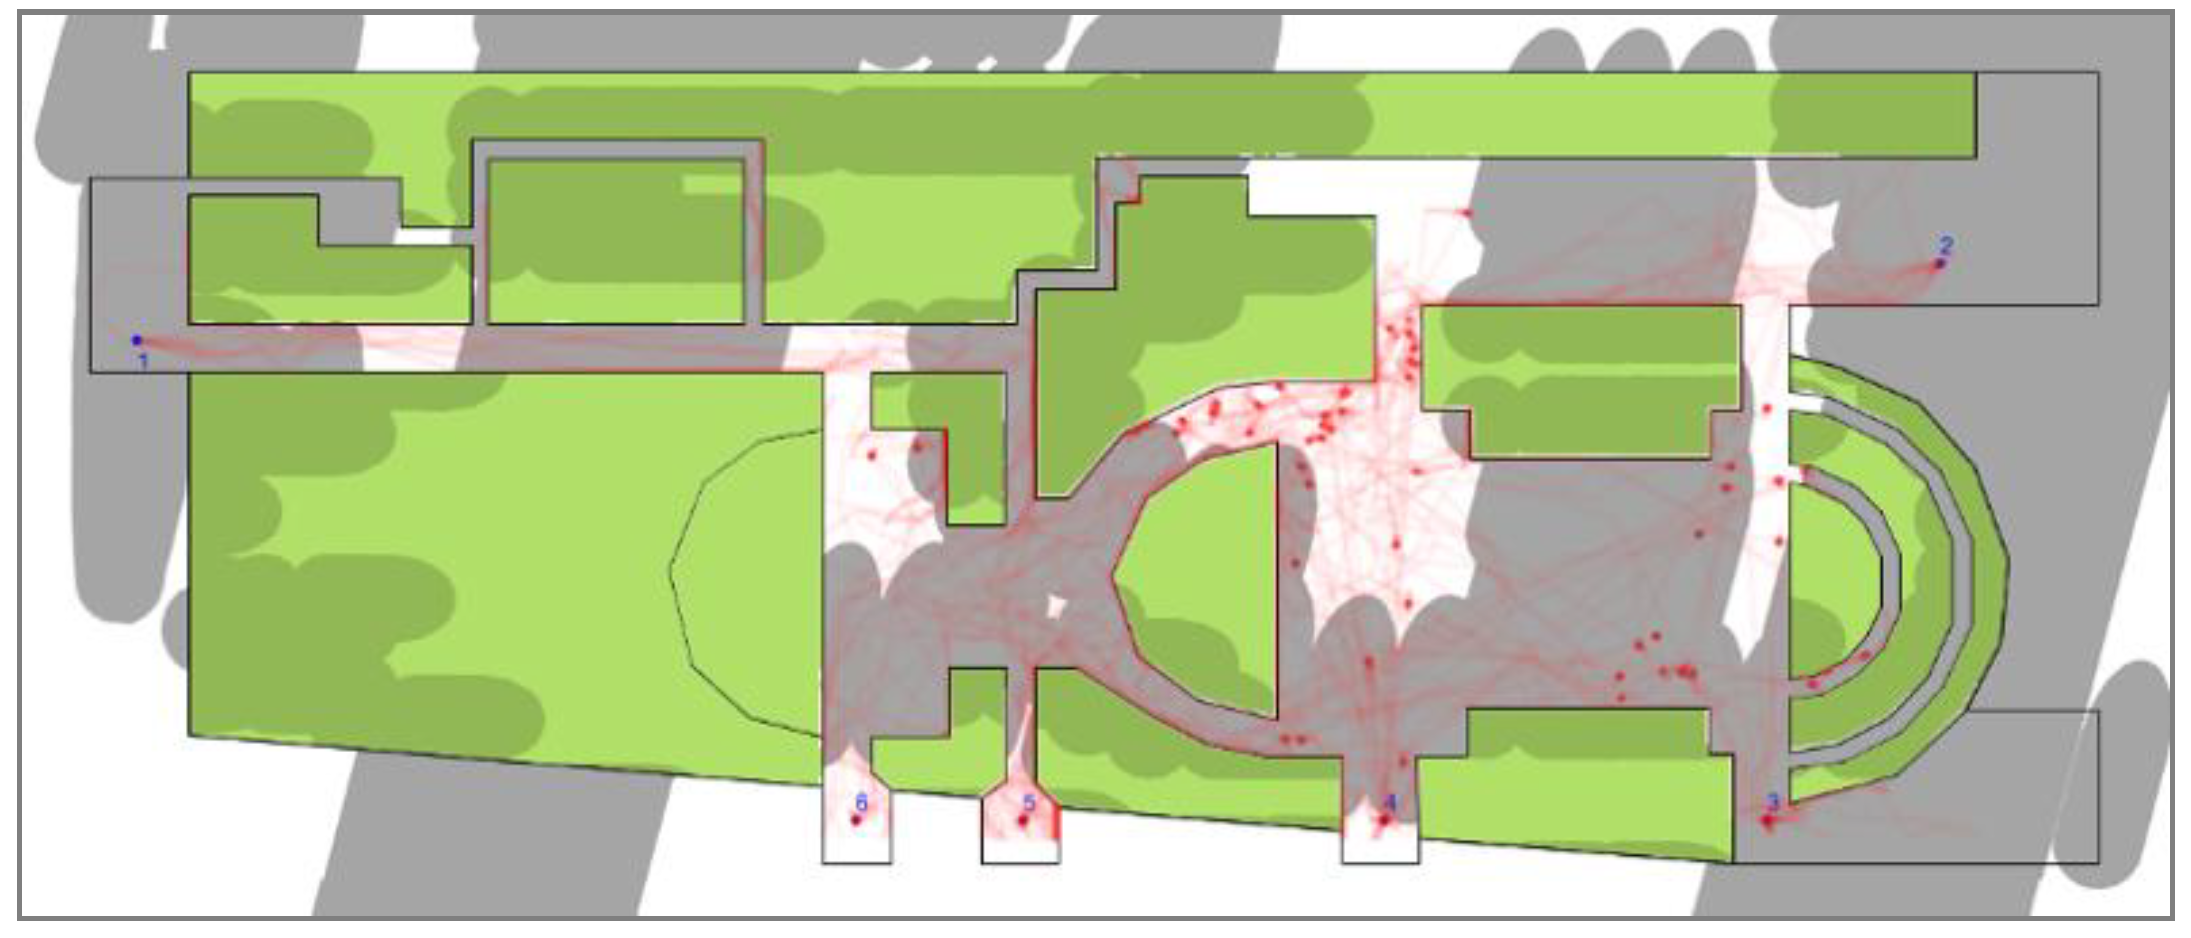
To verify that the three parameters have an impact on the agent’s destination, we compared the impact of each parameter with agent activity.
Figure 8 and
Figure 9 are diagrams of agent motion paths when only the PMV data are considered and only the HH data are considered, respectively. We found that when considering only the PMV data, agents tend to stay in the area with lower PMV data; when considering only the HH data, the agents are distributed in open spaces in the center of the square. Only when three parameters are all considered is the distribution of agent stays more reasonable. The results of the program operation show that the interaction between our algorithm and the parameters is effective.
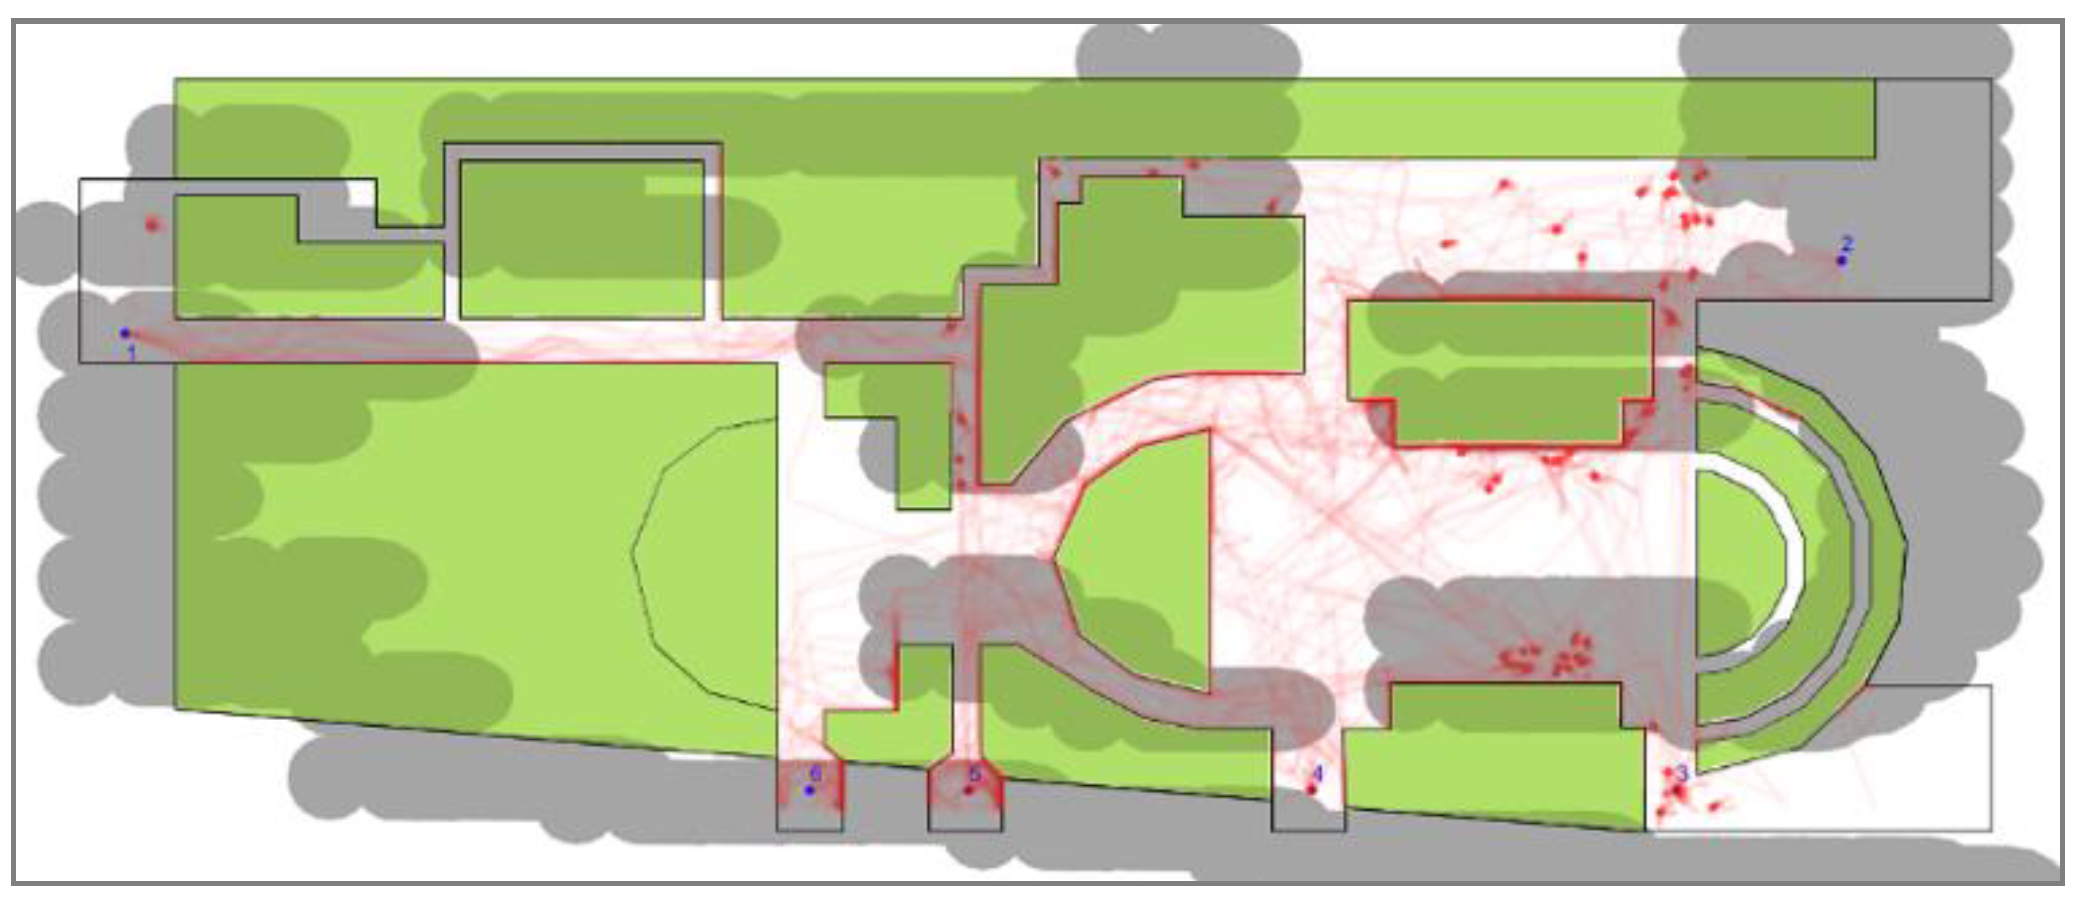
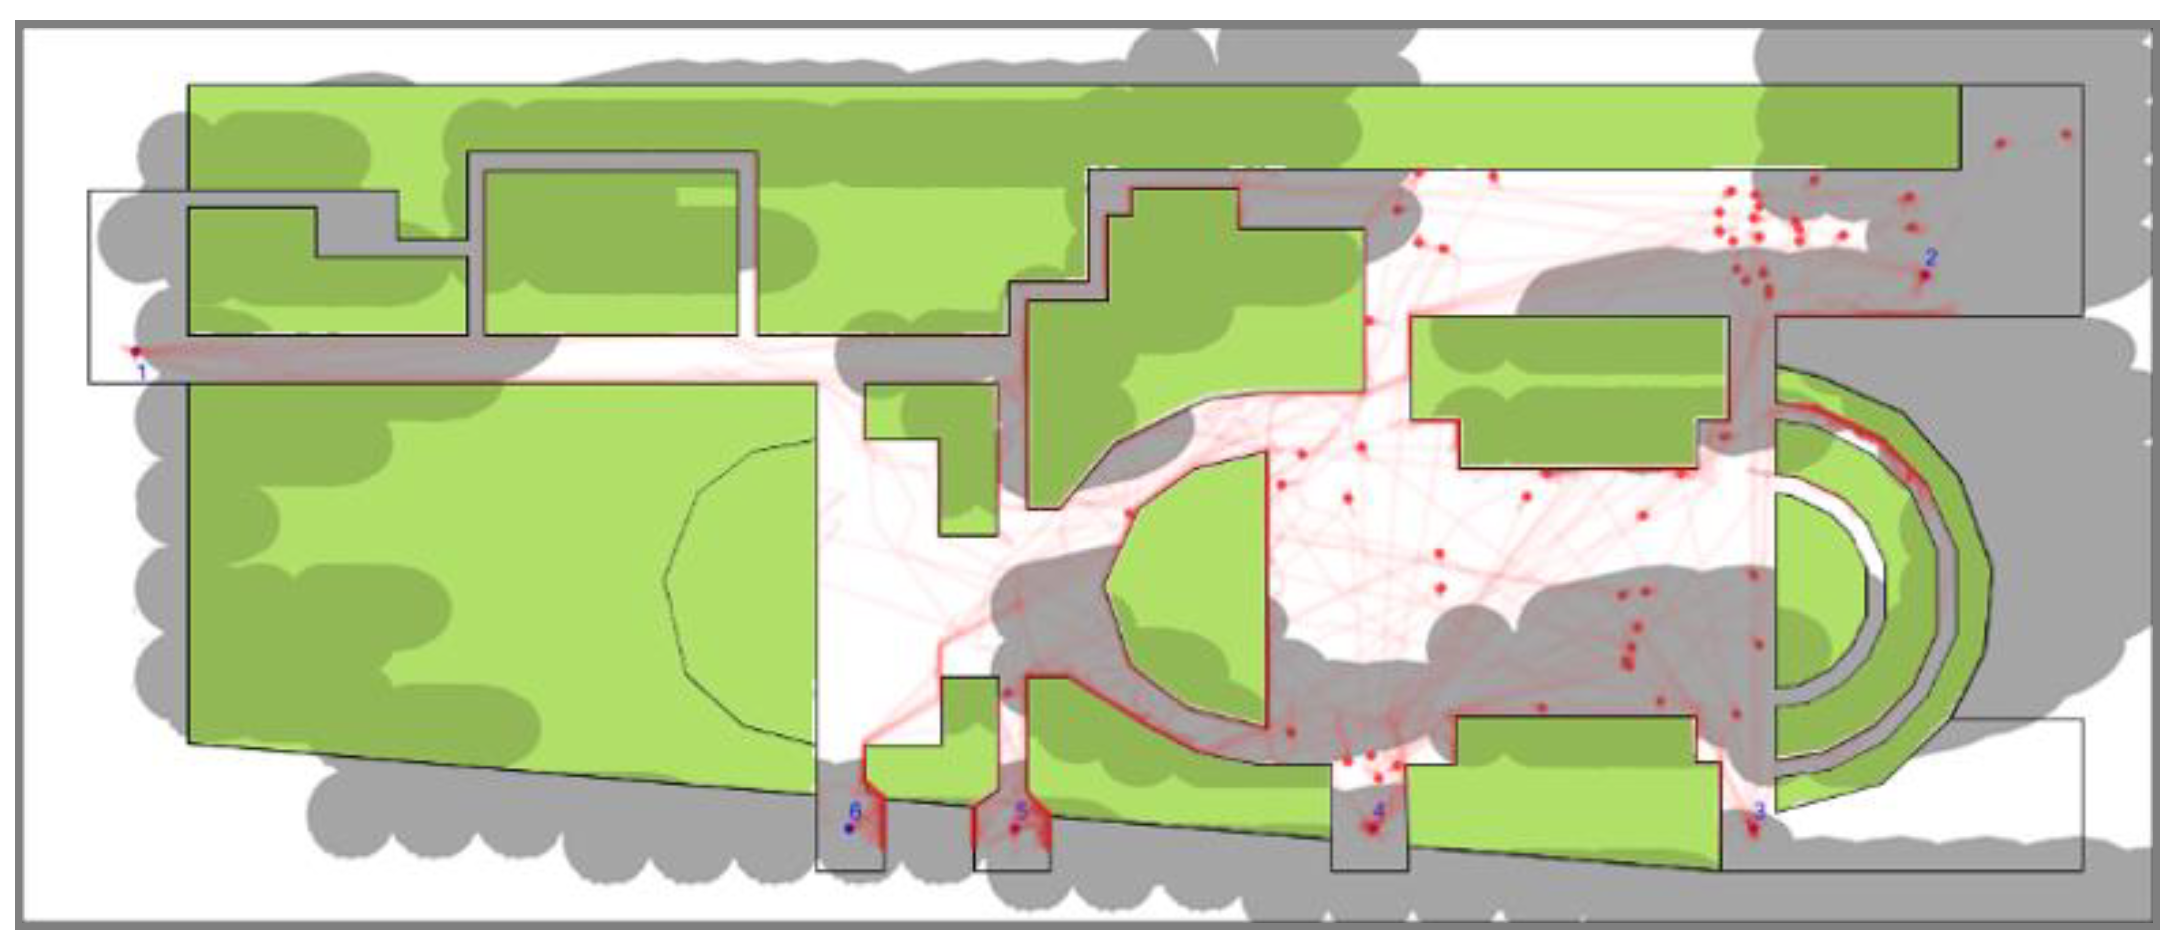
To verify the relationship between environmental parameters and agent movements further, we simulated people’s activity at 1 p.m. on the winter solstice (
Figure 10). We found that people’s staying positions have a high fit to the parameters. People abandoned the northwest side of the site because the trees here blocked the sunshine. Most people stayed in the open space in the middle of the field because the environment here was comfortable, with a wide view and sufficient sunshine.
Next, we selected the spring equinox on 22 March at 4 p.m. as the time of the program simulation. On spring equinox day, the influence of sunlight on people’s choice of destination is less significant, and people’s destinations are not limited to shadows or sunlight, which can highlight the influence of the other two parameters on the choice of people’s destination.
Figure 11 is the agent path map at 4 p.m. on the vernal equinox. Comparing with
Figure 7 and
Figure 10,
Figure 11 showed that people staying in the square are more scattered than during the winter solstice and the summer solstice. The quantity of people in the sun or in the shade is equal, and most people stay in the center of the field and on the north side of the site. On the vernal equinox, because the outdoor environment is generally more comfortable, people tend to stay in places with better views.
4. Discussion
In the simulation, we found that the agent’s residence positions were in good agreement with the observation results, but its movement path has severe deviation from the predicted ones, especially in summer and winter. This shows that the algorithm has some limitations.
The impact of outdoor microclimate environment on human behavior is an important part of this study. In order to facilitate the calculation, the sunshine and PMV were used as indicators of the outdoor microclimate environment. However, the PMV is a static, holistic thermal comfort assessment that is not able to predict individual comfort and does not take into account the dynamic changes in thermal comfort perception brought about by movement [
30]. In fact, personal thermal comfort has a large difference, also reflected in individual differences in gender, age, weight, and so on [
31]. There are a number of studies that use machine learning algorithms to study individual thermal comfort and establish an evaluation model [
32]. Although most of these studies were based on the indoor environment, the integration of individual comfort perception differences into environmental parameters can improve the accuracy of simulation.
Besides the physical-physiological effects of microclimate factors, many factors also affect people’s perception of environmental comfort in psychological manner [
33]. The cultural background and emotional differences also have different perceptions of comfort. The familiarity with the place and the purpose of using the square will affect the behavior patterns of people in the square. Moreover, the location of public facilities (such as seats, pergola, entrances and exits) in the square can also affect people’s behavior.
During our observation, we found that in the spring when the climate is comfortable, people have more activities to do in the outdoor public space. As a result, they tend to stay in areas with seating and compromise—to a certain extent—on climate conditions and their extension of vision. Of course, in a landscaped outdoor space, the situation will be different, so people will tend to stay in the open vision space to enjoy the scenery of spring and observe pedestrians. In the spring, the influence of sunlight on people cannot be completely ignored. We found that after people stayed in the sun for a period, some people who had originally rested in a seat in the sun would give up that comfortable seat and move to the shade of the trees. This is because the more time a person stays under the sun, the closer the quantity of heat that people’s skin absorbs will come to exceeding its limits, so people will avoid sunshine and search for a shady place. These deviations not only prove the effect of the microclimate on people’s outdoor activities but also show that people’s outdoor activities are the result of multiple factors. How to incorporate these factors into the system as the parameters is a more complex issue.
In addition, in the simulation of human behavior, we only set some basic rules. However, at the micro level, human behavior is more diverse, and simple algorithms are difficult to accurately describe and express completely. In our algorithm, agents lack sufficient “wisdom,” and they lack perception and recognition of their environment. That is, the perception of the subject is only effective within a few meters around the body. They cannot plan the whole route of the site; even if they know their destination, they cannot arrive directly. As a result, these agents often do “irrational” things, such as expose themselves to the hot sun or try to step on the lawn and cut across (in the program, of course, they cannot walk on the grass; they just keep hitting the wall at the edge). How to make the agent quickly and intelligently find the best path need further exploration.
5. Conclusions
The integration of the urban microclimate, sunshine and extension of vision into the MAS plays an important role in solving for human behavior simulation in urban public spaces. Including the microclimate effect can provide more references for human behavior simulation. As microclimate conditions are influenced by seasonal and hourly changes, our model can be used to explore changes in human behavior in different seasons and at different times, which can improve the availability of the model. In the framework of our algorithm, we convert the environmental parameters of the site into multiple raster grayscale figures and reread the grayscale data as environmental parameters in the main program. Individual perception of the environment is different, and the perception is converted into 0–1 of the parameters and integrated into the program. We divide the site into several areas and take each area as an evaluation unit to select the appropriate area as the agents’ destination. The contour of the site and the outdoor environment are put into the algorithm in the form of parameters, which can be changed according to the changes in environment and time. When we want to simulate another public space, we only need to change the parameters.
The simulation of human behavior is of great significance to the design and evaluation of urban public spaces. The MAS makes it possible to simulate human behavior at the micro level. People’s activity modes are of great guiding significance to the design of public spaces. The MAS simulation provides an effective reference for the design. Additionally, the evaluation of public spaces could be regarded as a step in the design of public places, such as squares and parks. It could also be used to evaluate the behavior of people in public spaces after the design is completed, and some suggestions could be put forward for the placement of facilities in public spaces. For example, more facilities, such as seats and streetlamps, are placed in places where the environment is more comfortable, and intersections with more traffic flow are widened to provide people with a good view and space for activities.
The model we constructed has made certain achievements, but there is still some distance between the simulation results and the actual situation. We are trying to extract people’s behavioral characteristics and use several algorithms to summarize and express those people’s activities. Moreover, the programs and algorithms can be continuously optimized.


