1. Introduction
Improving the sound insulation performance of the car body structure of high-speed trains is a crucial step in controlling interior noise [
1,
2]. However, these train bodies consist of complex composite structures with multiple material layers of various classes. The sound insulation performance is highly dependent on the physical properties of each material [
3,
4]; hence, optimizing the sound insulation design of a high-speed train composite structure is very difficult.
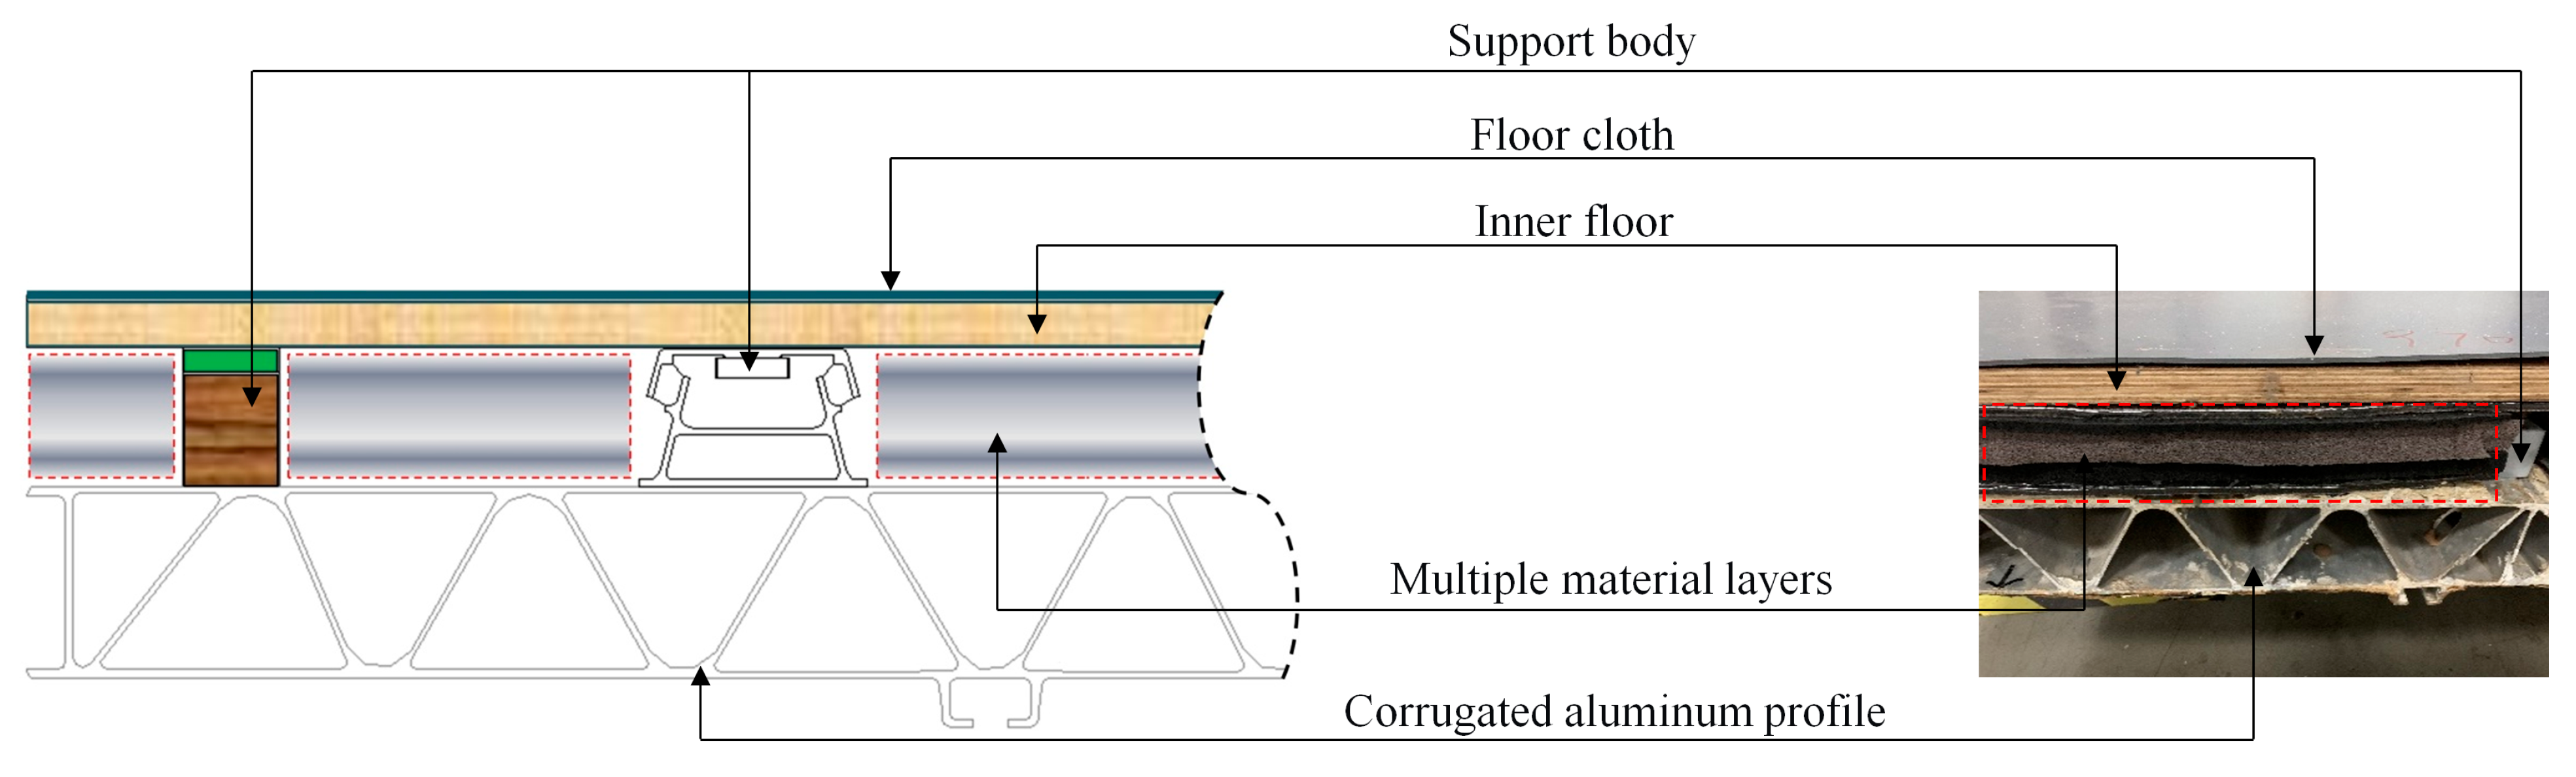
As shown in
Figure 1, the composite structure of the floor primarily includes the floor cloth, inner floor, support body (wood bone and elastic support), multiple material layers (sound insulation material, sound absorption material, damping material, and draining board), and corrugated aluminum profiles. For many component materials, researchers are concerned about the layer of materials that should be adjusted and how the layer should be adjusted to efficiently and accurately obtain the optimal solution to meet the requirements of sound insulation. To achieve this goal, it is necessary to first fully determine the materials that have an impact on the overall sound insulation performance of the structure as well as the level of impact. This could help researchers to accurately identify and grasp the key factors affecting sound insulation and obtain a targeted adjustment and improvement of the materials with greater impact.
In previous studies, research on the factors influencing the sound insulation of the composite floor structure of high-speed trains tended to use simulation analysis methods. Zhang et al. [
5] proposed a detailed equivalent modeling process for the full-size floor structure of a high-speed train based on the finite element method and statistical energy analysis method; they evaluated the influence of the floor cloth, built-in plate, aluminum profile, support body, and sandwich material on the overall sound insulation characteristics. Zheng et al. [
6] analyzed the sound transmission loss of aluminum profiles in high-speed trains by using the structure–acoustic coupling finite element method; they investigated the effects of the total thickness of the plates and both the angle and thickness of the ribs on the sound transmission loss of the profile. Lin et al. [
7] evaluated the influence of acoustic bridges, plate thickness, and structural materials on the acoustic and vibration performance of aluminum profiles, performed an optimization design, and established a structure with better acoustic and vibration performance. Based on the 2.5D FE-BE vibration acoustic model, Deng et al. [
8] evaluated the effects of core porous materials and supports on the overall sound insulation performance of a floor composite structure. Yao et al. [
9] evaluated the influence of the damping layer area on the acoustic and vibration performances of a train floor, effectively improving the acoustic and vibration performances of middle- and low-frequency floor structures. Wang et al. [
10] evaluated the influence of the laying sequence of the core layer insulation and sound-absorbing materials on the sound insulation characteristics of the composite floor structure of a high-speed train and proposed the laying strategy of the core layer materials for the “centralization of sound absorbing materials in the middle and clamping sides of sound insulation materials”, which effectively improved the sound insulation characteristics at medium frequencies. Kim et al. [
11] applied coupled-waveguide finite element and boundary element methods to predict the radiation efficiency and acoustic transmission of aluminum profiles for train compartment floors, taking into account the acoustic cavity.
The above research results provide an important theoretical basis and data support for guiding the sound insulation optimization design of composite floor structures of high-speed trains. However, these studies are essentially single-parameter investigations of one or several materials and do not consider the multi-parameter changes and influences among all the materials that constitute the floor composite structure. Moreover, it is difficult to comprehensively determine the degree of influence of each material using traditional simulation analysis methods. It is urgent to calculate the contribution of each material layer to the overall sound insulation of the composite floor structure based on a new method and further identify one or more key factors with the most significant impact on the overall sound insulation performance through sequencing.
Owing to the rapid development of artificial intelligence, machine learning has been successfully applied as a core technology in numerous fields, such as pattern recognition, feature classification, data mining, and model prediction [
12]. In the importance assessment and identification of the influencing factors, machine learning provides a variety of effective methods. Ahmad et al. [
13] used principal component analysis to extract the features that best represented the working state of multistage centrifugal pumps and proposed a fault diagnosis method with high accuracy. Rahman et al. [
14] proposed a fault diagnosis model based on the random forest algorithm, which accurately identified power transformer faults through dissolved gas analysis and was superior to traditional diagnostic methods in terms of classification accuracy and efficiency. Zhou et al. [
15] proposed a fault isolation method based on the k-nearest neighbor rules to identify the fault causes of industrial processes with nonlinear, multimode, and non-Gaussian distributed data, which could isolate multiple sensor faults under relatively loose conditions. Casaburo et al. [
16] applied a Gaussian machine-learning algorithm to the structural design and characterization of porous acoustic metamaterials and achieved good results. Eddin et al. [
17] used an artificial neural network method to evaluate the influence of materials, thickness, density, size, and quality of light wood flooring on sound insulation, and the prediction error of 250~1000 Hz was no more than 2 dB. Aloisio et al. [
18] built classification models based on multinomial logistic regression (MLR) and artificial neural networks (ANNs); they calibrated seismic data that were theoretically less affected by personal bias. Malekjafarian et al. [
19] proposed an artificial neural network (ANN) algorithm to deal with the acceleration response energy of trains, using the acceleration response measured on trains in service to detect the stiffness loss of track sublayers.
In this study, a machine learning model for evaluating the importance of the sound insulation features of a composite floor structure was established based on the random forest method. The contribution of each material in the composite floor structure of a high-speed train to the overall sound insulation was comprehensively calculated and analyzed, and the key factors influencing its sound insulation performance were identified. In
Section 2, we introduce the sample acquisition and material composition of the floor composite structure, stratify the structure according to the spatial position of the materials, and construct a feature database. In
Section 3, a model for the feature contribution calculation based on random forest is established. In
Section 4, the contribution of each material to the overall weighted sound insulation index is analyzed, and the influence of each material of the core layer on the overall sound insulation performance at different frequencies is analyzed to clarify the key influencing factors and optimization direction of sound insulation. Finally, the conclusions are presented in
Section 5.
3. Feature Contribution Analysis Modeling Based on Random Forest
3.1. Method Introduction
The sample number of the composite structure of the high-speed train floors involved in this paper is 118, which is not much. Moreover, the data is non-linear. Decision trees, random forests, support vector machines, etc., can be listed as alternative methods for machine learning regression modeling. However, random forest also has unique advantages. Random forest is a tree-based integrated machine learning algorithm [
23,
24]. It is a collection of many different types of random trees that can quickly process a large number of input variables at a low computational cost and shows excellent performance in classification and regression. To measure the importance of the sample features, random forest can quantitatively describe the degree of contribution of each feature to classification or regression [
25,
26,
27,
28], which is very suitable for the research object and purpose of this paper. Therefore, the random forest method is adopted in this paper.
The calculation of the feature contribution is realized synchronously in the process of regression analysis by the random forest method. The original characteristics are the surface density, thickness, and acoustic performance of each material layer, and the target variable is the overall sound insulation of the train floor structure. In other words, we use the constructed random forest model to carry out feature training and prediction of target variables. When each tree is trained, the importance of features can be calculated by observing the model’s performance (Gini coefficient) on the data outside the bag.
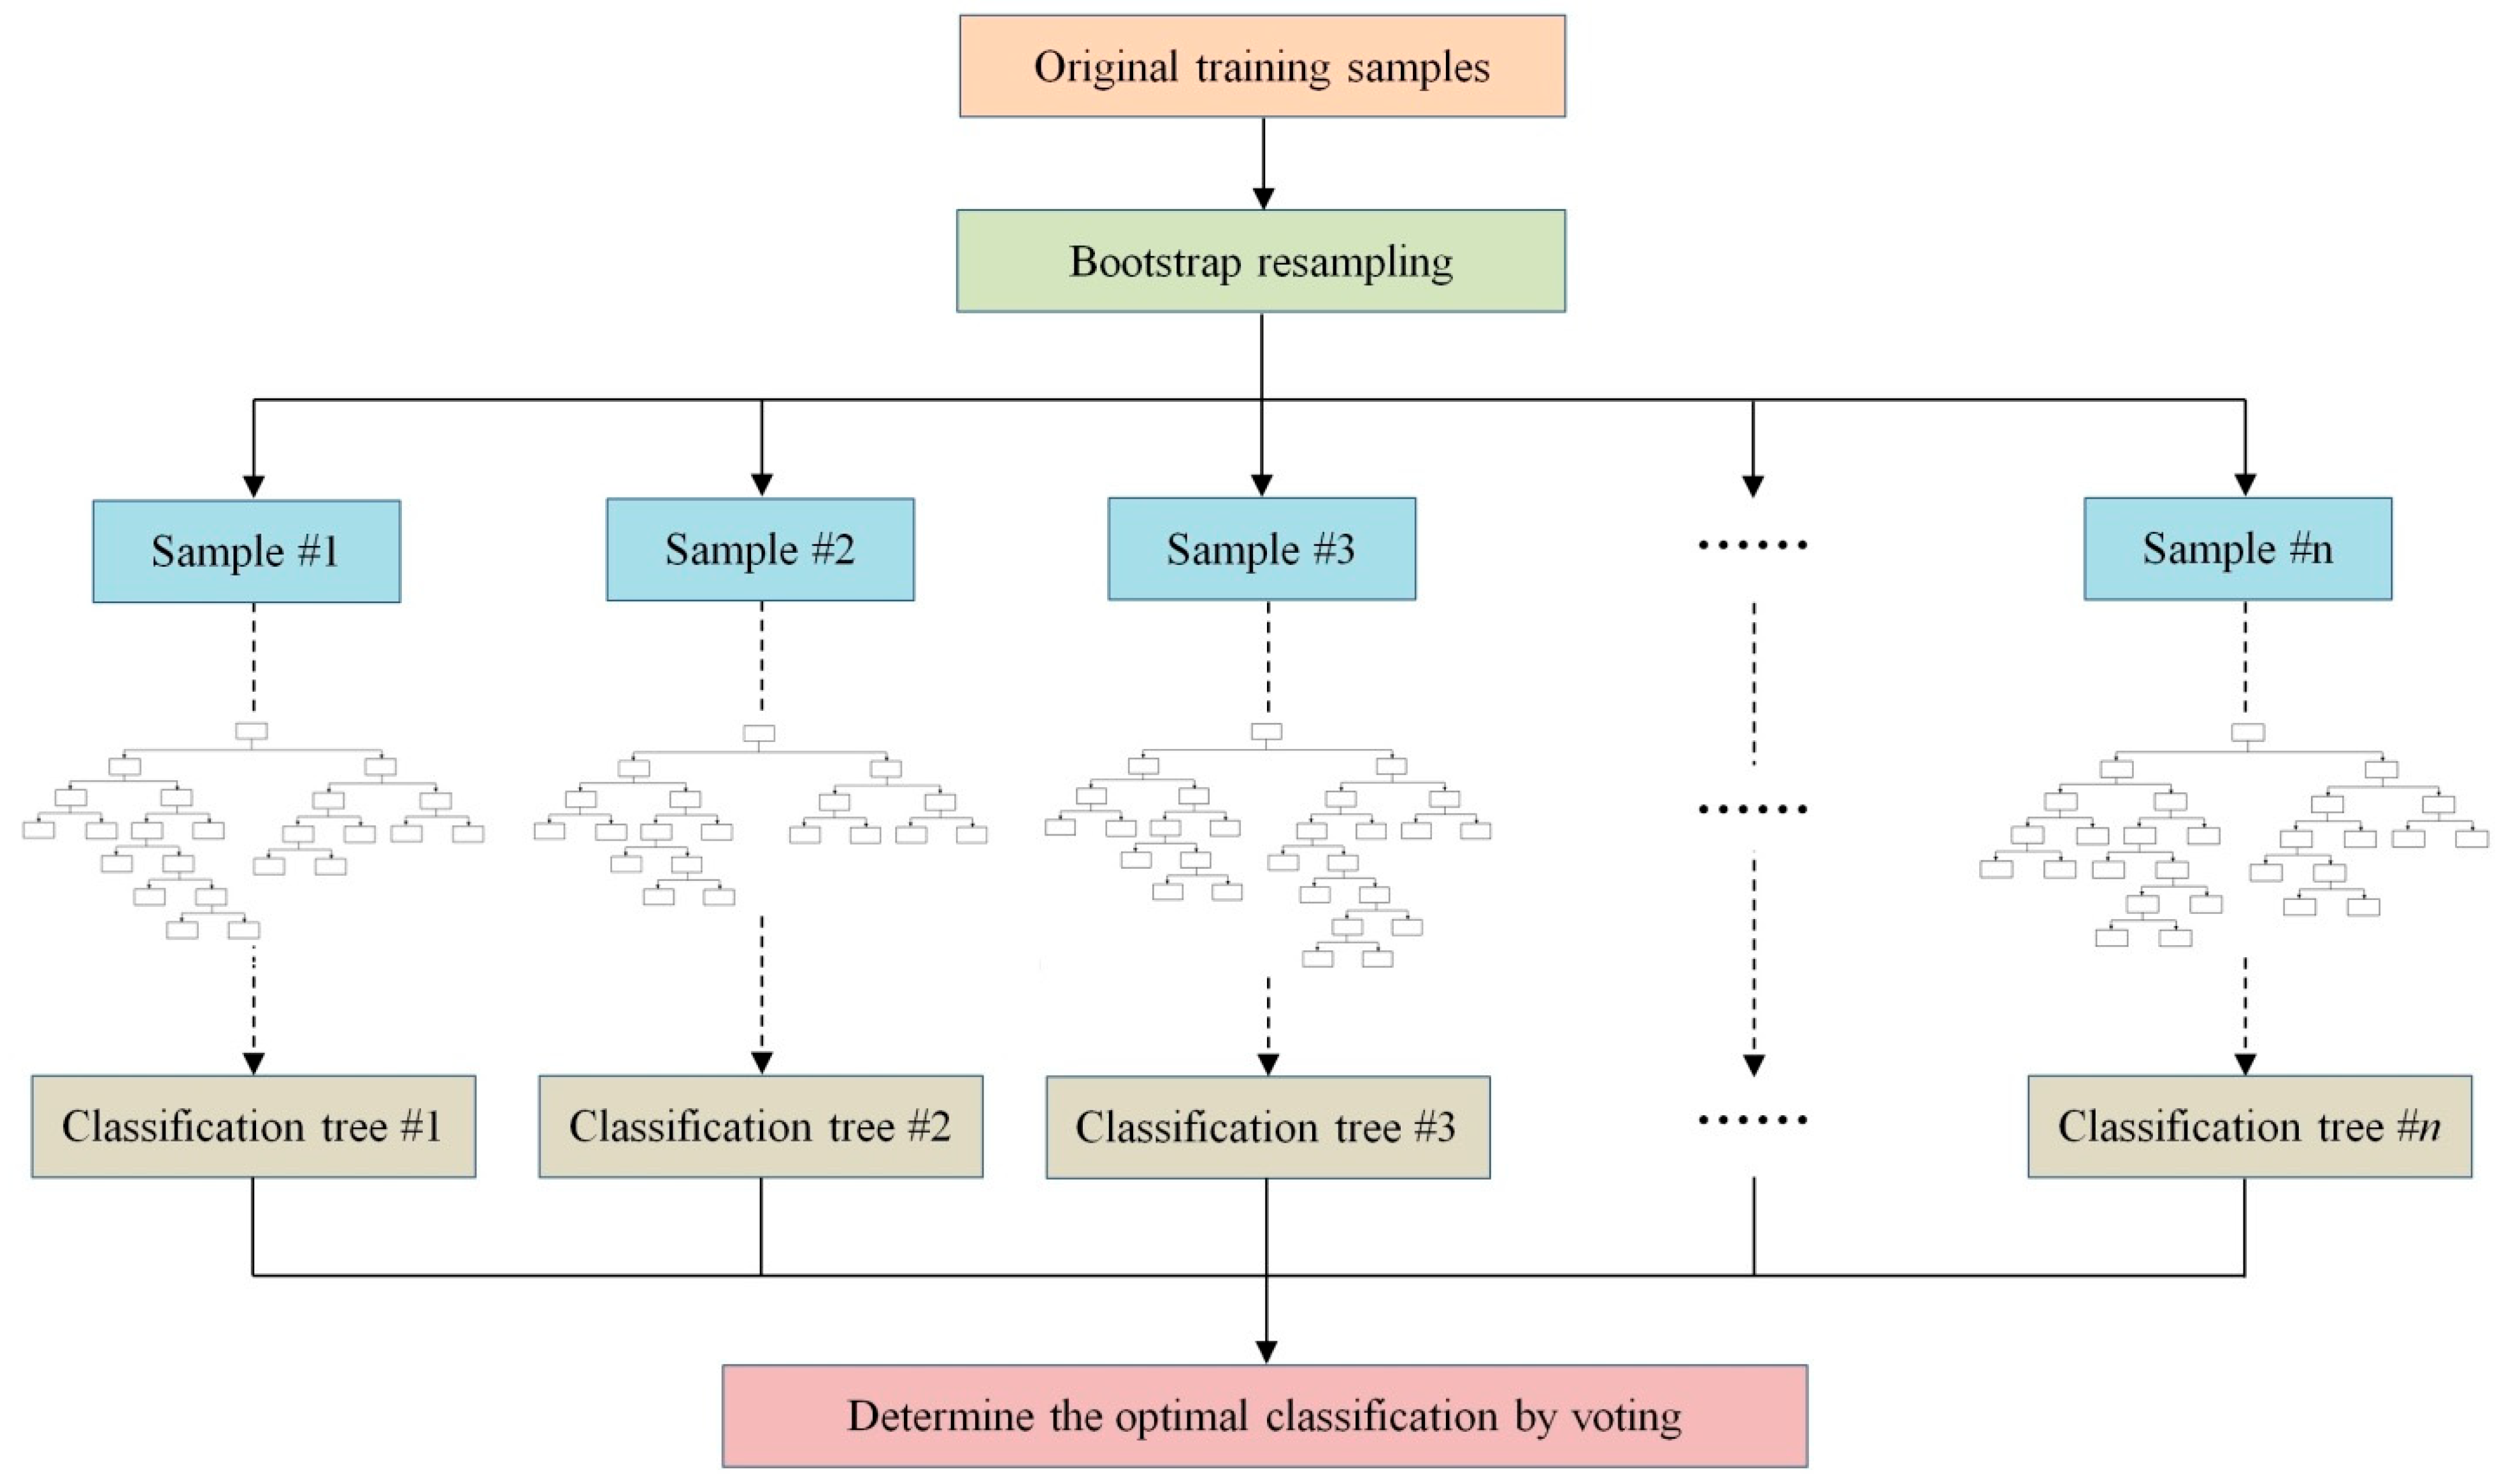
As shown in
Figure 3, the implementation process of the algorithm includes four steps: (1) Select n samples from the sample set as a training set using the method of sampling and placing back. (2) Generate a decision tree with the sample set obtained by sampling. At each generated node, randomly select d features without repetition and divide the sample set by d features to determine the best partition features. (3) Repeat steps (1) and (2) for a total of k times, where k is the number of decision trees in the random forest. (4) Use the random forest obtained by training to predict the test sample and determine the predicted result by the voting method.
In the random forest algorithm, the Gini index (
GI) is typically used as an evaluation index to measure the feature contribution (
FC) [
23]. Considering the 31 features (F01, F02, F03, …, F31) of the composite floor structure of the high-speed train in
Table 2, it is assumed that there are
I decision trees and
C categories. This makes it necessary to calculate each feature of the
GI score
FC(Gini), that is, the average change of the
jth feature in the node split impurity in all decision trees of the random forest.
The
GI of node
q in the
ith tree can be obtained using the following formula:
where
C is the number of categories and
pqc represents the proportion of category
C in node
q; that is, the probability that the two samples are randomly selected from node
q and their category labels are inconsistent.
The contribution of the
jth feature in node
q of the
ith tree, that is, the
GI change before and after the node
q branches, can be calculated using the following formula:
where
and
denote the
GI of the two new nodes after branching. If the node where the
jth feature appears in the
ith decision tree is set
Q, then the contribution of the
jth feature in the
ith tree is
Furthermore, because
I trees exist in the random forest, the contribution score of each feature is
Finally, the contribution scores of all the features are normalized (the total score is equal to 1), which can be obtained as follows:
In addition, the value of hyperparameters in a random forest model may have a significant impact on the model performance. The hyperparameters mainly include the number of trees, the maximum depth of trees, the maximum number of features, the minimum number of samples required for leaf nodes, the minimum number of samples required for internal node splitting, and so on. Increasing the number of trees usually improves the performance of the model, but also increases the computational cost, and too many trees can lead to overfitting. Limiting the maximum depth of the tree can prevent overfitting, but too small a value can lead to too simple a model. A small maximum number of features can help prevent overfitting, but it is easy to increase the randomness of the model. The minimum number of samples required for leaf node and internal node splitting is often used to control tree growth, and larger values may result in a more conservative model.
The main hyperparameters in the random forest model are finally determined after searching within their respective value ranges by using an optimal algorithm. The final values of each parameter after tuning are shown in
Table 3.
Thus, a machine-learning model was established to evaluate the contribution of the sound insulation features of the composite floor structure of a high-speed train. According to the contribution size of each feature, all the features can be sorted from largest to smallest. The higher the ranking, the more significant the impact on the results and the more important it should be considered as a key influencing factor.
3.2. Generalization and Limitation Analysis of the Model
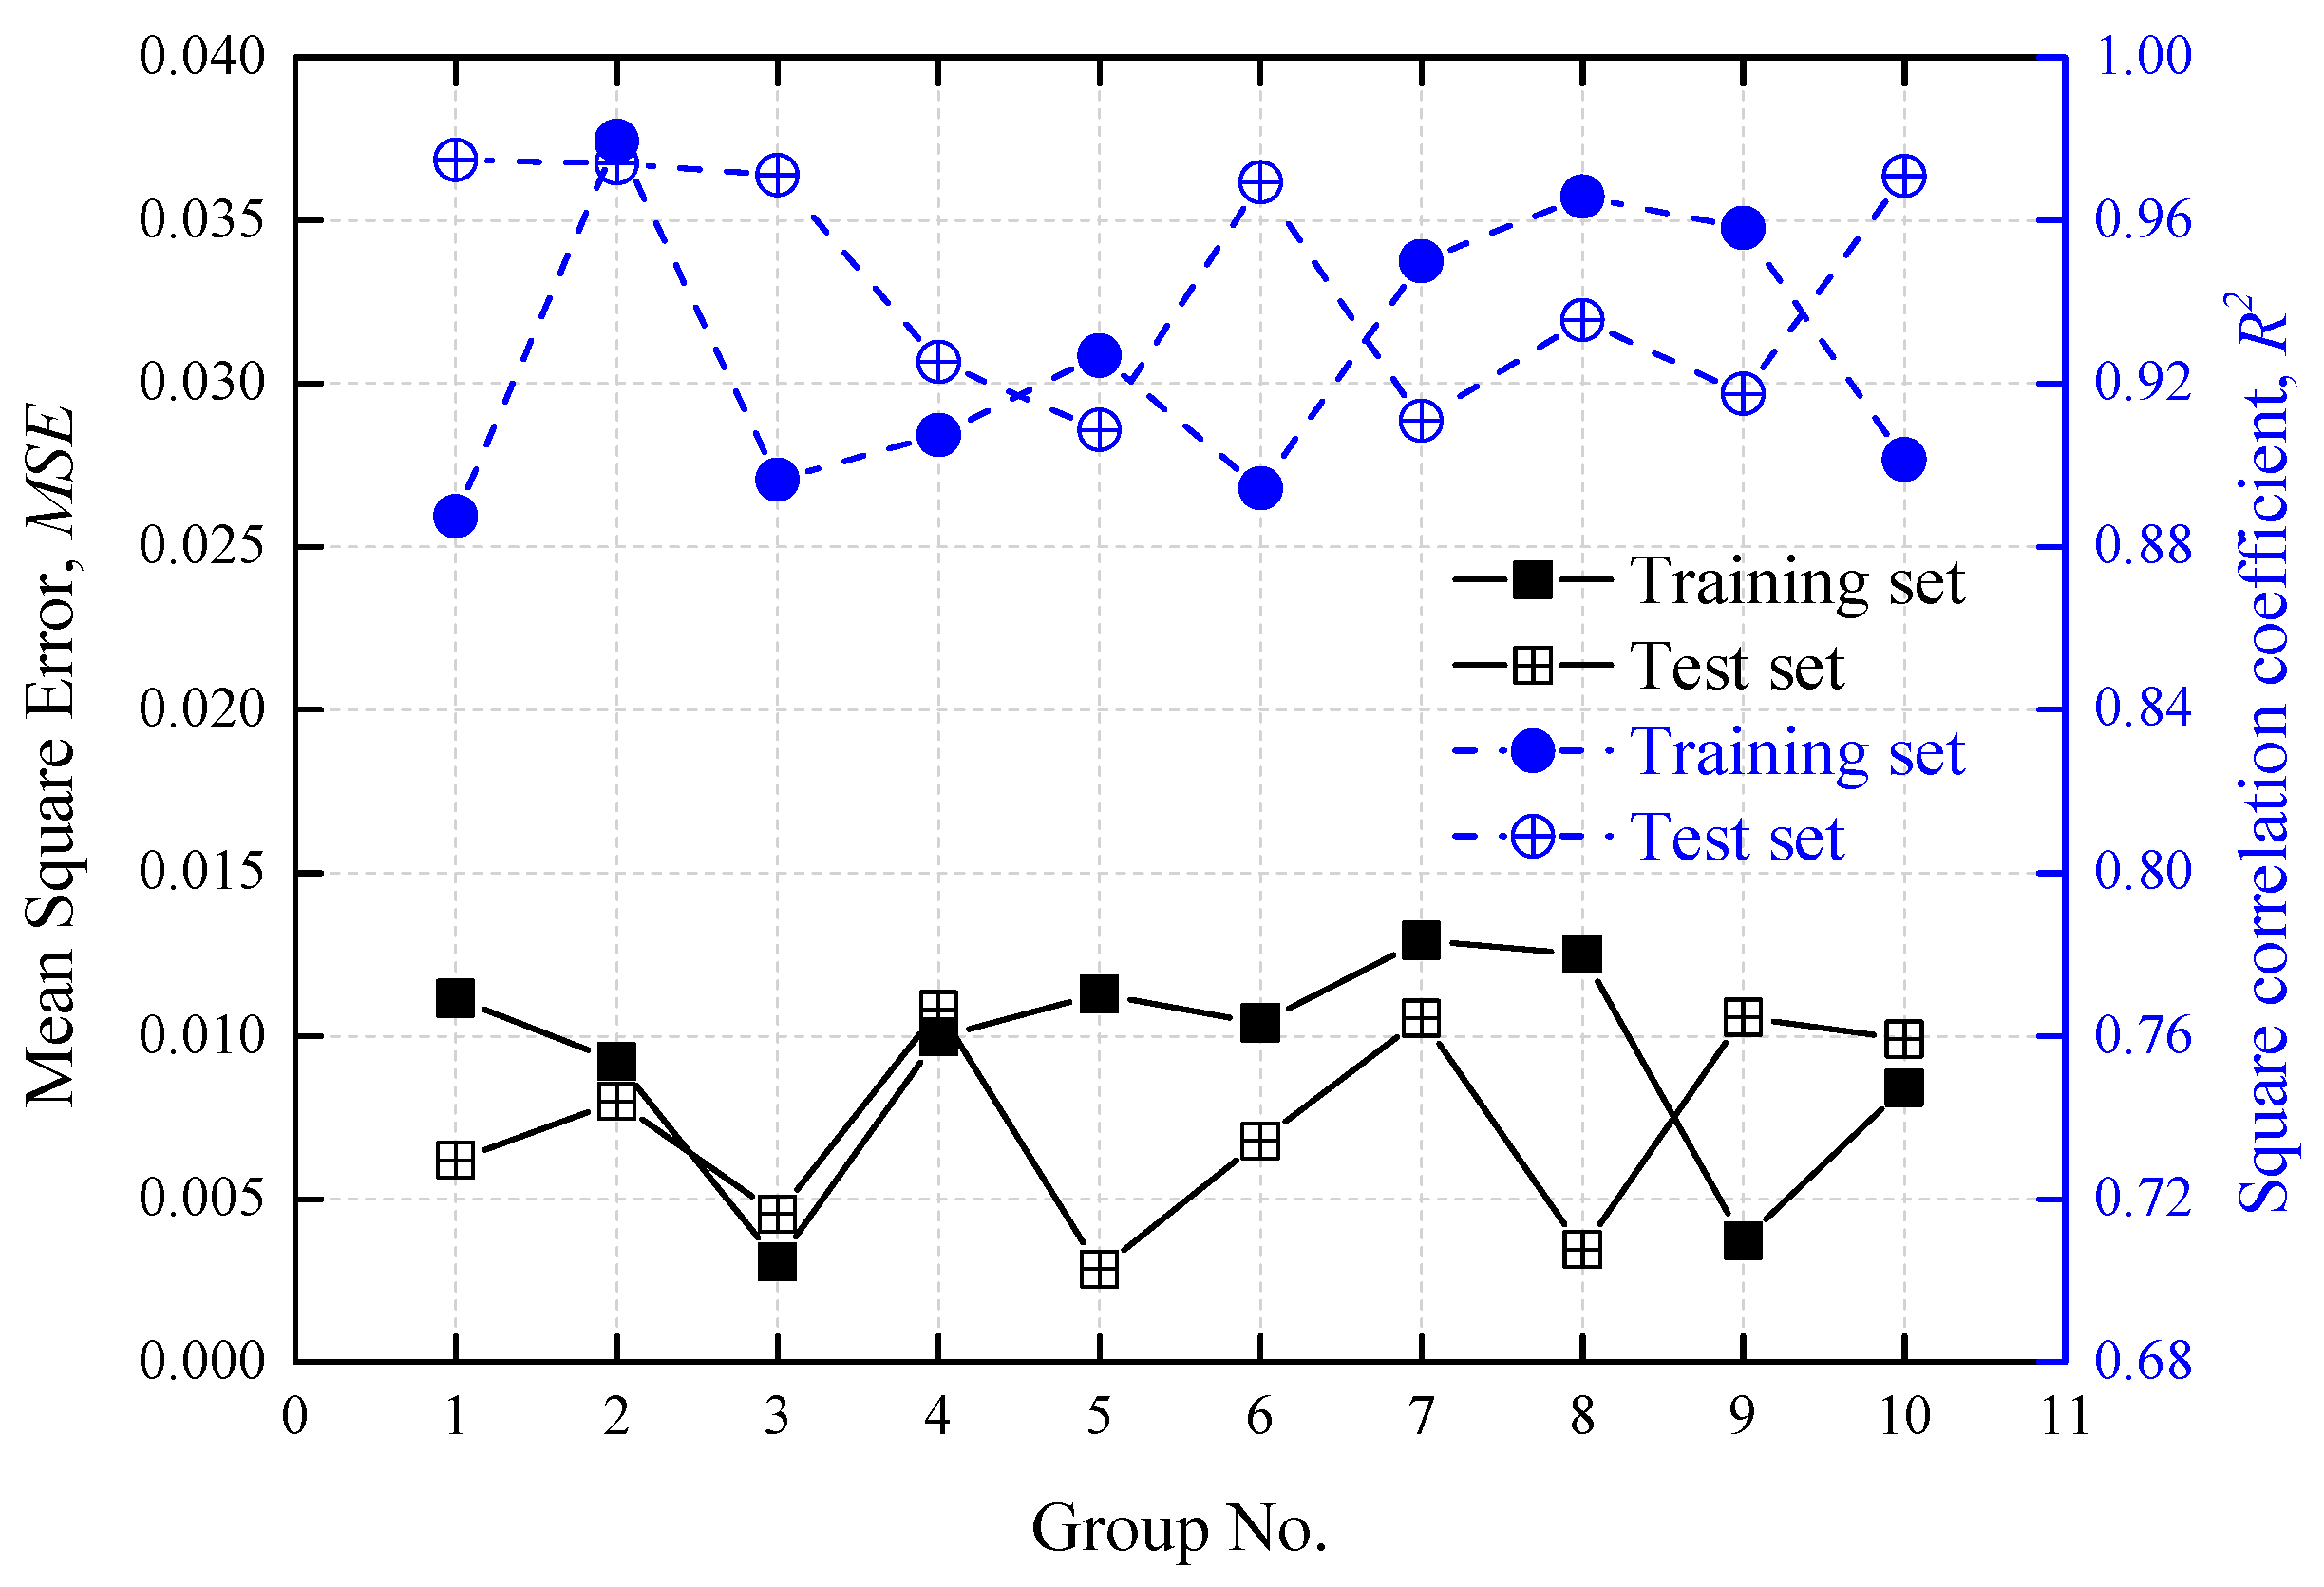
To verify the generalization ability of the model, 10-fold cross-validation was used. The data set was divided into 10 subsets; one subset was used as the validation set each time, and the rest were used as the test set. Ten groups of training and validation were performed on the model.
Figure 4 gives the results of the cross-validation, still using
MSE and
R2 as the evaluation values. It can be seen that in the 10 groups of verification, the
MSE of the training set and the test set are both below 0.015 and the
R2 is above 0.88, indicating that the influence of different feature configurations on the model training results is within a controllable range. The model has good generalization.
The limitations of random forest mainly include overfitting, inapplicability of high-dimensional sparse data, inapplicability of linear problems, poor predictive interpretation, sensitivity to noise, and so on.
The research object in this paper is the composite floor structure of high-speed trains, and the relationship between its characteristics and the target sound insulation quantity is nonlinear. In addition, in the process of acquiring experimental samples, the test personnel, test equipment, and test methods are always the same, and the test materials are well-preserved and well-processed, so that there is no very strange noise data in all the test results. Therefore, the overfitting, high-dimensional sparse data, and predictive interpretation are mainly explained.
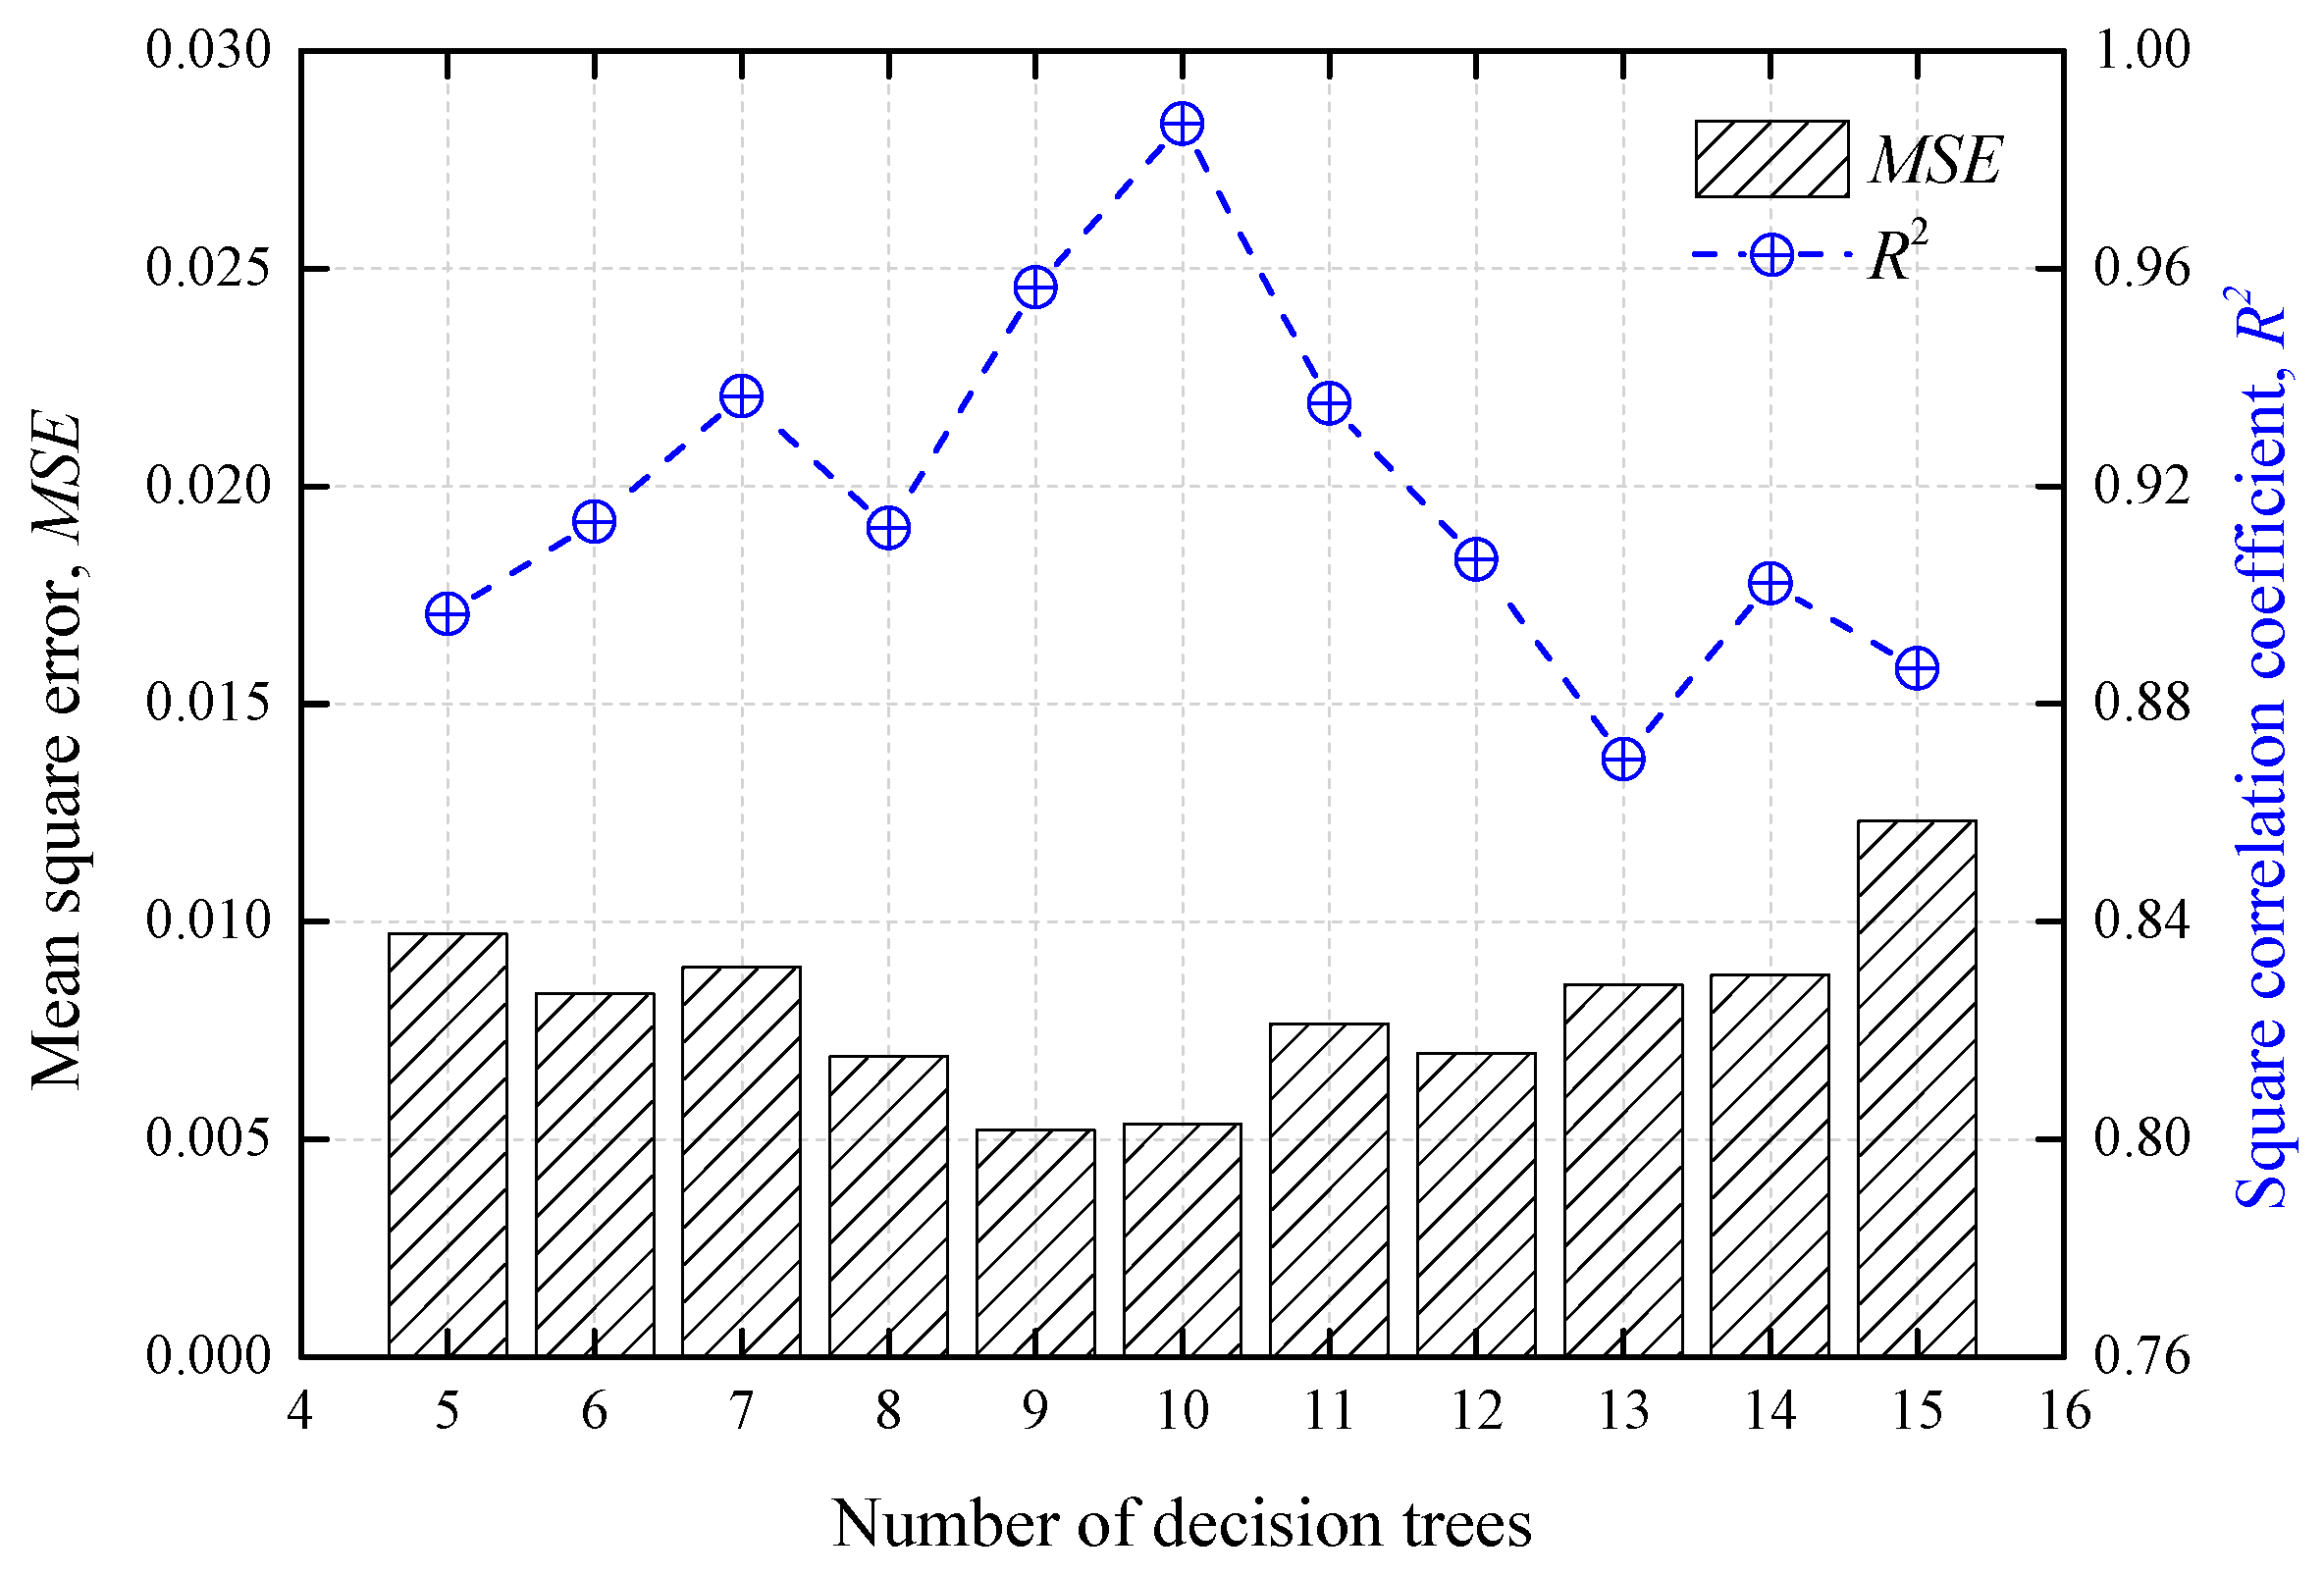
(1) Overfitting. If the number of trees in the random forest is too large, it may cause overfitting training of the data. The database in this paper contains 118 groups of samples, so the effect of the number of trees varying between 5 and 15 on the model training results is investigated. Mean square error (
MSE) and square correlation coefficient (
R2) were used as evaluation values. As shown in
Figure 5, in general, when the number of trees varies between 5 and 15, the training results of the model are basically satisfactory. When the number of trees is 9 and 10, the
MSE basically reaches its minimum, about 0.005. When the number of trees is 10,
R2 reaches a maximum of about 0.98. Therefore, we set the number of trees in the model to 10, which is most suitable for the model.
(2) High-dimensional sparse data. For the sample data of the floor structure of the high-speed train in this paper, there are four sparse data, which are the thickness of the floor cloth layer, the thickness of the inner board layer, the thickness of the drain board layer and the thickness of the aluminum profile layer. They are the same in all samples. When processing high-dimensional sparse data, random forest may lose some information during feature selection, resulting in poor training effects. Therefore, in
Section 2, they have been treated as invalid features and removed before modeling. For the remaining 31 features, each feature contains samples of no less than six values, as shown in
Table 2, which will have a large or small impact on the training results and should be retained.
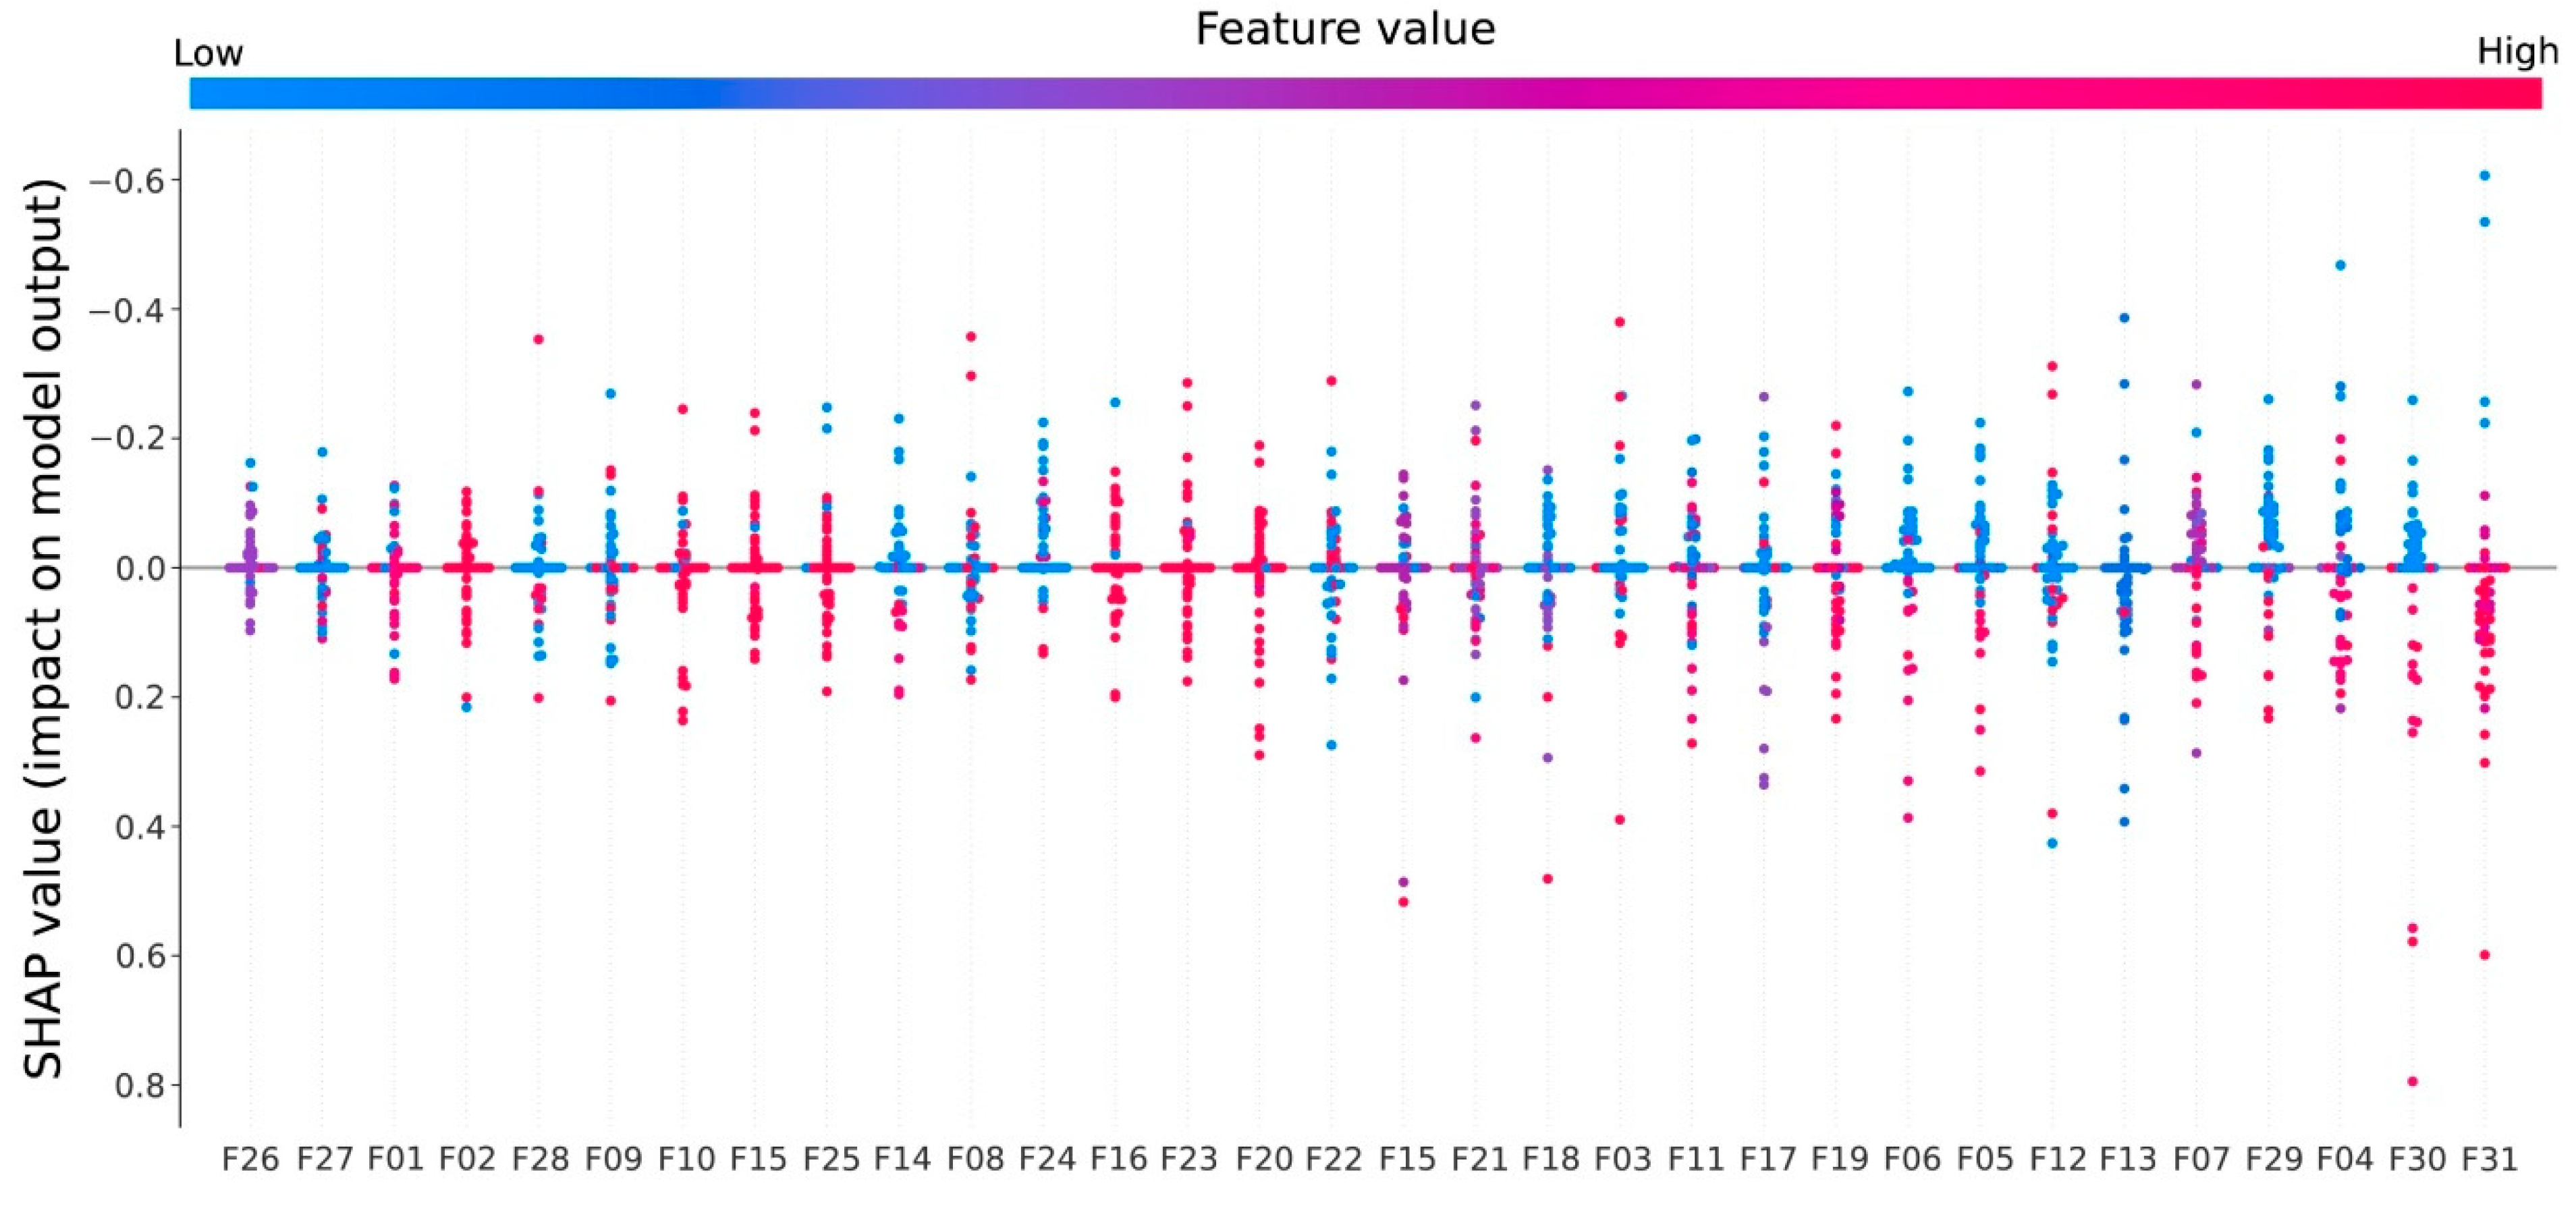
(3) Predictive interpretability. Random forests are often considered “black box” algorithms whose predictions are relatively difficult to interpret, especially for specific tree models. Therefore, it is often necessary to incorporate a SHAP plot to illustrate which features are most important and their range of influence on the data set. This will be shown in the subsequent analysis.
4. Contribution Analysis and Identification of Key Influencing Factors
4.1. Rw Influencing Factors of the Entire Structure and Their FC Analysis
Figure 6 shows the calculation results for the contribution of each feature to the overall weighted sound insulation index, based on the random forest model. Further,
Figure 7 shows the SHAP diagram of the model, which demonstrates the influence of various features on target variables more clearly by visualization. It can be seen that the results of
Figure 6 and
Figure 7 are basically consistent, and the two verify each other.
According to these requirements, several characteristics with the highest contribution can be selected as the key influencing factors. Here, we used the contribution
FC = 5% as the dividing line (red dashed line in
Figure 6) to distinguish the key influencing factors. It can be observed that there are nine features that contribute more than 5%. The nine features were the identification results of the key factors affecting the sound insulation of the composite structure of the train floor.
Of these, the characteristics with the largest contributions were F31 and F30 (the weighted sound insulation index and the surface density of the aluminum profile layer), with contributions of 8.5% and 7.3%, respectively. This was followed by F04 (the weighted sound insulation index of the inner floor layer), with a contribution of 6.9%. This is consistent with the conclusions of previous studies [
29,
30]. This is because the aluminum profiles and internal panels are the two most important components of the composite floor structure, and their weight and thickness are the largest in the entire structure.
The other six features were located in the core layer and their contributions were between 5% and 6%. Among them, the contribution of F29 (the thickness of the damping paste layer) was 5.9%, which is the most influential factor after the aluminum profile and inner floor. This is because the damping slurry layer is directly laid on the inner surface of the aluminum profile; the thicker the layer, the more obvious the damping effect on the aluminum profile and the greater the impact on its sound insulation performance. In addition, it is worth noting that although the composite structure contains multiple sound insulation and absorption layers, only sound-insulation layer #1 and sound-absorption layer #1 have the greatest impact on the weighted sound insulation index of the entire structure.
In addition, in engineering design, owing to the structural strength, assembly space, and other constraints, the acoustic optimization design process of a high-speed train body is not random. Some key components are difficult to adjust, particularly the internal panels, aluminum profiles, and supports. Therefore, the measures of the acoustic optimization design are more concerned with the optimization of the core layer materials, such as the material selection and arrangement.
4.2. FC Analysis of Acoustic Properties of Core Layer Materials to Sound Insulation at Different Frequencies
The weighted sound insulation index
Rw of the structure was obtained from the measured frequency sound insulation curve after the weighted calculation [
21].
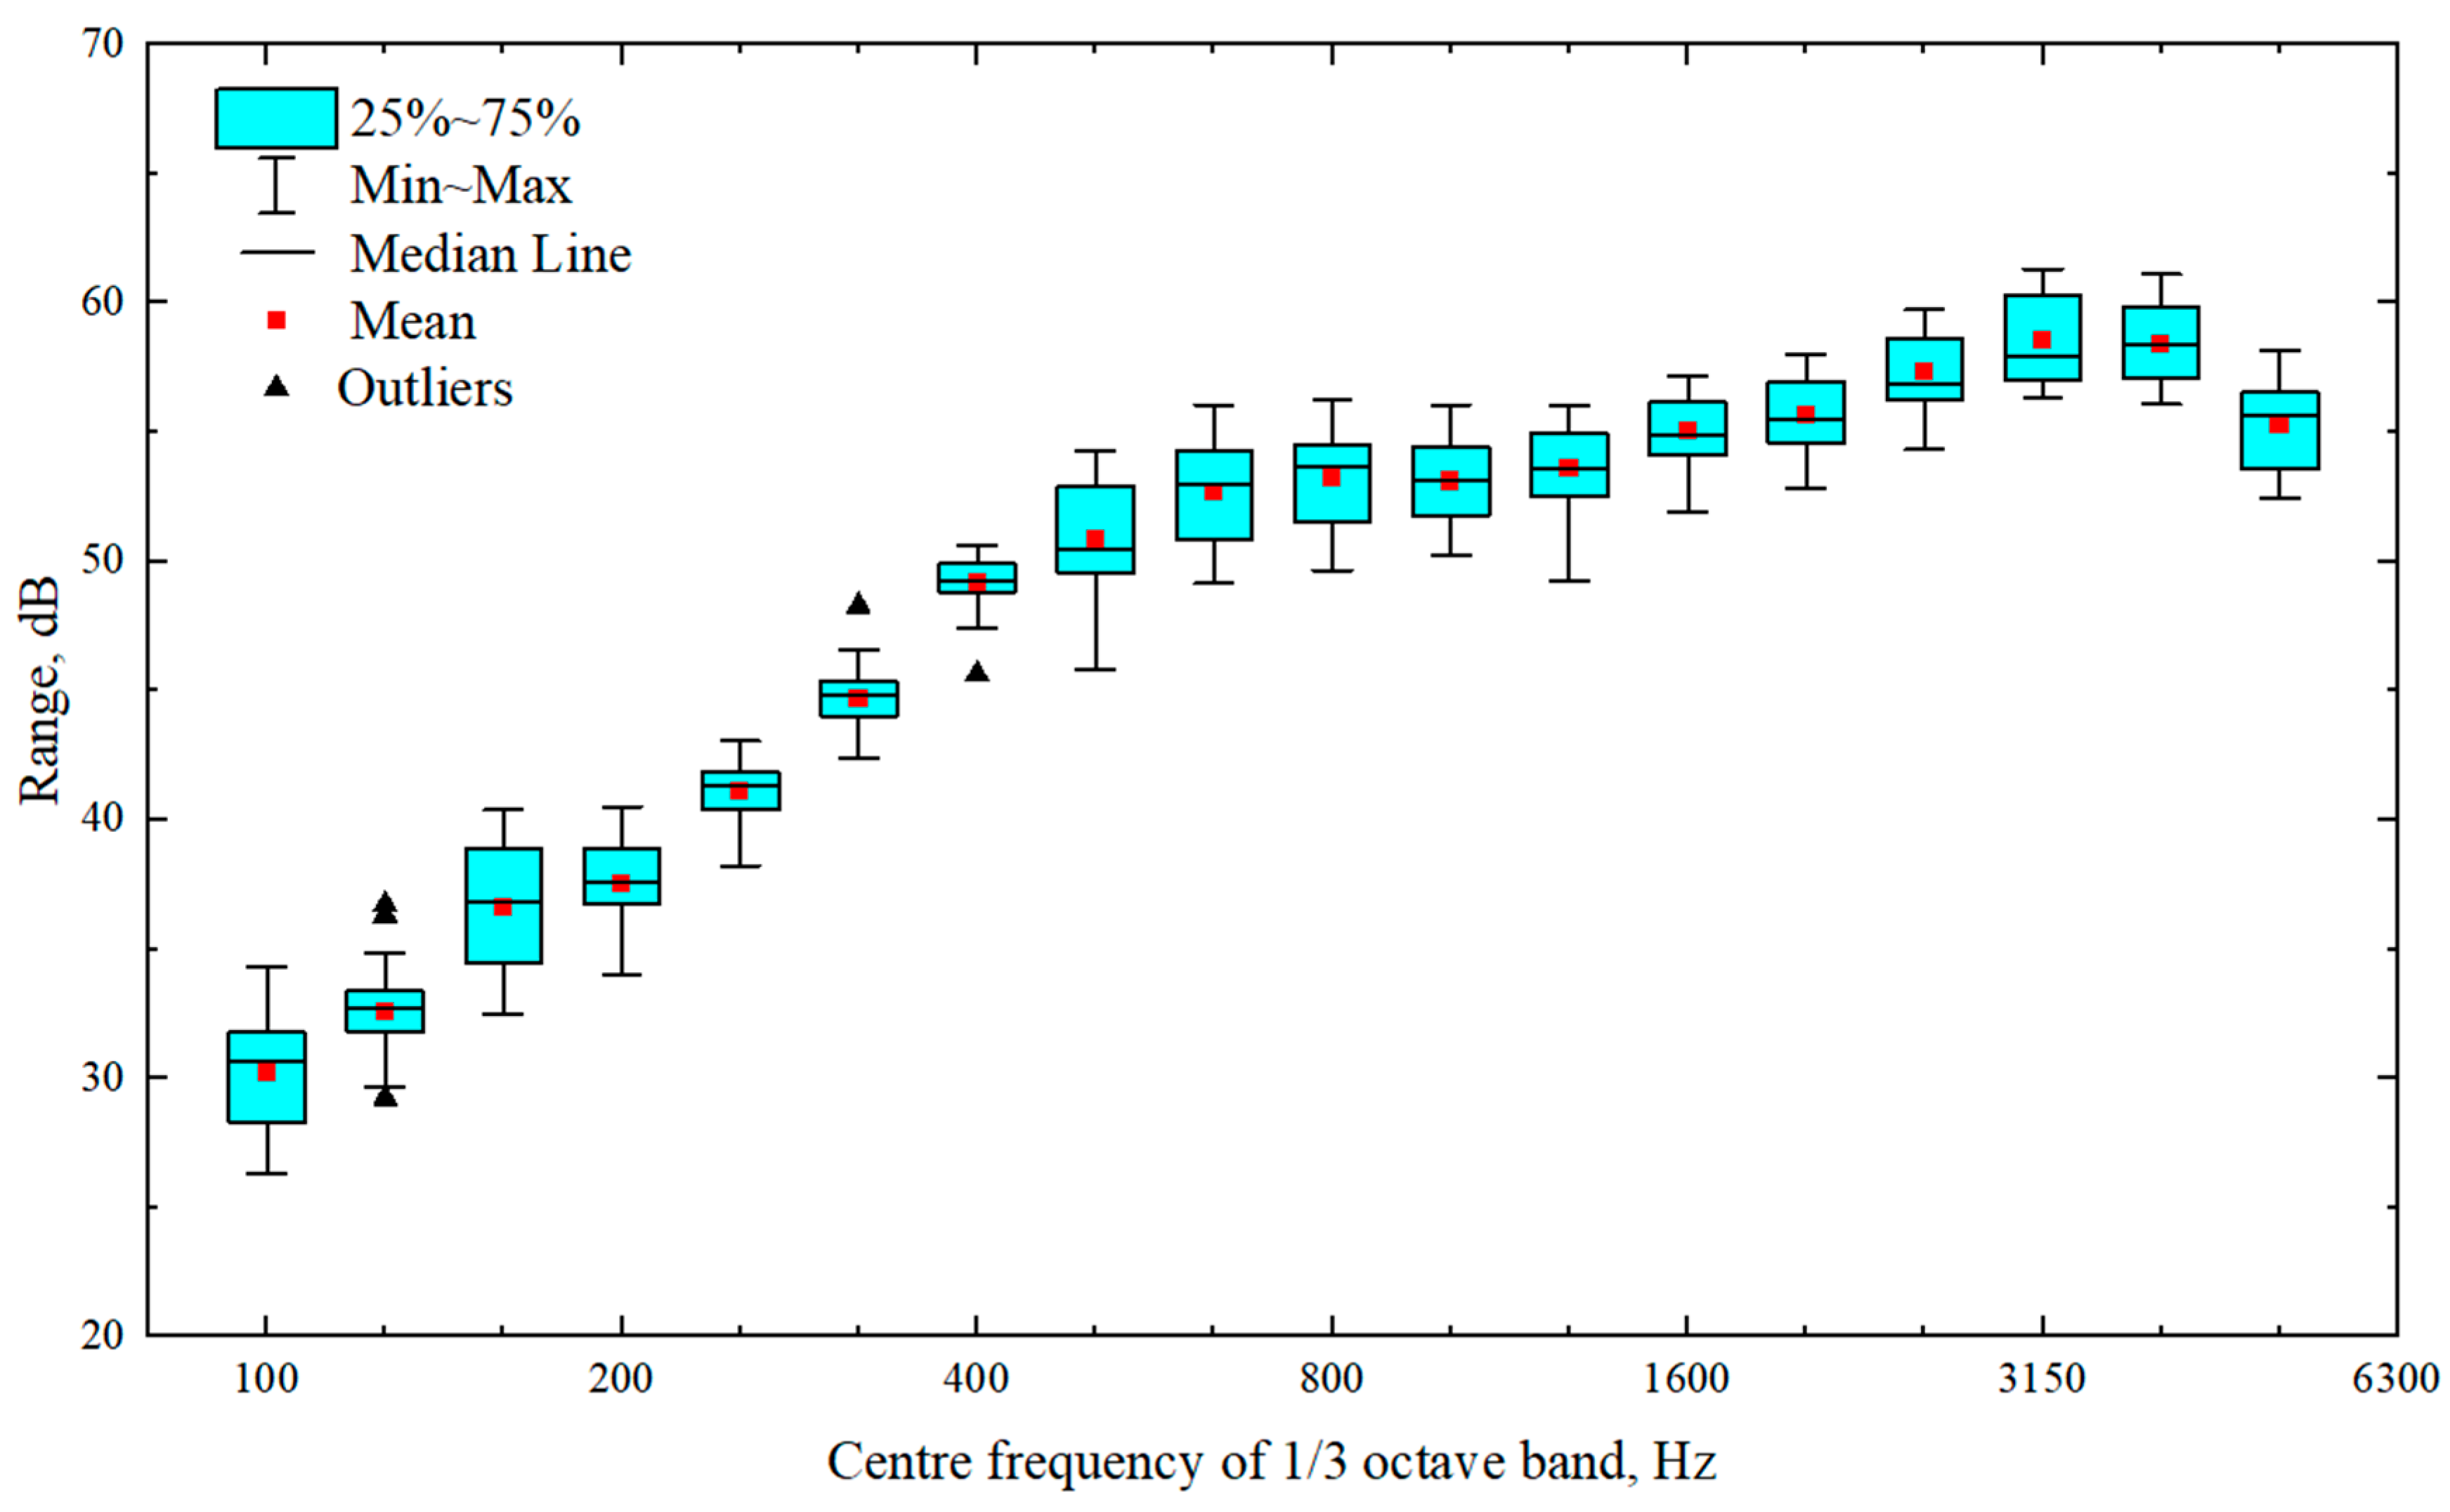
Figure 8 shows the statistical results of the sound insulation values of the 118 sets of composite floor structure samples at each frequency in the range of 100–5000 Hz. It can be observed that the sound insulation value of each frequency has greater or smaller changes, and these differences affect the calculation results of
Rw.
To meet the
Rw design requirements of the entire structure, it is necessary to carefully analyze the sound insulation value of the structure at each frequency, particularly to identify the frequency of the largest adverse deviation (weak link) to improve the sound insulation performance of these weak links.
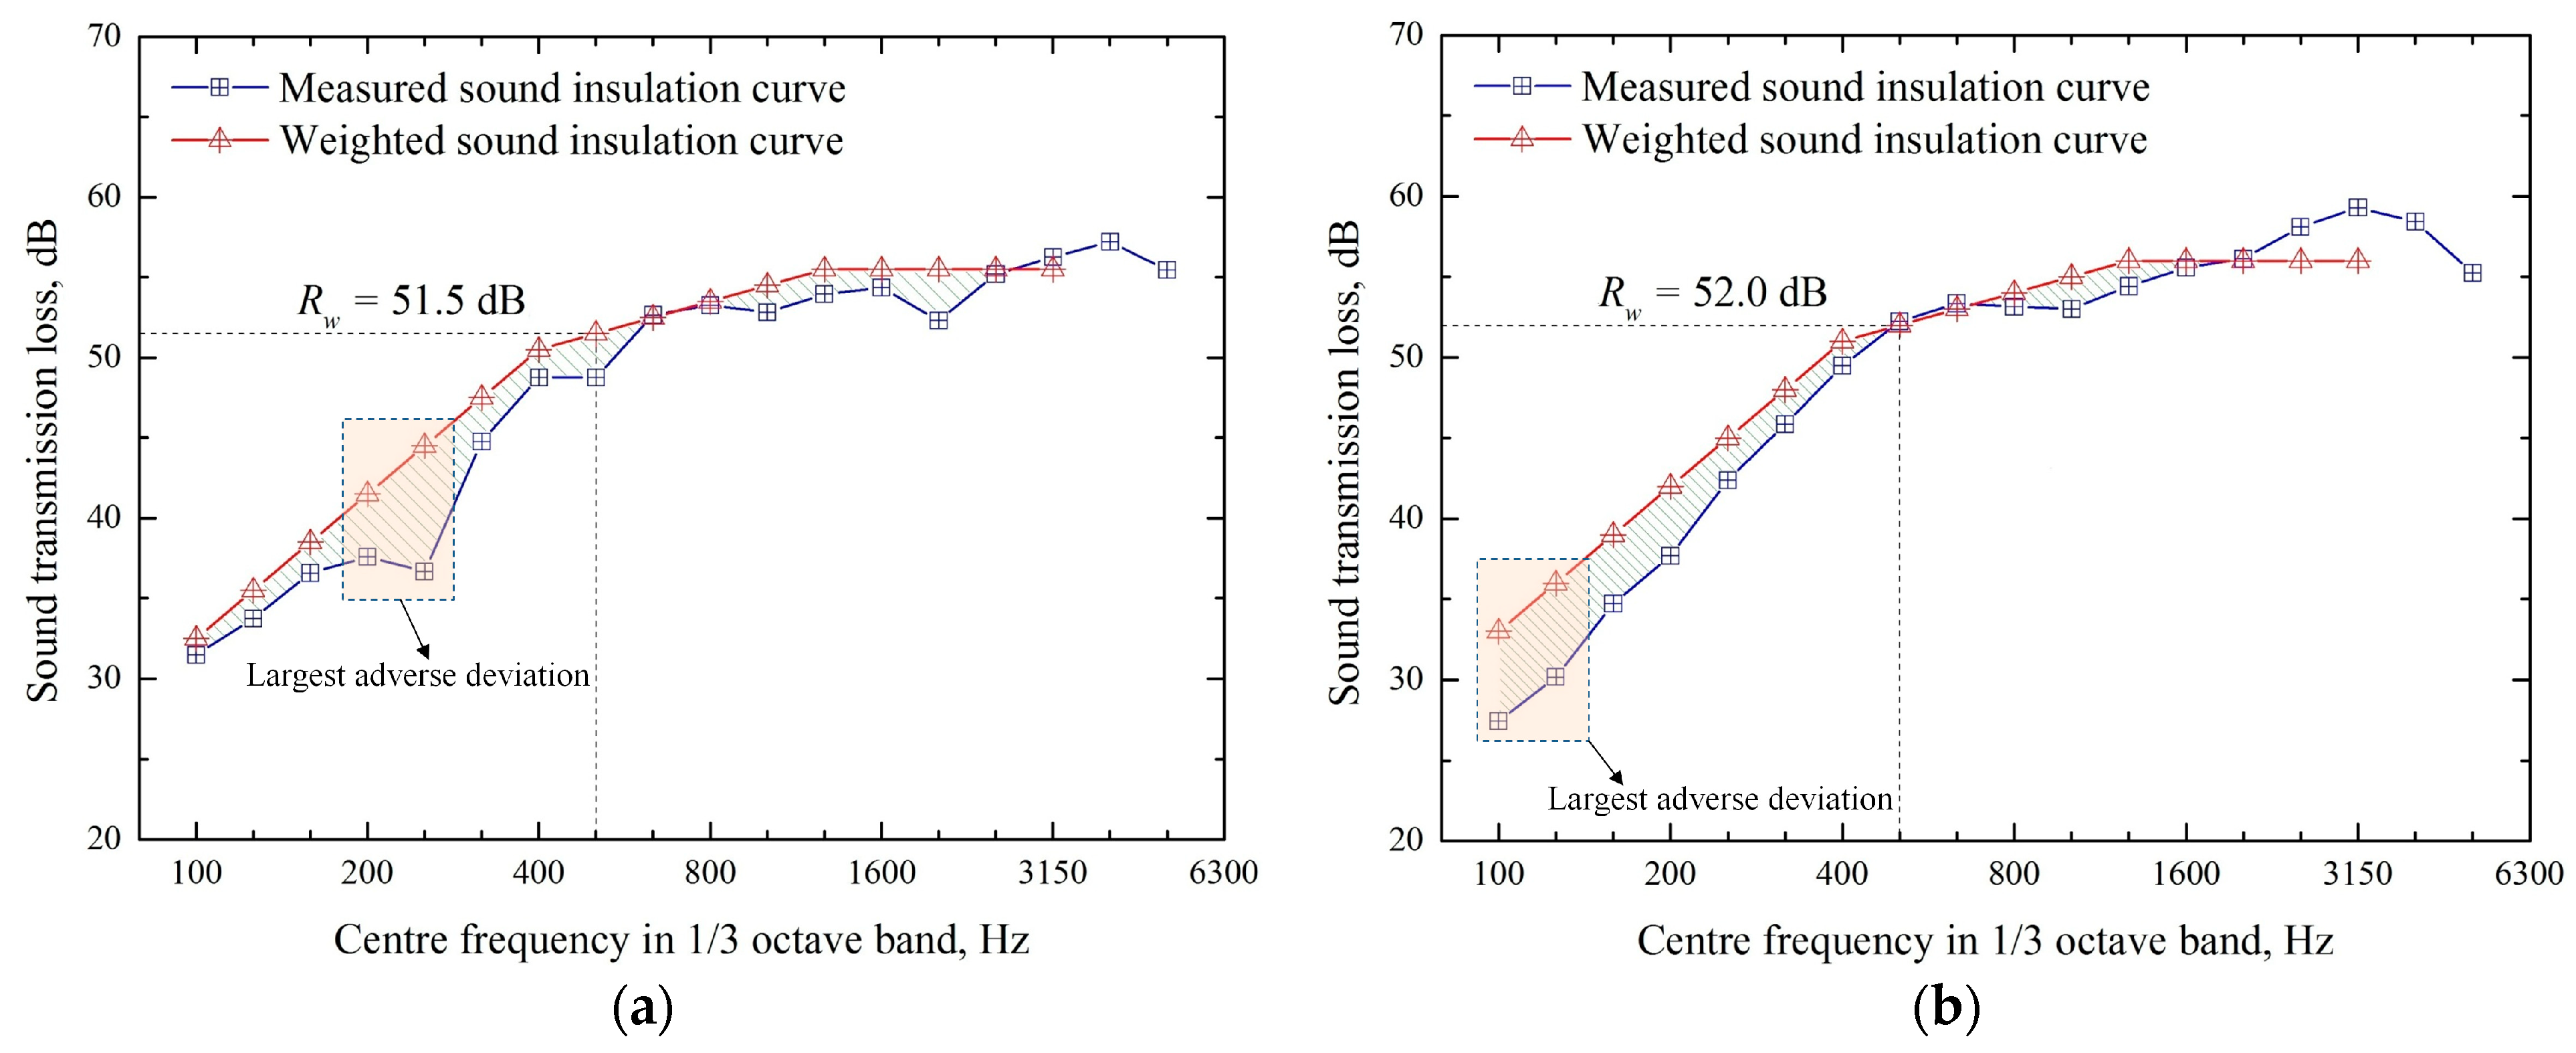
Figure 9 shows the measured sound insulation curves (blue curves) at different frequencies for samples #1 and #3 listed in
Table 1. Simultaneously, by comparing the weighted sound insulation curve (red curve) with the measured curve, the weighted sound-insulation index
Rw is calculated. It can be observed that for sample #1, the frequency bands of its adverse deviation (shadow region) are mainly 100–500 Hz and 1000–2000 Hz, and the maximum adverse deviation is 200–250 Hz. For sample #3, the frequency bands of its adverse deviation (shadow region) are 100–400 Hz and 800–1250 Hz, and the maximum adverse deviation is 100–125 Hz. Therefore, the weak frequency bands of sound insulation were not the same for different structural samples.
Therefore, for frequency bands with weak sound insulation, researchers aim to determine the acoustic properties that play a leading role in the sound insulation of these frequency band, thus guiding researchers to propose targeted material optimization strategies.
Therefore, we can still calculate and analyze only the contribution of the acoustic properties of the core layer materials to the sound insulation of the structure at each frequency, according to the random forest model in
Section 2. It is only necessary to extract the acoustic performance features related to the core layer material in
Table 2 (the damping slurry layer only has a thickness feature; therefore, it is directly extracted) to form a new feature library. The original weighted sound insulation index and noise reduction coefficient were replaced with frequency-related sound insulation and sound absorption coefficients, as listed in
Table 4.
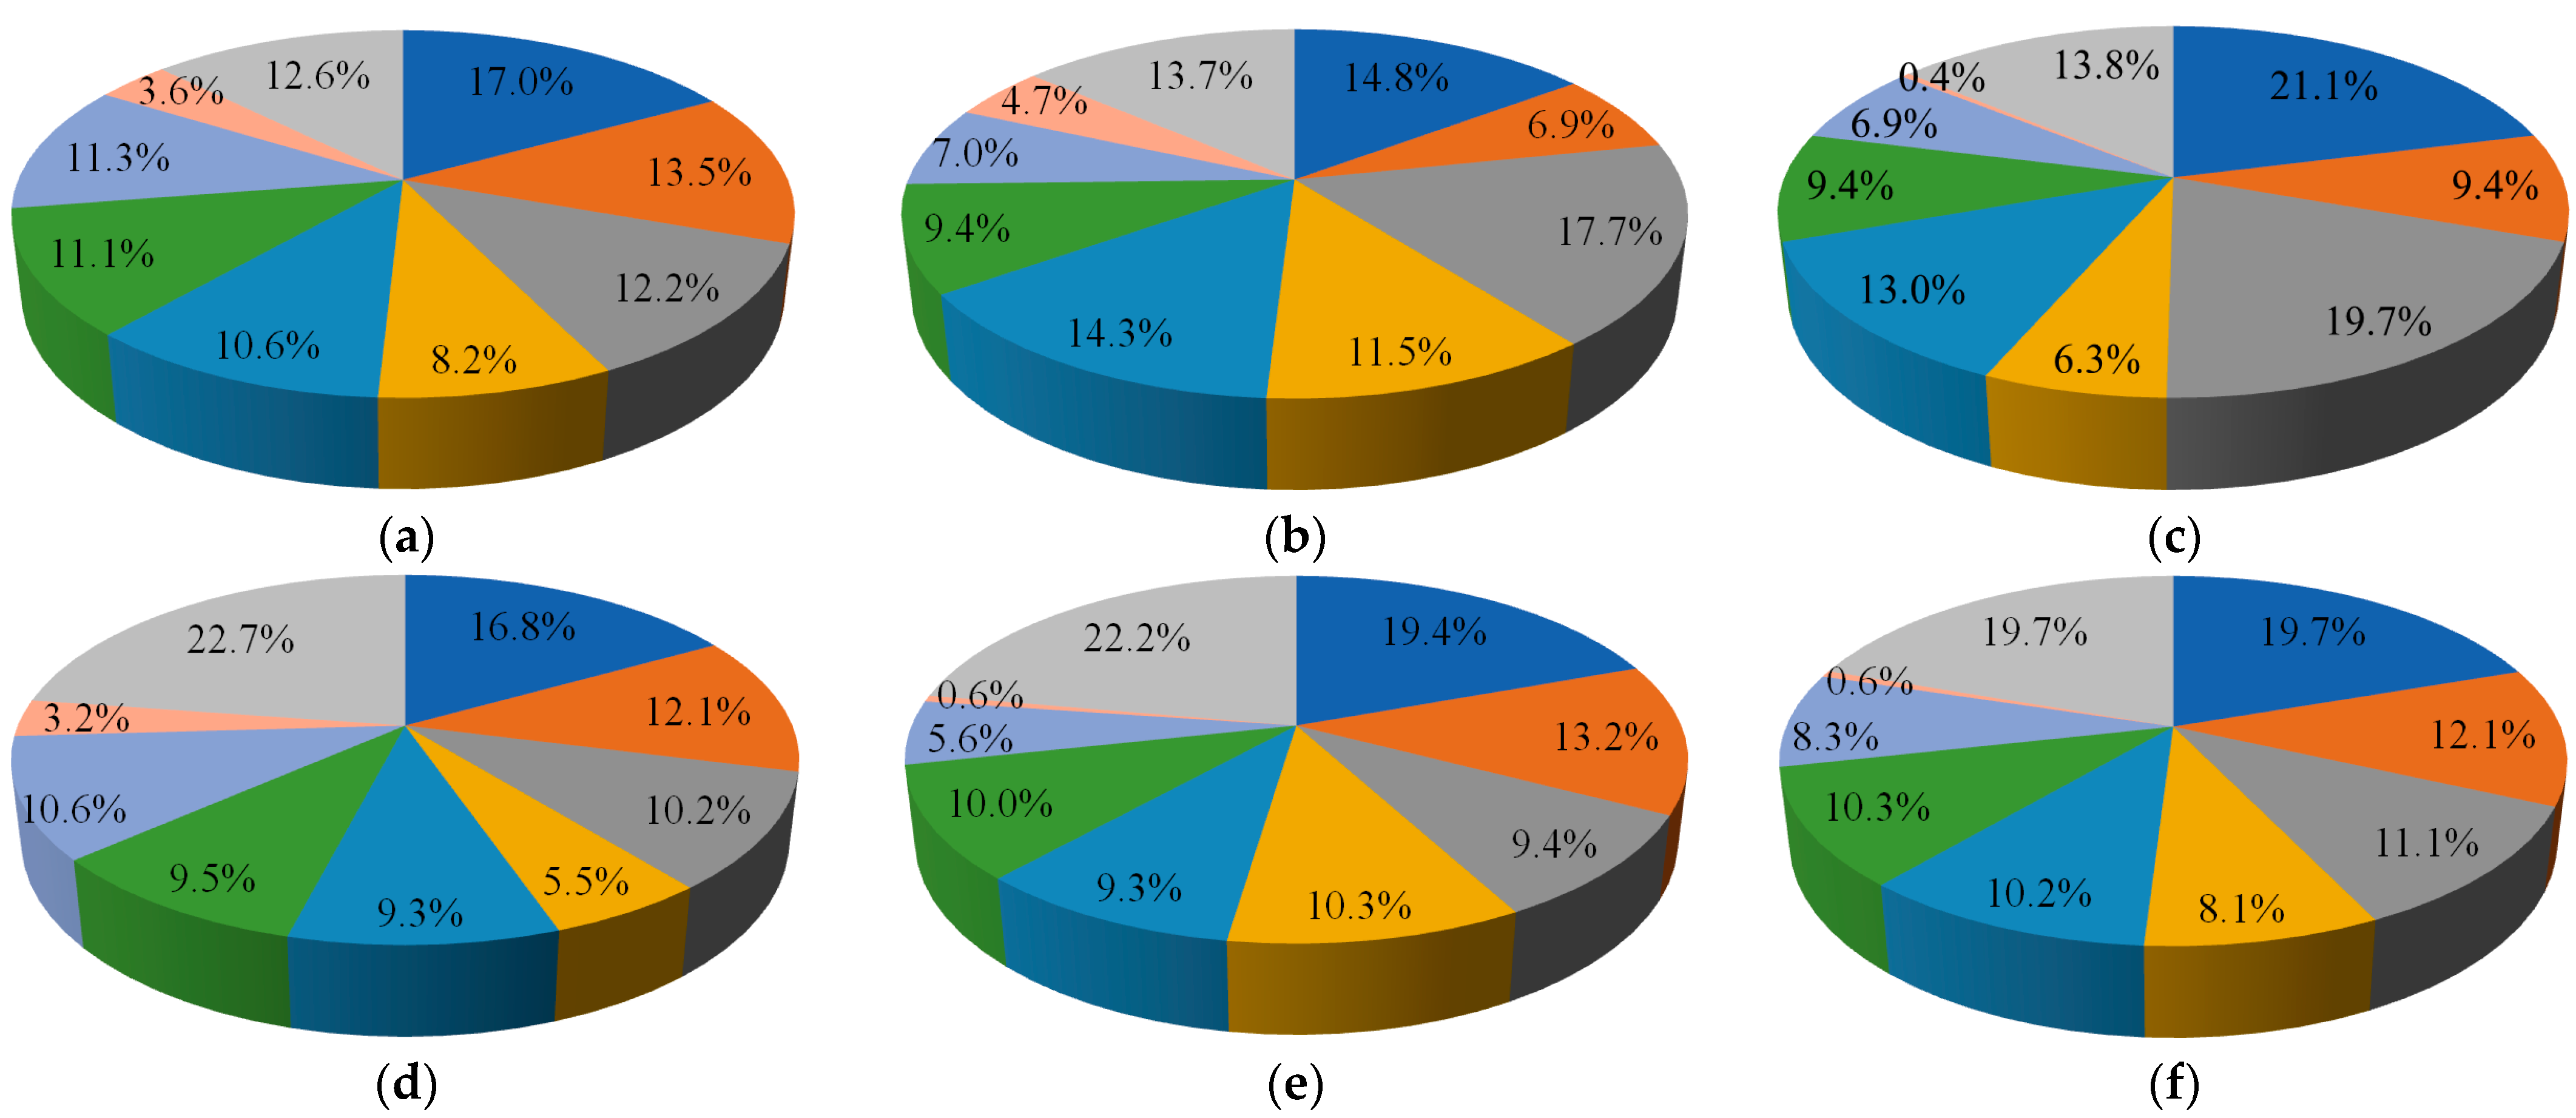
The sound insulation contribution of six octave center frequencies of 125–4000 Hz was calculated as an example, as shown in
Figure 10a–f, clearly showing the influence of various core layer materials on sound insulation at different frequencies. The analysis was performed as follows.
(1) The sound-insulation layer had a significant impact on the sound insulation of almost all frequency bands. The total contribution of the four sound-insulation layers was greater than 40% for each frequency band. In particular, sound-insulation layer #1 ranked among the top two in terms of the sound insulation contribution at various frequencies. Except at 250 Hz, the contributions exceeded 15% and reached 20%. This is related to the placement of sound-insulation layer #1 on the outermost side, which is the same mechanism as the relatively large contributions of the aluminum profile (including the damping paste) and inner floor.
(2) The sound-absorption layer has a significant impact on the middle- and low-frequency sound insulation, especially sound-absorption layer #1, which has a greater impact on the sound insulation at 250 Hz and 500 Hz, with a contribution of more than 15%. This is consistent with the conclusion in [
10], mainly because the difference in the sound absorption coefficients of different sound absorption materials is concentrated in the intermediate frequencies.
(3) The sound insulation effect of the drain board layer on each frequency band is very small because the surface density of the several drain boards included in the layer is very small (0.1–0.5 kg/m2), the proportion of the entire composite structure is basically negligible, and the sound insulation value is also very low.
(4) The sound insulation contribution of the damping slurry layer to each frequency band is more than 10%, especially in the mid–high frequency bands above 1000 Hz, which is close to or even more than 20%. This is related to the greater impact of the mid–high frequency sound insulation on damping.
4.3. Experimental Verification
As can be seen from
Figure 11, the maximum adverse deviation positions of samples #1 and #3 are 250 Hz and 125 Hz, respectively. According to the calculation results in
Figure 6, the sound insulation values of 250 Hz and 125 Hz are most affected by the feature FS03 (the sound absorption coefficient of sound-absorption layer #1) and FS01 (the sound insulation quantity of sound-insulation layer #1) respectively. Therefore, the following test verification conditions are set:
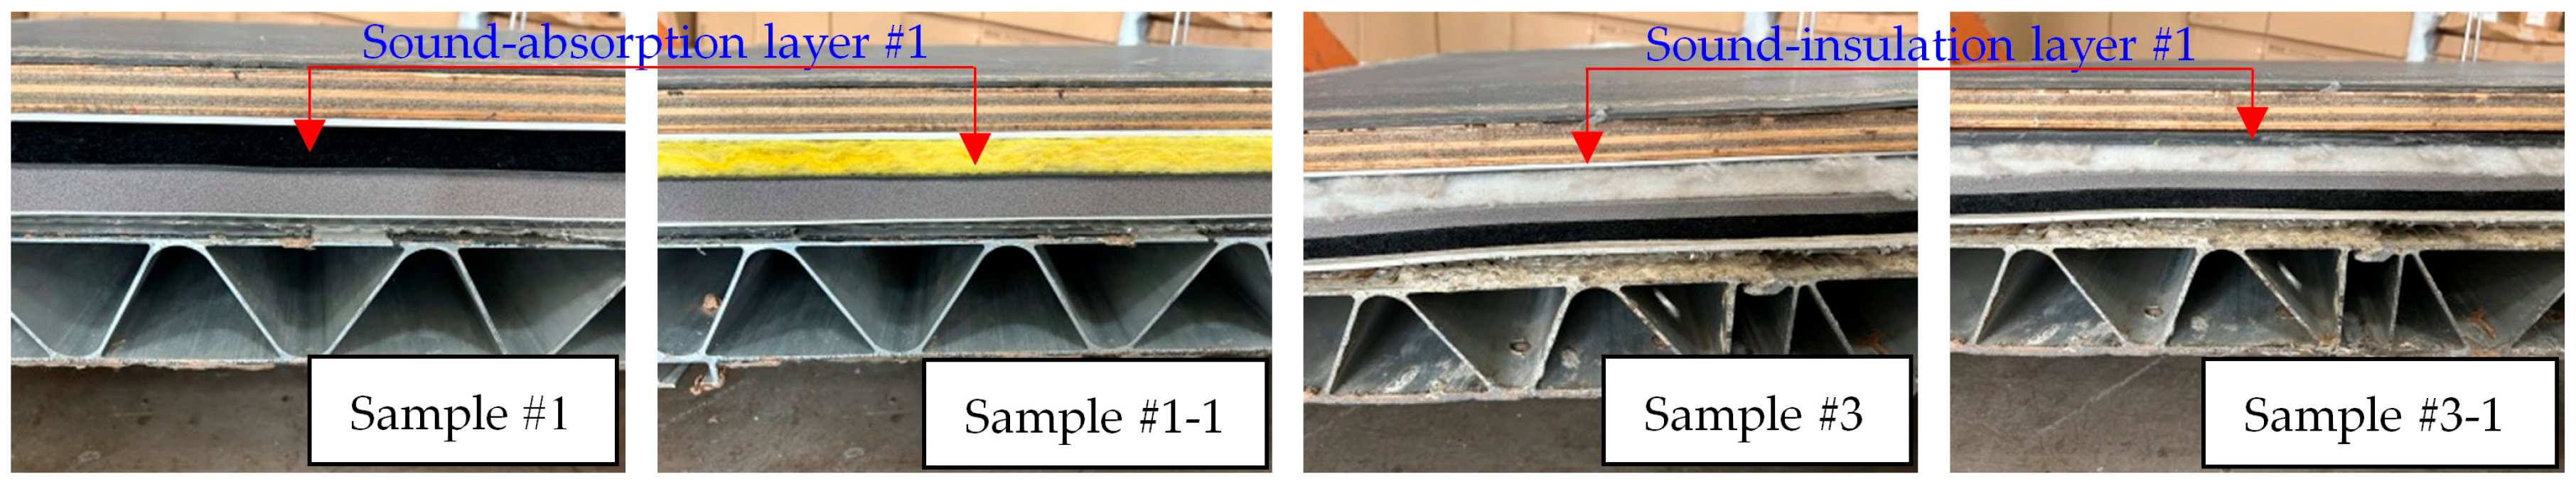
(1) The sound-absorption layer #1 of sample #1 was originally carbon fiber wool with a sound absorption coefficient of 0.55. During optimization, the material of the sound-absorption layer #1 was replaced with glass fiber wool, with a sound absorption coefficient of 0.70, to form the optimization scheme (sample #1-1) of sample #1.
(2) The sound-insulation layer #1 of sample #3 was originally a polyurethane sound insulation pad with a sound insulation capacity of 24 dB. During optimization, the material of sound-insulation layer #1 was replaced with a rubber sound insulation pad, with a sound insulation capacity of 36 dB, to form the optimization scheme (sample #3-1) of sample #3.
The test results are shown in
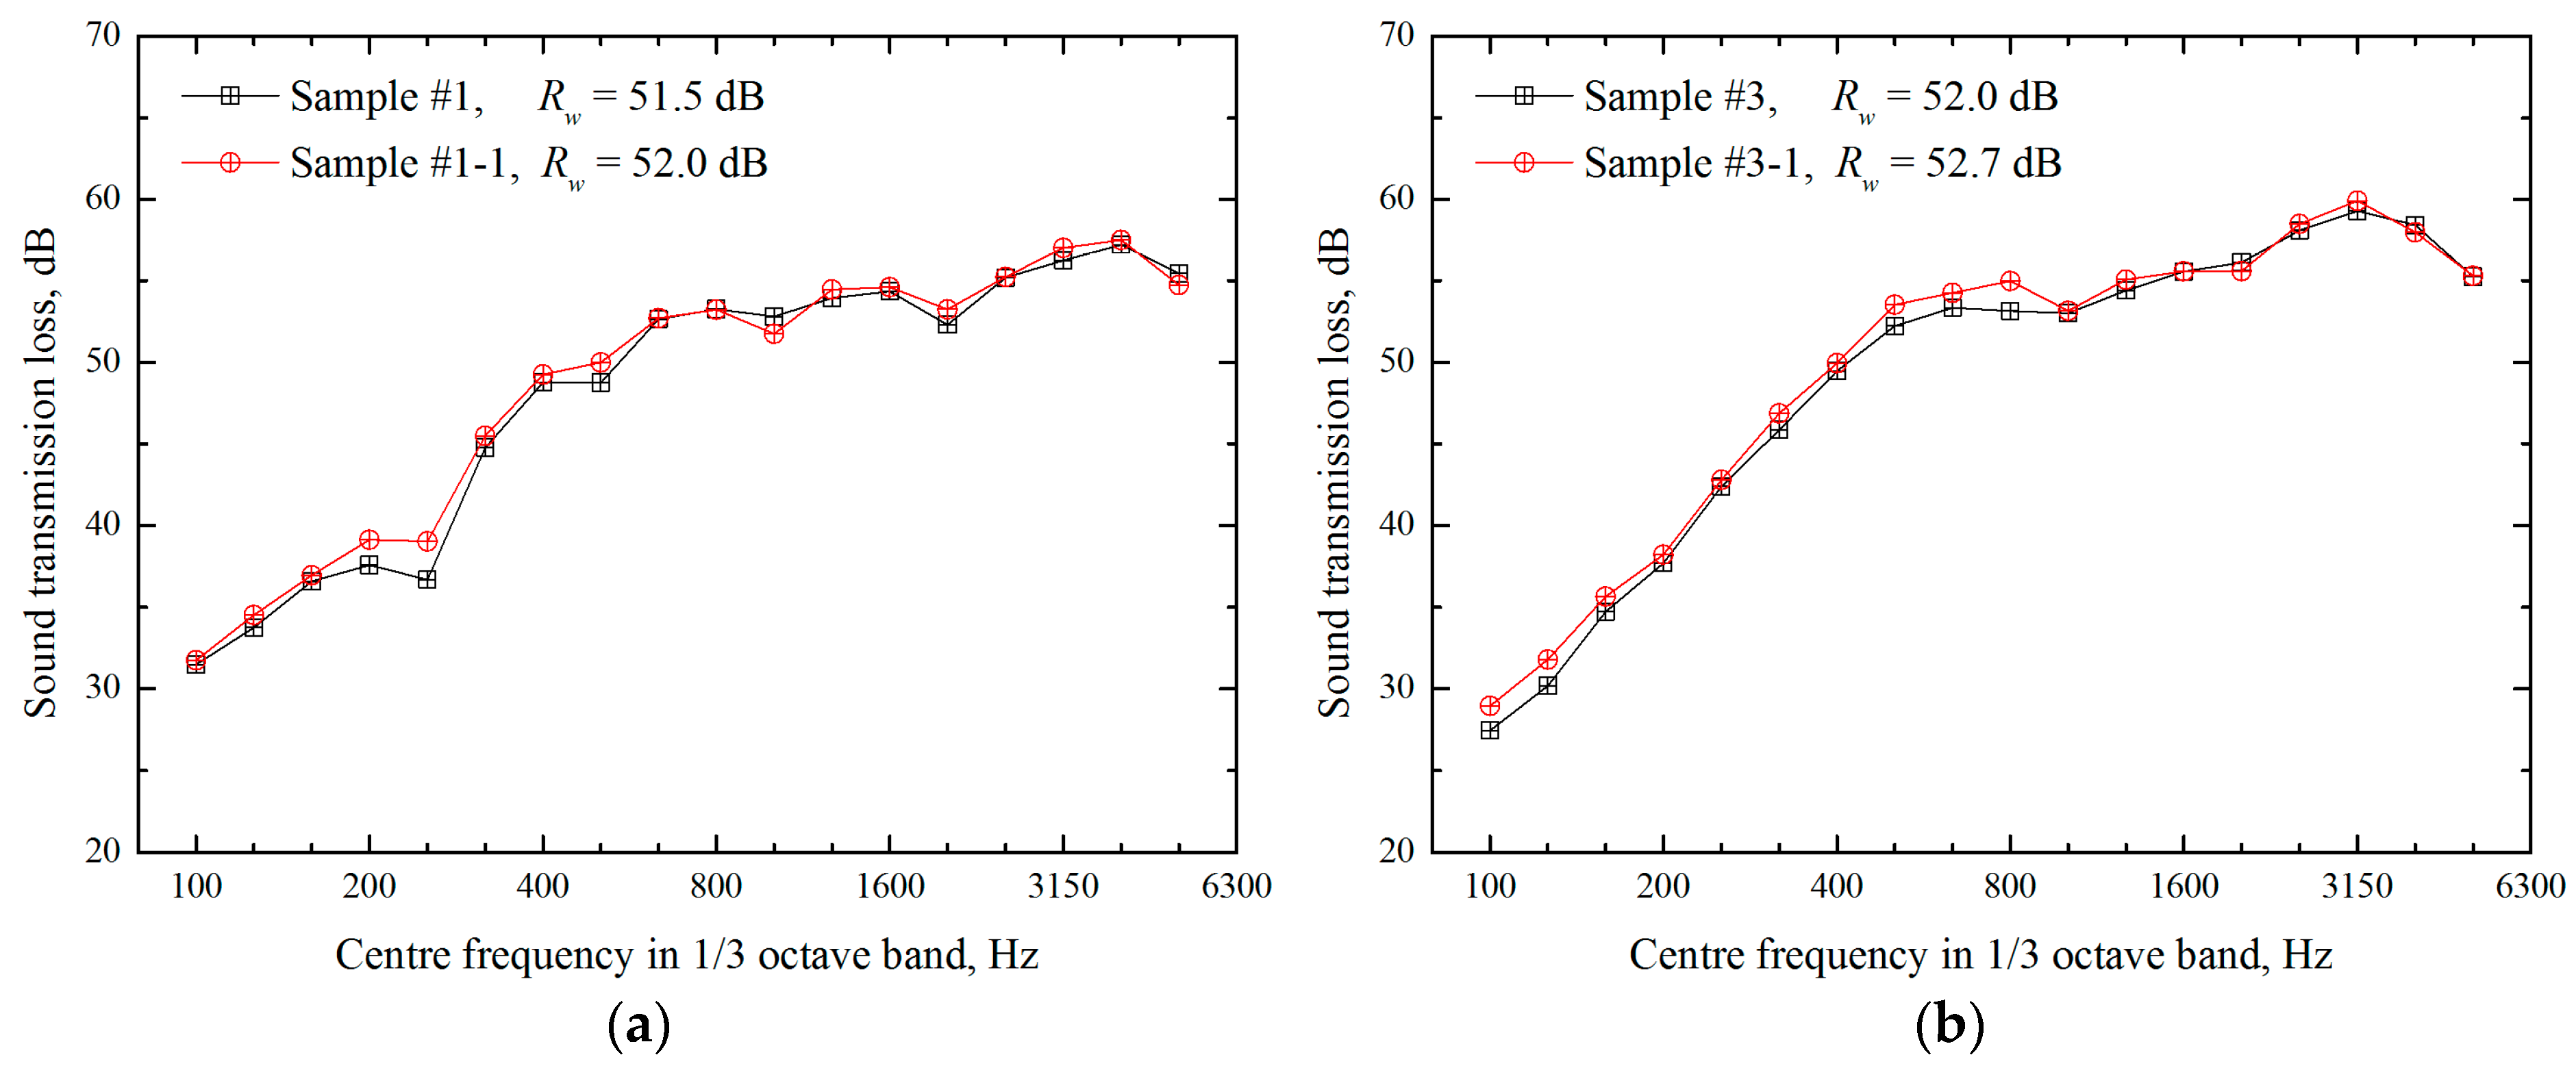
Figure 12 below. As can be seen from
Figure 12a, after sound-absorption layer #1 is replaced with a material with a higher sound absorption coefficient, the sound insulation value in most frequency bands is improved, and the improvement effect is most significant in the middle- and low-frequency bands. The sound insulation near 250 Hz is increased by nearly 3 dB, and the
Rw of the whole floor structure is increased by 0.5 dB. As can be seen from
Figure 12b, after sound-insulation layer #1 is replaced with a material with higher sound insulation capacity, the sound insulation value in most frequency bands is improved, and the improvement effect is the most significant at 100–125 Hz and 500–800 Hz. The increase in these frequency bands is 1.5–2 dB, and the
Rw of the whole floor structure is increased by 0.7 dB.
The experimental verification results show that, according to the results in
Figure 12, the sound insulation optimization of samples #1 and #3 has a good effect, thus verifying the correctness of the results in this paper.
In general, for the composite floor structure of high-speed trains, more attention should be paid to sound-insulation layer #1 and sound-absorption layer #1. The optimization of medium-frequency sound insulation should focus more on sound-insulation layer #1, sound-absorption layer #1, and the damping paste layer, whereas the optimization of high-frequency sound insulation should focus more on sound-insulation layer #1 and the damping slurry layer.
5. Conclusions
This study established a machine learning model for predicting the sound insulation of composite floors in high-speed trains based on data-driven analysis and identified the key factors affecting sound insulation. The following conclusions were drawn:
1. When all material characteristics were considered, the interior panel layer, sound-insulation layer #1, sound-absorption layer #1, damping slurry layer, and aluminum profile layer contributed the most to the sound insulation of the composite floor. The contributions of the sound insulation and surface density of the aluminum profiles and the sound insulation of the interior panels were 8.5%, 7.3%, and 6.9%, respectively.
2. Considering only the core layer material, each sound insulation material had a significant impact on the sound insulation of the composite floor in all frequency bands, particularly sound-insulation layer #1, whose sound insulation contribution exceeded 15% in most frequency bands. The sound-absorbing layer had a significant impact on the sound insulation at medium and low frequencies below 500 Hz, especially sound-absorbing material #1, which contributed more than 15% at 250 Hz and 500 Hz. The damping slurry layer had a significant effect on the high-frequency sound insulation above 1000 Hz, with a sound insulation contribution rate of 20%.
3. To optimize the sound insulation of the composite floor of a high-speed train for low-frequency bands (below 500 Hz), attention should be paid to sound-insulation layer 1# and sound-absorption layer 1#; for medium-frequency bands between 500 and 1000 Hz, attention should be paid to sound-insulation layer 1#, sound-absorption layer 1#, and the damping slurry layer; and for high-frequency bands above 1000 Hz, attention should be paid to sound-insulation layer 1# and the damping slurry layer.


