1. Introduction
The quality and comfort perception in vehicles is strongly influenced by the overall sound quality of the vehicle [
1]. Besides aerodynamic and tire noise, tonal powertrain noise plays an important role, as it can have a strong negative impact on sound quality. The masking noise inside the vehicle, such as wind and tire noise, can possibly prevent tonal noise from being audible.
Therefore, in the context of the NVH development of the electric powertrain, the assessment of the perceptibility of tonal powertrain noise with respect to masking noise in the vehicle interior is essential. With models that evaluate the masking noise inside the vehicle, masking thresholds can be calculated that specify the sound pressure level (SPL, (dB)) of a tonal noise at a certain frequency that can just be heard in the presence of a particular masking noise [
2]. These models help engineers in deriving target level settings for tonal powertrain noise.
A problem that engineers face in the early phase of the development process is that prototype vehicles have increased wind and tire noise, which leads to high masking thresholds. Thereby, powertrain noise that will be audible in the production vehicle might not be heard in the prototype vehicle [
3]. Masking models can be used to predict the perceptibility of powertrain noises in the production vehicle at an early phase of the development process.
Auditory masking strongly depends on the sound pressure level and frequency spectrum of the masking noise [
2]. As Moore and Glasberg [
4] suggested, the human hearing system evaluates sound events in equivalent rectangular bandwidths (ERBs), which also influence masking effects. This process can be represented by auditory filters [
4,
5] that determine the frequency-dependent internal excitation of the human hearing system. These excitation patterns can, for example, be utilized for calculating loudness [
6], from which masking effects can be inferred.
In automotive applications, several methods are based upon loudness calculations. Clapper and Blommer [
3] presented a Masking Perception Analysis Software for tonal level target setting that calculates masking thresholds from loudness evaluations of the masking noise. A method proposed by Frank and Jacobsen [
7] also relies on loudness calculations, from which a Level-Over-Masking score for a certain tone is derived.
Evans et al. [
8], however, use a Tone-in-Band method that applies the theory of “Pure Tone in a Critical Band” by Fastl and Zwicker [
2] in terms of making use of masking-level filter shapes defined by critical bands [
2]. The Tone-in-Band method is used to decide how to best expose individuals to transmission and driveline whines under consideration of the masking noise in a production vehicle [
8].
The masking threshold for broadband, narrowband, and sinusoidal maskers is well investigated [
2,
9,
10]. However, the masking noise in electric vehicles is more complex. Compared to white or pink noise, in the vehicle interior, there is a more complex and fluctuating frequency spectrum, as the noise sources additionally contain nonrandom noise parts. The tire noise, on the one hand, consists of several tire orders caused by the tread pattern, low frequency drumming noise, etc. [
11]; on the other hand, the aerodynamic noise, due to the non-steady aerodynamic conditions, shows a fluctuating loudness and frequency spectrum [
12].
Frank and Jacobsen [
7] performed a jury test on vehicle masking noise to evaluate their method. They assessed the detectability of realistic engine orders with a frequency range of up to 4000 Hz at low, medium, and high driving speeds, with a customized semantic differential from “subjective undetectable” to “painful or destructive”. They used their Level-Over-Masking metric to model the correlation to the jury test results and found an r
2 value of 0.96 [
7]. Evans et al. [
8] ran a jury test, where the subjects increased/decreased the level of a whine in masking noise and subsequently noted the number of dB above a reference whine once it became audible and once it became acceptable. From this, the authors derived target-level settings [
8].
Doleschal et al. [
13] performed a listening test with 16 subjects using a Three-Interval/Three-Alternative-Forced-Choice procedure. They determined the masking threshold of the 24th and 48th electric motor order in artificially generated masking noise of which the frequency spectrum was fitted to vehicle interior noise. The masking threshold was determined in a runup scenario. However, an order that was presented at the level of the masking threshold was not necessarily audible over the whole duration of the signal, as both the frequency spectrum and level of the masker and the frequency of the order changed over time. The authors observed that the perceived magnitude of tonal content increases as the level of the tonal components increases and when an overtone was added [
13].
A masking model used at Mercedes-Benz was originally developed for vehicles with internal combustion engines (ICEs) and calculates masking thresholds as a function of the rotational or driving speed for a specific engine order. This way, the mostly order-based powertrain noise can be assessed as a function of the rotational or driving speed. If the level of a specific engine order exceeds the level of the masking threshold, the respective powertrain noise can be perceived in the vehicle interior. However, the method has been found to work only to a limited extent with electric vehicles, as tonal noise in ICE vehicles only occurs in a smaller and lower frequency range and in more broadband noise due to the ICE [
14].
To be able to further develop the method used to assess tonal powertrain noise, the masking threshold for a wider frequency range in an electric vehicle is determined. With the results generated by human subjects in a listening test, the influence of the masking noise on the masking threshold of electric vehicles can be investigated. In addition, by evaluating the results for different age groups, insights on the perception of different customers can be acquired.
In the listening tests mentioned above, frequencies up to 5000 Hz [
3] or tonal whines from ICEs [
7,
8] have been examined. Additionally, masking noise from vehicles with ICE has been used. For the transfer to electric vehicles, however, the masking threshold inside electric vehicles has to be redetermined experimentally. This is due to the deviating frequency spectrum of the masking noise, the missing masking noise from the ICE at low driving speeds, and the wider frequency range where tonal powertrain noises occur.
Additionally, many listening tests conducted in the context of automotive applications rely on subjective interpretation of annoyance, acceptability, or audibility [
8,
15] and use differing procedures for the determination of the masking threshold [
13] or other masking settings [
10]. The focus on determining the detection threshold without subjective interpretation and the consideration of real-world vehicle interior masking noise is the novelty of this study. The selected sound samples and determination of the masking threshold and the aim of the investigation differ from those of the existing literature.
In recent years, the importance of auditory masking has also arisen in the context of speech intelligibility and the treatment of hearing loss; consequently, much research is conducted in this field [
16,
17,
18,
19]. However, in the context of automotive application, methods regarding the assessment of powertrain noises have differing requirements.
As Doleschal [
13] determined the masking threshold averaged for runup scenarios, it cannot be used to assess powertrain orders as a function of the driving speed or the rotational speed of the engine. In the vehicle development process, it is of great interest to estimate the masking threshold for distinct powertrain orders to be able to assess their perceptibility.
Therefore, listening tests were conducted in this study to gain insight into how the masking noise in electric vehicles affects perceptibility of tonal powertrain noise in the vehicle interior of different subjects and driving speeds and within a frequency range from 200 Hz to 12.8 kHz. This investigation will help to improve target-level settings for powertrain noise under consideration of the frequency- and driving-speed-dependent masking threshold.
2. Methodology
In order to achieve a better understanding of masking phenomena and to gain a better interpretation of calculated masking thresholds by masking models, listening tests were conducted in which the individual masking thresholds of the electric vehicle interior noise of several subjects were determined for various frequencies and driving speeds. Additionally, the absolute threshold of hearing of the subjects was determined.
The methodology of the listening test can be summarized as follows:
Binaural recording of the interior noise of an electric vehicle of the luxury segment on a smooth surface, at constant speeds of 30 km/h, 60 km/h, and 90 km/h;
Creating test samples by adding sine tones with different frequencies and levels to the binaural recordings using MATLAB;
Determination of the masking threshold and the absolute threshold of hearing for seven frequencies between 200 Hz and 12.8 kHz (octave steps), using a 3-Interval/3-Alternative Adaptive-Forced-Choice method (3-AFC) with 20 subjects.
A summary of the investigated masking noise and frequencies can be found in
Table 1.
The investigated frequencies were chosen according to a resonance of a particular powertrain order that is audible in the investigated vehicle. Starting from the frequency of the resonance, the remaining frequencies were selected in octave steps for the lower and higher frequency ranges, as recommended in internationally recognized procedures [
20]. For improved evaluation in the described use case, the frequencies were adjusted as explained above.
In order to cover common driving speeds in urban and rural driving conditions, the investigated driving speeds were defined as 30 km/h, 60 km/h, and 90 km/h. These cover the most relevant speed ranges that are related to the perception of tonal powertrain noise [
21].
2.1. Binaural Recording of the Vehicle Interior Noise
Binaural sound recordings were conducted in an electric vehicle of the luxury segment (series-production vehicle). The mobile measurement system SQuadriga 3 [
22] and the corresponding binaural headset from HEAD-Acoustics [
23] were used for the recording. The measurements were carried out on the driver’s seat while driving on a test track with a smooth surface, at three different constant speeds (30 km/h, 60 km/h, and 90 km/h). Every recording was carried out repeatedly for at least 10 s. This way, samples with the least possible interference with disrupting noise, such as birds or the noise of other passing vehicles, could be chosen.
As the sound field is variable in the vehicle’s interior [
21], the perception of the passengers depends on their ears’ position. Cross-hearing from the opposite ear can influence the masking threshold [
24,
25], which can differ according to the listener’s position. In this study, the masking threshold was investigated for a constant position in the driver’s head area.
In
Figure 1, the frequency spectrum of the measurements in the vehicle interior at the three driving speeds is shown.
It can be seen that the sound pressure of all driving speeds starts at high levels and decreases with rising frequency. The different characteristics of the frequency spectrums can be attributed to the different compositions of the tire noise and the aerodynamic noises of the vehicle. Both noise sources increase with rising driving speed. At low driving speeds, the main noise source comes from the tires, while with rising driving speed, the aerodynamic noises increase and dominate the interior noise at high driving speeds [
12]. Therefore, an increase in the sound pressure level with rising driving speed and differences in the frequency spectrum can be observed.
Additionally, at 30 km/h, a constant sound pressure level can be seen between approx. 700 Hz and 1000 Hz.
2.2. Creating the Test Samples for the Listening Test
In order to use the recordings to determine the masking threshold, artificially generated sine tones were added to the samples containing only wind and tire noise. To achieve this goal, we proceeded as follows:
First, the binaural recordings were equalized to standard microphone recordings. That way, the sine tones could be added without any further equalization. After the equalization, the recordings were exported to wav-format, using the Software Artemis Suite by HEAD-Acoustics. The sine tones were first generated with MATLAB for the frequencies mentioned in
Table 1 and for levels from −10 dB to 85 dB, with a 1 dB interval. Each sine tone was then added separately to the binaural channels of the wav-files containing the masking noise at the three different driving speeds. This way, 2121 samples were created, each of which contained masking noise and one sine tone of a certain frequency and level. Additionally, the sine tones were saved as wav-files without being added to the masking noise to evaluate the absolute threshold of hearing.
Each subject evaluated a fraction of these final samples. The selection was made using a 3-Interval/3-Alternative Adaptive-Forced-Choice Method, which is described in detail in the next section.
2.3. Determining Masking Thresholds
A 3-Interval/3-Alternative Adaptive-Forced-Choice Method was used to determine the masking threshold. With this method, the sensory perception threshold can be determined, and other influences, such as the decision criterion of the subjects, are avoided [
26]. As shown by Stillman, staircase methods work well with inexperienced subjects [
27], and the most efficient method that produces good results is the 3-AFC staircase method [
28,
29,
30]. Overall, 3-AFC methods have successfully been used to determine masking thresholds in the past [
13].
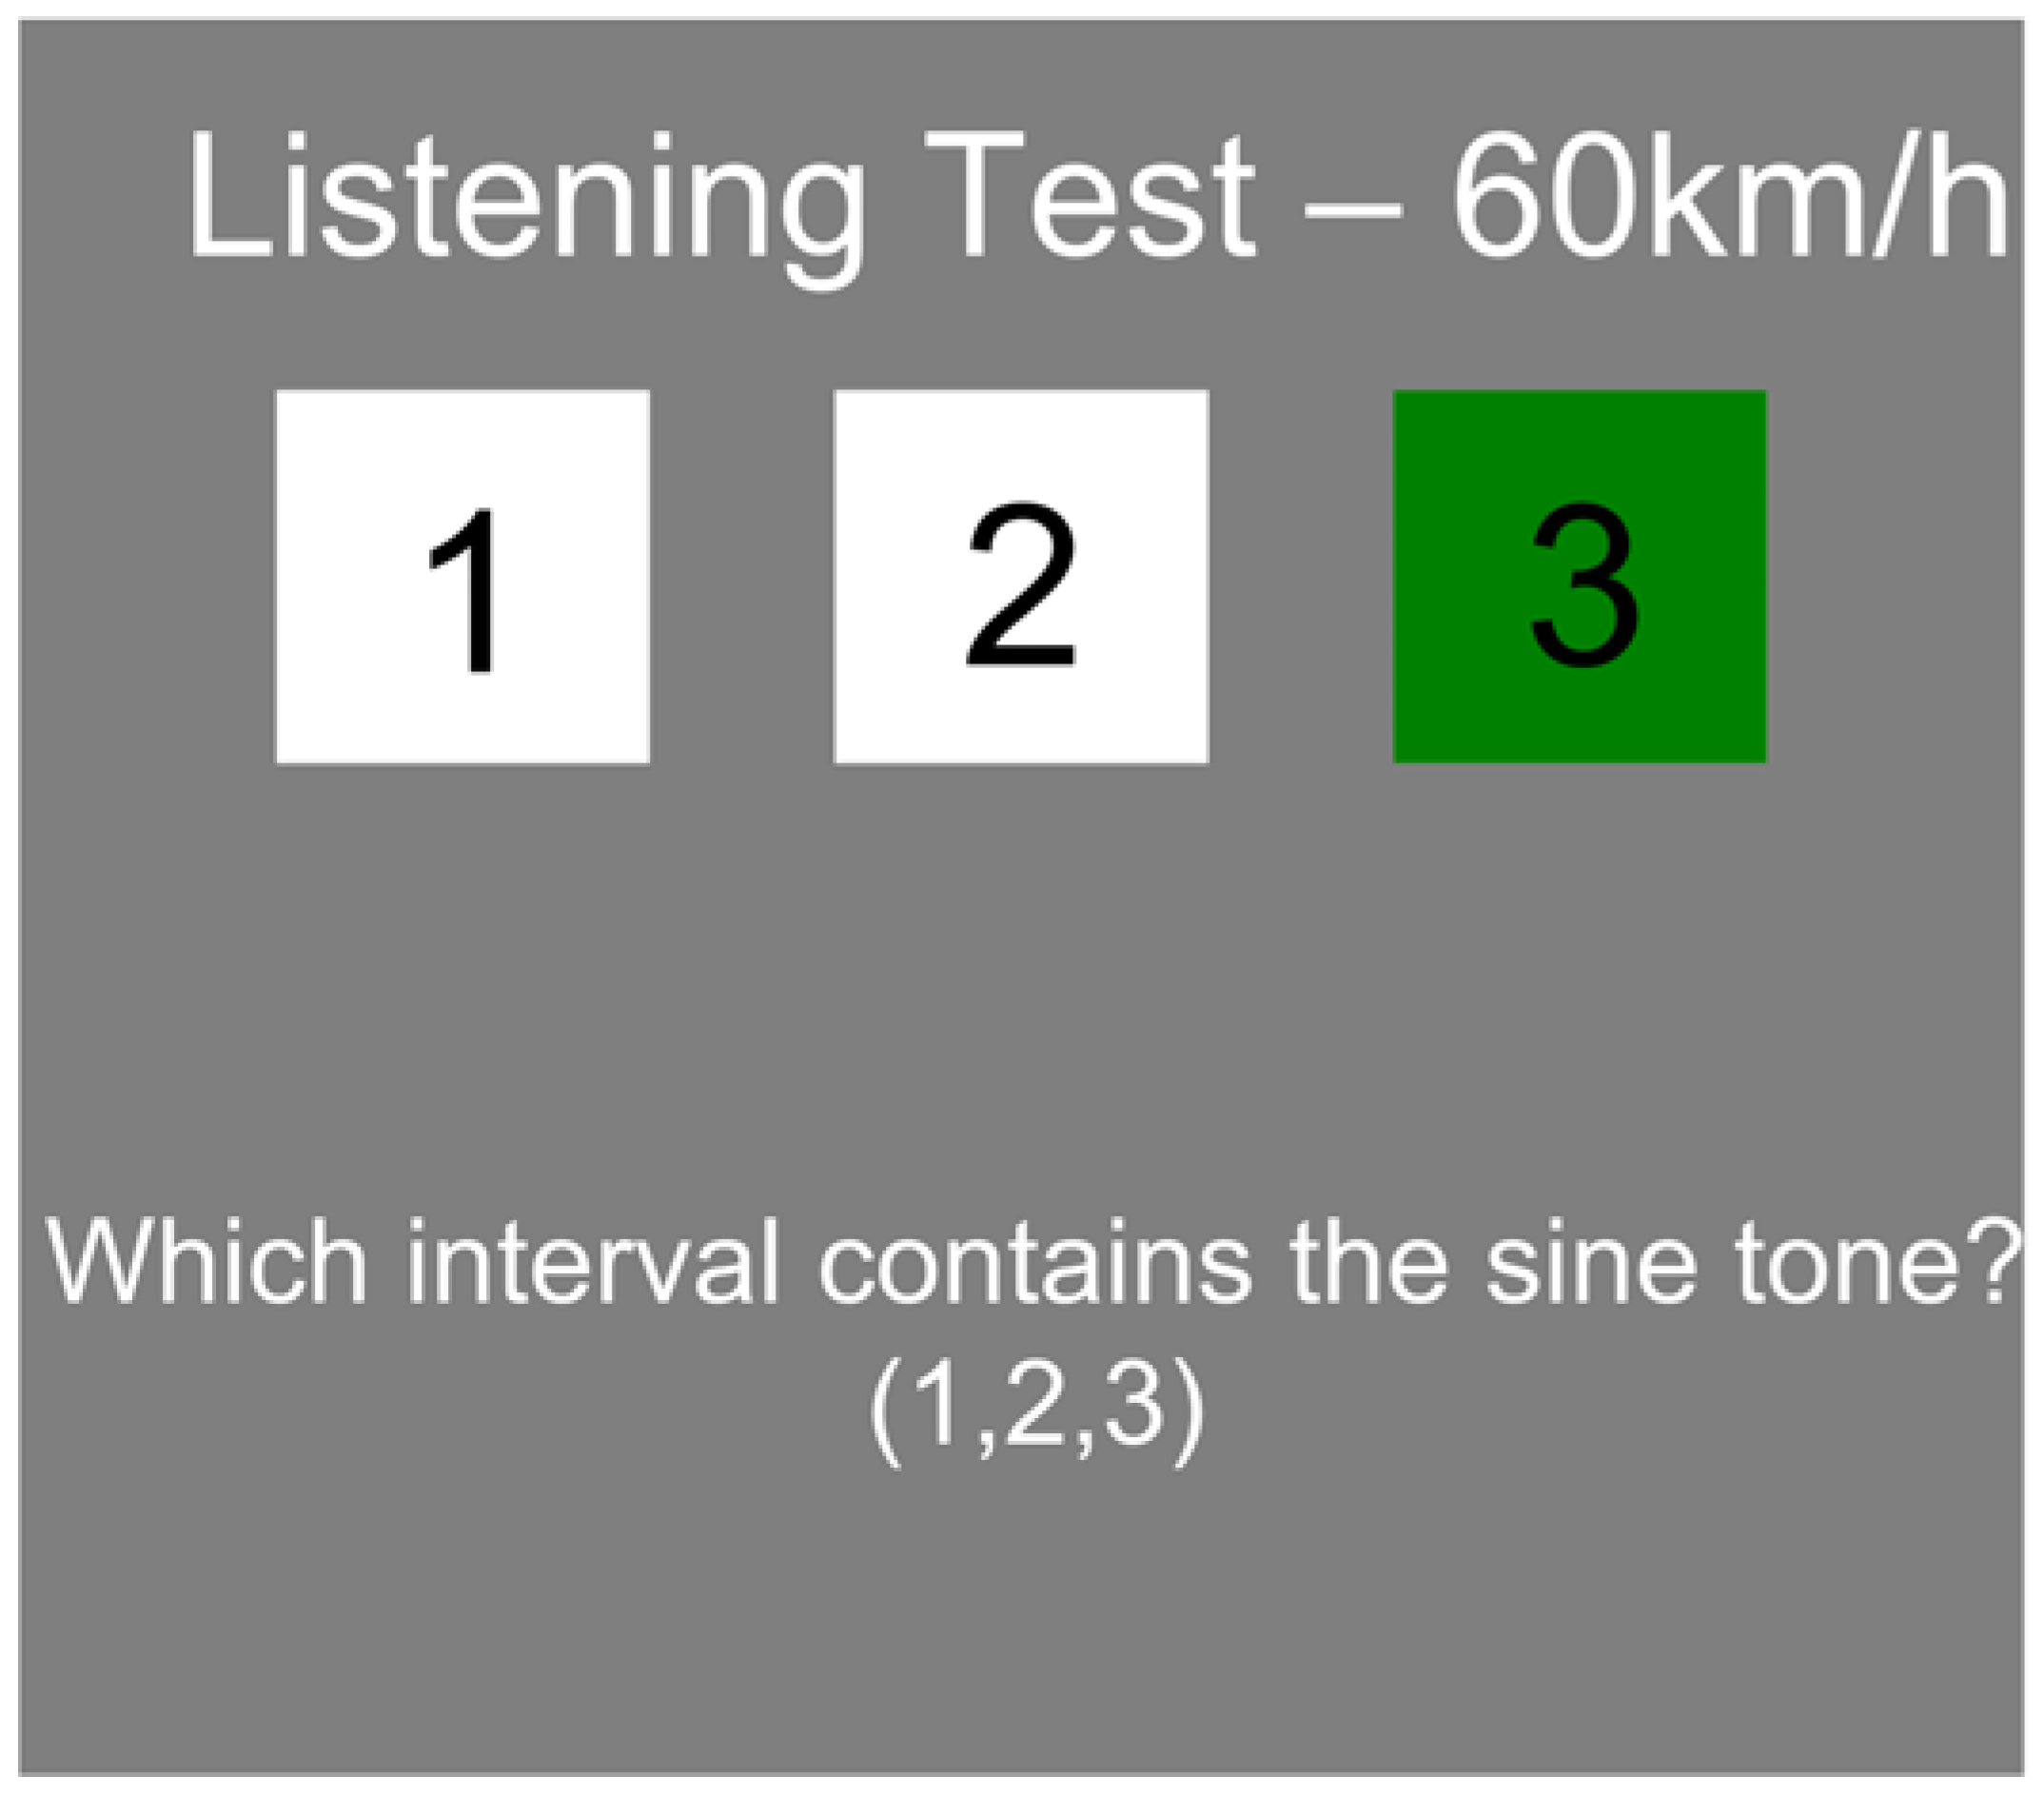
In each trial, the method presents three intervals of sound samples (length of 0.5 s) of which two intervals contain only masking noise and one sample contains masking noise and a sine tone. The interval that contains the sine tone is chosen at random. The subjects’ task is to indicate the interval that contains the sine tone (see
Figure 2). If no sine tone could be detected, the subjects were asked to guess. If two consecutive answers were correctly indicated, the sine level in the next trial was decreased; if an answer was wrong, the level was increased (1-up/2-down procedure). This way, the determined threshold corresponds to the level that is detected with a probability of ~56% [
31].
For each combination of masker and tested frequency, the run starts with a sine tone level that we assumed most subjects should be able to hear. For the selection of the starting value, the masking threshold that was determined by the existing method and subjective assessment of the author was considered. The step sizes were 8 dB, 5 dB, 3 dB, 2 dB, and 1 dB. After each reversal, the step size was reduced to the next value.
The listening test was conducted with 20 subjects between 23 and 56 years of age (mean 39); 17 were male, and 3 were female. The age distribution of the subjects is shown in
Figure 3.
All subjects worked in the scope of powertrain NVH and had normal hearing abilities according to their age. The test procedure and the graphic user interface was programmed using PsychoPy [
32] and was presented to the subjects, using a Notebook with external monitor and a LabP2 Equalizer from HEAD-Acoustics with calibrated HEAD-Acoustics HD VIII headphones in an acoustic studio. This way, an aurally correct playback was ensured.
Figure 4 shows the listening test setup.
On the monitor, the subjects could see three numbered squares that symbolize the three intervals that are played consecutively in the order of one, two, and three during each trial (see
Figure 2). While the intervals are played, the respective square is highlighted in a green color in order to help the subjects to visually identify the corresponding interval that is played at that moment (see
Figure 2). The subjects entered their desired answer via a keyboard. No immediate feedback was given as to whether the answer was correct or incorrect. The subjects had no possibility to rehear the intervals.
The test started with a brief explanation of the test procedure and an example in order to familiarize the subjects with the procedure and how to operate the program. First, the absolute threshold of hearing was determined, followed by the masking threshold at 30 km/h, 60 km/h, and 90 km/h. The subjects were able to have a break after determining the absolute threshold of hearing and after each masking noise. The entire listening test took approximately 45 min.
To determine the absolute threshold of hearing, the same procedure as for the masking noise was used, except no masking noise was present in the test samples. Because the equipment used was the same that was used for the masking thresholds, the determined absolute threshold of hearing cannot be compared to those determined with clinical audiology equipment.
For the masking threshold, the frequencies were tested in random order (interleaved).
2.4. Evaluation of the Test Data
To evaluate the listening test data, first the masking threshold of each individual subject was determined, followed by considering all individual masking thresholds of the subjects to determine the overall masking threshold of all subjects combined. The procedure used can be summarized as follows:
Identification of the reversal points of the presented sine tone levels of the 3-AFC test for each examined frequency;
Calculation of the arithmetic mean of the sine levels at the reversal points for each examined frequency;
Calculating the arithmetic mean of the masking thresholds of all individual subjects for each examined frequency.
This procedure is illustrated in
Figure 5.
Figure 5a shows the trial for one frequency of one subject with masking noise at 30 km/h. The circles indicate the level of the sine tone. Filled circles state that the subject correctly specified the interval that contains the sine tone, and empty circles indicate a wrong answer by the subject. Additionally, the reversal points of the sine tone levels are marked, which were calculated with MATLAB.
The masking threshold of the subject at the respective frequency was then defined as the arithmetic mean of the sine tone levels at the reversal points of the trial. In this way, the test data were evaluated for all investigated masking noises and frequencies.
Figure 5 b shows the trial data of a subject of the masking noise at 30 km/h for all investigated frequencies and shows the sine tone reversal points’ arithmetic mean, which is defined as the determined masking threshold.
3. Results
The listening tests described in
Section 2 were conducted to achieve a better understanding of the masking effects in the interior of electric vehicles. In order to obtain an insight into the results of the listening test data,
Figure 6 shows the assessed masking threshold for the investigated driving speeds at each investigated frequency of every considered subject (empty circles), the arithmetic mean of the masking thresholds of all subjects at each investigated frequency (filled circles), and the standard deviation of the assessed masking thresholds at each frequency. The results are explained exemplarily for the data at 30 km/h.
The data show that the arithmetic mean of the subjects’ masking thresholds starts at high levels for low frequencies and decays with rising frequency until it reaches its lowest level at 3200 Hz. While the detection threshold at 6400 Hz is at a similar value as at 3200 Hz, the masking threshold at 12,800 Hz is at a higher level again. The variation of the masking thresholds between the subjects at low frequencies is comparatively low, at approx. 10 dB, but rises with increasing frequency. At 12,800 Hz, the variability between the highest and the lowest value is up to 60 dB, which indicates differing hearing abilities between the subjects. The data for the masking noise at 60 km/h and 90 km/h show similar behavior, except the frequency where the masking threshold reaches its minimum differs. This issue is addressed in the following.
Figure 7 shows the arithmetic mean of the masking threshold of all subjects for the three investigated driving speeds (30 km/h, 60 km/h, and 90 km/h). Additionally, the arithmetic mean of the absolute threshold of hearing of the subjects is shown.
For every examined frequency, the masking threshold at 30 km/h is the lowest and rises with the increasing driving speed. The big gest increase in the masking threshold among the investigated driving speeds can be observed between 200 Hz and 3200 Hz. At higher frequencies, no significant difference between the masking thresholds of the examined driving speeds is apparent. From 30 km/h to 60 km/h, the biggest increase in the masking threshold is at 1600 Hz, while the biggest increase from 60 km/h to 90 km/h is at 3200 Hz.
The data show that there is no significant difference between the absolute hearing threshold in quiet and the masking threshold at all three investigated driving speeds for frequencies at and above 6400 Hz. In this frequency range, no influence of the wind and tire noise on the masking threshold can be detected. It can be hypothesized that, apart from the influence of external factors (such as wind and tire noise), internal factors pertaining to the subjects (such as age) could also play a role. Therefore, the results were analyzed for different age groups.
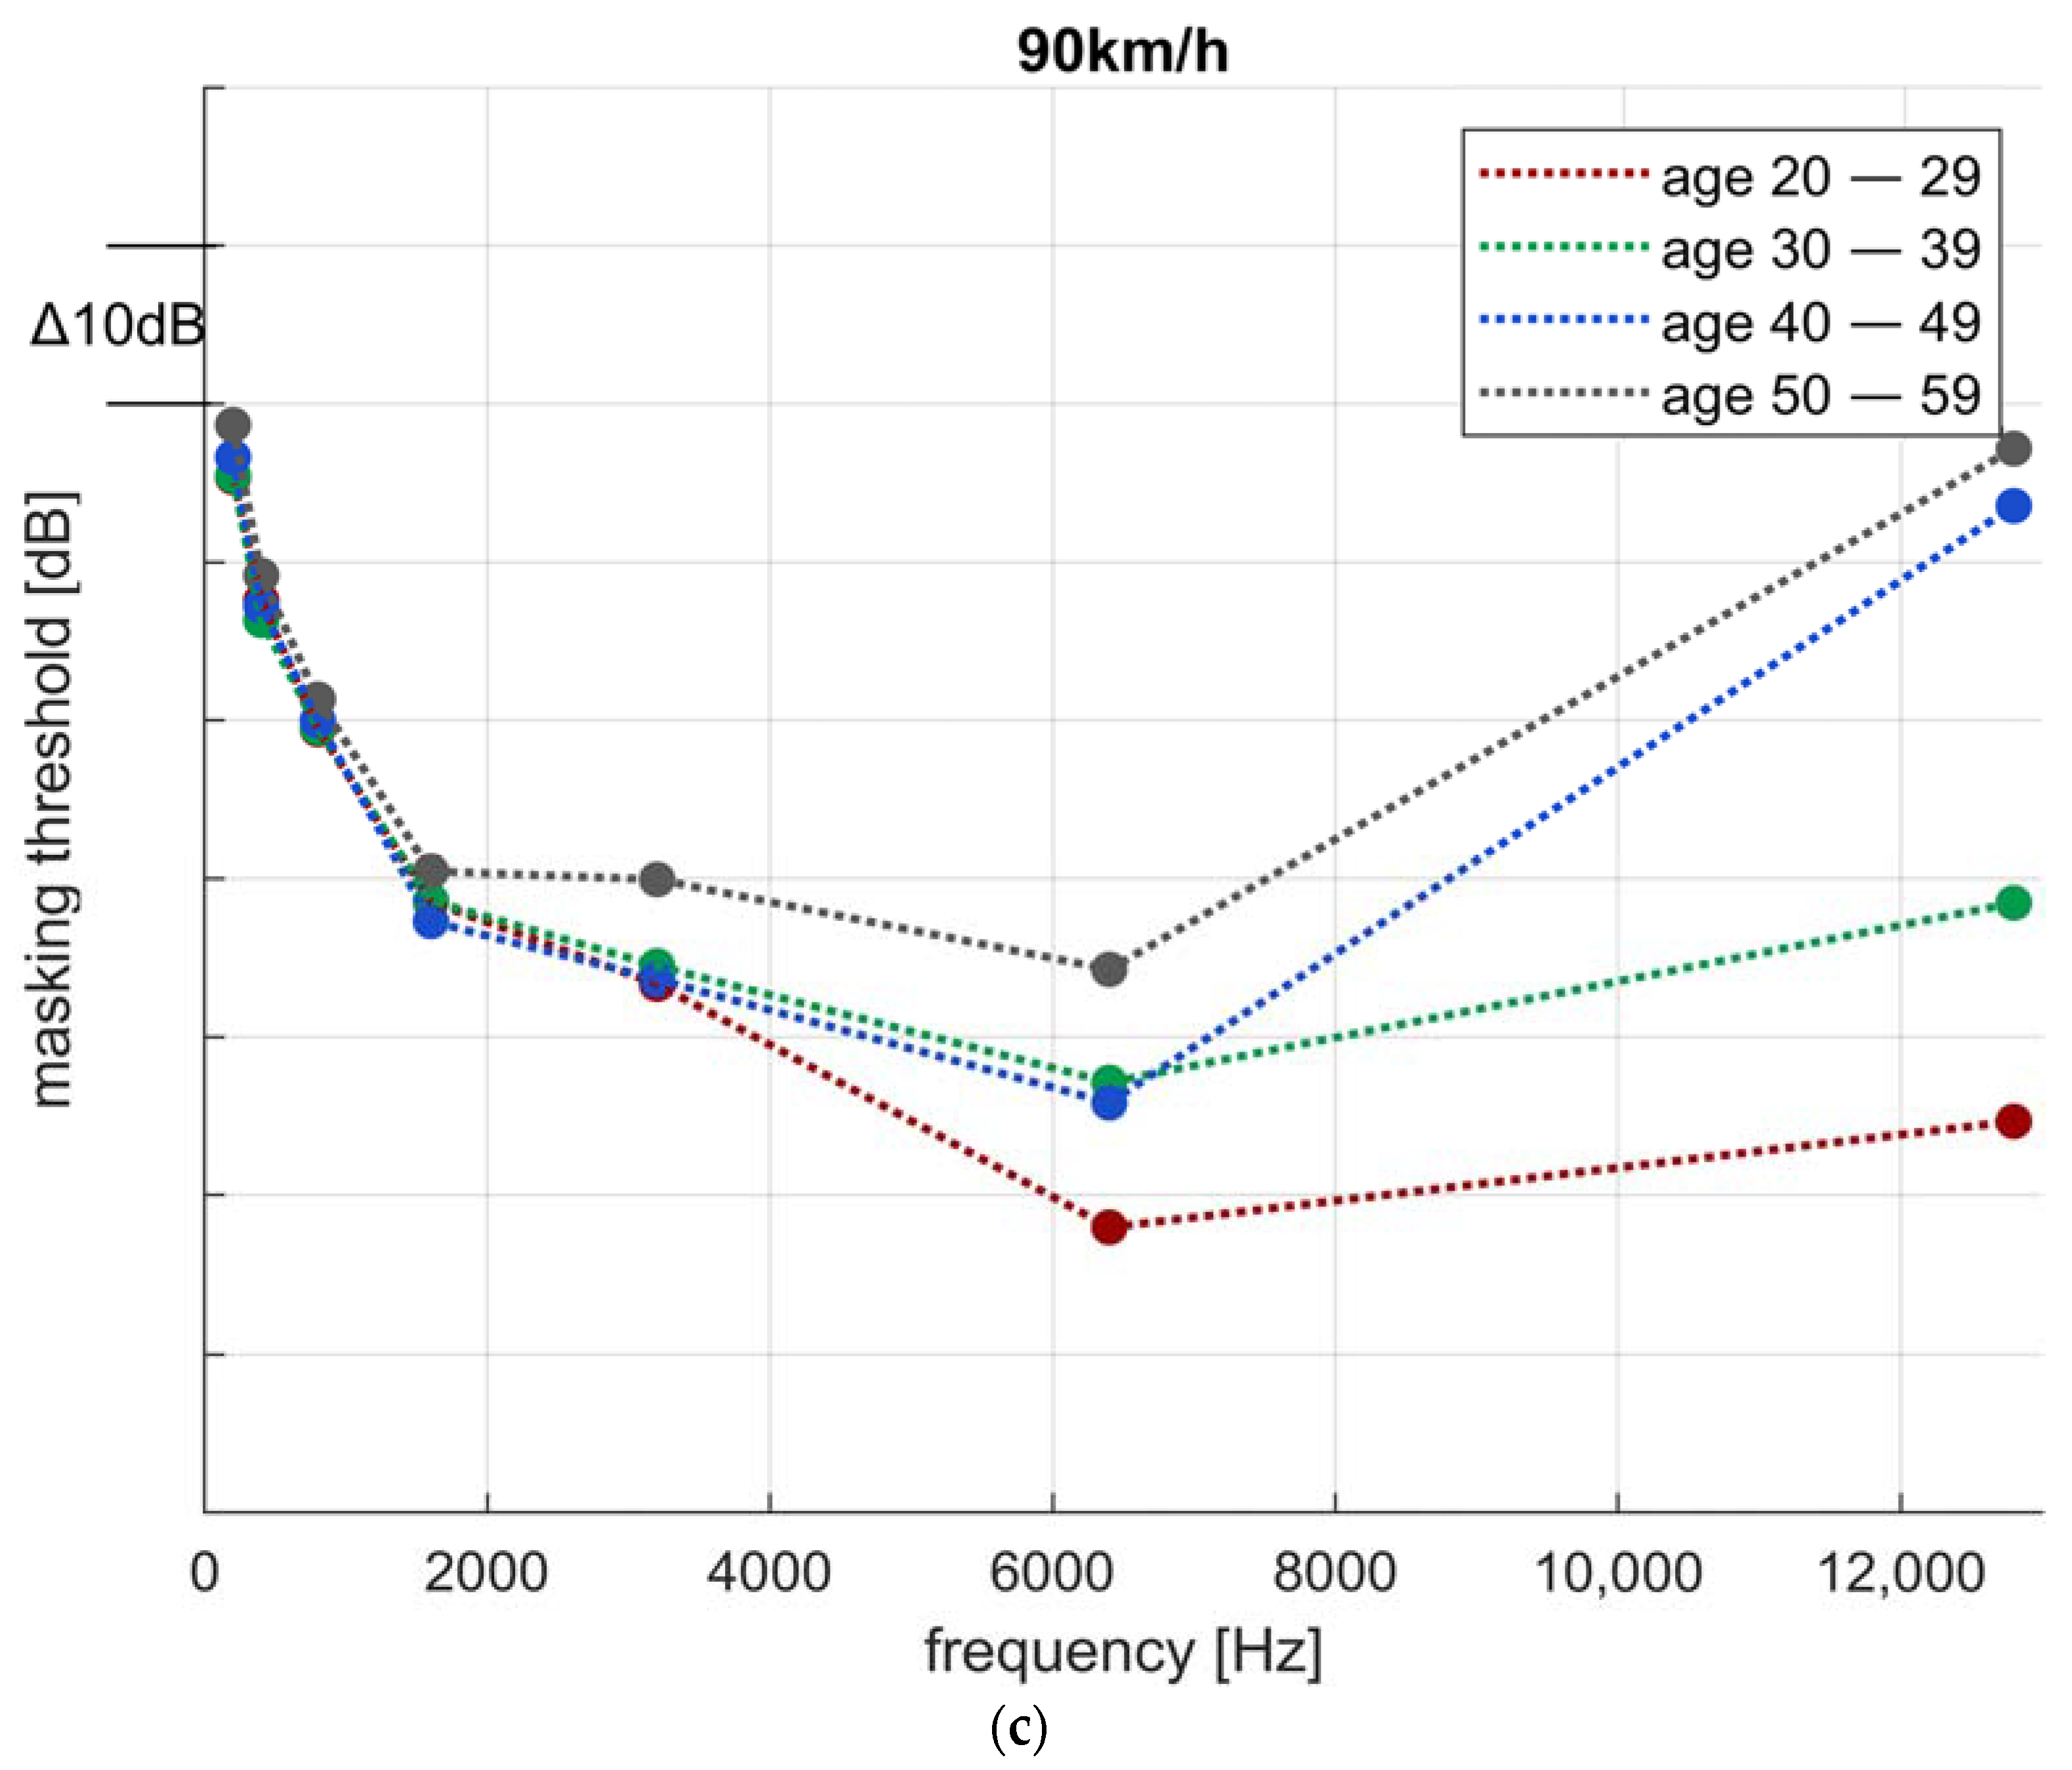
Figure 8 shows the determined masking thresholds for four different age groups of the subjects for the investigated driving speeds. The observations are explained exemplarily for the data at 60 km/h.
The results show that, at low frequencies up until 1600 Hz, where the masking noise is dominating the detection threshold, no significant difference between the evaluated age groups can be detected. With increasing frequency, however, the evaluated detection threshold is highly dependent on the age of the subjects. That can be seen by a significantly increased variability between age groups, with the youngest group showing the lowest threshold and the older groups, accordingly, showing higher thresholds. In order to detect the tone, significantly higher levels were needed for the age groups of 40–49 and 50–59 than for the younger subjects.
4. Discussion
Based on the listening tests conducted in this study, the aim was to gain insight into how the masking noise in the interior of electric vehicles affects the passengers’ perception of tonal powertrain noise.
The combination of wind and tire noise in the vehicle interior leads to high sound pressure levels especially in the lower frequency range (see
Figure 1). The resulting masking effect on tonal powertrain noise can be observed in the results of the listening test conducted in this study. The data show that the masking threshold is strongly influenced by the masking noise in the vehicle interior up until 6400 Hz in the investigated driving speed range. The high sound pressure levels of the wind and tire noise in the vehicle interior lead to high masking thresholds at low frequencies. With increasing frequency, the influence of the masking noise decreases, causing lower masking thresholds. With a further increasing frequency, the detection threshold is mainly influenced by the individual absolute hearing threshold of the subjects, leading to higher detection thresholds again. This phenomenon is discussed in more detail later.
As described in
Section 3, the masking threshold is the lowest for the wind and tire noise at 30 km/h for all investigated frequencies and rises with increasing driving speed. Depending on the driving speed, an increase in speed affects different frequency ranges. From 30 km/h to 60 km/h, the biggest increase in masking threshold is at 1600 Hz, while the biggest increase from 60 km/h to 90 km/h is at 3200 Hz. Therefore, a higher driving speed does not only increase the level of the masking threshold but also its spectral distribution. This circumstance can be explained with the change in the frequency spectrum of the masking noise (see also
Figure 1). At higher velocities, the tread orders of the tire noise rise in frequency, hence the sound pressure level at higher frequencies increases, which leads to higher masking thresholds. Additionally, the level of the wind noise increases with rising driving speed, causing the masking threshold to rise above the absolute threshold of hearing at higher frequencies, thus the masking effect becomes effective.
Above 6400 Hz, however, the data show no significant difference between the detection thresholds among the investigated driving speeds. That leads to the assumption that there is no influence on the detection threshold of tonal noise by the wind and tire noise and that only the individual absolute threshold of hearing of the subjects is in effect. This can be confirmed by the absolute threshold of hearing of the subjects, as shown in
Figure 7. No significant difference between the determined detection thresholds can be observed whether or not the masking noise is present. Hence, for all investigated driving speeds, only the absolute threshold of hearing is relevant for frequencies at and above 6400 Hz. As the absolute threshold in quiet highly differs between individuals [
33], high scattering of the listening test data can be observed for high frequencies.
The determined absolute threshold of hearing is higher compared to the one denoted in, for example, DIN ISO 226 [
34], which can be attributed to the age structure of the subjects that participated in the listening test. While the mean age of the listening test was 39 years, the absolute threshold of hearing in DIN ISO 226 is specified for 18–25-year-olds. Especially at high frequencies, the absolute threshold of hearing rises strongly with age [
33], leading to a higher threshold assessed in the listening test.
This circumstance can also be observed in the data of this study. As shown above, the detection threshold of tonal noises is highly dependent on age for frequencies above 1600 Hz. Therefore, at frequencies where only the absolute threshold of hearing is effective, the determined detection threshold is highly dependent on the individual passengers’ hearing abilities.
Compared to vehicles with an internal combustion engine, tonal powertrain noise in electric vehicles reaches higher frequencies. As can be seen from the results in this study, the detection threshold in electric vehicles shows a high variability between individuals due to varying absolute hearing thresholds. Traditional target level setting methods that only consider the masking effect are, thus, no longer sufficient. In order to identify target levels for specific powertrain orders, the high variability of the detection threshold should be considered in the vehicle development process. Due to the greatly varying threshold between age groups, customers of different ages will have differing demands on tonal powertrain noises. In terms of deriving target levels for tonal powertrain noises, instead of a specific value, it could be advantageous to define a detection threshold band considering a certain form of tolerance that also takes varying hearing abilities into account. This allows us to evaluate target levels for different customer groups.
In addition to the audibility assessment, a quality score can be included in the target level definition of powertrain orders.
5. Conclusions and Outlook
The listening test conducted in this study showed that masking thresholds in electric vehicles are speed dependent and strongly differ at high frequencies between subjects. The aim of this study, as compared to that of other works [
8,
10,
13,
15], was to assess the masking threshold for distinct frequencies in the presence of real-world vehicle interior masking noise. It could be seen that, up to a 90 km/h driving speed, the masking wind and tire noise affects frequencies up until 6400 Hz, leading to a masking threshold greater than the absolute threshold of hearing. At higher frequencies, however, only the absolute threshold of hearing is relevant. Due to the decreasing hearing ability of high frequencies with rising age, the ability to perceive tonal noise strongly differs between subjects, leading to high fluctuations in the determined detection threshold. Therefore, future methods for evaluating the perceptibility of tonal powertrain noise should not only consider the masking wind and tire noise but should also take the audibility threshold and its age dependency into account. That way, the evaluation of tonal powertrain noise will be more robust, and realistic target level settings can be derived. By considering the varying hearing ability of different age groups, tonal noise target settings according to different customer groups can be defined in the future. The findings of this study will help improve methods that help engineers to determine target levels for tonal powertrain orders in the vehicle interior.
The determined masking thresholds in this study are, in general, in line with the results of other works [
13]; however, due to the differing signals, masker and maskee signals, the comparability of the findings is not fully given.
In order to further support the findings of this study and gain more insight into the interindividual perceptibility of powertrain noises, it will be helpful to conduct the listening test with more subjects and a customized age distribution.
Since, up until now, the masking threshold was determined with binaural recordings that have been conducted at a constant position in the driver’s head area, the influence of different positions of the listener and the related sound absorption and reflection effects can be investigated, as cross-hearing from the opposite ear can influence the masking threshold [
24,
25].


