Article

GIS Based Road Traffic Noise Mapping and Assessment of Health Hazards for a Developing Urban Intersection

1
Geoinformatics Lab, Department of Computer Science and Engineering, Rajiv Gandhi Institute of Petroleum Technology, Amethi 229304, India
2
Department of Chemical and Biochemical Engineering, Rajiv Gandhi Institute of Petroleum Technology, Amethi 229304, India
3
Department of Chemical and Biomolecular Engineering, University of Houston, Houston, TX 77204, USA
*
Author to whom correspondence should be addressed.
These authors contributed equally to this work.
Acoustics 2023, 5(1), 87-119; https://doi.org/10.3390/acoustics5010006
Submission received: 31 August 2022 / Revised: 23 November 2022 / Accepted: 5 December 2022 / Published: 13 January 2023
(This article belongs to the Special Issue Vibration and Noise)

Abstract

:
Determination of health hazards of noise pollution is a challenge for any developing city intersection. The people working at roadside open-air shops or near the congested roads of any intersection face intense noise pollution. It becomes very difficult to efficiently determine the hazards of noise on the health of people living near the intersection. An attempt was made to determine the noise-induced health hazards of the developing city of Bahadurpur, UP, India. The noise levels were monitored over 17 station points of the intersection for three months at different times of the day. Equivalent noise level (Leq) maps were determined within an accuracy of ±4dB. Areas adjacent to intersections indicated noise exposure levels close to 100 dB. Health hazards for the people of the intersection were determined through the testing of auditory and non-auditory health parameters for 100 people. A total of 75–92% of the people who work/live near the noisy intersection were found to be suffering from hearing impairment, tinnitus, sleep disturbance, cardiovascular diseases, hypertension, etc. Whether the recorded health hazards were indeed related to noise exposure was confirmed by testing the health parameters of people from the nearby and less noisy area of Pure Ganga. The nearby site reported mild hazards to the health of the population. An alarming level of hearing impairment was prevalent in the noisy Bahadurpur intersection (79–95%) compared to the same in Pure Ganga (13–30%). The estimated noise-induced health hazards were also compared for noisy and less-noisy study sites using ANOVA statistics. The results suggested that the health hazards reported in the two sites are not similar. Further, the severe hazards to people’s health at the underdeveloped intersection were found to be primarily caused by the intense exposure to noise.

1. Introduction

Noise Pollution in developing cities: Noise pollution is a menace in cities. Noise pollution is dynamic in nature and variation in traffic loads is a factor that influences the level of noise pollution in a particular area. Beeping or honking also brings a significant incremental change in noise levels. Researchers found the noise levels elevated from 2 to 13 dB [1,2] during honking. Beeping has become a widespread occurrence in India, particularly at congested road intersections. The congestion increases manyfold due to unlicensed camping (temporary shops at the edges of the road) on major thoroughfares [3,4]. Due to this congestion, the traffic levels greatly increase, and this tempts the drivers to honk more which, in turn, causes noise pollution.
The developing city intersection conforms in many ways to a hazardous area for noise pollution. In under-developed cities, often the city builds around road intersections. Intersections of national highways, state highways, or two-state highways are the prime areas around which a city builds up. The roads and crossroads (intersections) are associated with less control over traffic and multiple vehicles of varying speeds frequently run at similar times on the roads. The congestions at city intersections keep on increasing with growing establishments around the intersections. The authorities of several such unplanned cities also allow the establishment of schools, health centers, shops, sports centers, roadside open markets, etc. around the intersections, which results congestion. People living near such intersections experience loud noise throughout the day which affects people’s health. Very few studies have highlighted the importance of relating decibel levels to human health deterioration, so it becomes an important topic to study. Apart from suggesting a model to map the noise level in a particular area, the authors have tried to relate it to levels of noise exposure and determine the associated health hazards [5].
Health Hazards of Noise Pollution: Severe noise pollution can cause detrimental effects on one’s health as it influences everyday activities (sleep, speech, and work). Further, irritation, cognitive disability, dementia, cardiovascular disorders, as well as respiratory problems have been found to be caused by ambient noise exposure [6]. Numerous studies have been undertaken in the past to examine noise emissions as well as their influence on human wellbeing [7]. According to recent research by the World Health Organization (WHO), 466 million individuals worldwide suffer from debilitating hearing loss, with the number expected to rise to 900 million by 2050, or one in every ten people [8]. The cumulative disability-adjusted life years lost in European nations owing to ambient noise is anticipated to somehow be 1.6 million [9]. Traffic noise is the main source of the noise-induced health problems. As per the literature, [10] greater than 85 dB noise levels for 8 h in a working environment leads to noise-induced health problems. Noise exposure can cause two kinds of health effects: non-auditory and auditory. The former type includes stress, physiological and behavioral effects, and safety concerns, while auditory effects include hearing impairment resulting from excessive noise exposure. Noise-induced hearing loss (NIHL) is the main concern related to occupational noise exposure [11]. Non-auditory effects include sleep disturbances. Uninterrupted sleep is known to be a prerequisite for good physiological and mental functioning of healthy people [7]. It is reported that 80-90% of cases of sleep disturbance originate from noisy environments [12]. Cardiovascular diseases, stress, and annoyance are some examples of non-auditory effects. (Further literature on health hazards is included in the Supplementary Materials).
Noise Characterization and Noise Exposure Mapping: The authors realized the need for accurate characterization of noise levels around noisy road intersections. Noise levels vary over various locations with time [13,14]. Generally, noise levels are monitored at various locations and at different times [15]. It is not possible to monitor the noise levels for every location and throughout all the days. The sampled noise levels of these monitored points are used to predict the noise levels of neighboring locations (for which no noise data are recorded) using the technique of noise modeling [16,17]. The predicted levels are then showcased over a map (termed a noise map), which indicates spatial variation in noise levels. These maps can indicate the hotspots for noise and areas of less noise or silence, and thus, these can be used for noise management planning. Based on a survey of the literature, authors found that there are many works related to noise mapping based on GIS mapping [18,19]. Regional road traffic noise management strategy was coined under RRTNMS [20]. Under this plan, the road was graded based on the expected sound pressure level. Further, various control methods were adopted based on the ranking’s results [21,22]. After the publication of the Environmental Noise Directive-END2002, new initiatives were taken over computing models for efficient noise mapping and frequent upgradation of maps [5,23]. Software such as RLS-90, FHWA, as well as CoRTN in Sound PLAN is used frequently for noise mapping purposes. The Sound Propagation Retardation technique was used for traffic noise prediction modeling by some researchers [2]. Scores of countries have established vehicle noise emissions standards and regulations to reduce road traffic noise levels [24,25]. The Ministry of Environment, Forest, as well as Climate Change of the Government of India released the noise pollution (regulation as well as control) laws in the year 2000. The Ministry directs the state governments to designate the region into silent, domestic, commercial, and industrialized regions, as per this guideline. The ‘A’ weighted noise limitations in the industrial zone are 75/70 dB (A) throughout the day/night, followed by 65/55 dB (A) in commercial, 55/45 dB (A) in residential, and 50/40 dB (A) in the quiet zone. Noise mapping can help when designing urban highways and assessing current traffic noise levels [26,27] The noise indicators such as Leq, L10, L50, L90, are the other indicators sometimes used to indicate noise levels. Different governments use these indicators to anticipate sound intensity [20,28,29] at important road intersections [28]. All this necessitates the generation of noise maps for city intersections to indicate noise levels, hotspots, and estimate the primary locations of noise sources [30,31].
Linking noise exposure levels to health hazards of intersection: In a developing city intersection, the characteristics of noise levels can be very different. Congested unorganized intersections experience intense noise levels throughout the day. Poor shopkeepers and temporary workers often need to spend around 10 h daily in the intersection for their living. These dwellers are exposed to intense levels of traffic noises as they work almost at the edge of the road. It was required to identify the extent of noise exposure of the dwellers in the noisy corridor. It was also required to relate the noise exposure to the health hazards of the dwellers. The types of health hazards and the extent of impacts were required to be determined. Previous studies on noise mapping were limited to the identification of the hotspots of noise pollution in a city environment. The successful identification of hotspots can only indicate the alarming zones in a city where, if people are working or living for a prolonged duration, their health can be harmed. It is thus required to estimate the characteristics of noise exposure to dwellers working near intersections. The noise characterization requires sampling of noise levels and the generation of a noise map using noise modeling. Once noise levels and exposure durations are estimated accurately, they can be utilized to predict the noise exposure map for the intersection. The information on the health parameters of dwellers working near the intersection can then be related to the impact of noise on health.
The entire objectives were attempted to be addressed in three stages, that is, (a) developing of a noise map to estimate the levels of noises generated at the intersection, (b) estimating the levels of noise exposure at the intersection for the dwellers, and (c) estimating the hazards concerning the health of the dwellers, which includes the estimation of hearing impairment as well as psychological and physiological damage.
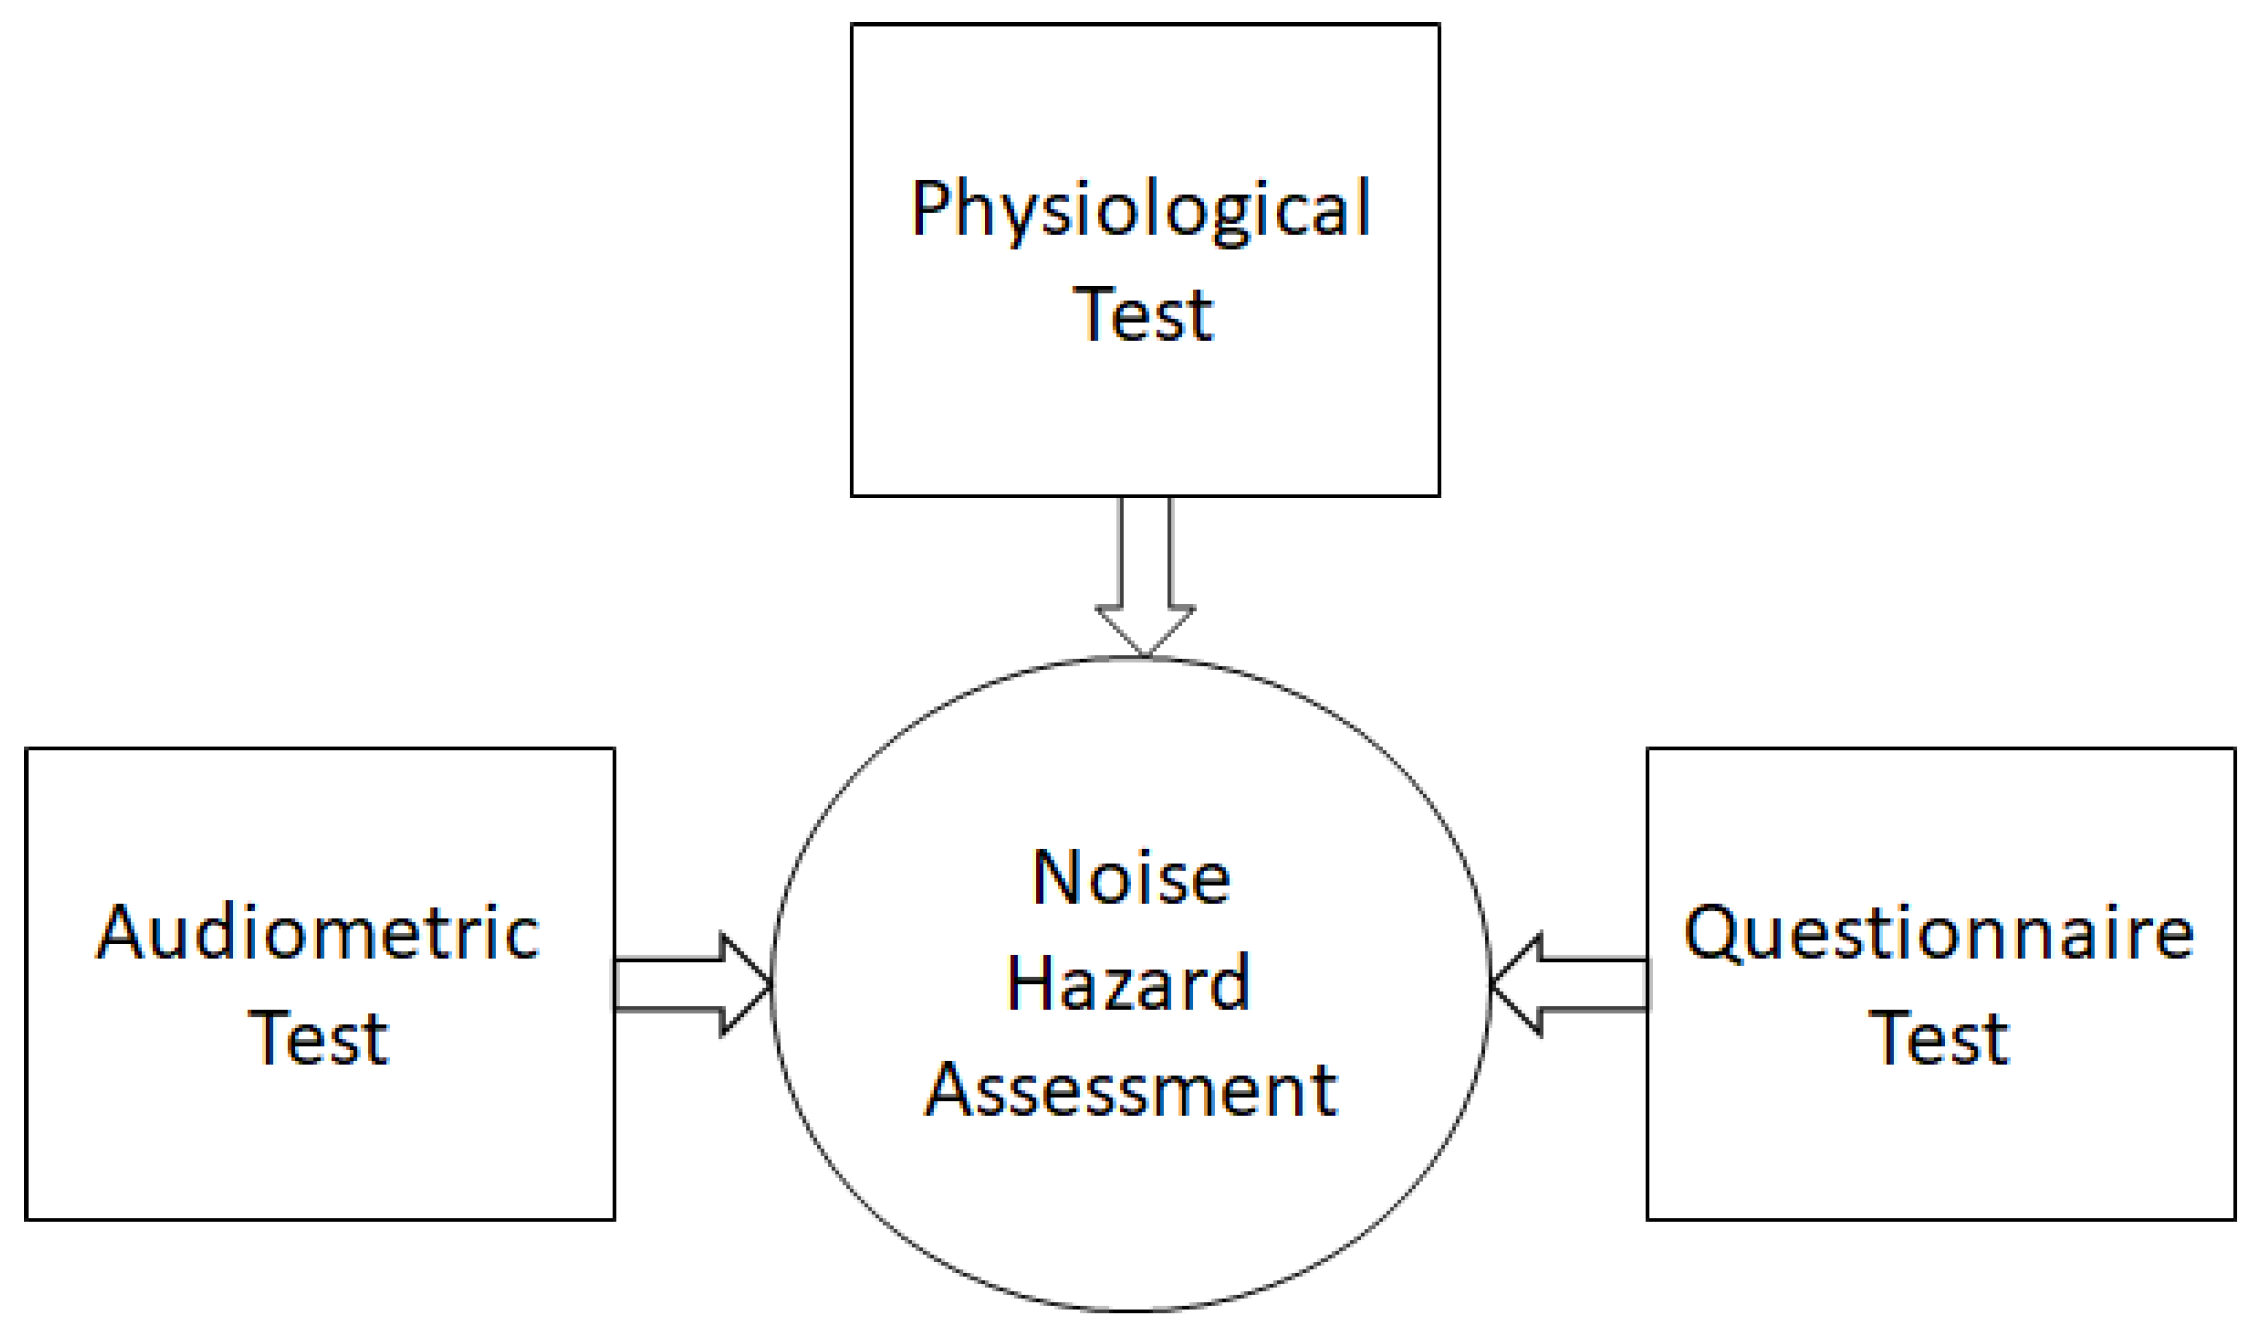
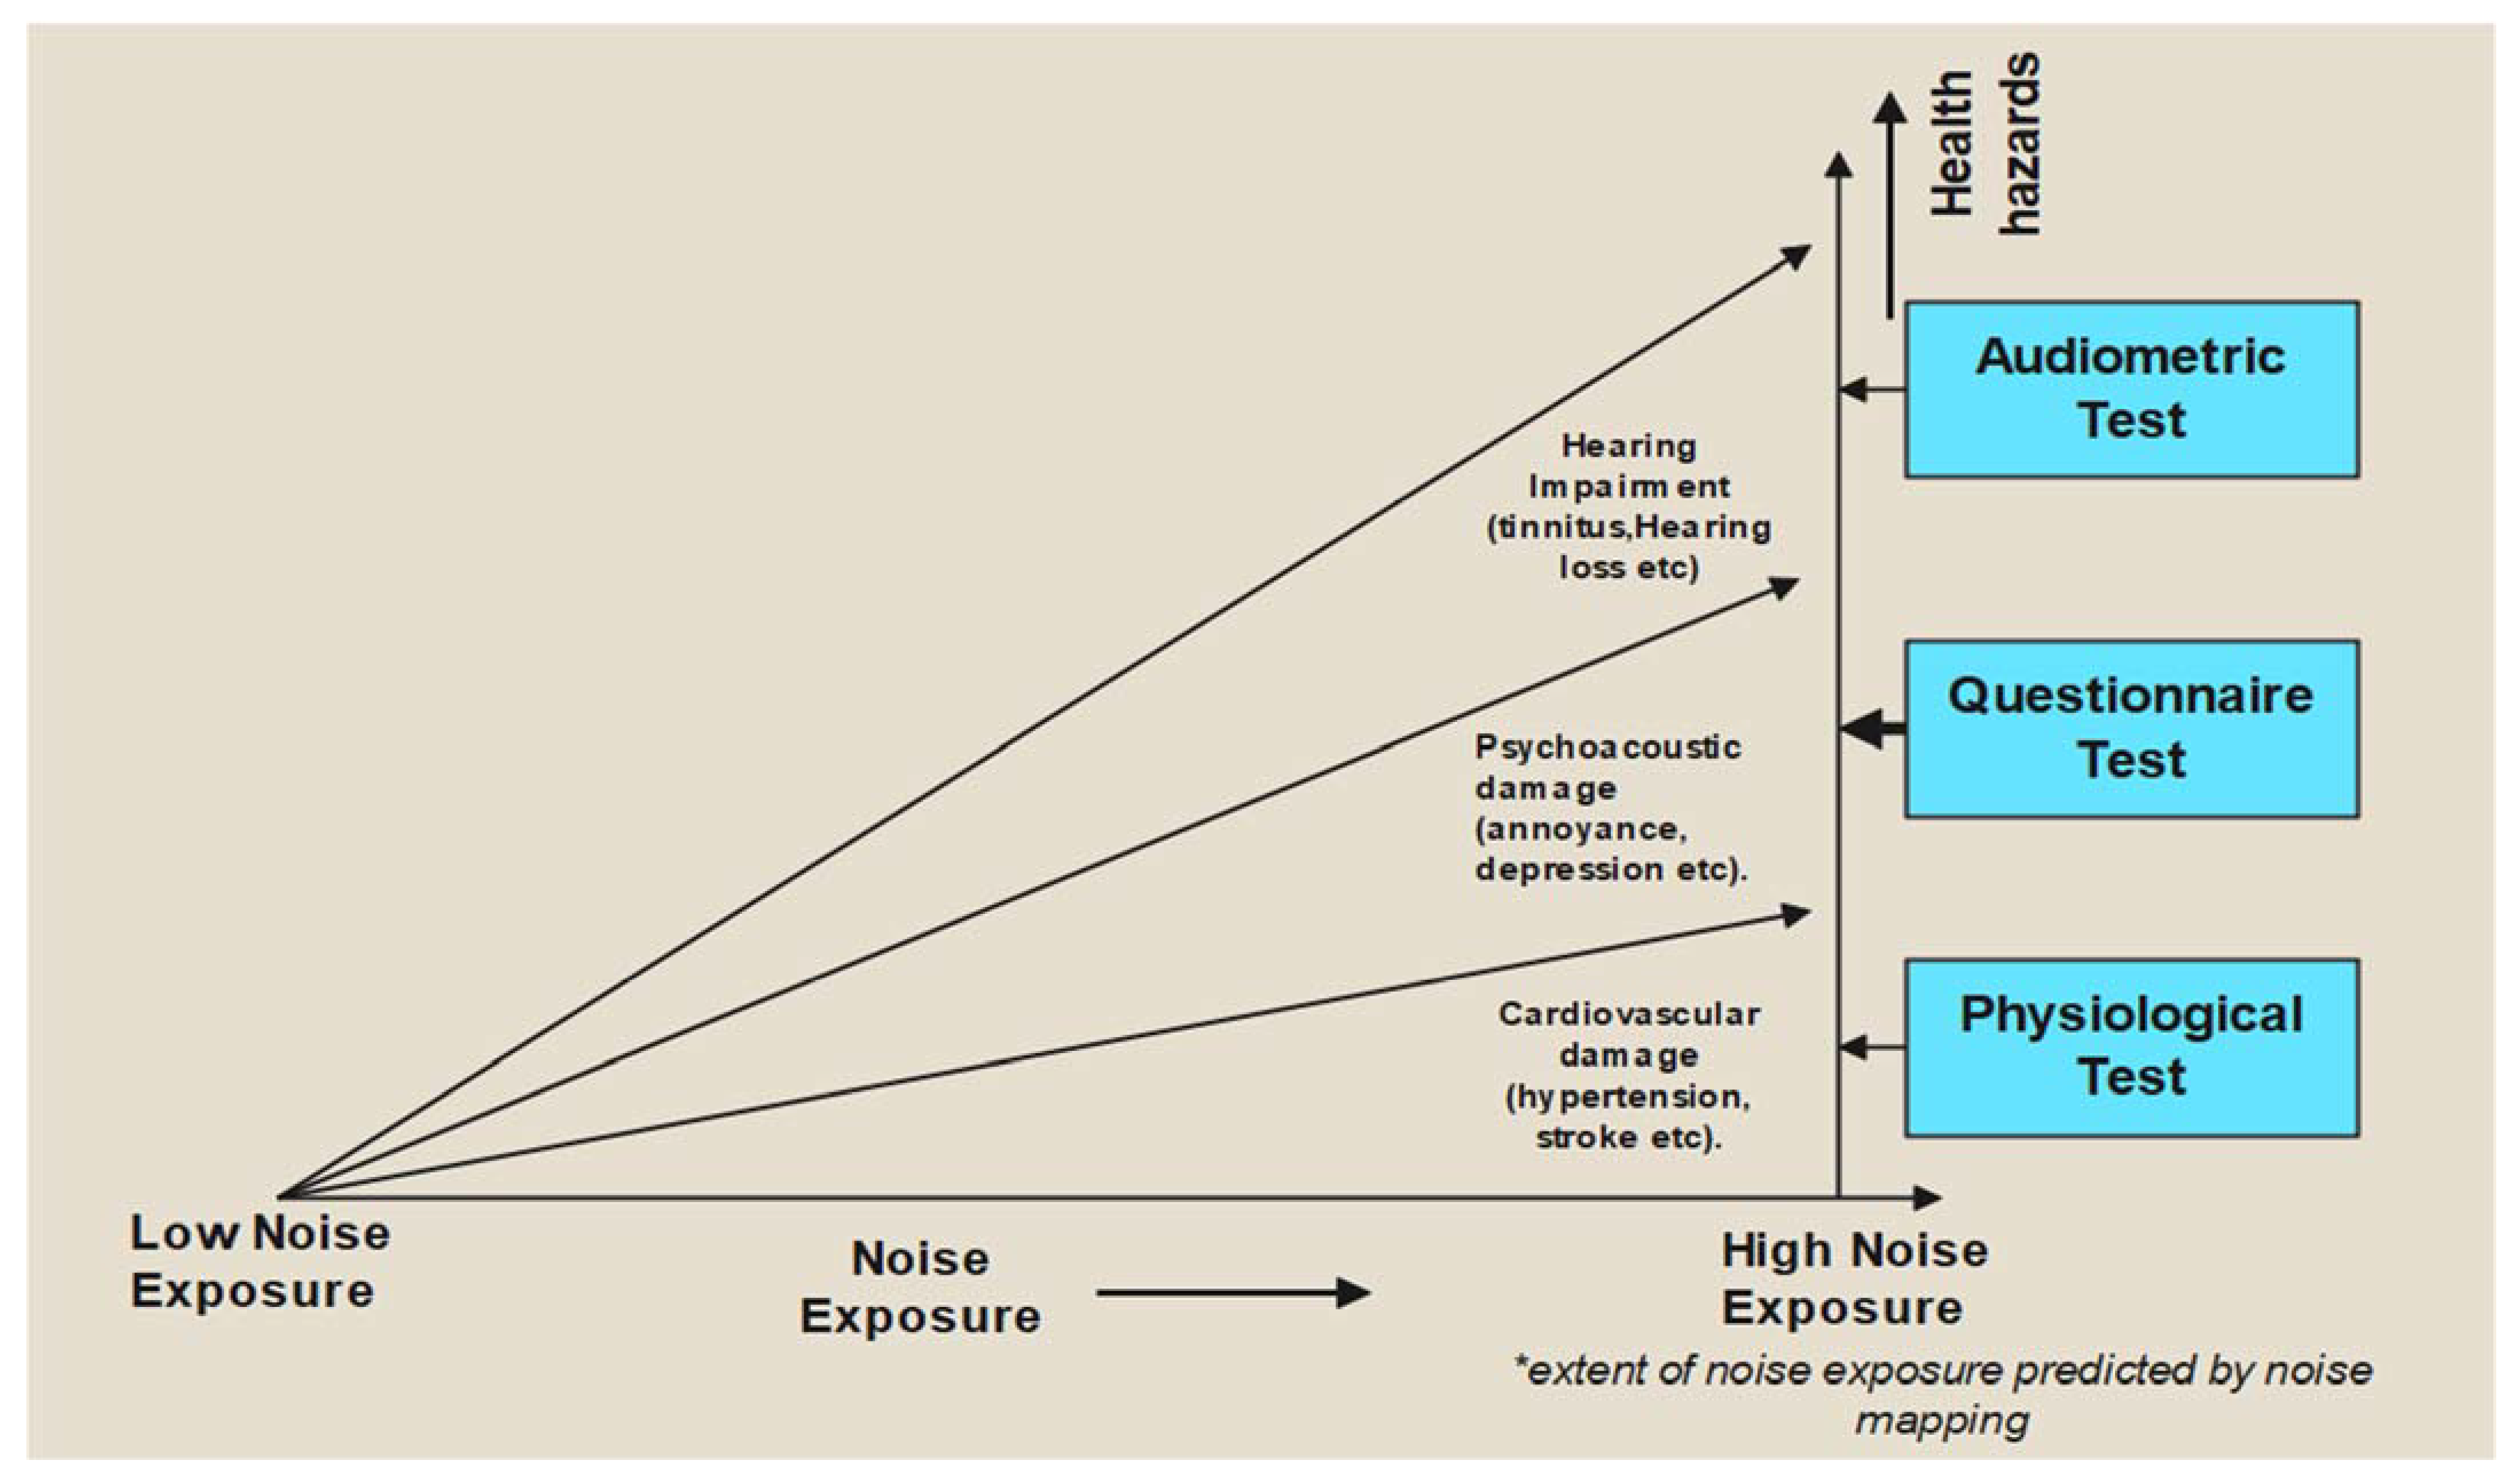
The authors have chosen a typical congested developing intersection for the study. A methodical approach was applied for sampling of noise levels at the intersection. The detailed noise maps were generated using a noise mapping technique and integrated with the duration of noise exposure to derive the noise exposure maps. Finally, noise level and noise exposure level mapping were related to the health hazard study for the noisy intersection. Assessment of health hazards for noise exposure can be made using three approaches, that is, through an audiometric test which tests any physical damage to hearing organs, physiological tests which estimates physiological damage to individuals exposed to high noise levels, and a questionnaire, which tests the general health hazards of individuals exposed to high noise level through a series of questions targeting the estimation of the relationship between lifestyle, detailed nature of noise exposure, and hazards to health (Figure 1).
It is assumed prolonged intense exposure to noises will cause auditory losses. It can also lead to non-auditory damage leading to hypertension, cardiovascular diseases, stress, annoyance, and sleep disturbances. Considering that non-auditory damages can also be caused by lifestyle diseases, dietary patterns, air pollution, etc., these causative factors were attempted to be largely ruled out for the study site. This was accomplished by conducting a noise exposure and health hazard study for an alternative study site that was devoid of noise pollution. It is understood that if the alternative nearby study site that had a very low noise exposure level exhibited lower health hazards, in particular significantly lesser auditory damages, then the high noise exposure levels of the intersection may directly be related to the severe health hazards recorded there.
Research Gap for Noise Hazards Determination of Developing City Intersection: There is a need to estimate the hazards of traffic noise around a city intersection. The determined technique will have the following characteristics:
Characterization of detailed noise exposure to dwellers of a developing city intersection.
Determination of health hazards of noise exposure at the developing intersection.
The technique developed should be able to estimate the noise levels at a different time in the day and at different locations around the intersection.
It should be sensitive to the noise sampling period.
It should provide a reasonably accurate prediction as a function of time and space.
It should be simple to adapt.
The technique should be able to generate a noise map indicating noisy and less noisy places of the intersection.
The technique should be able to relate the estimated noise levels with the noise exposure levels of people working at and around the intersection over 8–10 h daily.
The technique should determine the noise exposure for the visitors of the intersection during their time of visit (assumed 1 h and 30 min in a day).
The technique should relate the noise exposure to the hazards to health.
The technique must ensure that the health hazards recorded around the city intersection are indeed due to noise exposure
The authors tried to work upon the above research gap through the design of a research methodology that addresses the research gap. Section 2 discusses the adopted Material and Methods for the study.

2. Materials

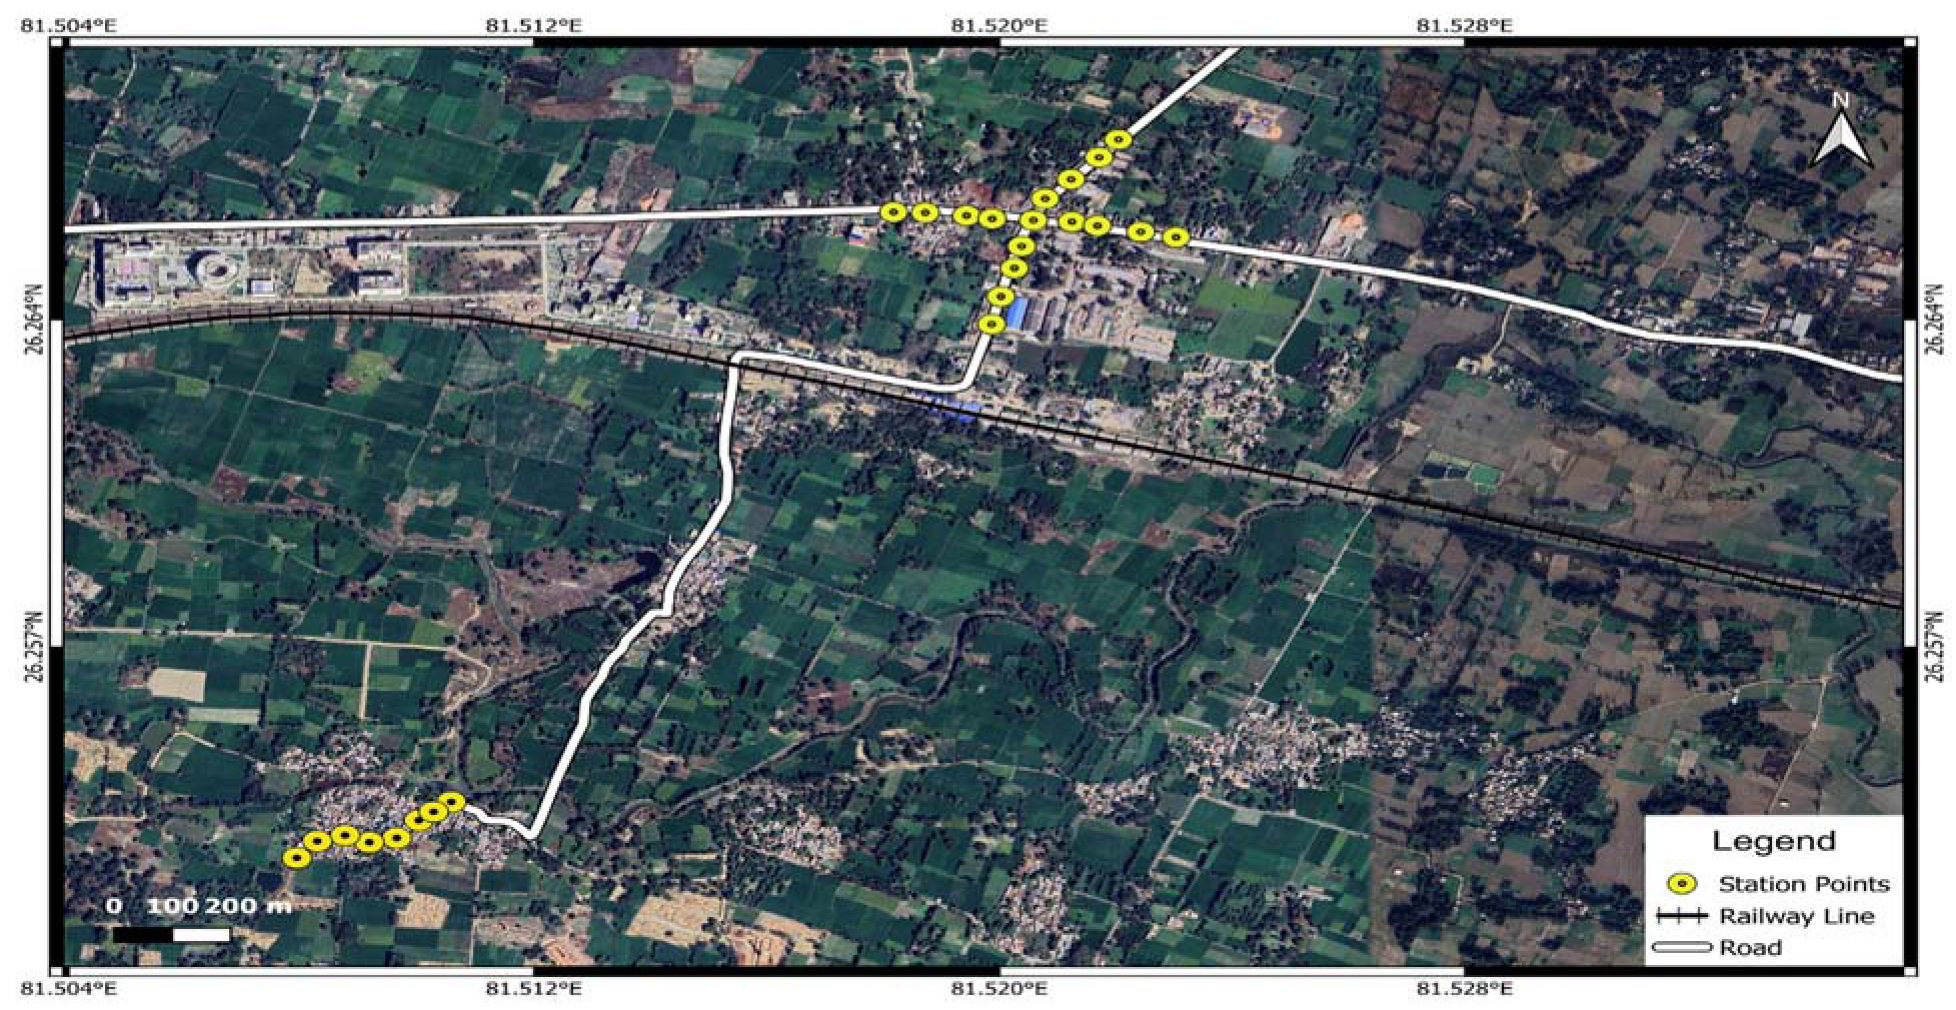
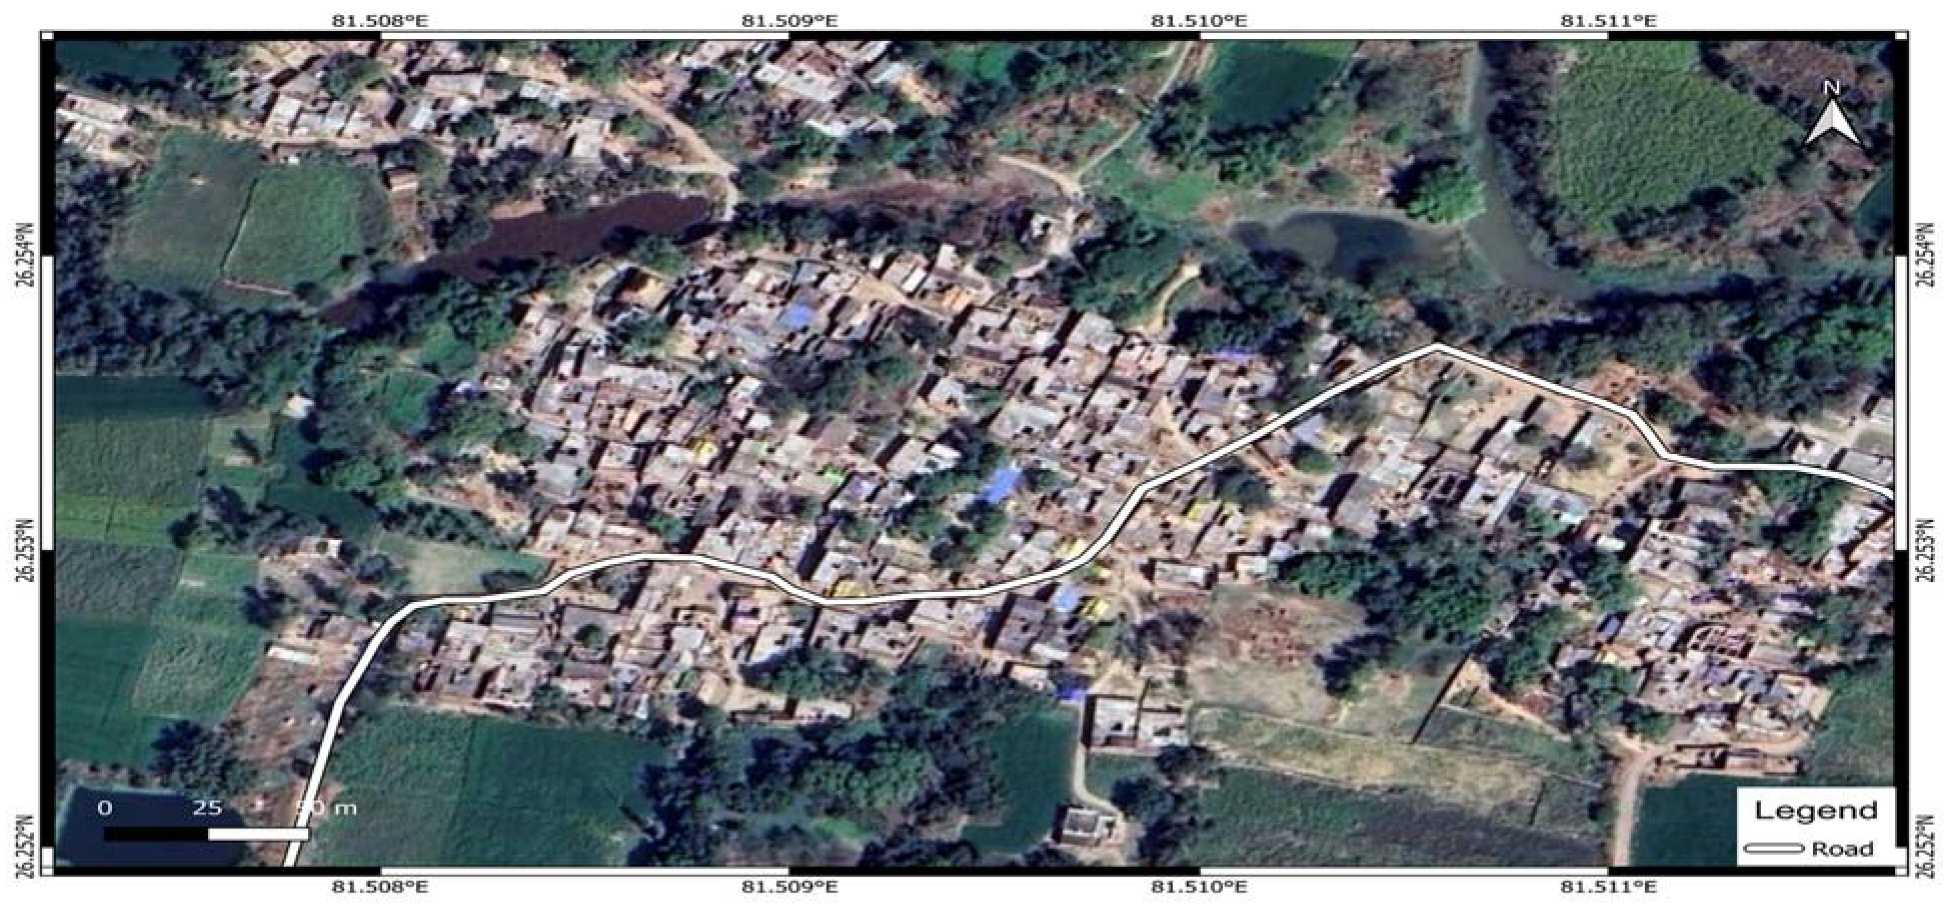
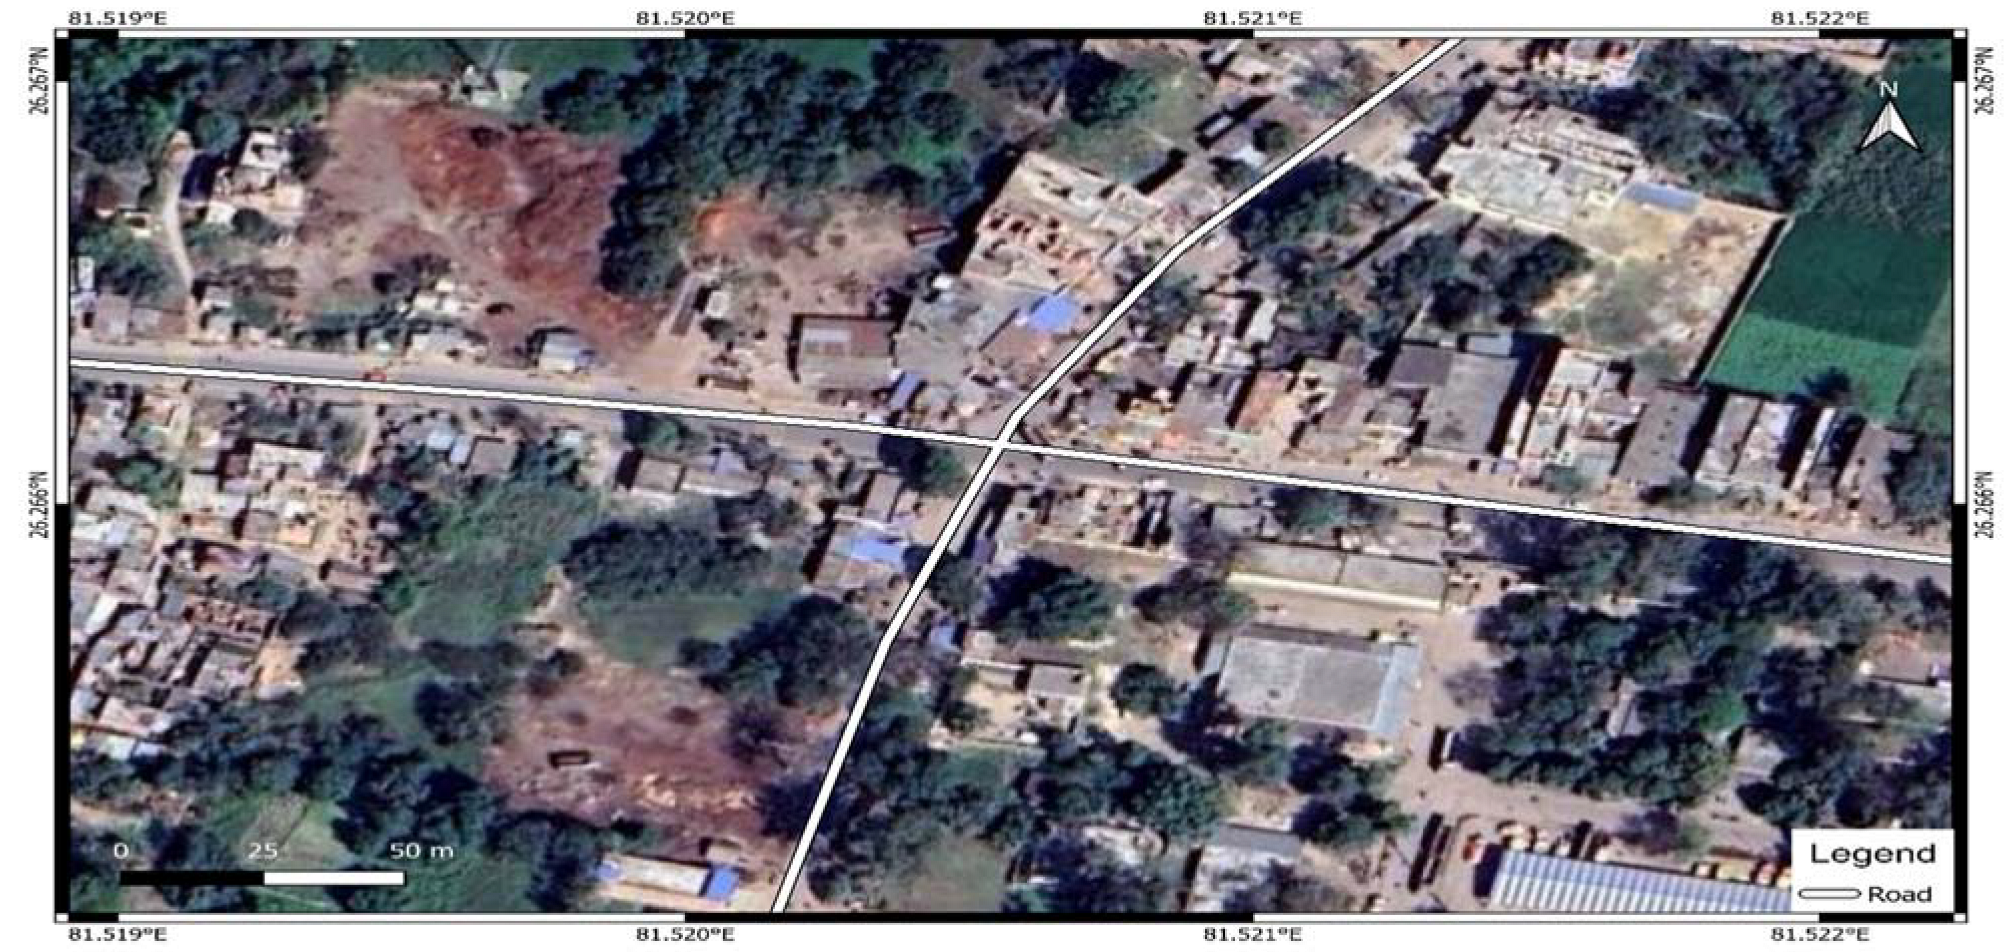
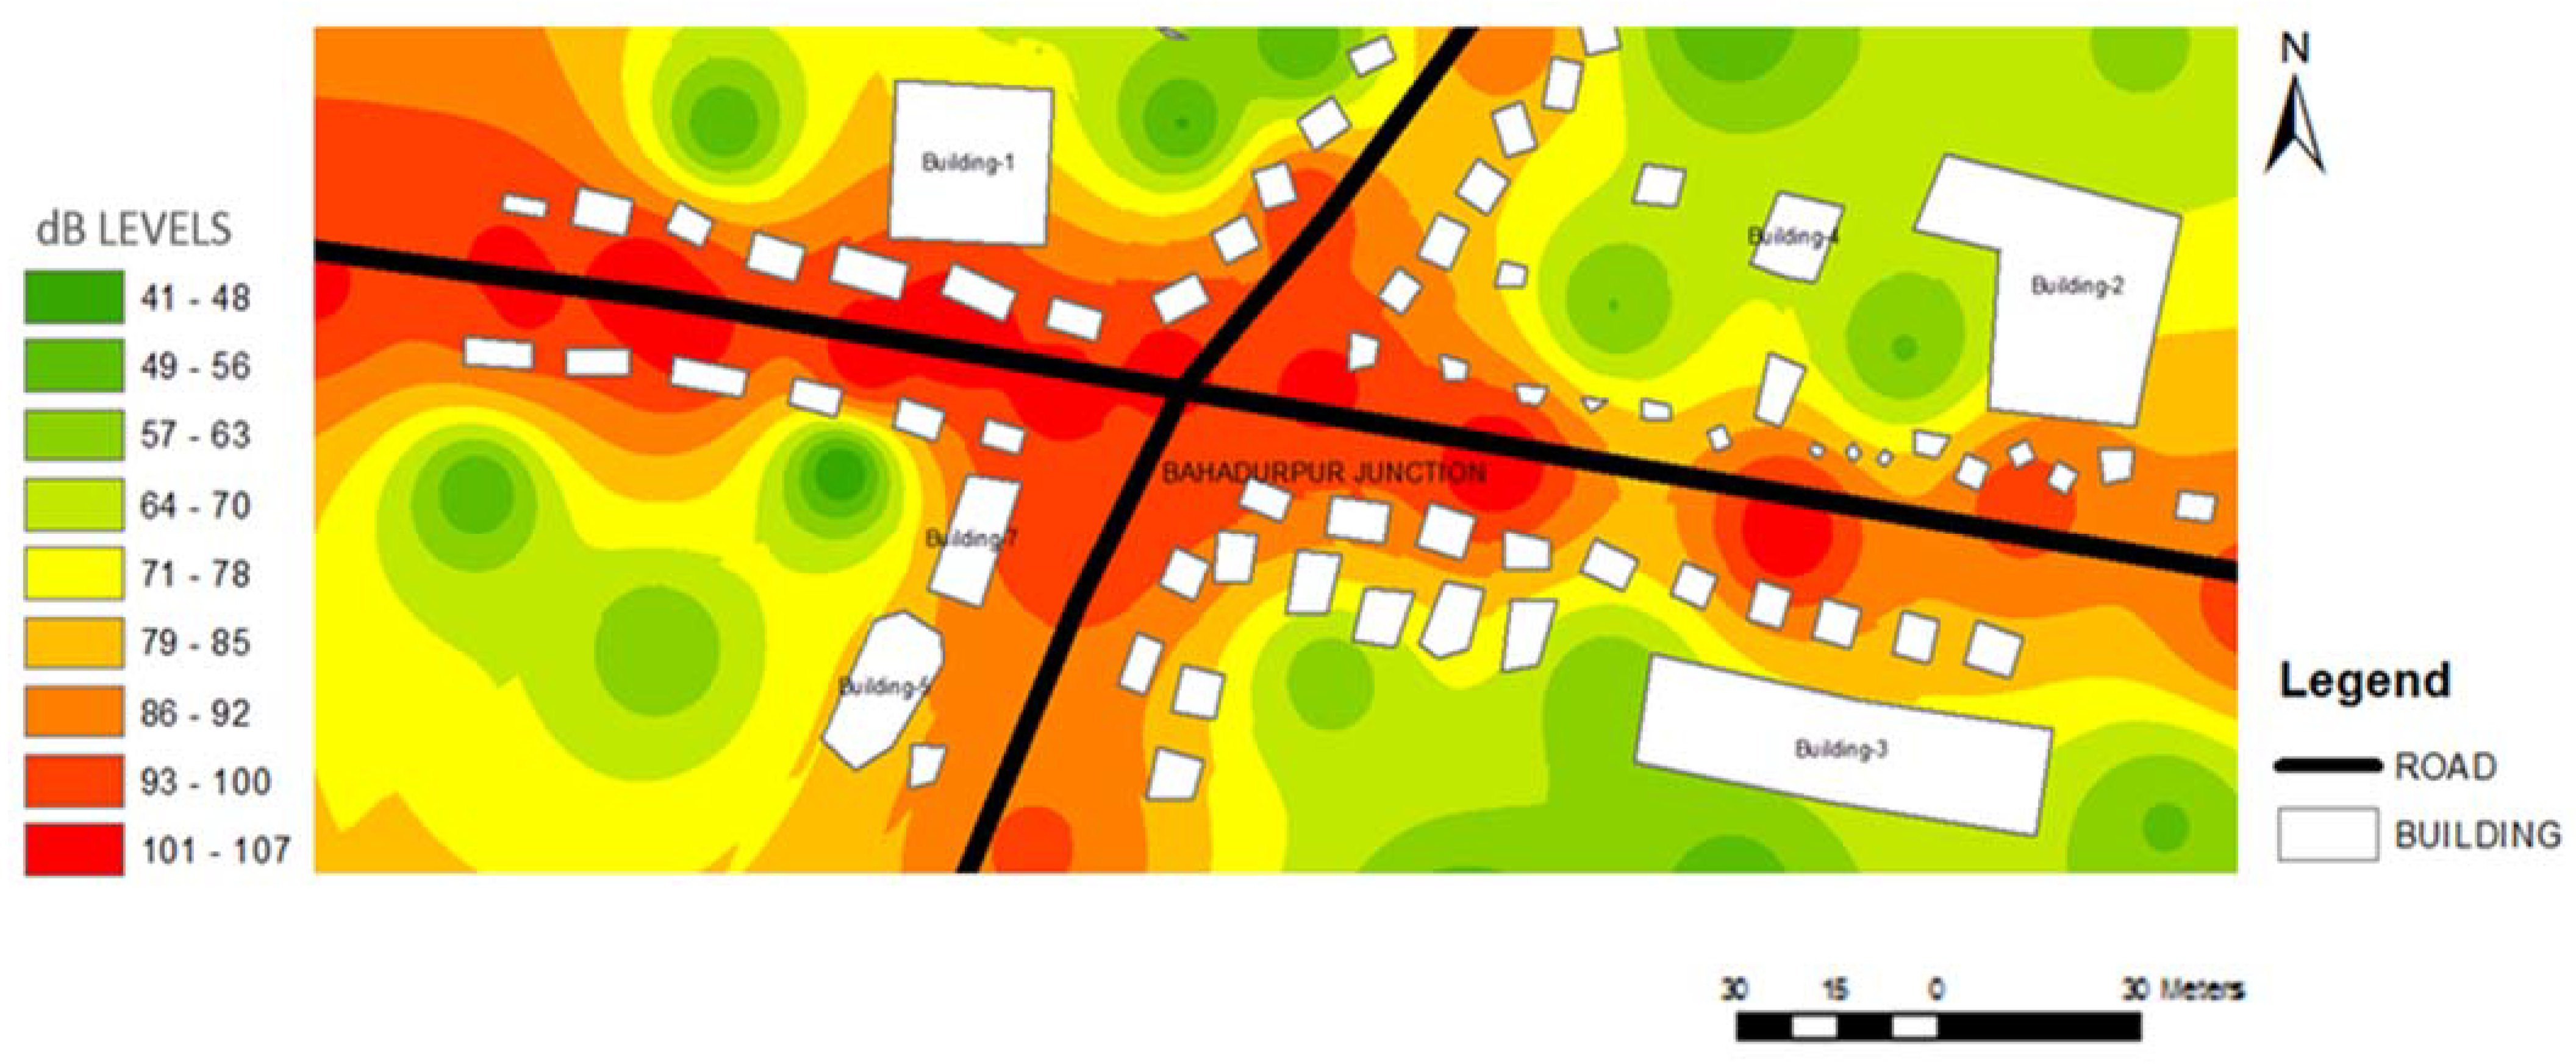
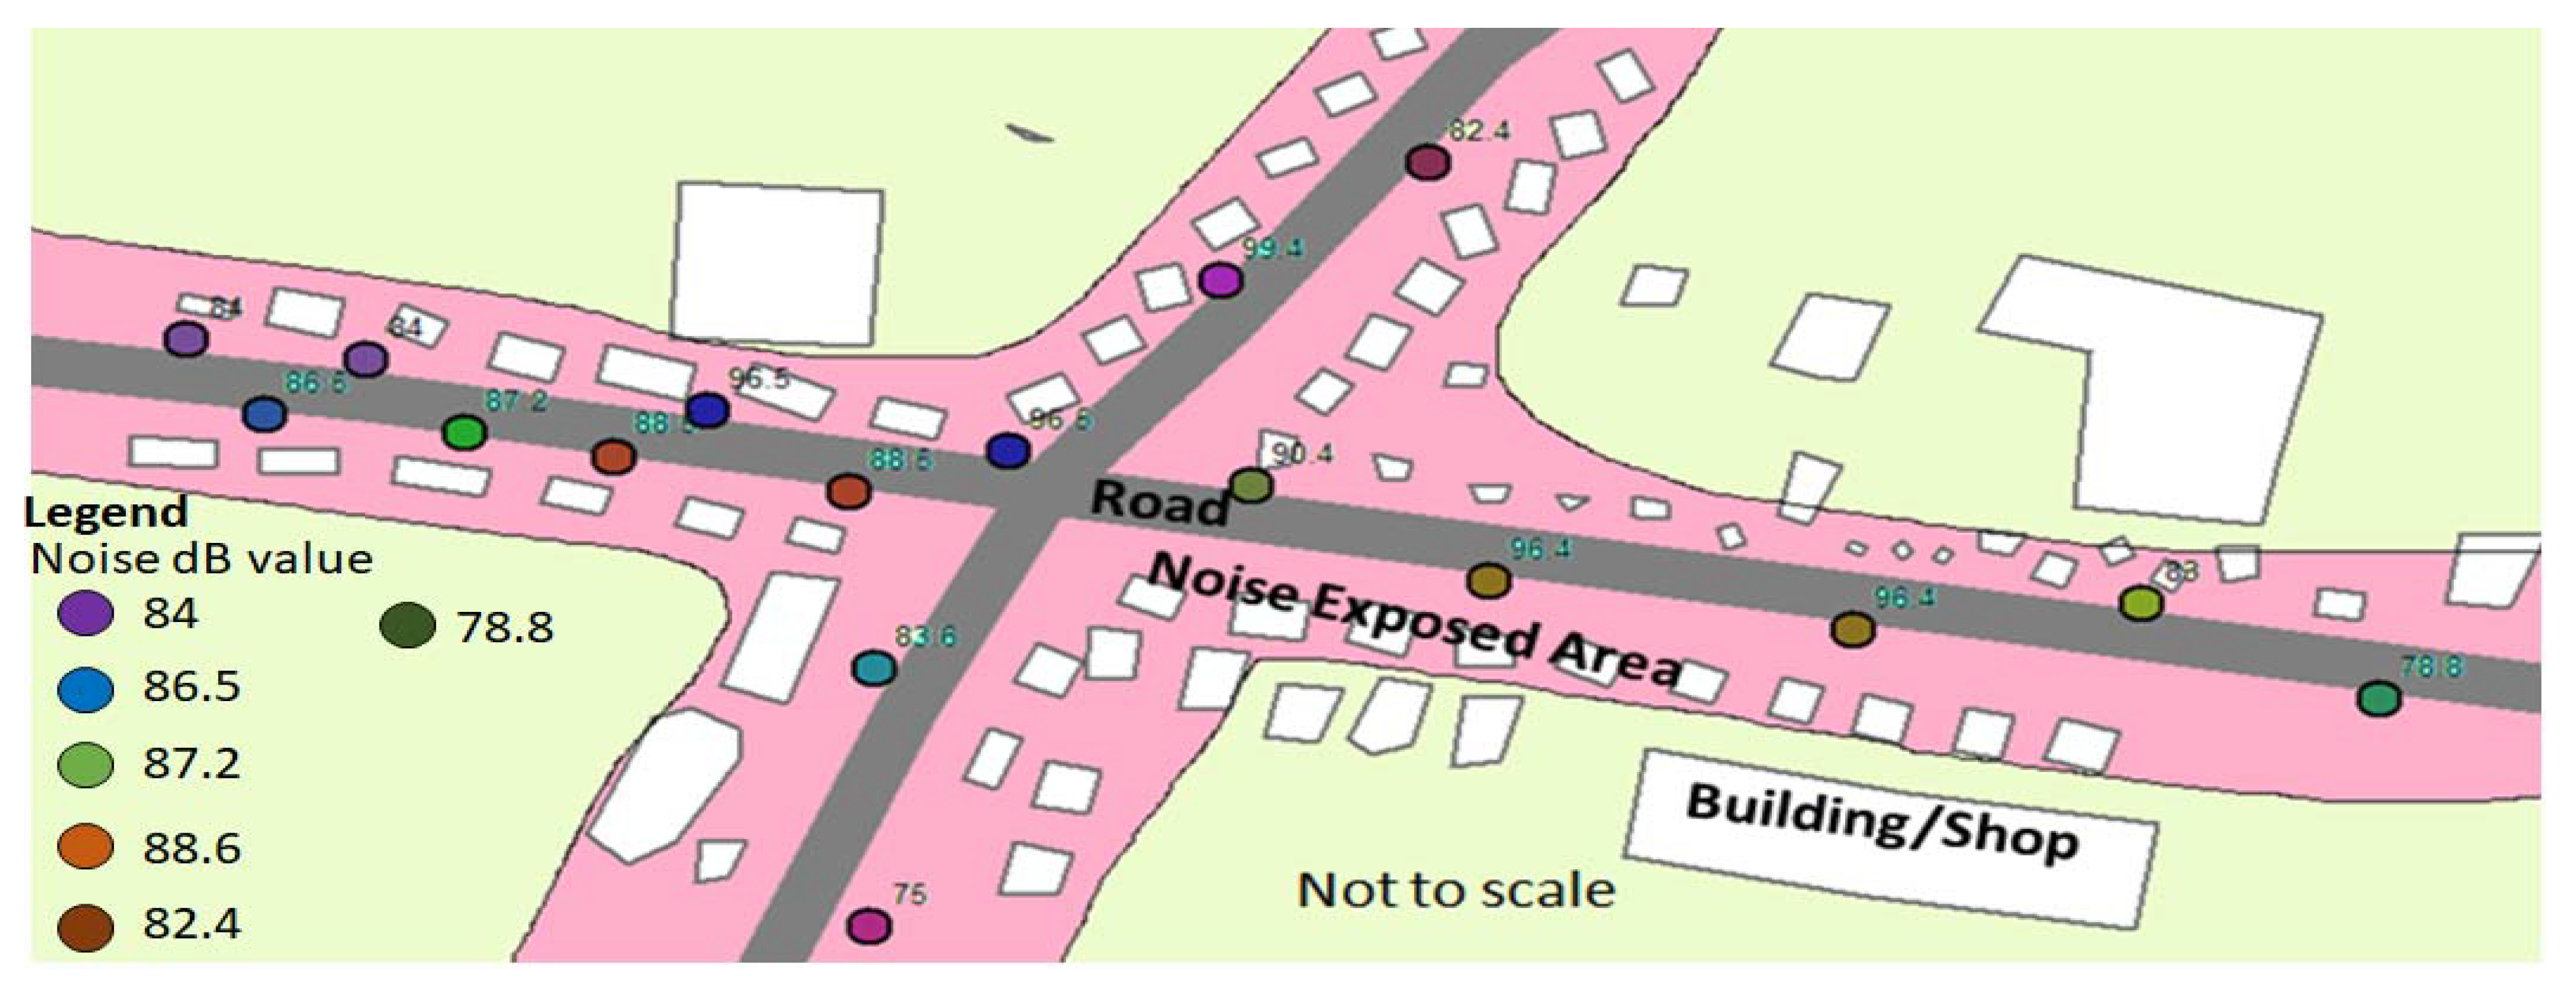
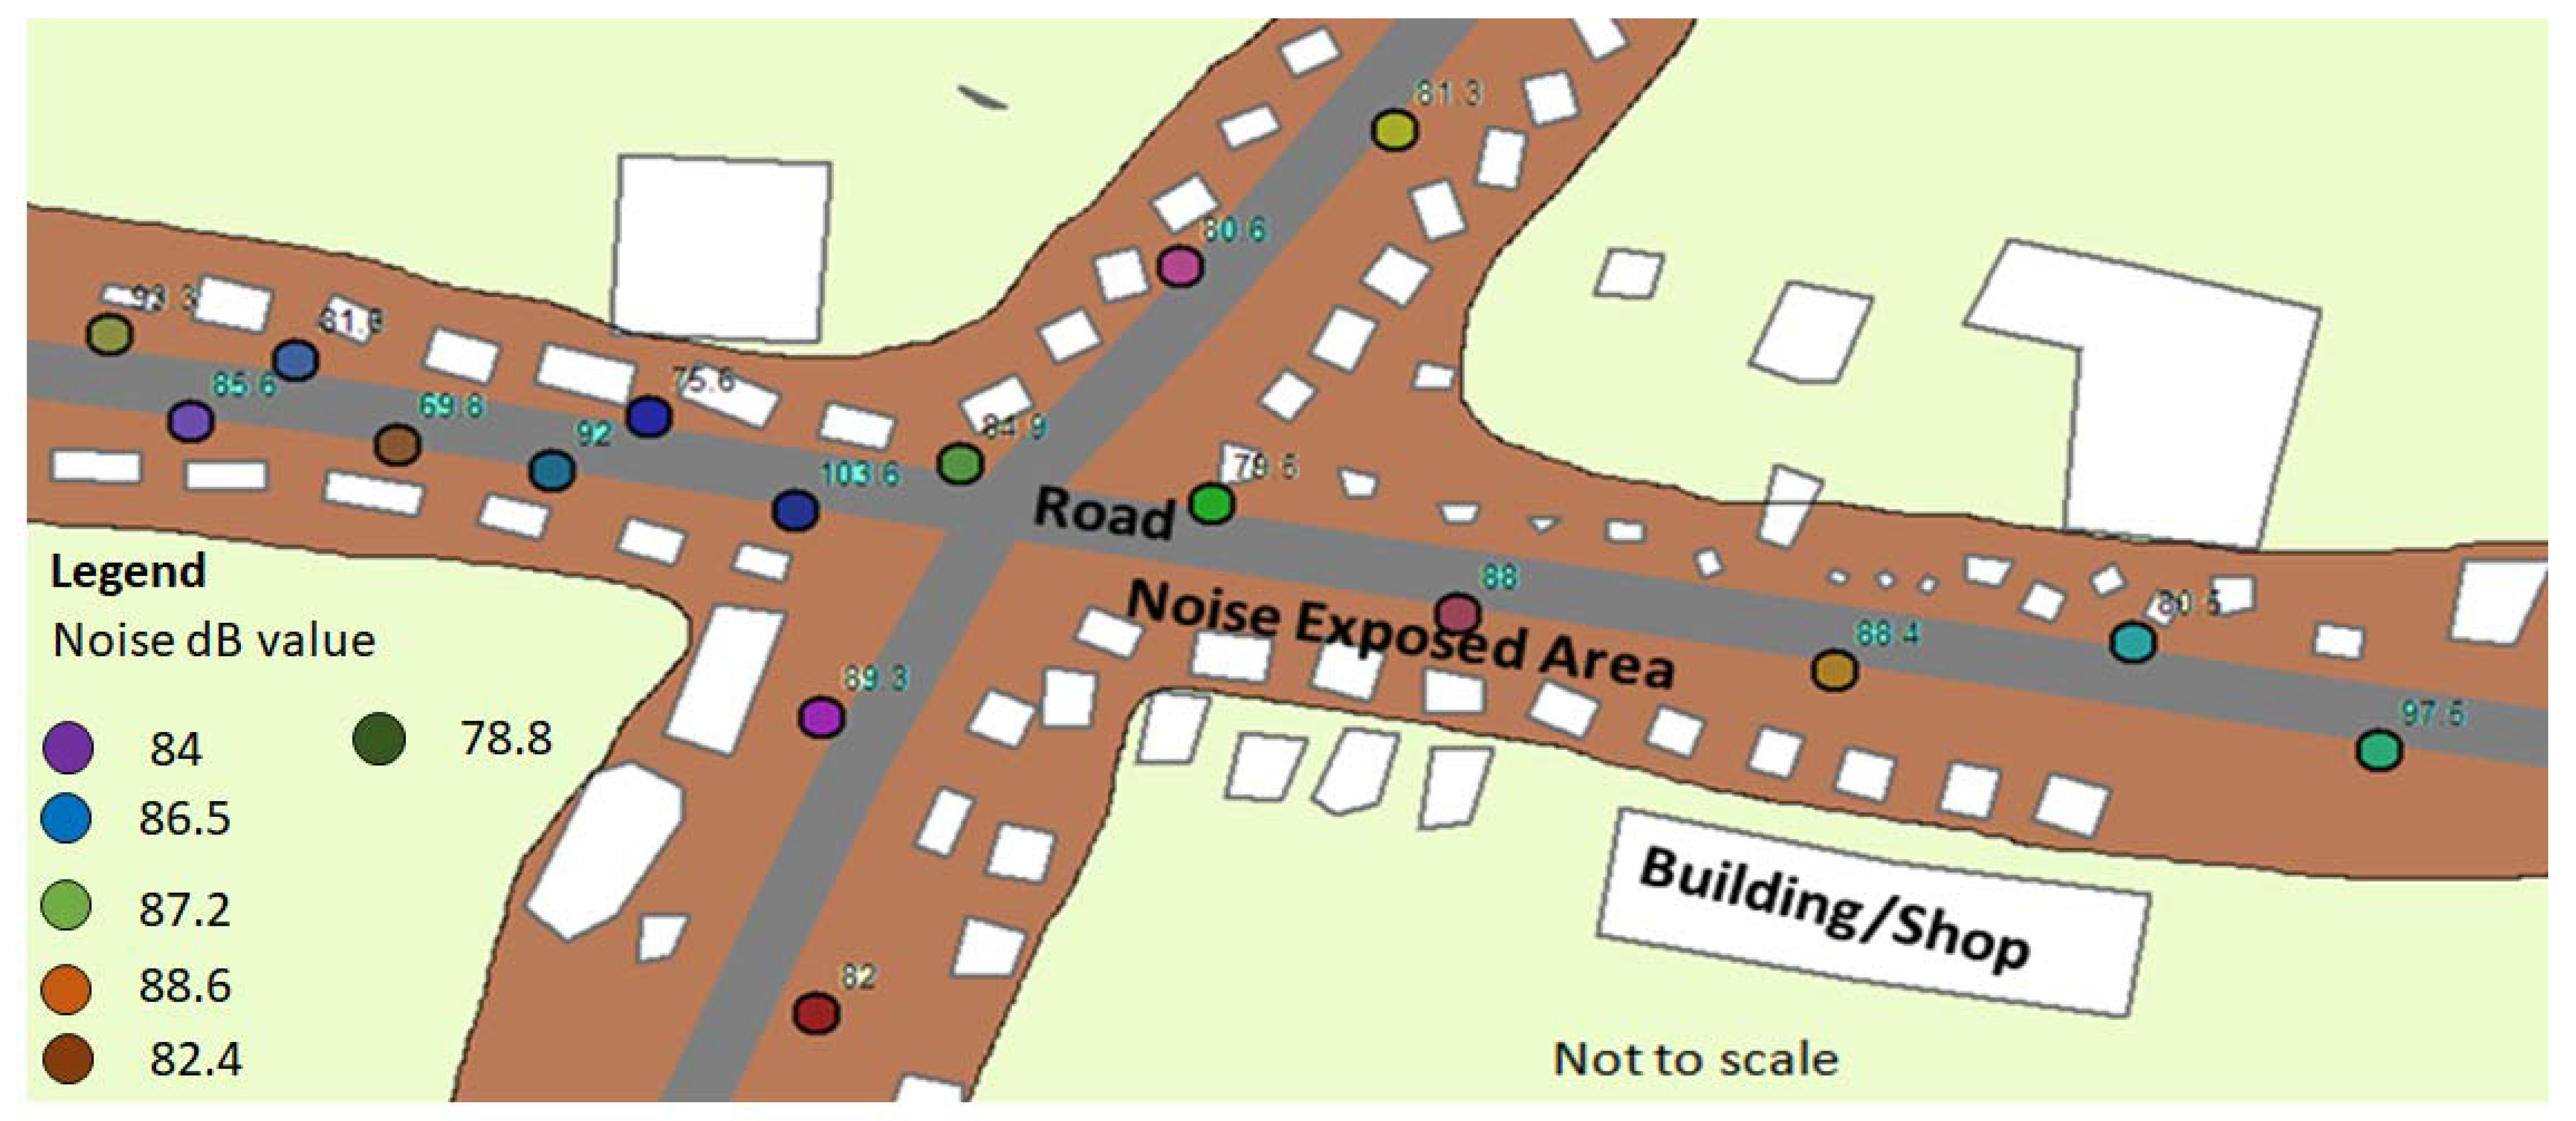
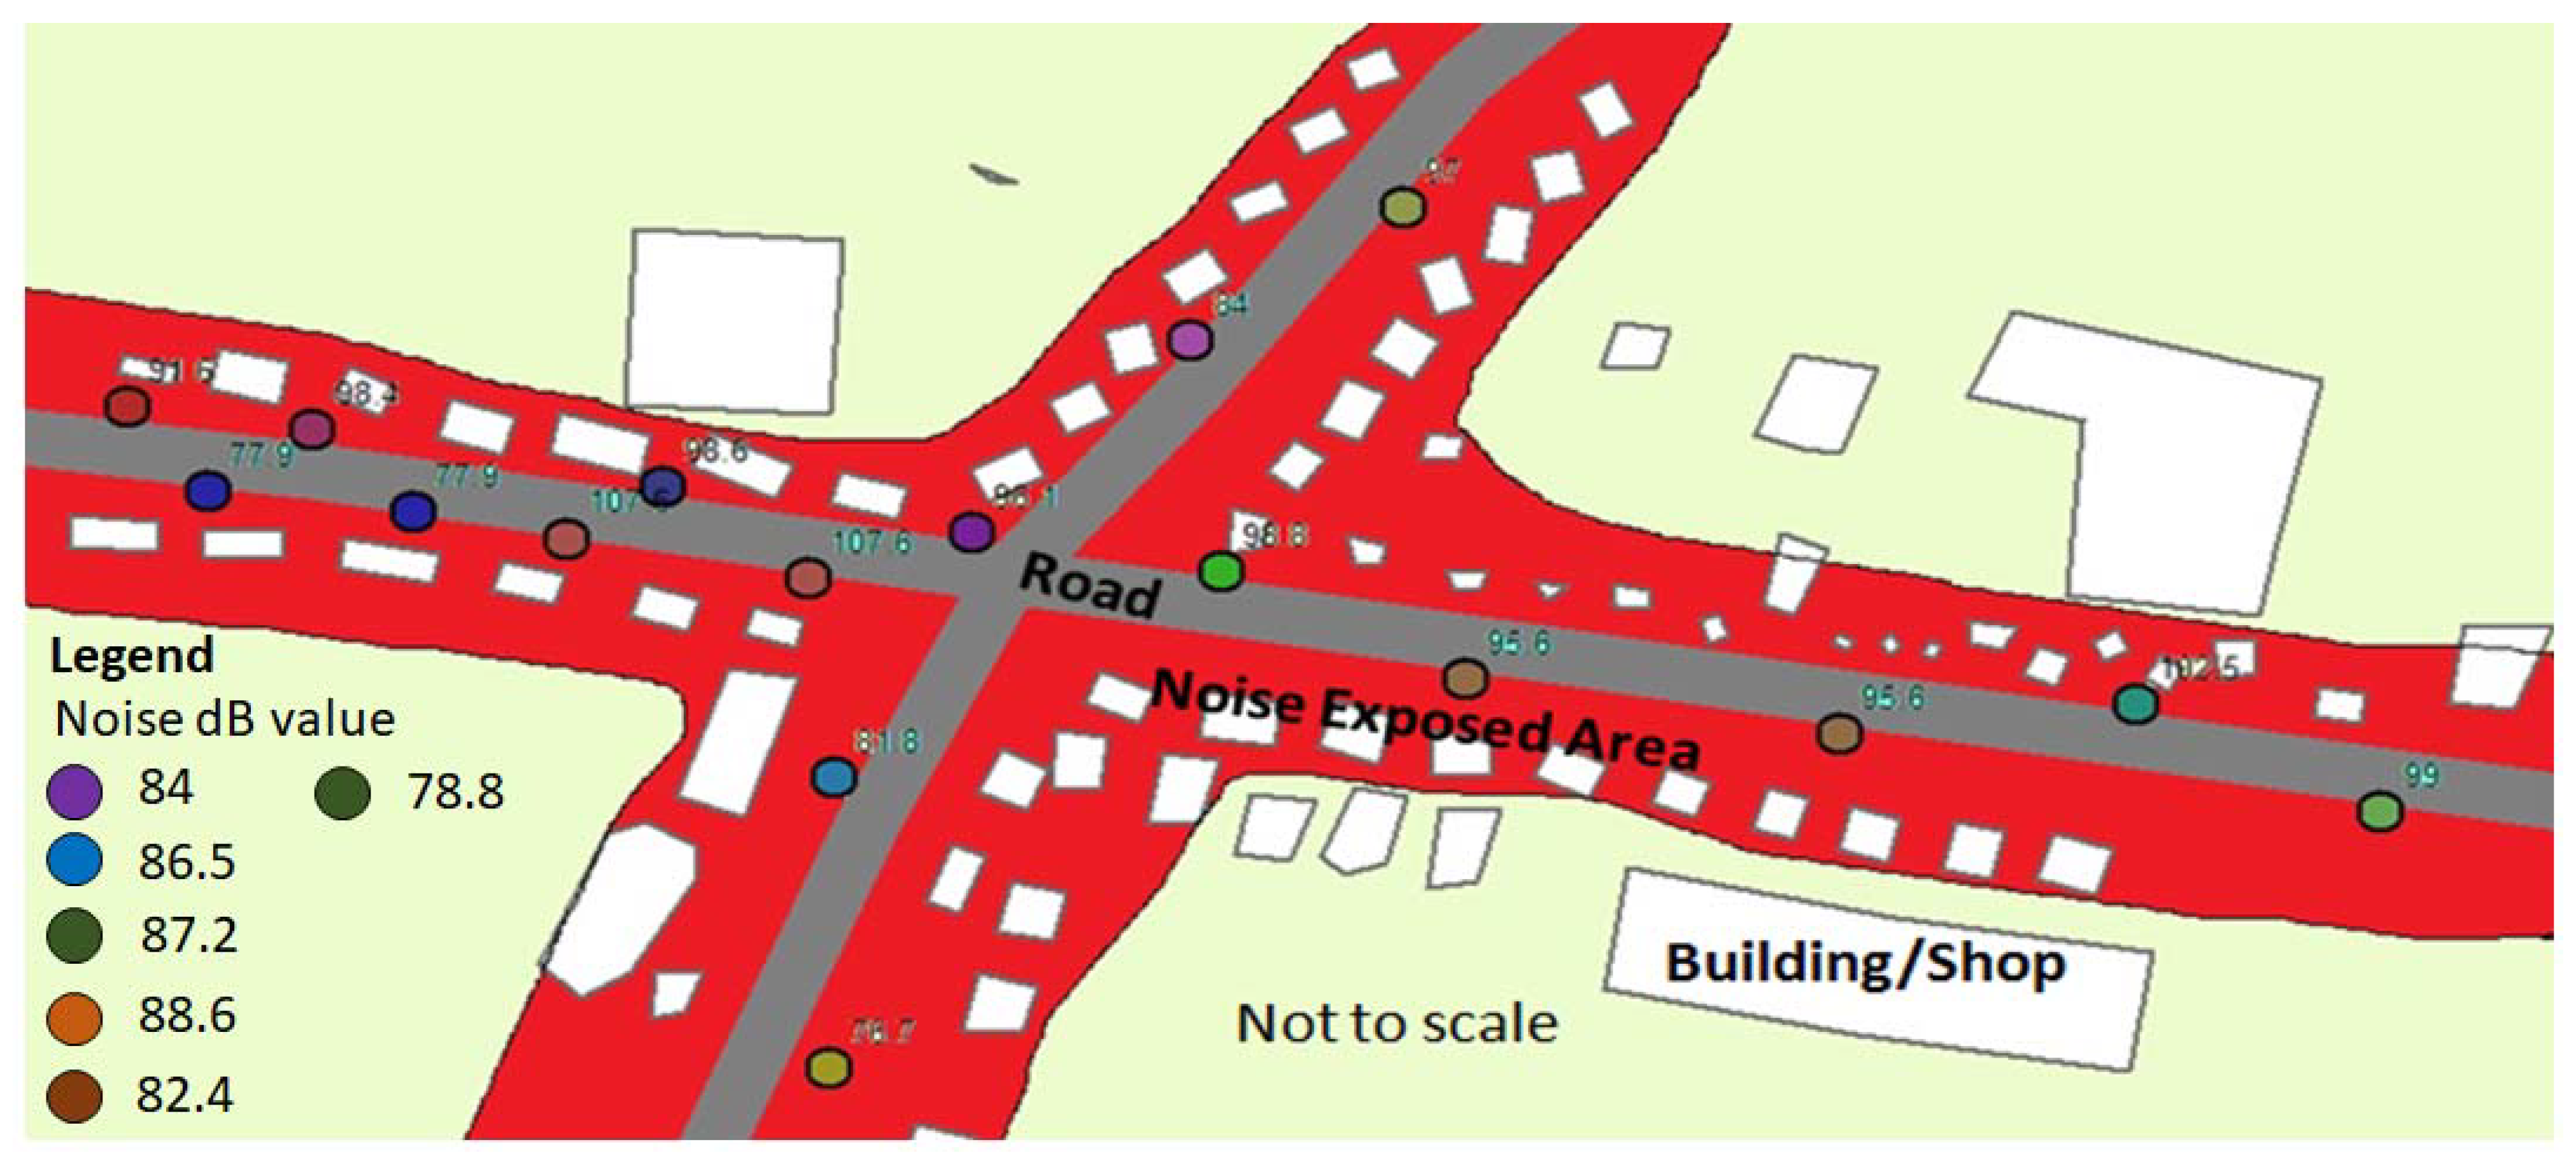
Two study sites were chosen to verify the impacts of traffic noise. The first site at Bahadurpur, Jais, in the state of Uttar Pradesh in India was representing the noisy intersection of a developing city. It was squarish in shape and had dimensions of 500 m × 500 m. The intersection of the Raebareli-Sultanpur highway and the Jagdishpur-Jais state road is centrally situated within the area. The intersection, popularly known as the Bahadurpur Chauraha, receives a high load of traffic throughout the day. The second site of Pure Ganga of a similar stretch was located within two kilometers of the first site and had a very sparse flow of traffic (Figure 2, Figure 3, Figure 4 and Figure 5).
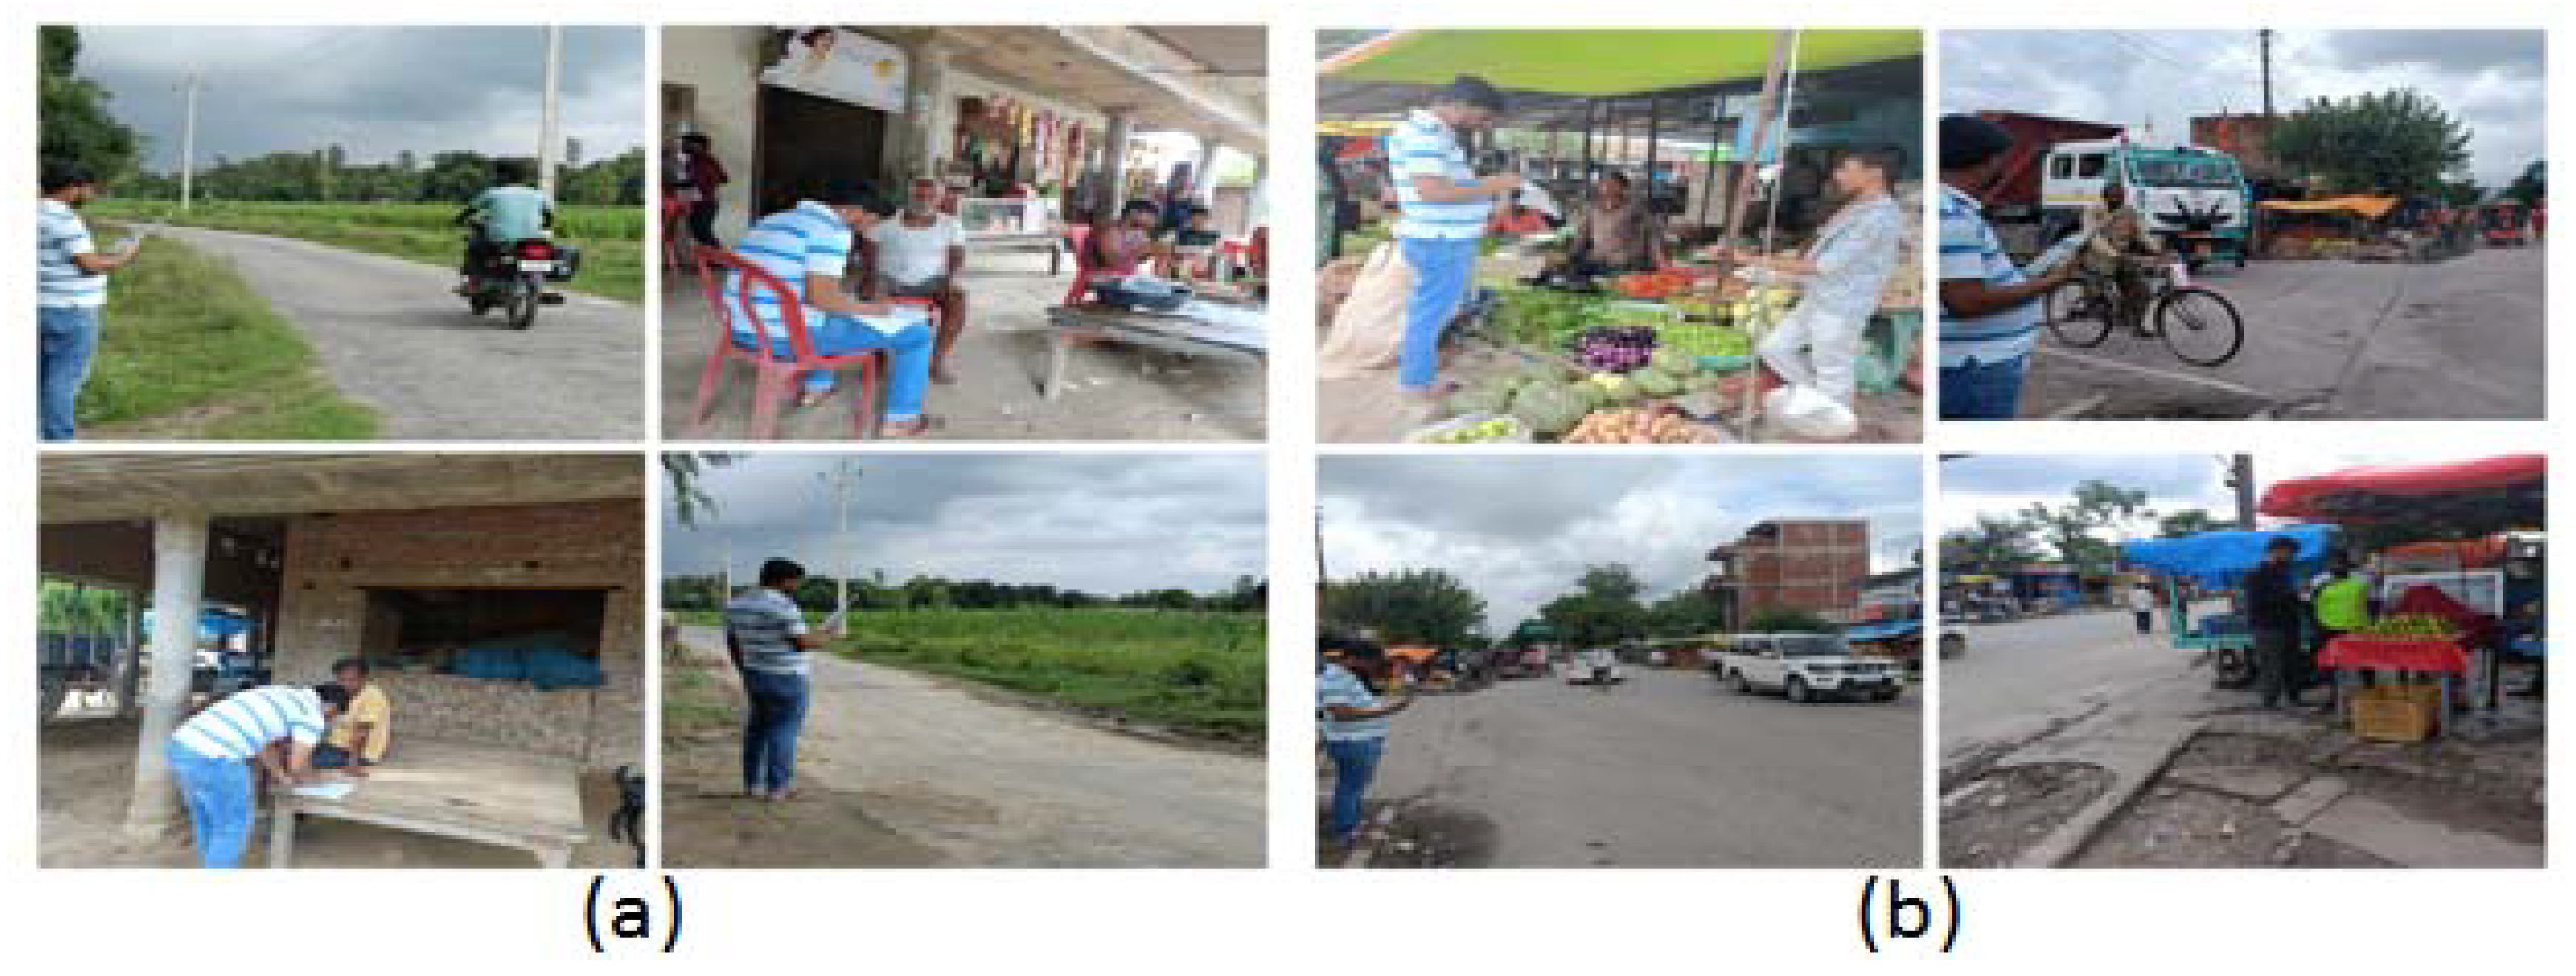
Authors, being the residents of the area, have a comprehensive understanding of spatial and temporal variability of noise at the intersection. The chosen intersection hosted several vendors setting up their shops adjacent to roads, making the intersection more congested and crowded. Further, the dwellers work 8–10 h (9:00 a.m.–7:00 p.m.) daily near the noisy intersection, thus, were expected to be exposed to high levels of noise on a regular basis.
A standard sound pressure level meter CESVA SC-310 (a class—1 meter of range 23 dBA to 137 dBA and of a frequency range of 20 Hz to 10 kHz) was used for the collection of noise data and JUNO GPS (± 2–5 m accuracy) and Google images were used for the recording the coordinates. During the daytime, this highway is overloaded due to the trucks and local vehicles passing through the area to cities like Jais, Raebareli, and Jagdishpur. Several houses are also present near the road corridor and the residents of this area are expected to be affected by the high noise levels (
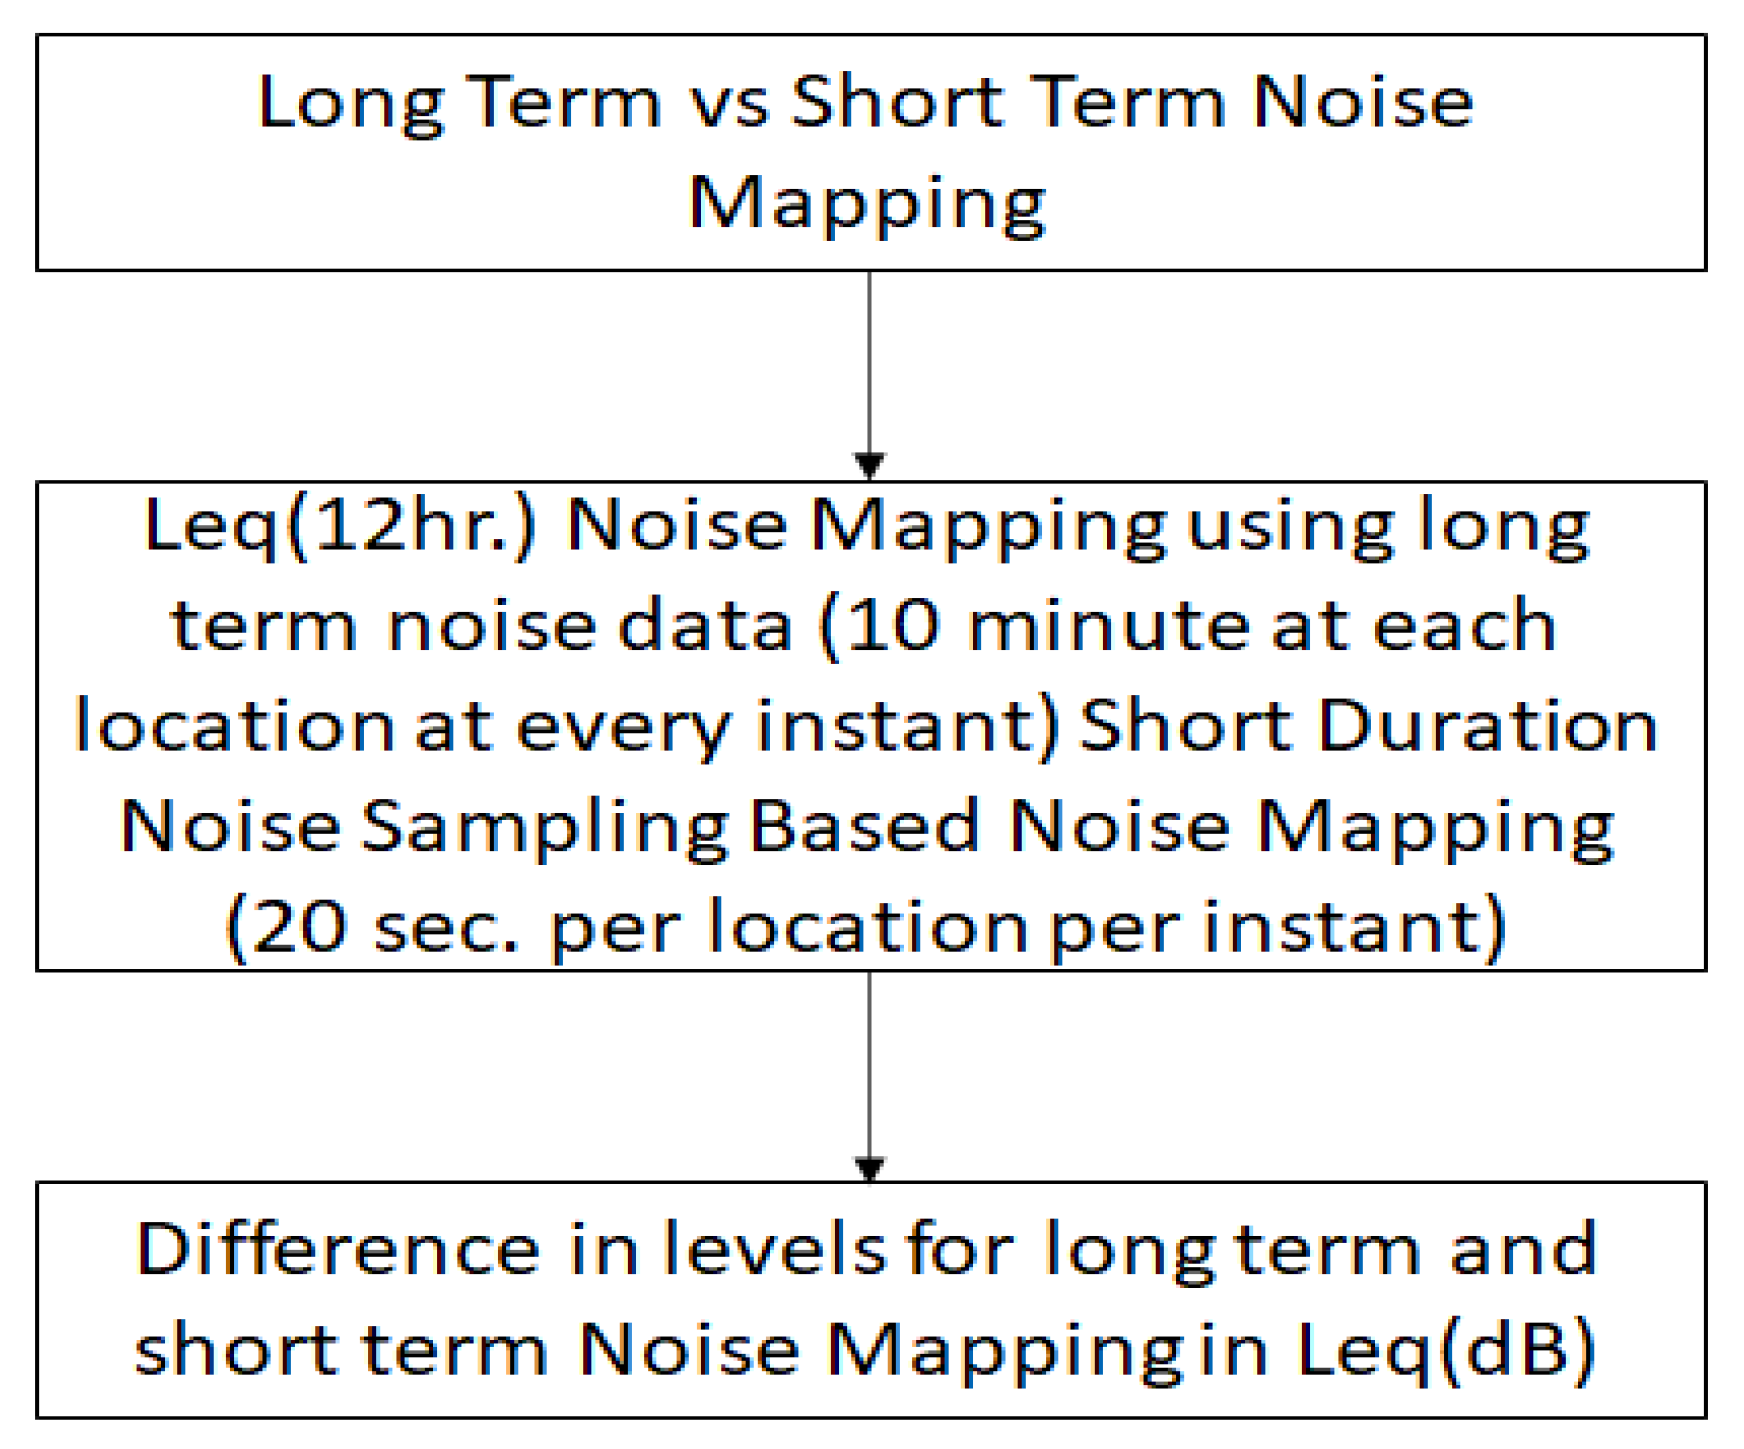
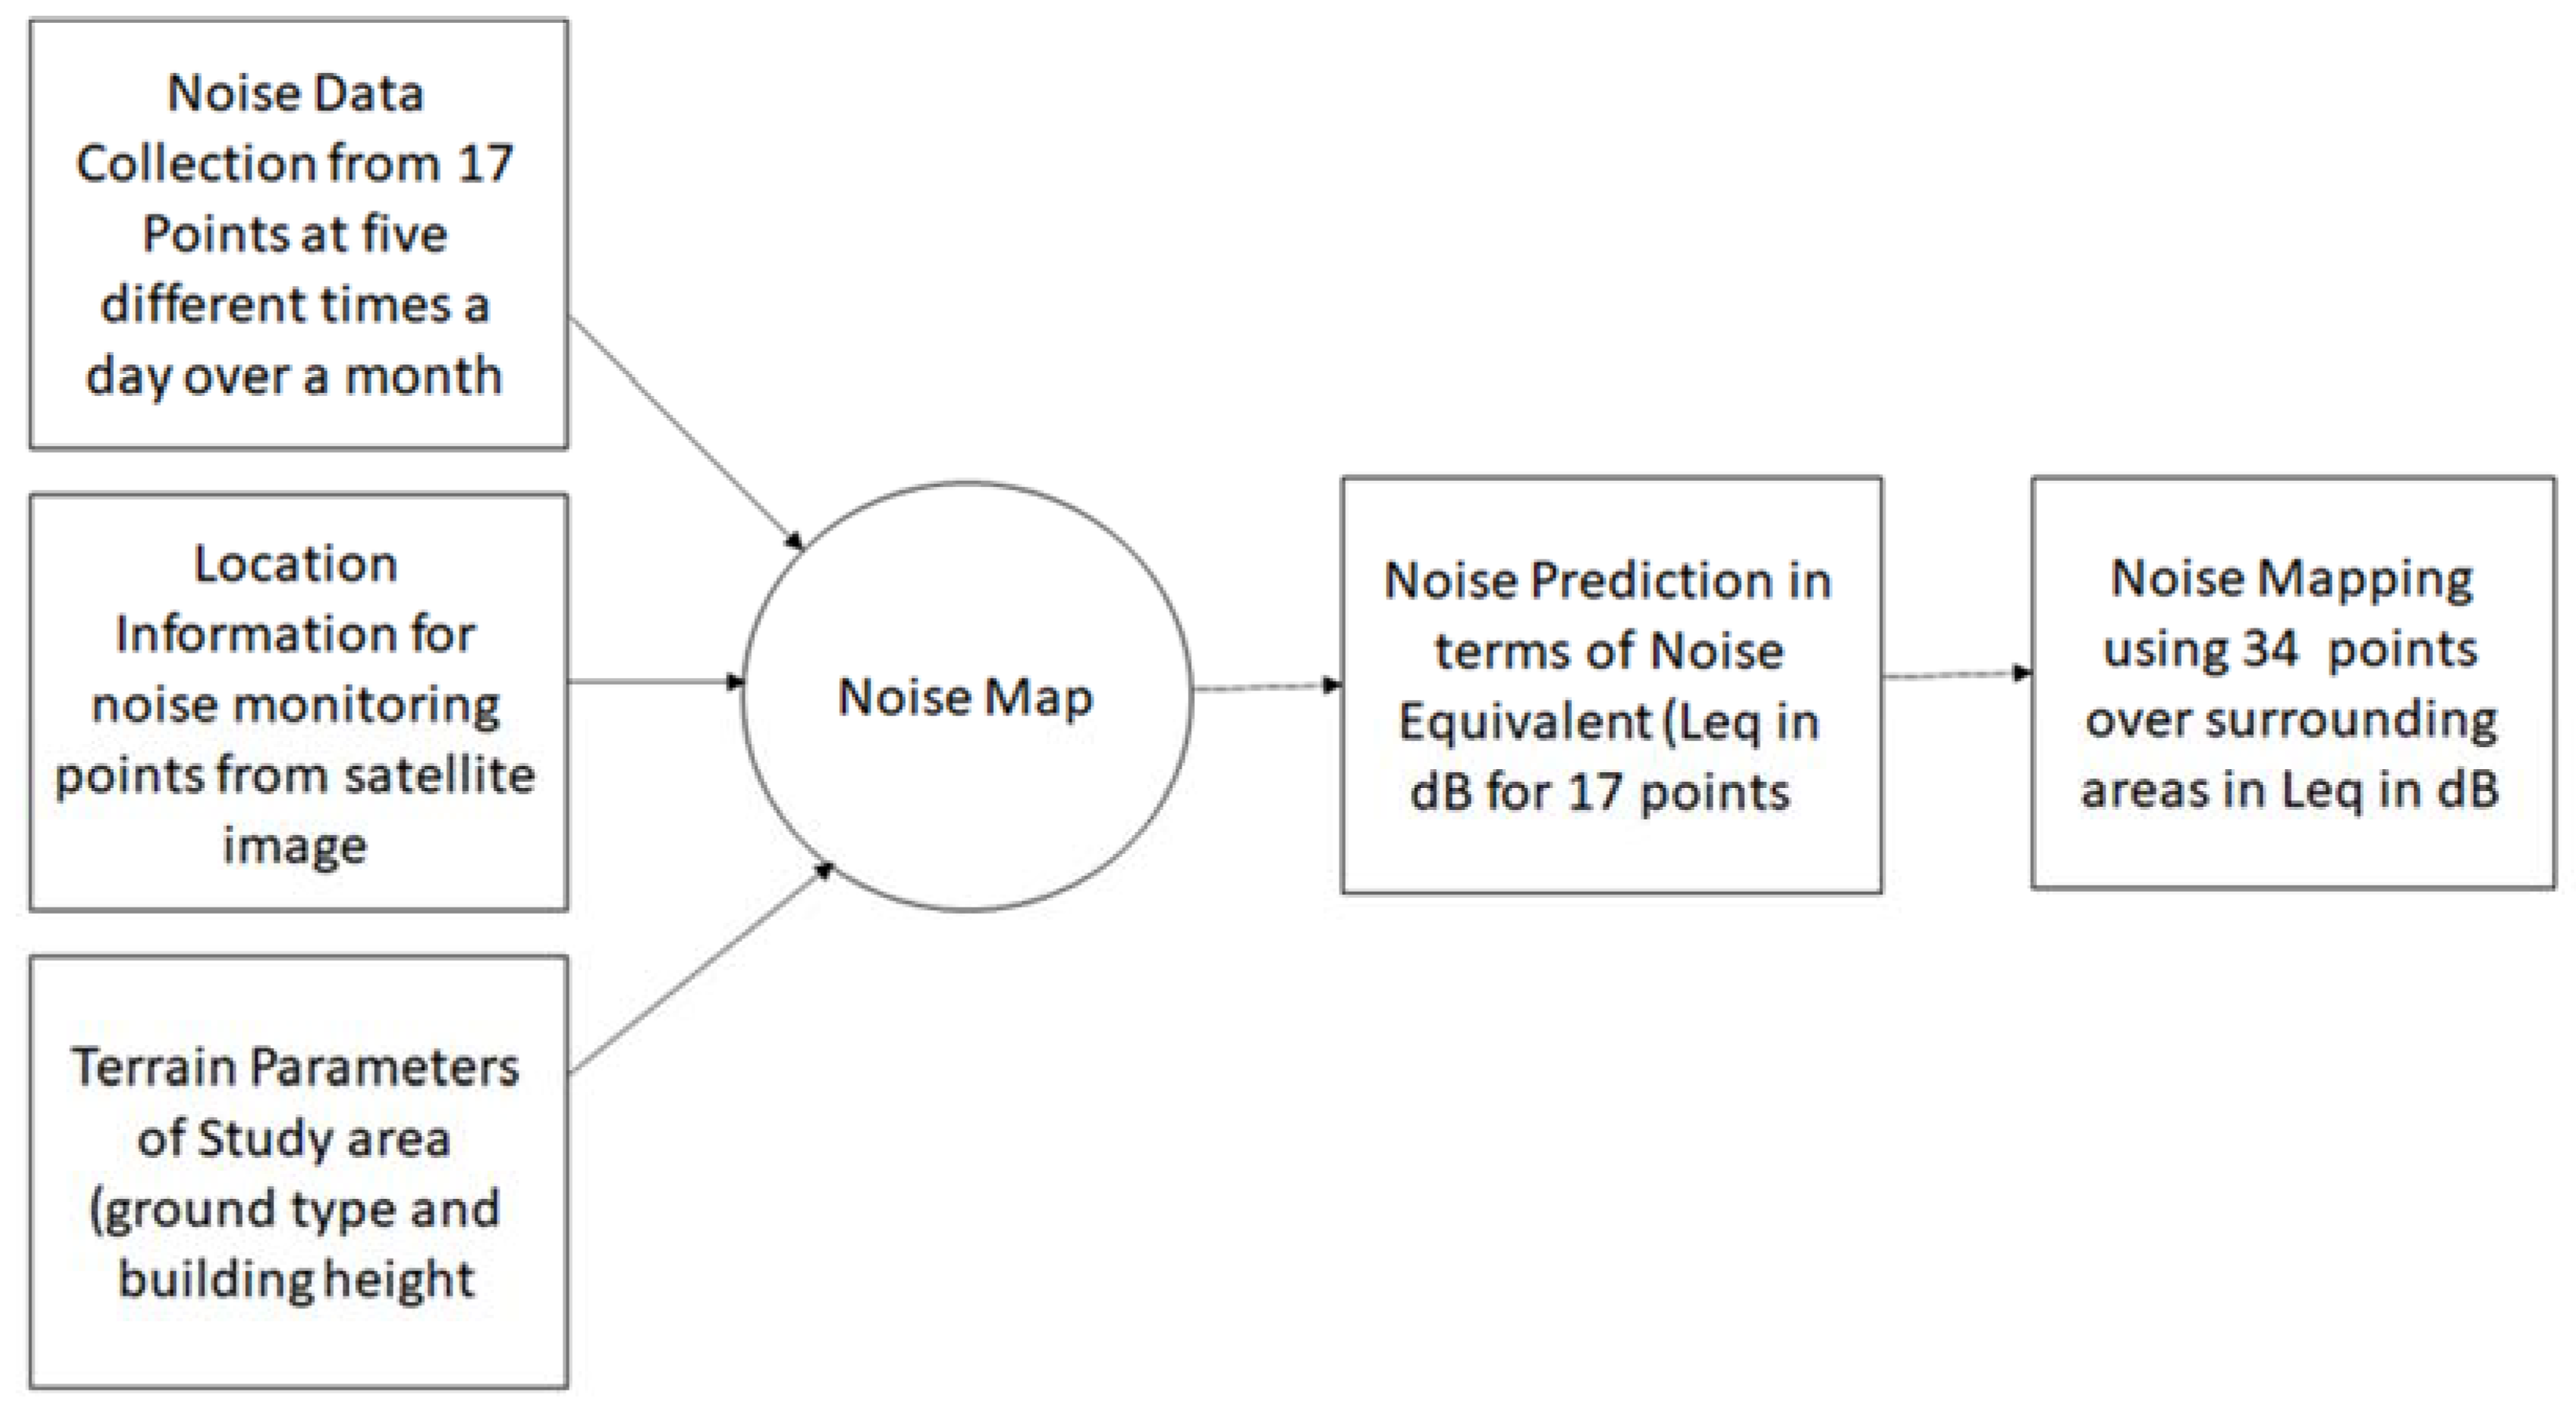
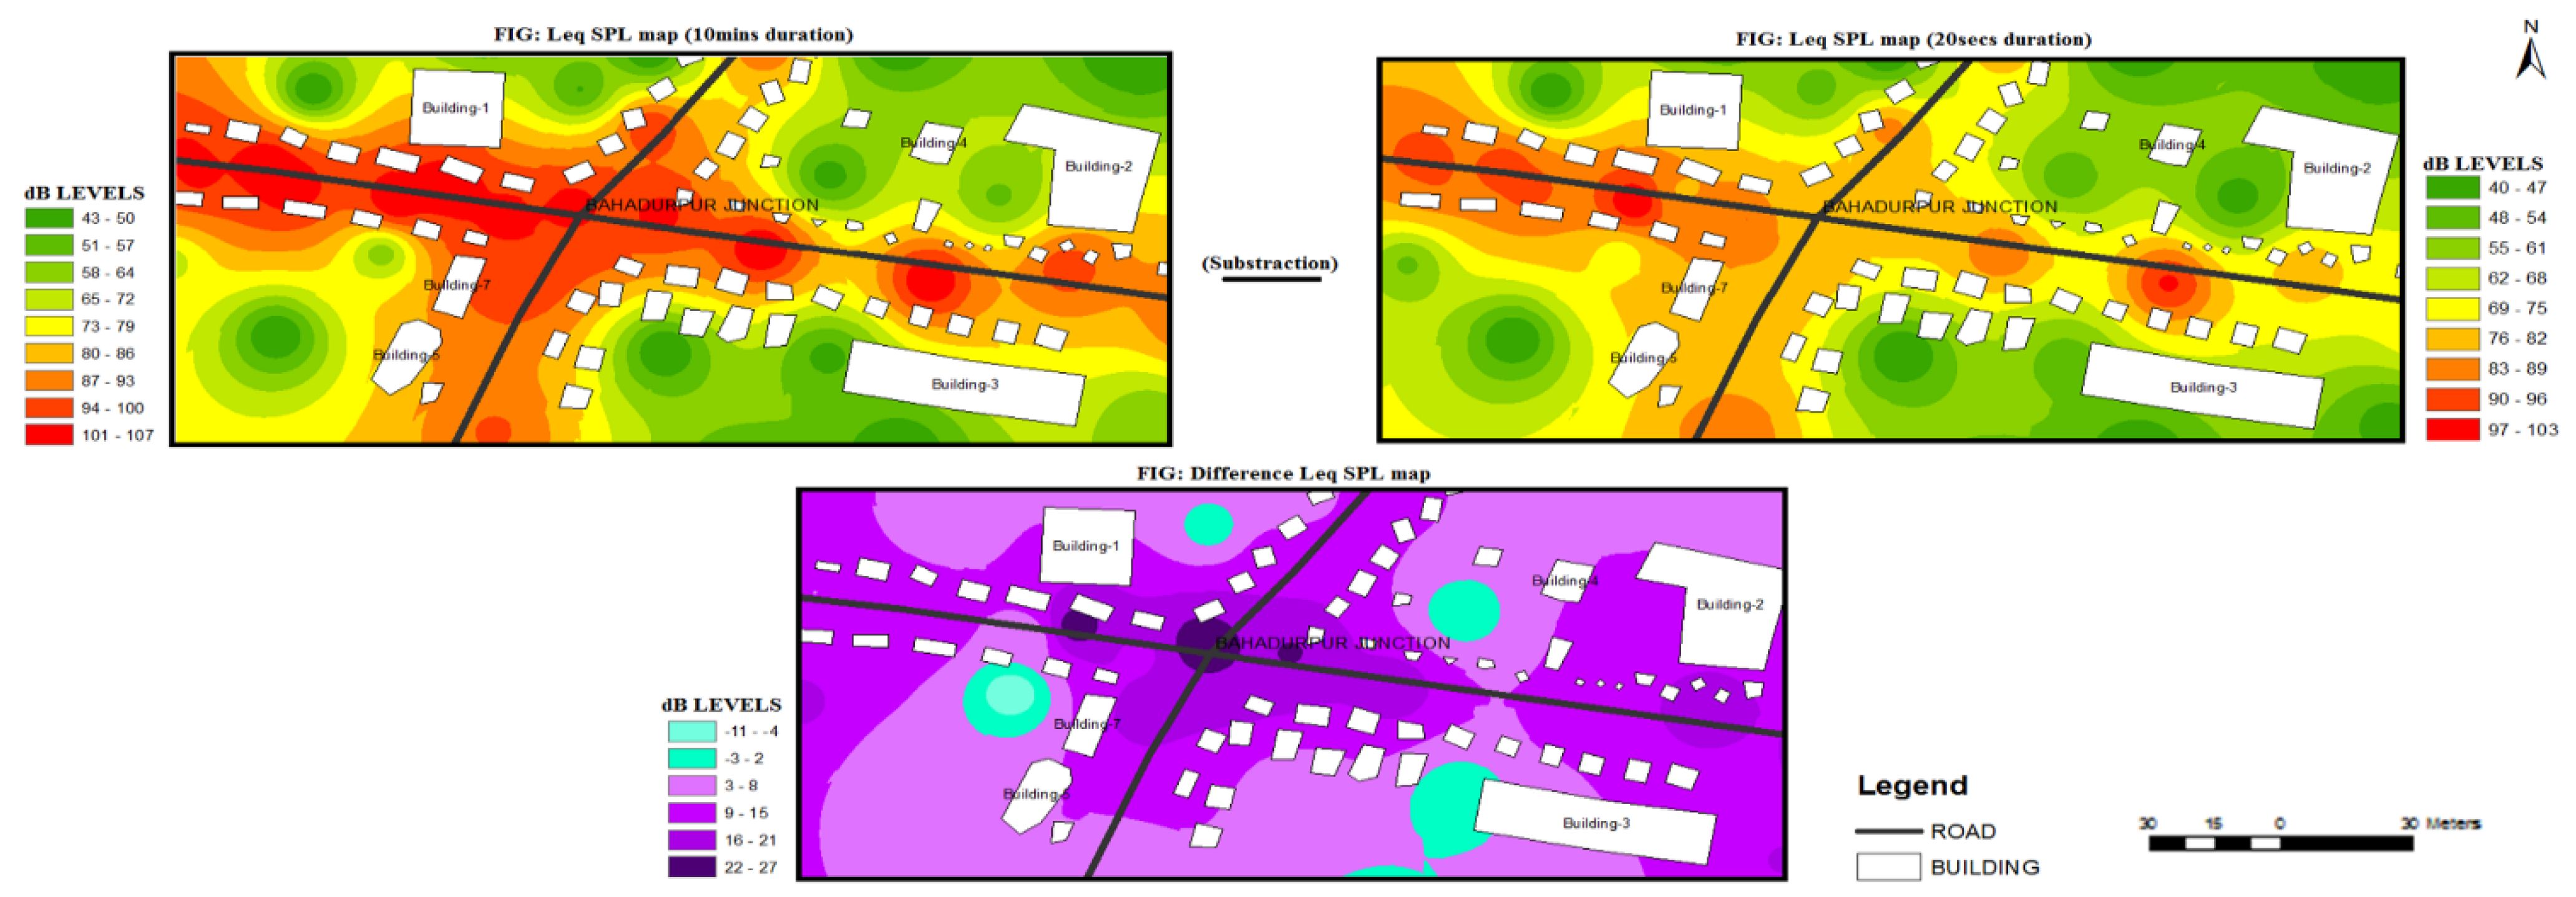
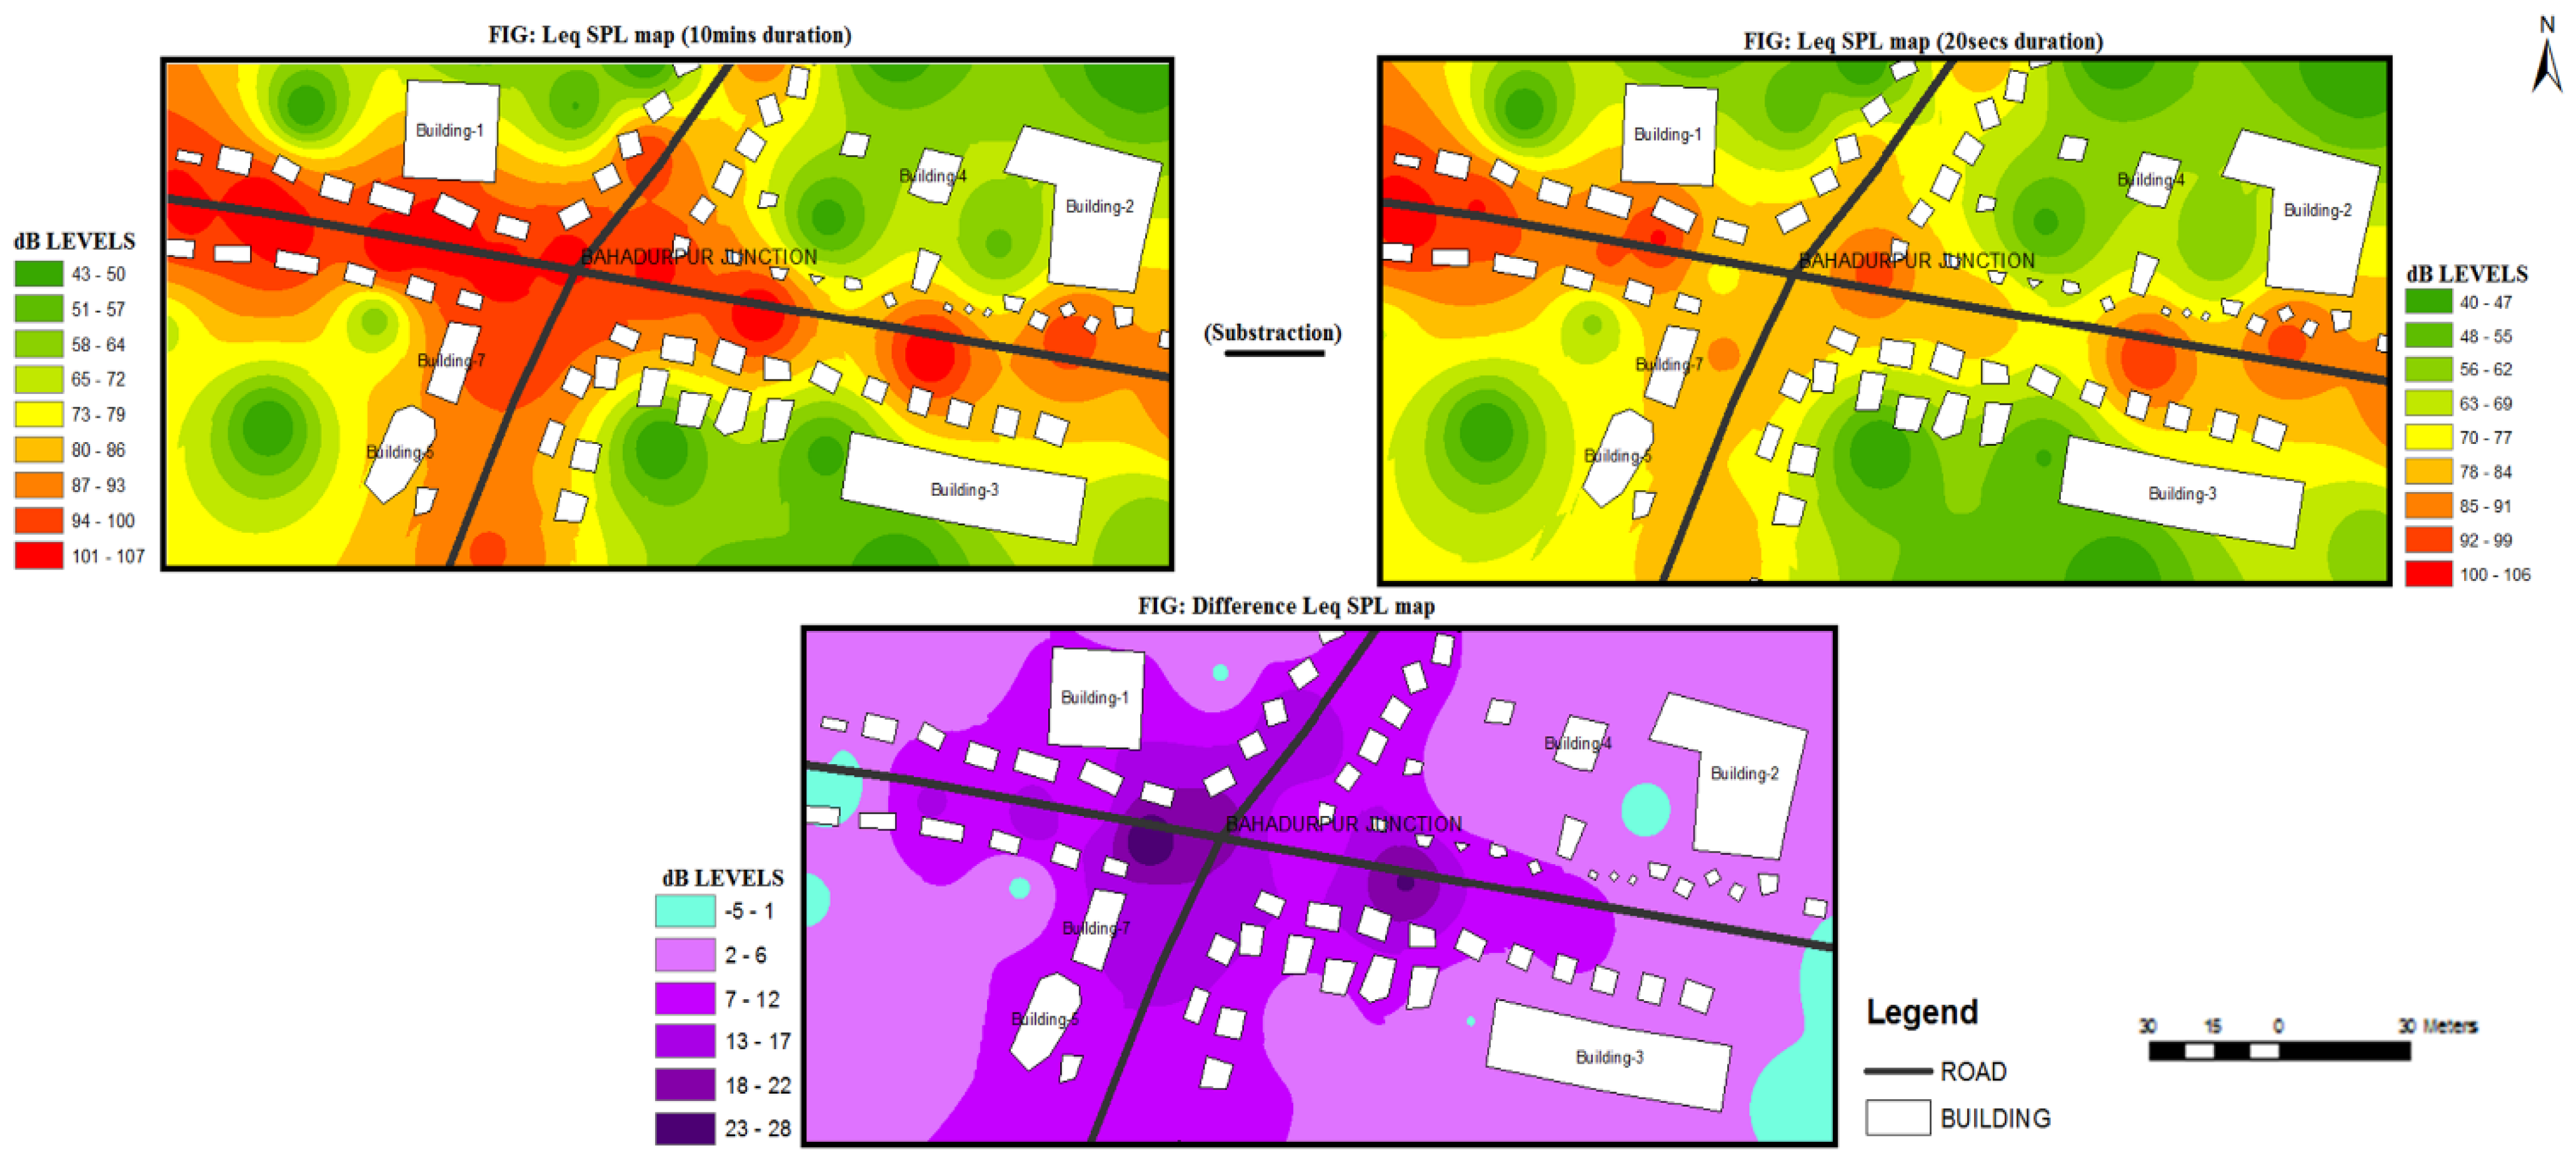
Table S1, Supplementary Material). Noise data was monitored close to road intersections (17 points) and away from the Bahadurpur intersections (17 points), strategically chosen for noise modeling. Similarly, noise samples were recorded five times a day (7:00–9:00 a.m., 9:00 a.m.–1:00 p.m., 1:00–3:00 p.m., 3:00–5:00 p.m., and 5:00–7:00 p.m.) for several days over a month. Noise samples were also taken for 10 min durations (assumed as long term), and 20 s duration (assumed as short term) at every instant. Different sampling durations were chosen to verify the impact of time-varying noise data on noise prediction. The noise data and terrain parameters between the source and predicting points were determined and integrated using a noise model. Licensed MATLAB 21 was used for the prediction of noise levels of desirous points at different times of the day. Sound pressure levels, Leq, and time of noise exposure were used to determine noise exposure levels using an exposure computing model. The SPL, Leq, and noise exposure levels of different points were used to generate a noise map (using licensed Arc GIS 10.2 software developed by ESRI, U.S.A.) and an exposure map for the different types of dwellers working or visiting the intersection.
The study tried to relate traffic noise exposure with the type of exposure. Noise can be short-term and impulsive or long-term at high intensity levels. Long-term noise levels as frequently found in the busy intersection of more than 75 dB can cause significant damage to the ear. Audiometry studies the physical damage to the ear. In audiometry, noises of different frequencies and intensities are played to ears to check the minimum threshold level of hearing at different frequencies. The traffic noise can induce auditory damage hearing loss, tinnitus, etc. The traffic noise can also induce non-auditory damage in the cardiovascular system causing, cardiovascular disease, hypertension, stroke, etc. It can also negatively contribute to psychoacoustic abilities in human beings, causing annoyance, sleep disturbance, cognitive dysfunction, reading ability, depression, etc. Various health hazards were evaluated for the dwellers working (living near) the developing city crossing in relation to the extent of exposure to traffic noise.
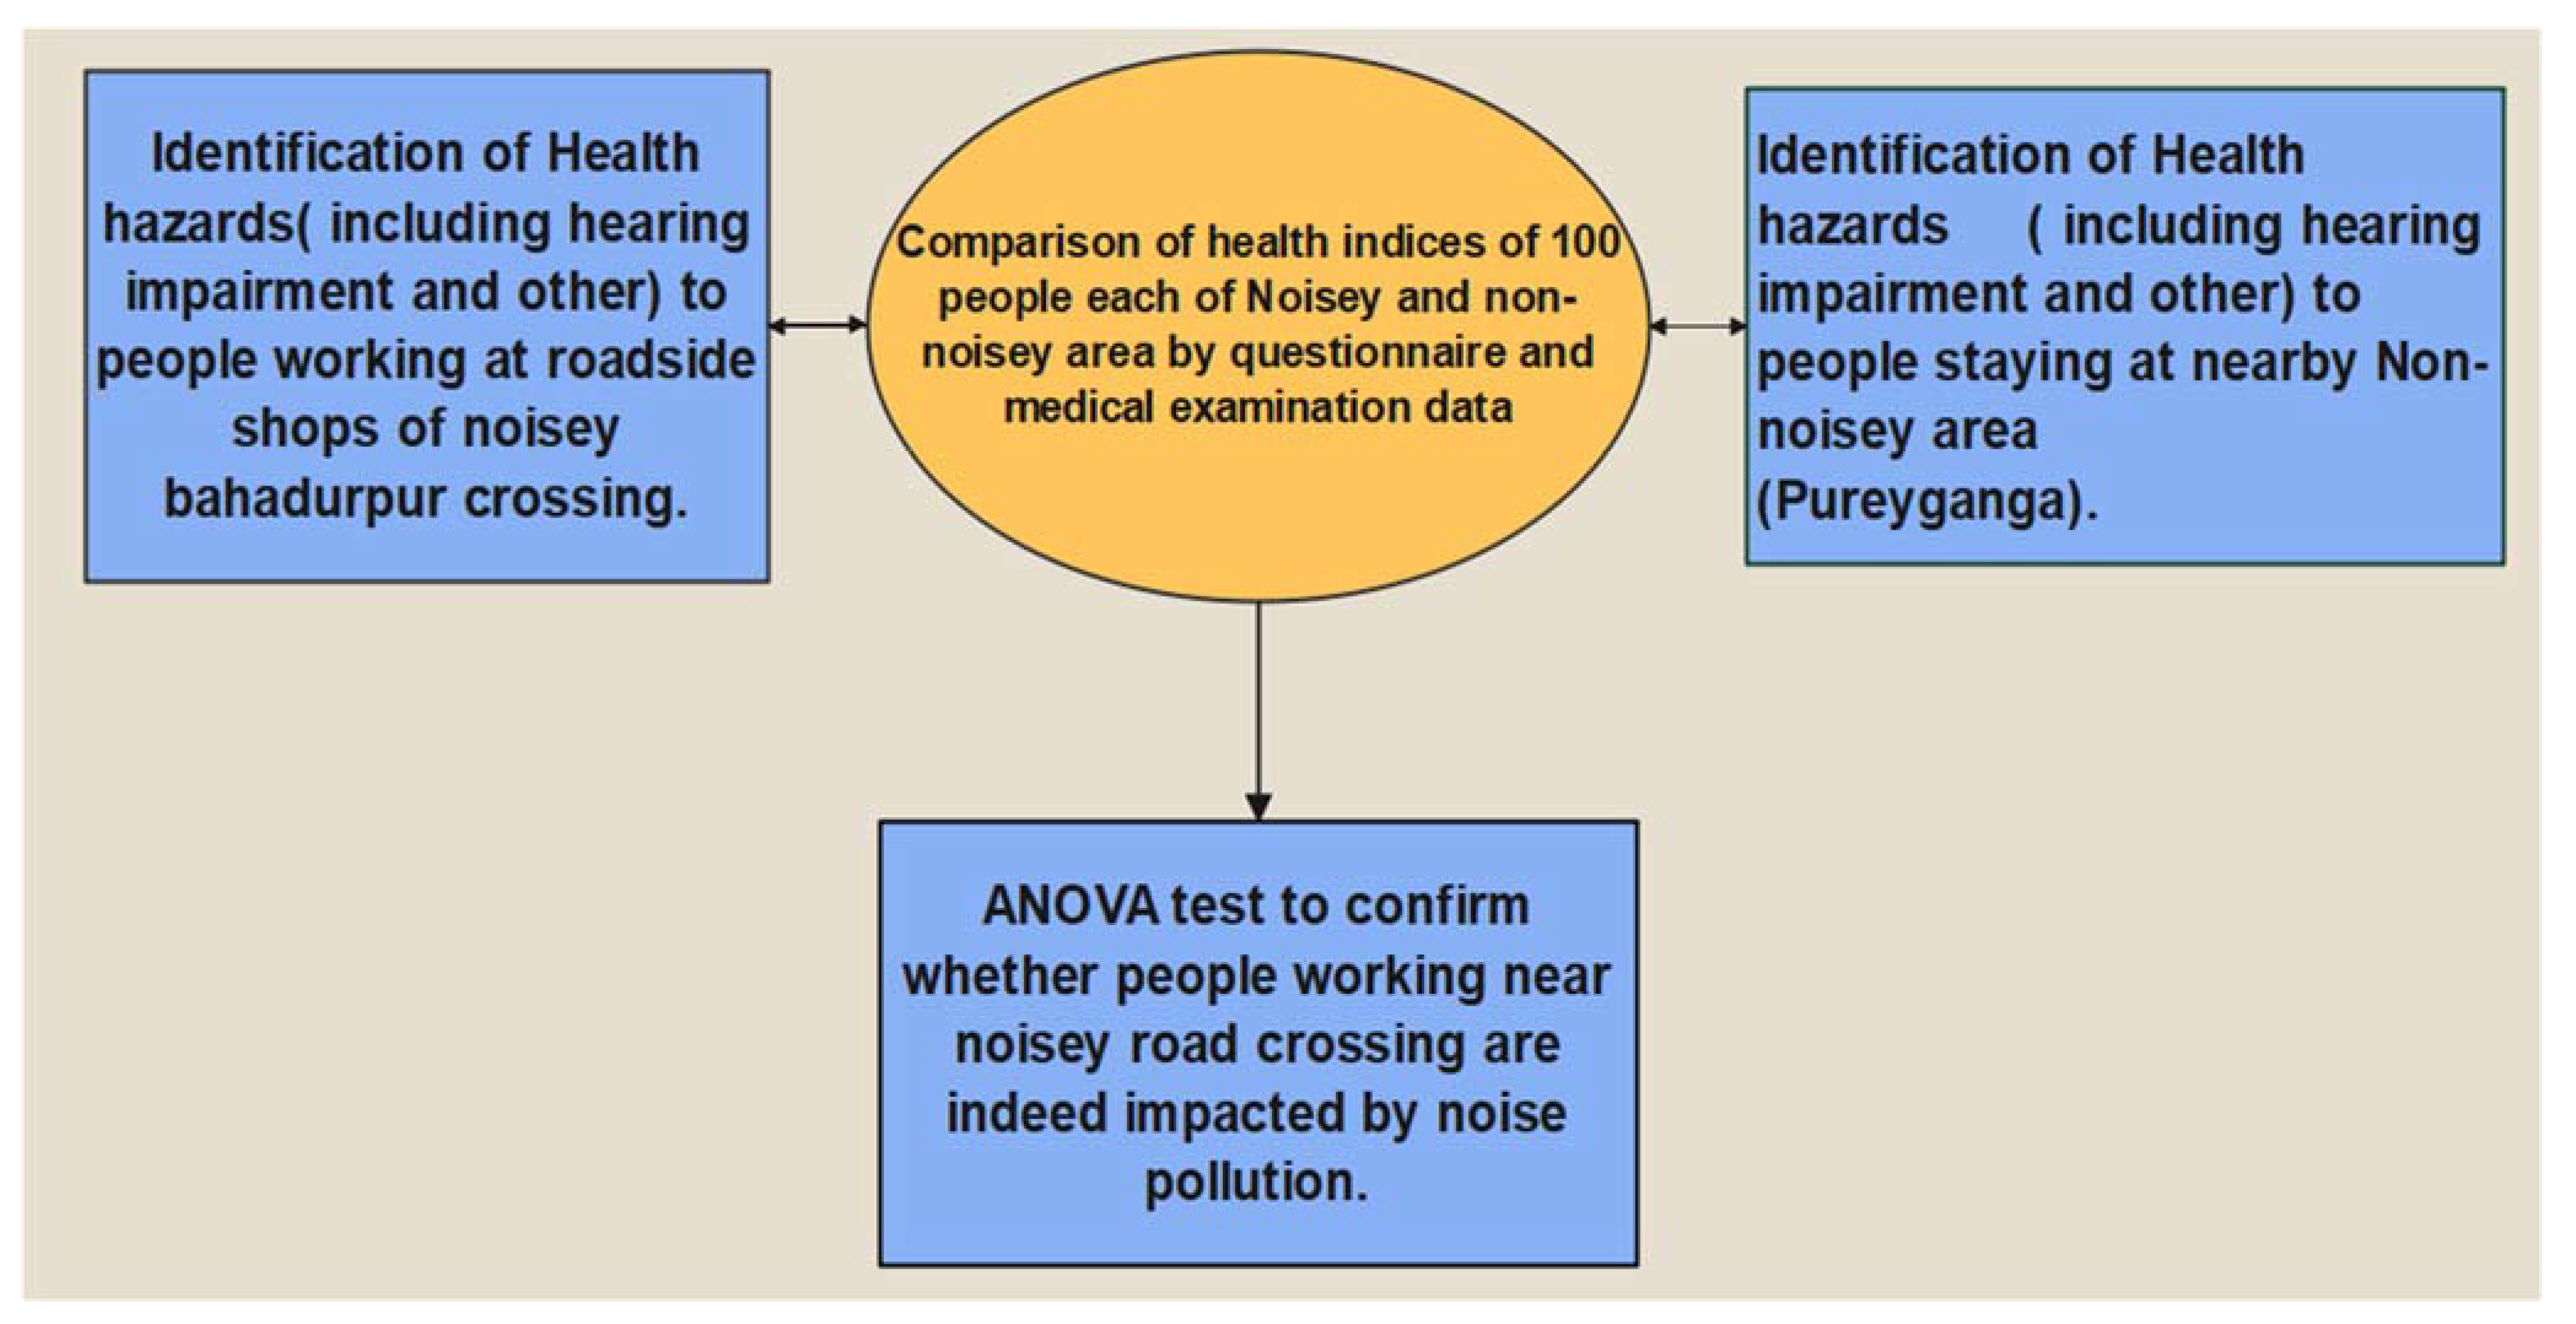
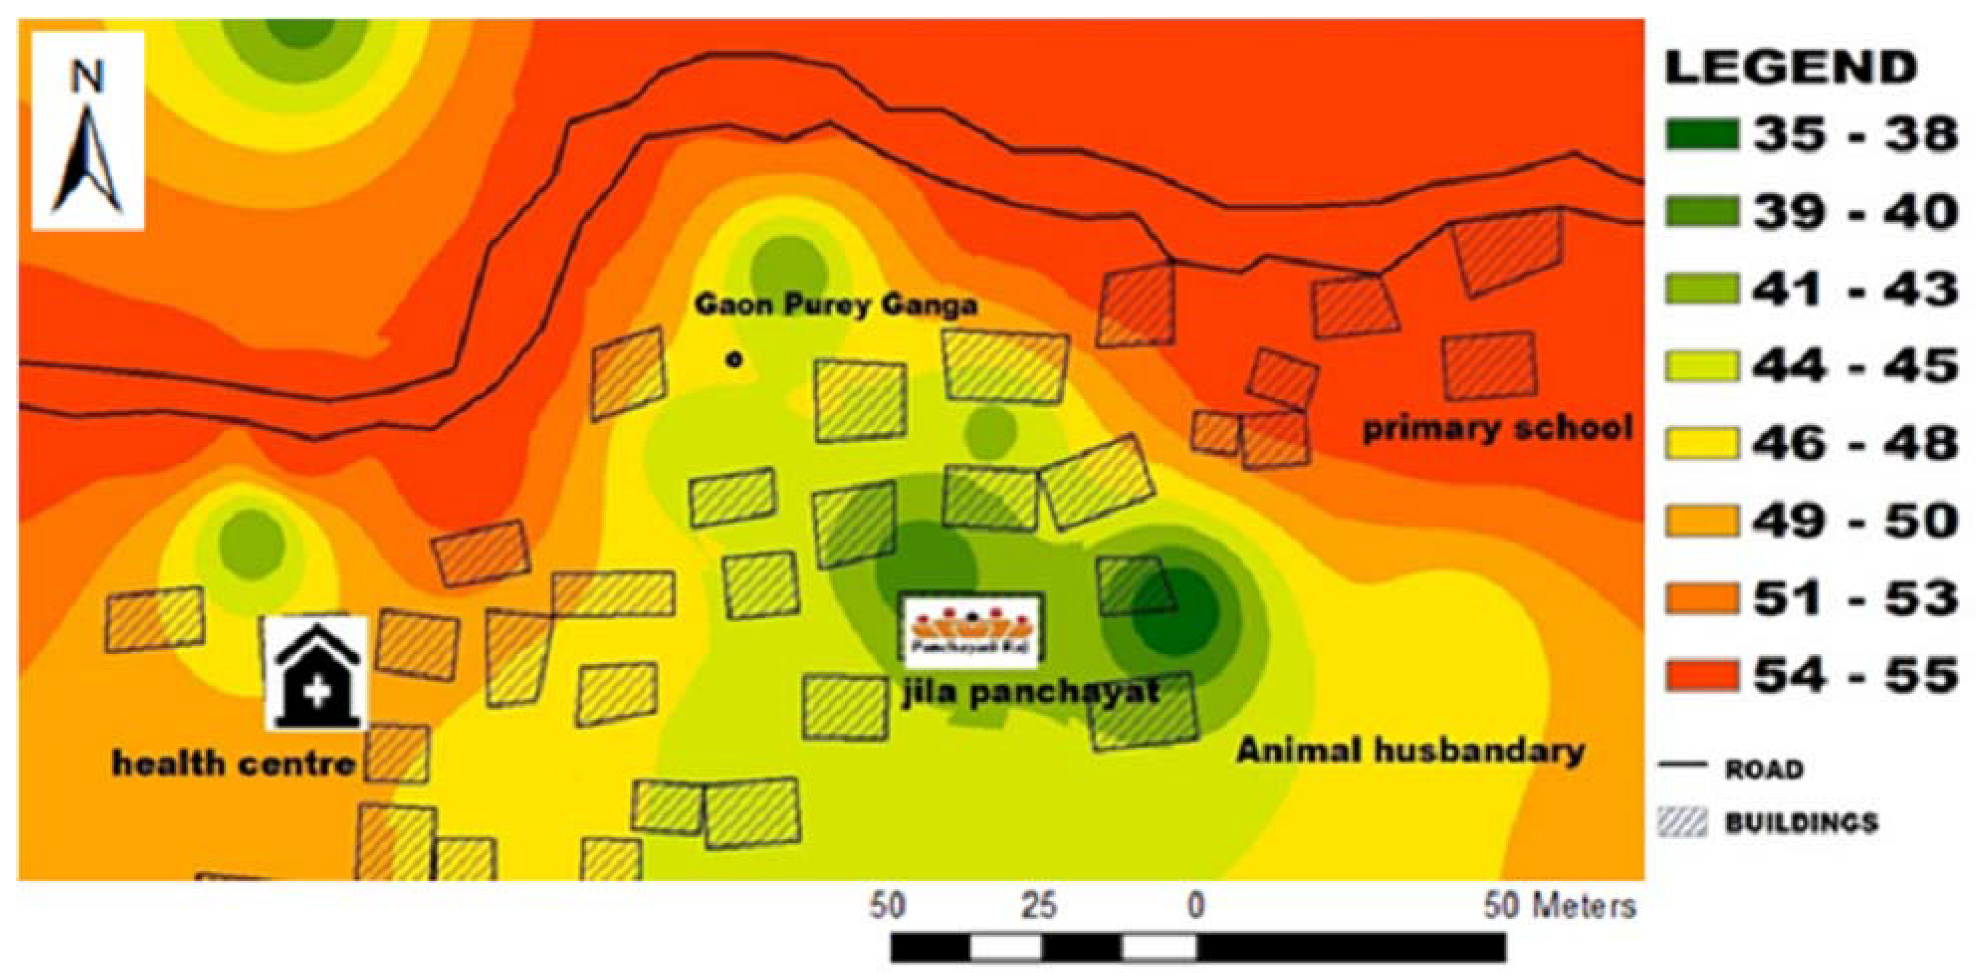
It was understood that the health hazards for the dwellers of the developing noisy city intersection can be thought to be primarily caused due to noise pollution. Thus, a nearby area that is less noisy may not cause similar health hazards to people living there. Thus, noise mapping and health hazard assessment were made for a second study site, Pure Ganga. The second study was about 2 km away from the first study site and 2 km away from any kind of noisy road traffic. An audiometric test, a medical test, and a questionnaire were conducted for study site 1 and study site 2 to record the health hazards.
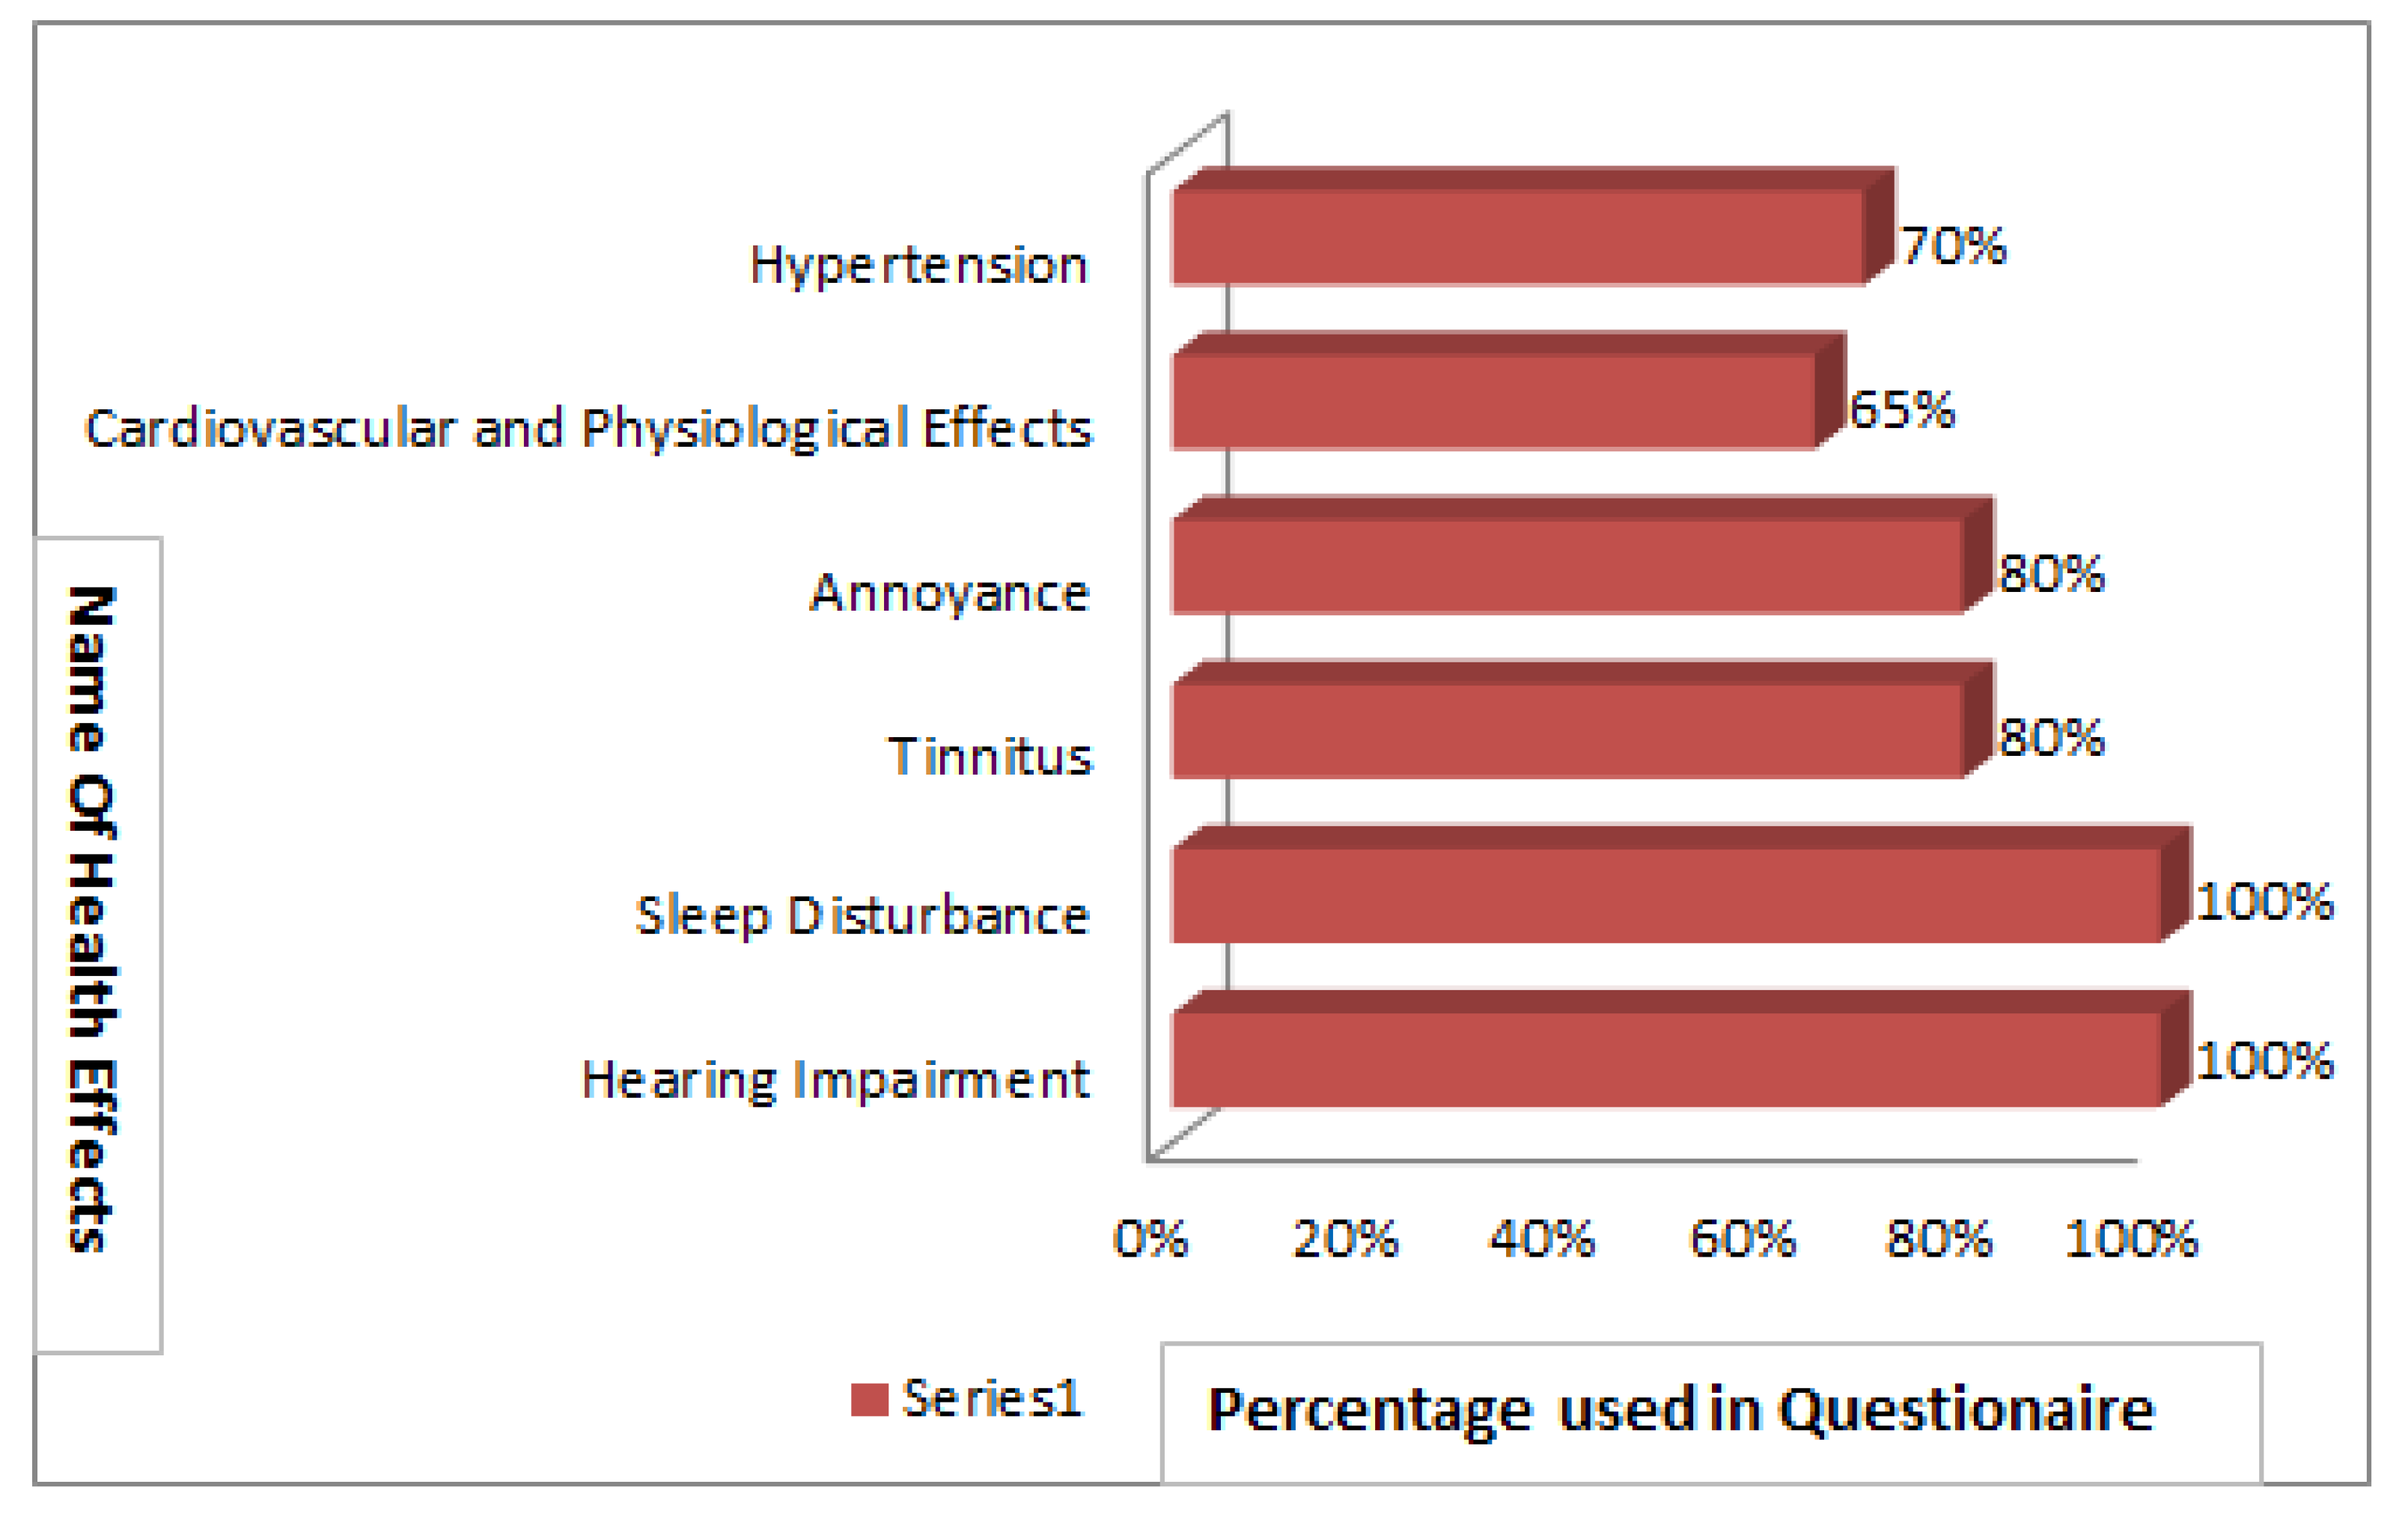
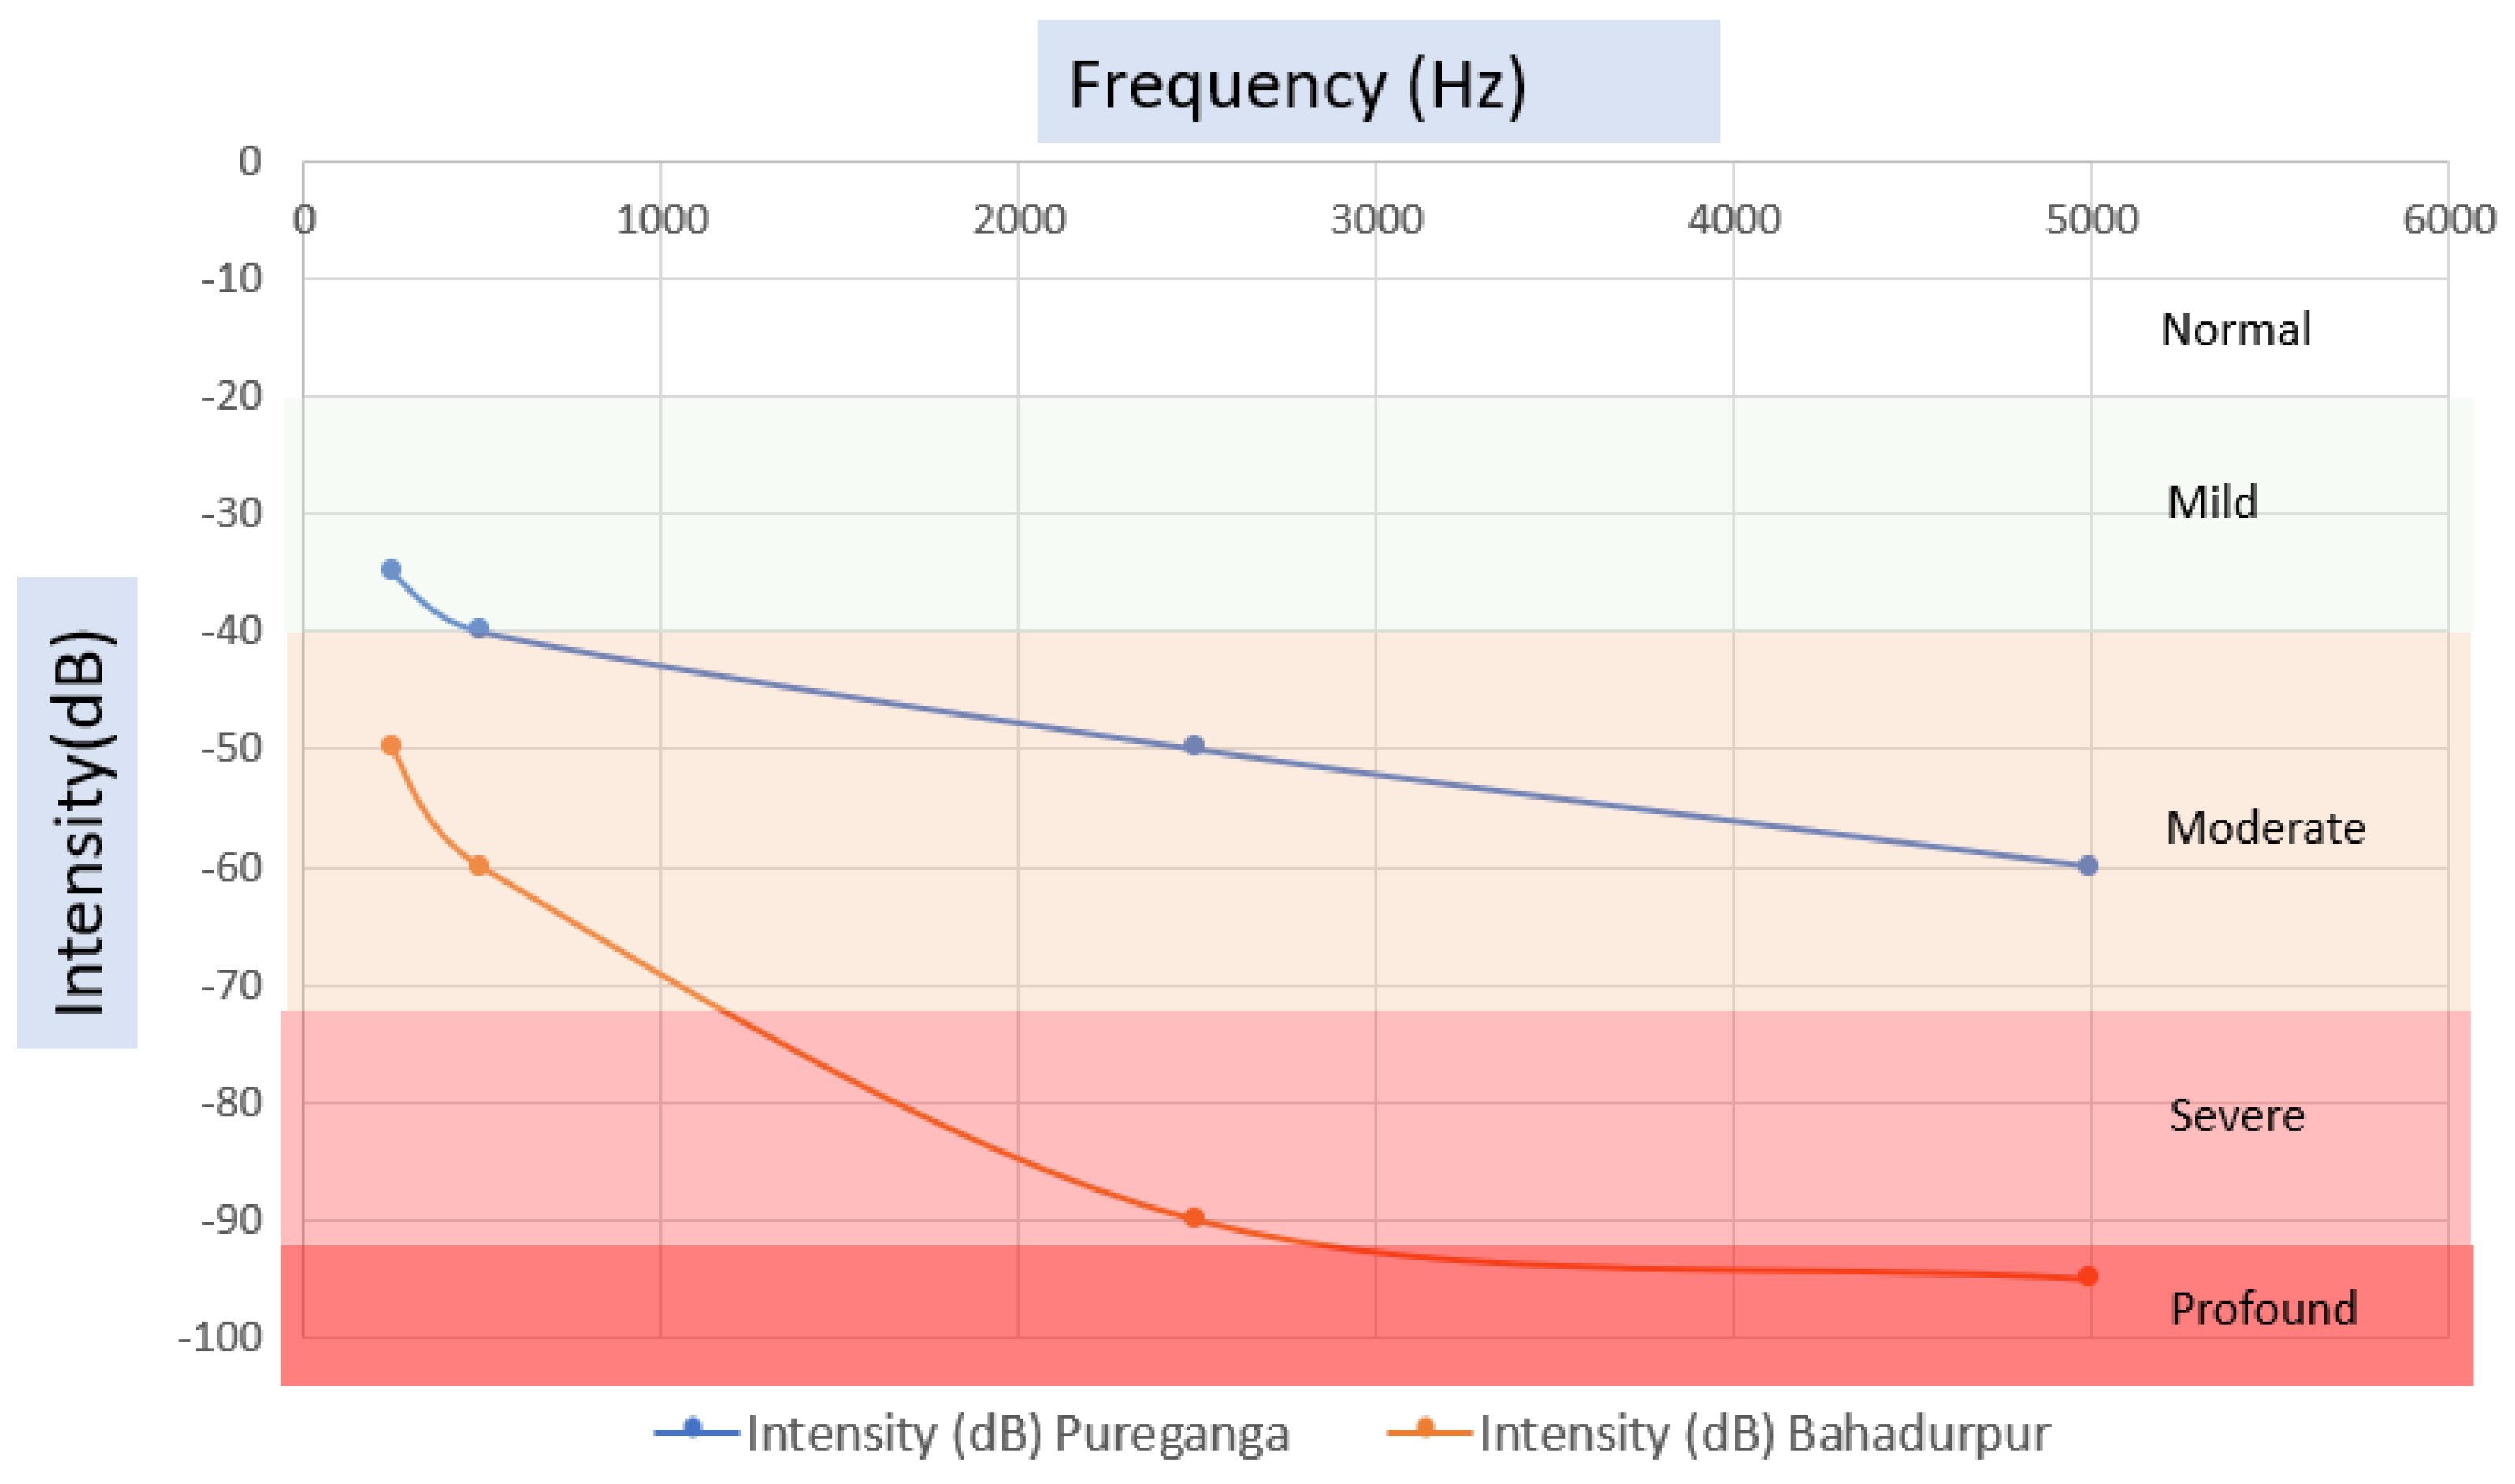
The authors conducted a study of 100 people living near to and far from the source (about 2 km distant) of the primary site. Based on the similarities of both locations, the authors considered that these should be the best locations for this study. The same type of people live in both locations in terms of their lifestyle, food habits, social status, and medical facilities. The only factor that differed was their working location. Based on comparable research survey sources, the authors framed 20 questions (for details see Supplementary Material). Nine out of the twenty questions were about basic information, such as where you work, how many hours you worked there, and how long you’ve been there. The remnant 11 questions were based on any health-related problems he/she suffered from. Hazard assessment was also conducted through an audiometric test and a physiological test. In the audiometric test, a laptop and computer program generated tonal sound and was used to determine if the person in question suffered from a hearing impairment or not. It generated sounds of different frequencies from 250 Hz to 5000 Hz, and of different intensities, and was played using headphones. The person in question was asked if he/she heard the sound or not. Sounds of different intensities and frequencies are played. And the responders were asked about the minimum intensity for hearing the sound at a particular frequency. The loudness of speech and speech reception ability were also tested using an SPL meter to indirectly relate with a person’s loss in hearing abilities. The physiological test was conducted to measure blood pressure using a sphygmomanometer (Model No. Dr Trust ICHECK PRO 116). The survey was conducted by meeting each roadside dweller and conducting the test conveniently.

3. Methodology

The study tried to characterize the noise pollution at the developing city crossing. The characterization involved the generation of a noise map as a function of the time of day and an equivalent map averaged over different time periods. The time-varying noise loads experienced by the dwellers working (or living near) the intersection is related to the noise exposure map. The vendors working at the roadside shops for 8–10 h in a day will have an exposure map while visitors to intersections will have different loads of exposure. The research tried to establish a relationship between the noise map and the noise exposure map (Figure 6) and then the noise exposure map and noise hazard identification. The methodology is outlined by a discussion on noise mapping, through the use of noise monitoring, noise modeling, and noise prediction. A time-specific experience of noise load is then related to the generation of the noise exposure map. Finally, the hazard to noise exposure is identified using an audiometric test, a questionnaires, and physiological tests as discussed earlier.

3.1. Characterization of Noise Pollution at Developing Intersection

Noise data monitoring: In this research, the requirement was to evolve techniques for noise characterization at the intersection using noise mapping and then identifying the health hazards and relating them with the noise pollution. Noise data and terrain data were collected for noise prediction, and authors being natives of the area, had prior knowledge about the variability of noise (in terms of space and time). A total of 17 points near the roads and 17 points away from the roads were chosen. The points were separated by about 60–75 m between themselves, covering the road corridor fairly. The guiding principle was to monitor the noise variability adequately without setting up a very dense network of points that would be very difficult to manage on the field. Understanding the variability in traffic noise levels in a day for the area meant different hours were chosen for the field monitoring of noise levels, which were 7:00–9:00 a.m., 9:00 a.m.–1:00 p.m., 1:00–3:00 p.m., 3:00–5:00 p.m., and 5:00–7:00 p.m. Further, the noise data were collected for 10 min (long-term) and 20 s (short-term) at each sampling hour, several times over a month. Different sampling time periods were tried to characterize the noise levels for the intersection comprehensively. The author’s previous work and literature guided in deciding the important hours of monitoring and choosing the sampling durations [32,33]. Further, the testing and development of the technique were aimed at managing a solution with the least reasonable sampling.
Noise modeling and mapping: To overcome the limitations of noise data monitoring, in terms of the number of locations or hours, or sampling periods, noise prediction was done by using noise modeling. The noise model inputs noise data (of source) and terrain data (over which noise propagates) for noise prediction. Noise modeling allows the prediction of noise levels at many outdoor locations and requires the computation of attenuations (losses). During propagation from a source, the noise gets attenuated due to distance (from the noise source), building, ground, etc., placed between the noise source and noise-receiving locations.
The noise levels at source SPLS are related to the noise level at the receiver SPLR with the following relationship (where SPL is Sound Pressure Level expressed in dB).
S P L 2 = S P L 1 20 log R 2 R 1
where;
S P L 2 Sound pressure level at point 1
S P L 1 Sound pressure level at point 2
R 1 Distance from the sound source to point 1, and
R 2 Distance from the sound source to point 2
A D = 20 log d S R + 11
A B = 5.65 + 66 N 1 + 244 N 2 + 287 N 3  
where;
d S R Distance between source and receiver
A D Distance Attenuation
A B Building Attenuation
N Fresnel Number
A G Ground Attenuation.
Since it is not possible to monitor the noise levels at every location, the noise levels are predicted using a noise model. The noise model can predict the likely noise level at a location for a time. It can be used to predict the noise level at a different time in the day or as Leq (Equivalent Sound Pressure Level) for an hour, for the daytime, or nighttime, or for the whole day. Further, the predicted noise levels of different locations can be expanded and represented for an area using a noise map in GIS using different interpolation techniques (e.g., IDW = Inverse Distance Weight). In order to showcase the noise levels of different locations in the study, area noise maps were generated. The predicted noise levels and noise maps were expected to indicate noisy areas and non-noisy areas. The extent of the area around the road corridor can be considered hazardous. It can also inform which time of the day the area is likely to be very noisy. It can indicate the impact of sampling duration on correct noisy/hazardous zonation mapping as well.
Noise exposure mapping: Noise exposure mapping can indicate the potential of exposure to noise and there is a formulation to determine it, which is especially used in the industrial working environment [29,34]. The areas adjacent to roads in the study area can be vulnerable, based on the perspective of noise pollution. As many vendors, sellers, and hawkers work at the edge (on the pavement, within 1 meter from the road edge) of the noisy road intersection for 8–10 h daily. In most cases, these shops are housed in semi-covered or uncovered spaces at the road fringes, forcing direct influence on high noise levels. Considering the above phenomena in the study area, the authors utilized the exposure relationship to compute the noise hazards for the dwellers. The relationship needs the noise levels and the duration of exposure to compute the noise exposure level. The formula (given below) for the computation of the noise exposure level is normalized to 8 h, the standard working shift in industry (it is also recommended to keep it to 8 h, even if the workers′ exposure exceeds 8 h, which is the case for the study area). Once noise exposure levels are computed, it is tested against the standard limit of 85 dB to confirm cases of overexposure. The computation of noise exposure requires the knowledge of the average noise level for the duration. The predicted and mapped noise levels of the study area were used for the noise exposure computation. The computation of noise exposure levels for the study area was conducted in two different ways. (1) Using the daytime equivalent (Leq) noise levels: Leq was computed using the exposure duration of 10 h to relate the exposure for the vendors working in open. (2) Cyclic trip exposure for visitors: exposure to the visitors was computed when involved in a cyclic trip to the noisy road intersection for duration of 1 h and 30 min. In the cyclic trip to the intersection, a visitor moved through road point 1 to point 17 and back in a stop-and-go mode, and noise levels were recorded, and mapped for noise exposure computation.
The formula for the calculation of noise exposure (Occupational Health Clinics for Ontario Workers Inc.by Ontario Ministry of Labor, Canada) is given below.
L e x , 8 = 10   L o g 10 [   i = 1 n       ( t i   ×   10 0.1 S P L i   ) ] 8
L e x , 8 The equivalent sound exposure level in 8 h
Σ Sum of the values in the enclosed expression for all noise incidents from i = 1 to n
i Distance incident leading to noise level impacted worker/dweller
t i   The duration in hours of i
S P L i The sound level of dB
The above formula was used with noise levels and exposure duration for noise exposure level computation.
Noise mapping and noise exposure mapping cases at study site: The researchers used the above approaches to relate noise pollution to noise hazards (Figure 7). Authors divided the study into the following groups of prediction and mapping:
(i)
Noise mapping in terms of Leq
(ii)
Long-duration data vs. short-duration noise monitoring for noise mapping
(iii)
Noise exposure map prediction
(iv)
Noise exposure mapping for visitors to intersection
Figure 7. Difference in Predicted Noise Levels Maps for noisy Bahadurpur Intersection.
Acoustics 05 00006 g007

3.1.1. Prediction and Mapping of Noise Levels for Noisy Bahadurpur Intersection in Terms of Leq

(Noise levels were monitored within M1, M2…. M5 interval for 10 min each day over a month for prediction and determining 12 h Leq, and generating noise map).
In this method (Figure 8), the authors used 34 location points. Out of these 34, 17 points were considered as source points (near roads) and they were fixed on the road corridor. The other 17 points were considered receiver points (away points). At the source point, data was collected throughout the day over the month and this point was marked with a permanent marker to identify the point easily. Data was collected at these points for duration of 10 minutes at every source point around the road corridor in the distributed form, where the authors collected the noise value using a sound pressure level meter (Table S1). At the 17 receiver points the authors calculated the noise value using an attenuation formula. Time instants for noise monitoring and mapping were M1: 7:00–9:00 a.m., M2: 9:00 a.m.–1:00 p.m., M3: 1:00–3:00 p.m., M4: 3:00–5:00 p.m., and M5: 5:00–7:00 p.m. Here, the authors have used different types of attenuation (building attenuation and distance attenuation) for noise prediction. Based on these data, the authors calculated the Leq noise value for this area. Predicted Leq noise levels were interpolated in ArcGIS using the IDW technique for the generation of the noise map.

3.1.2. Long Duration vs. Short Duration of Monitoring Prediction-Based Mapping

Variation in predicted noise levels for noisy Bahadurpur intersection using long-term and short-term noise sampling duration (Figure 8). In this method, the authors used long-duration data at 34 locations and out of these, 17 points were received as source points and 17 points as a receiver point for 10 min duration in SPL mode. The Leq value was then calculated. The short-duration data were also recorded at five different times (M1 to M5) for 20 s durations at each point. Considering 34 points for data collection, out of these there were 17 source points (near roads) and 17 receiver points (away points). Noise levels were predicted for 17 receiver points and were verified with ground data. Leq for 34 points were computed and were used to generate a short-term noise map using GIS IDW interpolation. After that, the results for long-duration data and short-duration were compared and the difference and impact on the results due to data duration were derived (Supplementary Material Table S2).

3.1.3. Noise Exposure Mapping

Noise exposure level mapping for noisy Bahadurpur intersection for the people working in roadside shops for 10 h daily (using equivalent noise levels) (Figure 9).
Noise exposure was calculated based on the noise value for 17 different source points and 17 receiver points, and the exposure levels were normalized for 8 h. The duration of exposure was taken based on standard 8 h shift as practiced globally for industrial work or commercial work. For the calculation of noise exposure, authors considered the Leq noise value for a particular location. Noise exposure was calculated based on the formula given by Occupational Health Clinics for Ontario Workers Inc., explained above (Equation (4)).

3.1.4. Noise Exposure Mapping for the Visitors to Intersection

Noise exposure level mapping for the visitors to noisy Bahadurpur intersection for short duration of 1.5 h (exhibited for three different times in the day, that is, 9:00–10:30 a.m., 1:00–2:30 p.m., and 5:00–6:30 p.m.). Determined following measurement of noise levels at points 1 to 17, (Figure 10).
Noise exposure levels were calculated for a short time, i.e., 1.5 h. It was based on the one cycle of traverse at a noisy Bahadurpur intersection completed in 1.5 h. This study was mainly focused on the visitor(s) who wanted to go to the marketplace at the Bahadurpur intersection within high traffic road corridor through the 17 road points and return to their original point on road. During their travel, he/she got different noise levels at various places, and they spent different time periods there before moving to the next point before they completed their journey, which took nearly 1.5 h. The noise exposure levels were calculated at three different times: 9:00–10:30 a.m., 1:00–2:30 p.m., and 5:00–6:30 p.m., by using the monitored noise level data of 17 different locations. Further, the time taken to move from one location to the next location was maintained at 5 min. It was assumed that the visitor was moving in an open vehicle, getting direct exposure to noise. The surveyor traveled on a scooter and traveled at 40 km/h and moved in a stop-and-go mode (e.g., record the noise level at point 1, start the journey, travel from point 1 to point 2, stop, record the noise levels at point 2, resume traveling for point 3, stop, record noise level, so on). The noise exposure formula was used for the calculation of the noise level for a visitor to a noisy intersection (Table S3 Supplementary Material).

3.2. Identification of Health Hazards of Noise Exposure for Developing City Intersection

It was attempted to determine the health hazards of noise. Health parameters such as tinnitus, hypertension, sleep disturbance, annoyance, etc. were evaluated using a questionnaire and physiological measurements. Similarly, tests were conducted to evaluate hearing impairment using an audiometric test (Figure 11). Various tonal sounds were generated and dwellers working near the noisy corridor were tested to recognize the sound of different frequencies and intensities. Hearing impairments were related to the levels of noise pollution in the nearby area. It was required to justify that the health hazards experienced at the noisy Bahadurpur intersection were indeed due to noise exposure. Thus, the hearing impairments and other health deficiencies recorded at the noisy Bahadurpur road intersection were compared with the health deficiency of people of the nearby non-noisy study site. Pure Ganga was the least noisy study site having an area of 250 m × 250 m. The identification and comparison of health hazards in Pure Ganga area required the generation of a noise map of Pure Ganga and the estimation of health indices of the people staying there. Noise data were monitored for Pure Ganga (8 points) at three different times in a day. These data were used to predict and generate a noise map for the area. A questionnaire, physiological test, and audiometric tests were conducted to determine the health standards of the local residents. Finally, health parameters of the two study areas were compared statistically to confirm the health impact of noise exposure at the noisy Bahadurpur intersection.
A questionnaire was conducted on 100 people, who were working around the Bahadurpur noisy road corridor for 10 h from 9:00 a.m. to 7:00 p.m. The sample data were collected from a set of different age groups, genders, and occupations. The survey was completed based on the different questions (Table S4 Supplementary Material) to investigate medical health indices related to tinnitus, annoyance, sleep disturbance, hypertensions, cardio-vascular ailments, etc. Additional tests were also conducted to check hearing impairments. Data was collected based on the different questions asked to the people regarding their health issues. A blood pressure measuring machine was also used to measure people’s blood pressure, along with their pulse rate. A laptop and computer program were used to generate tonal sounds at different frequencies (250 Hz to 5 KHz). The people were asked about their ability to hear the generated sounds in the controlled environment.
A similar questionnaire survey and medical tests were conducted on 100 people living away from the noisy road intersection, in village of Pure Ganga, Uttar Pradesh. These people were living and working in Pure Ganga. Their primary occupation was agriculture and/or animal husbandry. The same questionnaire was used for the investigation into the effects of noise on health. At the time of the survey, it was also kept in mind that there was no noise near the person (maintaining a controlled environment). The survey was completed on people of different age groups and on both males and females (Figure 12).
The authors prepared the questionnaire (Table S4 in Supplementary Material) containing questions on hearing impairment, sleep disturbance, tinnitus, hypertension, annoyance, etc. The most frequent questions (Table 1) and (Figure 13) found in the literature to study the noise-induced health hazards were used to design the questionnaire. In the questionnaire, various questions were asked to the responders to grade (rank) their levels of deficiencies in each.

4. Results

4.1. Leq Noise Prediction and Mapping

The Leq noise prediction and mapping were completed based on the 17 source points, which were along the road corridor. The 17 receiver points were distributed away from the noisy intersection. Daytime (7:00 a.m.–7:00 p.m.) equivalent sound pressure was determined for all points of the study area. Using 34 measured and predicted points, Leq noise levels were determined across the entire study area and mapped in Arc GIS. The highest dB value was 107 dB and the lowest dB value was found to be 43 dB (Figure 14).
The value of noise along the road corridor was high due to high traffic and it was found to be too low (in dB) when far away from the source point (due to different attenuations, that is, distance attenuation and building attenuation). The total area along the road corridor was affected with noise values from 87 dB to 107 dB. The people who worked around this corridor were expected to be affected by these high noise levels. These predicted results were validated with observed dB values for a number of locations. The result showed a deviation of nearly ±1–4 dB, indicating good accuracy in prediction.

4.2. Long Duration Data vs. Short Duration Data Noise Mapping

In this method, noise levels were predicted (in terms of Leq level) and mapped using sampled noise data from the study site of long duration (10 min) and short duration data (20 s) for every sampling location. The data were monitored at five different times on a day over a month. For details, (Table S2 Supplementary Material) can be seen.
The results showed (Figure 15, Figure 16, Figure 17, Figure 18 and Figure 19) some deviations between long-term and short-term equivalent sound pressure levels for five different times in a day. Mostly, the deviations were not very high for the M1 to M5 time slots. The shorter time of noise monitoring can also be used for noise data sampling. This study was helpful to determine possibilities of using less rigorous data sampling methods to reasonably map the noise levels in an area.

4.3. Noise Exposure Mapping for Bahadurpur Intersection

Noise exposure was calculated based on the noise value from the 17 source points and 17 receiver points totaling 34 points. In the results, it was very clearly seen that all areas at and around the road corridor gave 76–98 dB of noise exposure levels. Very significant parts of this corridor reflected an exposure of >85 dB. As a noise exposure value greater than 85 dB leads to hearing loss [53], the area will have serious hazards to noise exposure, including hearing loss. On the map, it is observed that a significant area is having an exposure level of greater than 85 dB. This noise exposure was calculated (Table S5 Supplementary Material) based on an 8 h normalizing time scale to identify the hazardous area. In this location, there were many shops and a few residential buildings where people work or live for business, official work, and residential purposes (Figure 20).

4.4. Noise Exposure Mapping for Visitor to Bahadurpur intersection

There are people who move away from the noisy intersection. However, they need to visit the noisy intersection to meet their daily needs. A likely case was considered when an individual (who moves more than 250 m away from the intersection) visits the intersection for shopping and meeting other needs and returns to his place in a round trip of about 1 h and 30 min. In this cyclic trip event of any visitor, the recorded noise levels were mapped (Figures S2–S4) in Supplementary Material during the round trips carried out at different times. In these studies, noise exposure levels were determined in dB at different times. Based on the event studied, the authors found that the minimum noise level value (in dB) over the area was 75 dB, and the maximum noise level value was 104 dB during the round trip. Changes in noise levels were observed when the vehicles were blowing horns while passing by. It was also dependent on the types of vehicles. Larger vehicles make noises of higher dB value compared to small vehicles. The study was based on the three different time intervals. The results of exposure maps were developed for 9:00–10:30 a.m., 1:00–2:30 p.m., and 5:00–6:30 p.m. (Figure 21, Figure 22 and Figure 23). Noise exposure levels in a 1.5 h round trip from 9:00–10:30 a.m. was 84.2 dB, from 1:00–2:30 p.m. was 79.8 dB, and from 5:00–6:30 p.m. was 90 dB. It was observed that the noise exposure levels were primarily less than 85 dB but in the evening it could be more than 85 dB, which is alarming. Thus, if a visitor visits the intersection regularly in the evening, it can seriously damage his hearing ability.

4.5. Study of Health Hazards of Noise Pollution for Noisy Intersections in Relation with Non-Noisy Area

The health hazard study was conducted across two study sites, of which one was near the noisy intersection (Bahadurpur intersection) and another was away from the noise sources (Pure Ganga village). The questionnaire survey and limited medical tests were conducted on over 100 people at each site. The noise maps for the noisy Bahadurpur intersection were already generated. A similar noise map (based on Leq, equivalent noise levels) was also generated for the Pure Ganga area with monitored noise levels of 15 points and was validated with 6 points. The GIS noise map for the Pure Ganga area (Figure 24).
At the Bahadurpur intersection, the authors surveyed 100 people from different age groups. The people were classified into two age groups, one was <40 in age and another was >40 in age. The authors classified the different diseases based on responses received from the people. Here, it was found (Table 2) that 75% of people (of <40 age group) were suffering from either of the diseases, i.e., tinnitus (12%), anxiety (13%), high BP (9%), cardiovascular (6%), stress (11%) sleep disturbance (8%), multiple diseases (16%) and not suffering from any disease (25%). In the second class of the >40 age group, it was found that 92% of people were suffering from any of the following diseases, i.e., tinnitus (12%), anxiety (14%), high BP (12%), cardiovascular (8%), stress (10%) sleep disturbance (12%), multiple diseases (24%) and not suffering from any disease (8%). Audiometric tests were conducted by playing tonal sounds of different frequencies to determine the threshold of hearing and loss in hearing abilities in different frequencies (Table 3 and Table 4). In the <40 age group, the authors found that 79% of people were having certain deficiencies in hearing in the noisy intersection of Bahadurpur. In the >40 age group 95% people were found to have some deficiency in hearing.
In Pure Ganga village, the noise levels were found to be much less (due to much less traffic). The maximum noise level was found to be 55 dB. The area thus was found to be very appropriate for the comparative health hazard study. A questionnaire survey with limited medical tests was conducted similarly on over 100 people of different age groups. In the <40 age group, 29% people were suffering from any of the diseases (Table 2), i.e., tinnitus (8%), anxiety (8%), high BP (4%), cardiovascular (1%), stress (4%) sleep disturbance (4%), multiple diseases (0%) and not suffering from any disease (71%). In the >40 age group, 41% people were suffering from either of the diseases, i.e., tinnitus (4%), anxiety (4%), high BP(9%), cardiovascular (7%), stress (2%), sleep disturbance (9%), multiple diseases (6%) and not suffering from any disease (59%). In terms of hearing problems, in the <40 age group 13% of people were suffering while 87% of people were not suffering. In the >40 age group 30%people were suffering and 70% of people were not suffering. The results were also showcased graphically in the Supplementary Material (Figure S2). In less noisy Pure ganga, 13% of people in the <40 age group, and 30% of people in the >40 age group have a hearing impairment (Table 3 and Table 4), but were found to be much better than in the noisy Bahadurpur intersection.
The Audiometric test was conducted on over 100 respondents in each of Bahadurpur and Pure Ganga and were compared in terms of percentage of hearing impairment. The comparison of comprehensive reports is given in Table 3. Single frequency high intensity noises (of 250 Hz to 5000 Hz) audible to healthy ears were tested over the 100 respondee each of the noisy Bahadurpur and non-noisy Pure Ganga study sites to test hearing ability.
An audiometric test was conducted on a population of 100 each at Bahadurpur and Pure Ganga. A laptop and computer program and headphones generated single frequency noises which were played at different intensities to check the minimum intensity when it became audible to the responder. Generally, people’s ability to recognize a sound deteriorated at the higher frequency and at very low frequencies. The population at the Bahadurpur intersection was determined to have a severe loss in hearing ability compared to that of the less noisy Pure Ganga Gaon (Table 4). Hearing ability deteriorated further with age for both areas. The recorded results were used to determine the audiogram for both study sites (Figure 25).

4.6. Statistical Comparison of Health Hazards for Noisy Bahadurpur Intersection and Non-Noisy Pure Ganga-to Check Whether the Heath Impacts Are Significantly Severe in Noisy Intersection Than in Non-Noisy Area

ANOVA Testing: For this health hazard prediction ANOVA Testing was conducted and one-way ANOVA statistics and graphs were determined to compare and check whether health hazards to noises were similar for both the study areas. ANOVA results were determined with a p-value and spread of various means across two age groups of two study sites (1—Bahadurpur < 40, 2—Bahadurpur > 40, 3—Pureganga < 40, and 4—Pure Ganga > 40). The low p-value (Table 5) indicated that the responses to noise pollution were significantly different for populations staying closer to the noise source and away. Further, health impacts varied among people of different age groups in the area. The worst was suffered by people staying close to the Bahadurpur intersection (near the noise source) and who are more than 40 years of age. Furthermore, people near the noise source and away from the noise source were similarly affected by age-related ailments; however, the people staying close to the noise source have shown significantly more deteriorated health parameters. Incidentally, those living away from noise sources have not shown any significant hearing-related ailments, that is, tinnitus, hearing ailment, etc., which confirmed the health hazard in the noisy study area was directly related to noise pollution.

5. Discussion

Prolonged exposure to noise has ill effects. Intense traffic noise can also have auditory and non-auditory health impacts. The adverse impacts on health include hearing impairment, physiological damages to the cardiovascular system, leading to hypertension, stroke, etc., and psychological damage causing sleep disturbance, annoyance, depression, etc. The extent of impact very significantly depends on the type of noise, levels of its intensity, duration of influence to noise, etc. The noises originate from road traffic around the intersections and significantly vary in space and time. In a developing city intersection, the characteristics of noise levels can be very different. The growing of roadside shops at the intersection constricts the intersection and increase the congestion. Vendors and dwellers participate in commercial activities around the intersection, which very significantly influences the characteristics of traffic noises generated from there. Poor shopkeepers and temporary workers often need to spend around 10 h daily in the intersection for their living. These dwellers are exposed to intense levels of traffic noises as they work almost at the edge of the road. It was required to identify the extent of noise exposure of the dwellers at the noisy corridor. It was also required to relate the noise exposure to the health hazards of the dwellers. The types of health hazards and the extent of impacts were required to be determined.
Previous studies on noise mapping were limited to identifying the hotspots of noise pollution in the city environment. The successful identification of hotspots can only indicate the alarming zones in a city where, if people are working or living for a prolonged duration can harm their health. The extent of exposure to noise and its hazards to health are primarily not quantified in previous studies. Further, in the cases of the developed city intersections, the land use and land cover remain very organized, thus residential places or people’s living places remain significantly away from the traffic intersections, which avoids people’s adverse exposure to noise. In the cases of developing cities, the intersections essentially become a commercial hub drawing vendors to use the space for setting up temporary shops. Setting up of temporary roadside shops, adjacent to roads constricts the intersection. It also increases the level of congestion on roads at the intersection. The vendors and shopkeepers spend 8–10 h daily at the edge of the road (in the intersection) for their living getting exposed to intense levels of noise. As the places become marketplaces, the people from the nearby areas approach the noisy intersection for commercial activities; however, their duration of exposure to intense noise becomes lesser than those who need to spend 8–10 h daily at the intersection for living. The characteristic of noise levels prevailing at different parts of the intersection is required to be determined at different times of the day. It is also required to estimate the number of dwellers living or working at the intersections, whose health can be seriously impacted. Finally, the duration of exposure to noise is required to be determined at the intersection with the associated estimation of detailed health hazards.
The entire objectives were tried to be addressed in three stages, that is, (a) developing of noise map to estimate the levels of noise generating at the intersection, (b) estimating the levels of noise exposure at the intersection for the dwellers, and (c) estimating the hazards for health for the dwellers, which includes the estimation of hearing impairment as well as psychological and physiological damages.
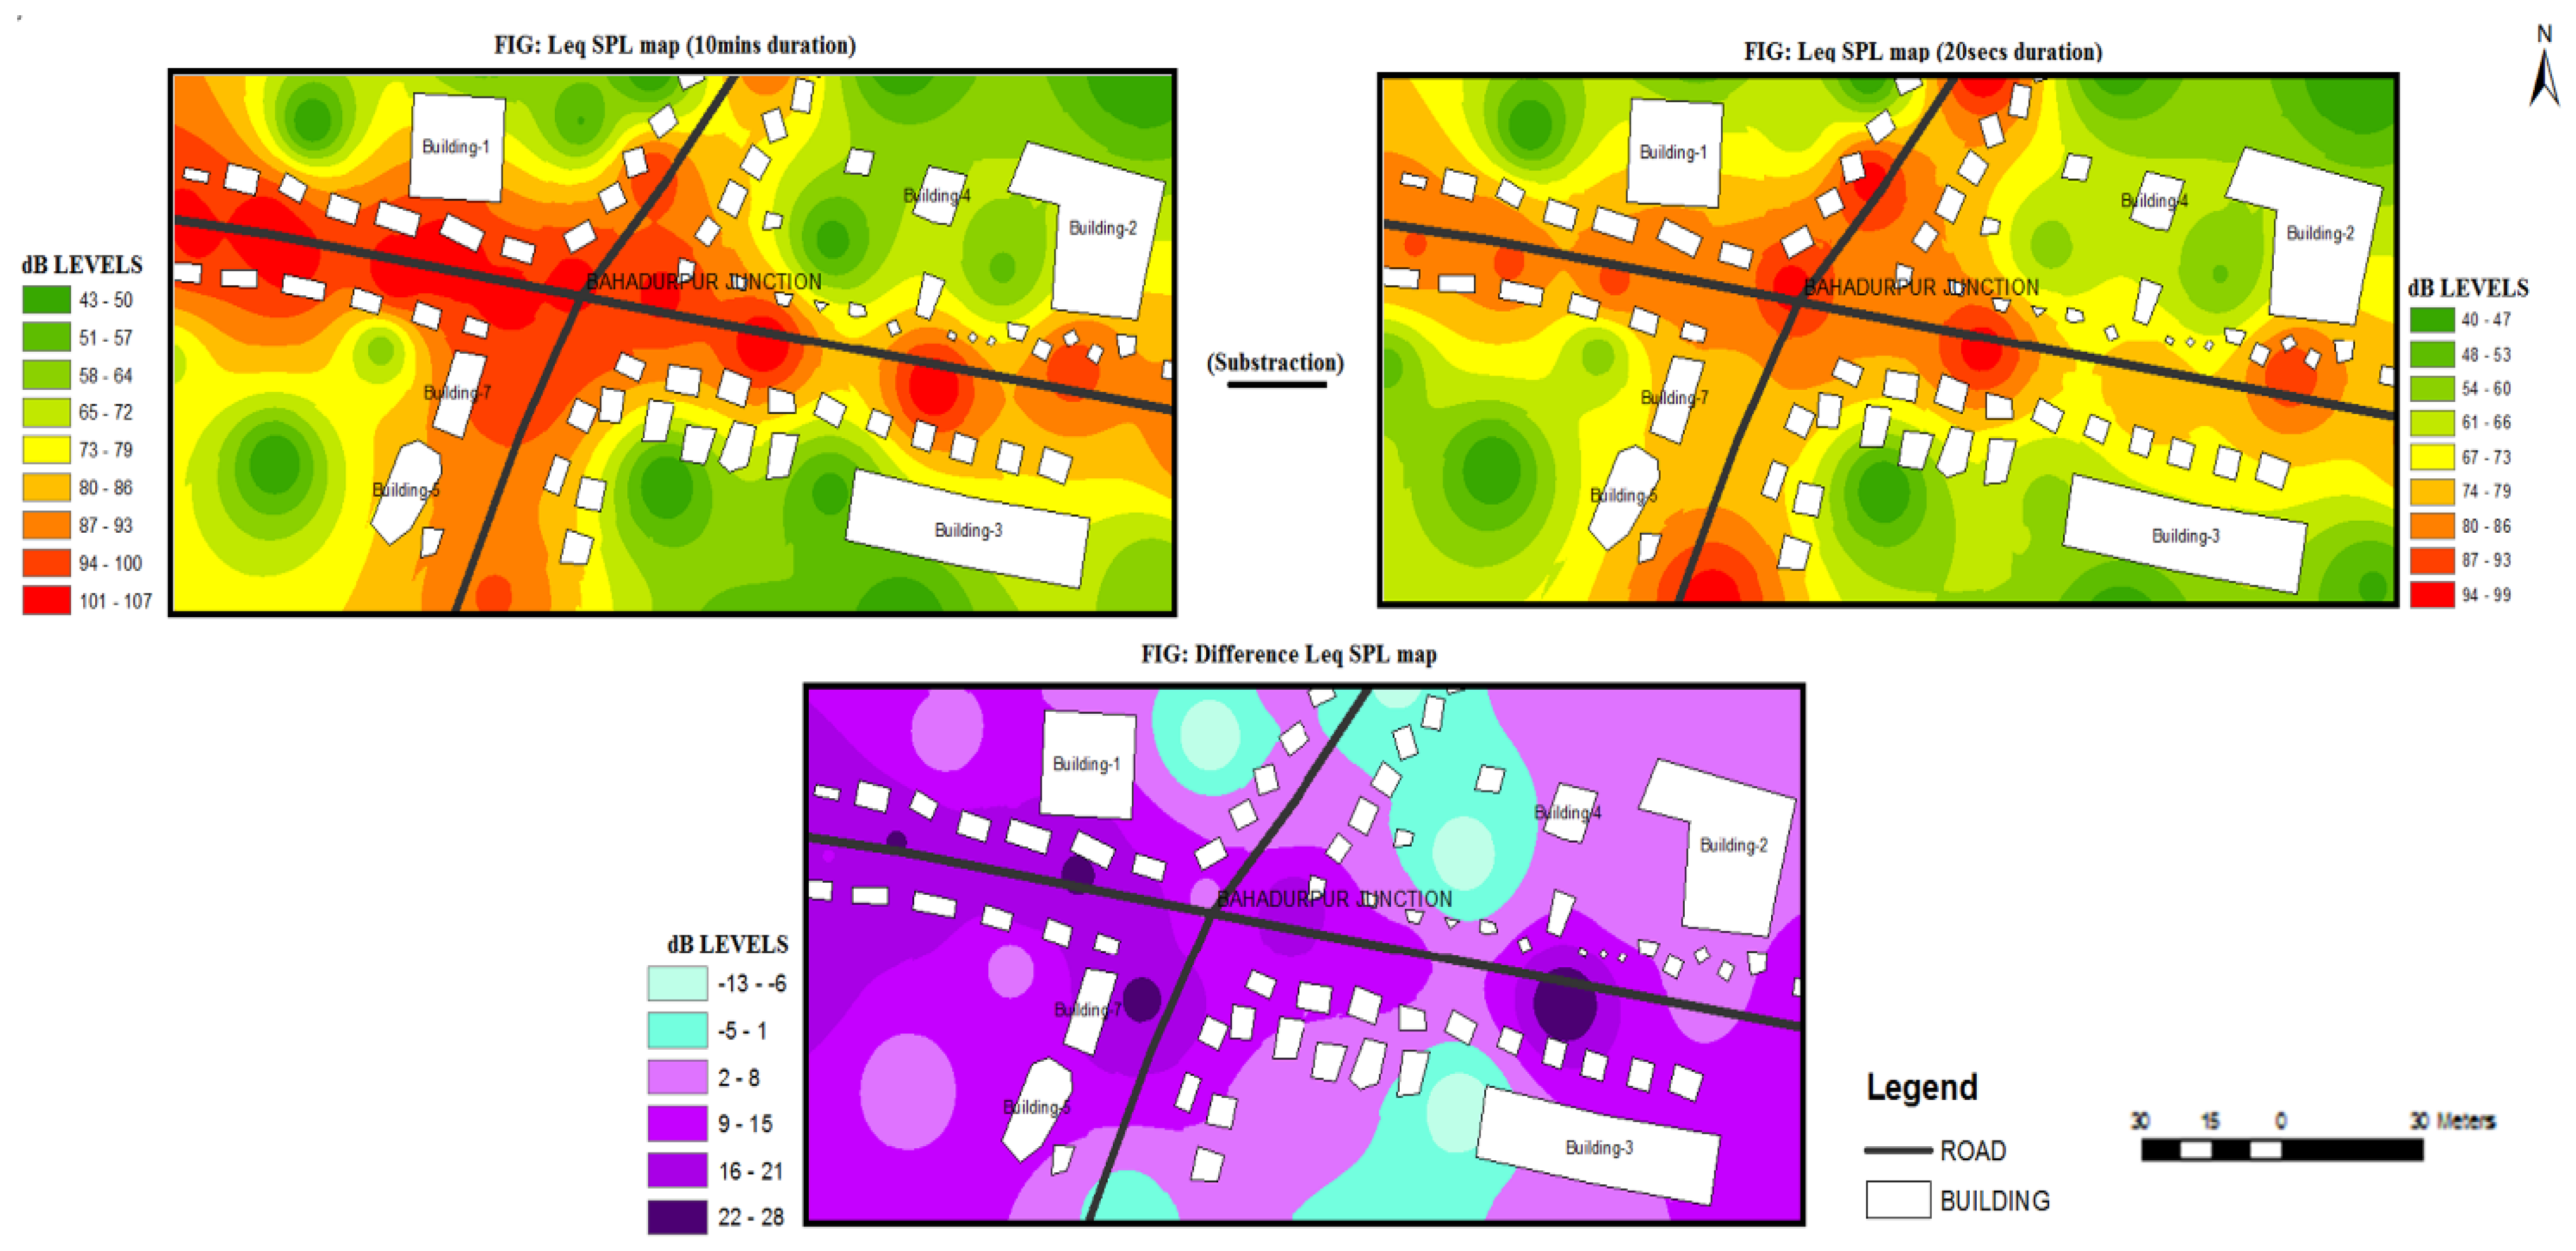
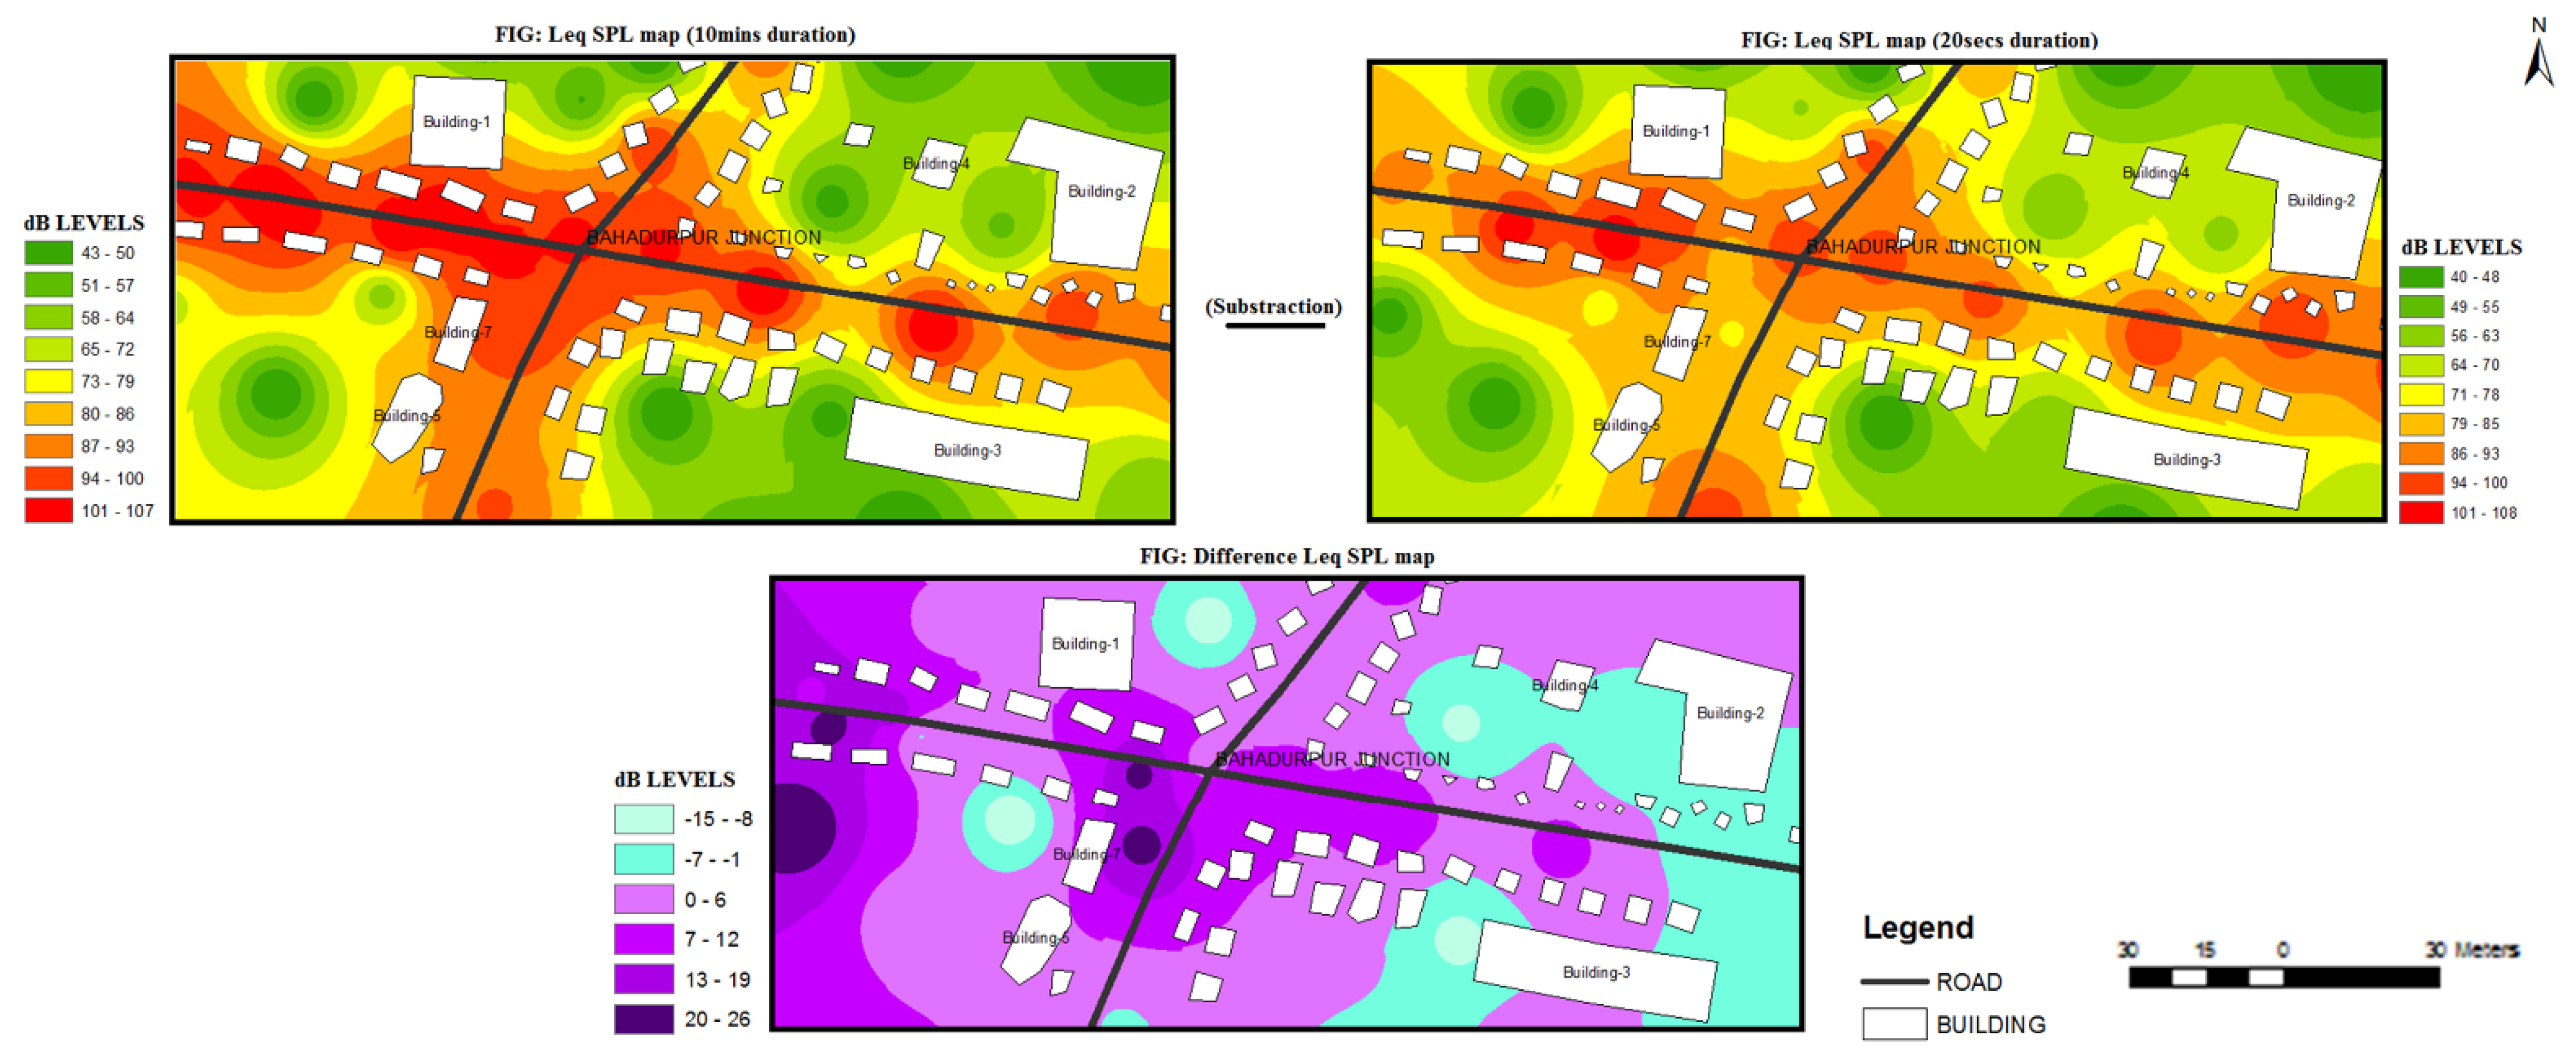
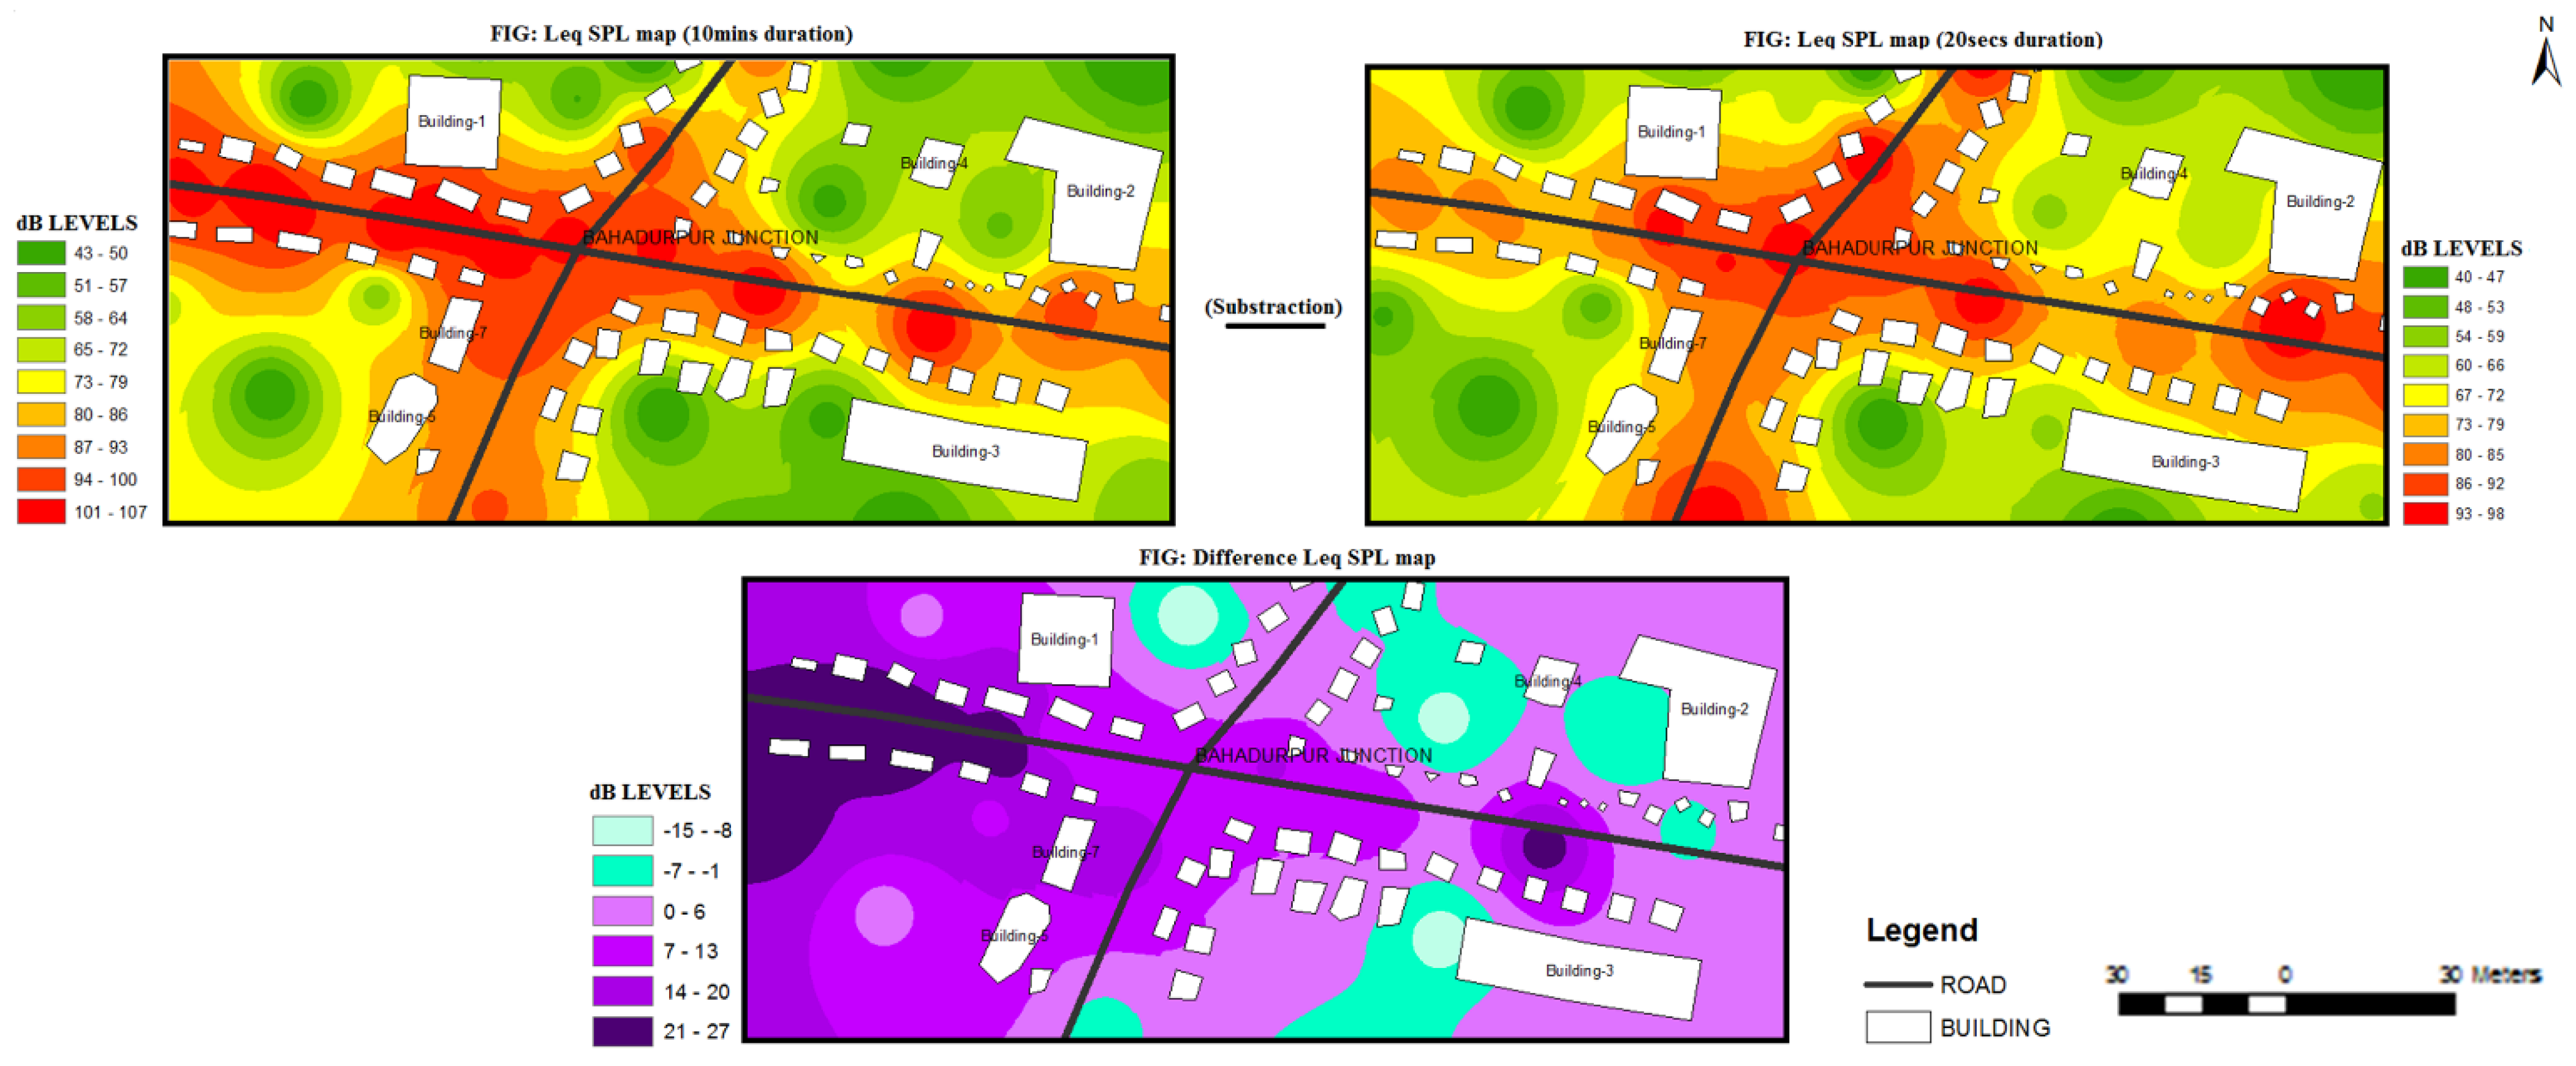
In order to characterize the noise levels at the intersection, noise levels are required to be monitored. The noise levels around the intersection were systematically monitored at 17 + 17 strategic points of the noisy Bahadurpur intersection. They are monitored and tried to be predicted and mapped. To characterize the variability in traffic noise levels in a day for the area in different hours, various sampling slots were chosen for field monitoring of noise levels, i.e., at 7:00–9:00 a.m., 9:00 a.m.–1:00 p.m., 1:00–3:00 p.m., 3:00–5:00 p.m. and 5:00–7:00 p.m. Further, the noise data were collected for 10 min (long-term) and 20 s (short-term) at each sampling interval, several times over a month. The adopted approach was inspired by similar studies by other researchers (Ref: STRATEGIES FOR NOISE SURVEYS by Professor J. Malchaire, Health, and Safety Executive, UK, 2011; Current Science, Biswas et al. 2012). Different sampling time periods were tried to characterize the noise levels for the intersection comprehensively. Twelve-hour equivalent noise levels (Leq) were determined using a long-term and short-term noise sampling regime. Leq noise levels for the noisy Bahadurpur intersection were primarily close to 100 dB. There were not many differences in Leq noise levels for different sampling intervals (M1, M2….M5.) using long-term or short-term noise sampling. It thus indicates that the noise characterization for the intersection can also possibly be carried out using short-term noise monitoring, providing a quick assessment of noise levels in an area.
Noise prediction and mapping were also conducted for different times of day using modeling and mapping. Here, the methods used for noise prediction were dependent on different types of attenuation calculations (e.g., distance attenuation, building attenuation, etc.) as practiced in conventional noise modeling. The predicted results for chosen points were then used for noise mapping using GIS IDW interpolation techniques. These results were also validated with some test points at the Bahadurpur crossing. A total of 90% of predicted noise levels deviated by ± 1–4 dB from the actual noise levels recorded by the noise measurement instrument (Sound Pressure Level meter used in the study). So, this method is highly acceptable to predict the noise value in any area and generate the noise map, even a short duration of noise monitoring at strategic points can also reasonably generate a noise map for the city intersection.
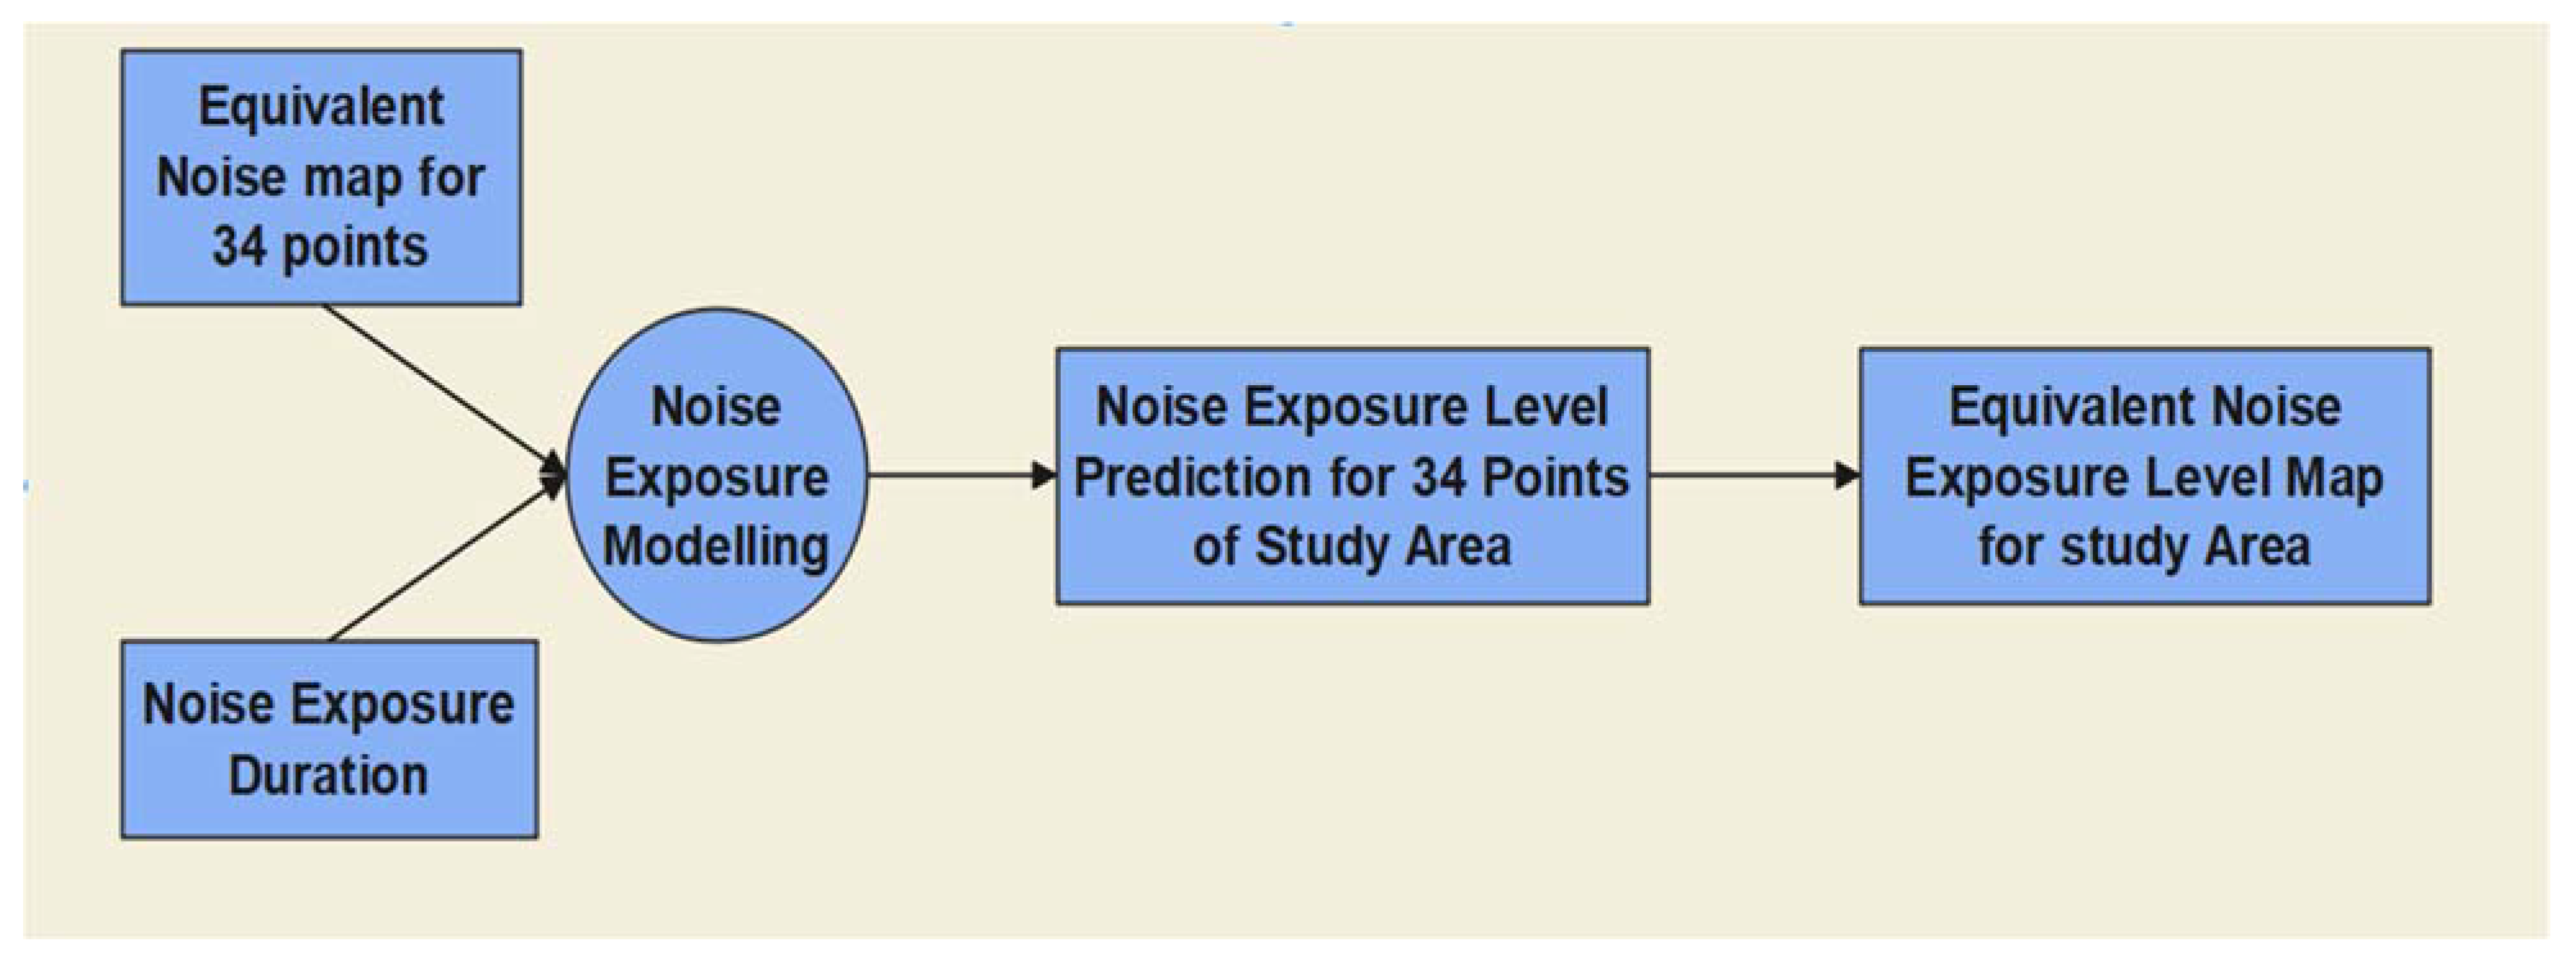
The authors used the available noise mapping methods. The authors tried to predict the noise levels on and around a busy and noisy developing city intersection. The special characteristic of the intersection was the presence of a significant number of working-class populations. Many vendors, hawkers, and sellers set up their temporary shops around the road intersections (within 1 m of the edge of the road, i.e., on the pavement). These sellers need to work 8–10 h daily. The authors tried to establish a technique to determine the noise exposure and health hazards for these vulnerable groups. The authors did use the available noise prediction technique to determine the noise levels at various parts of the intersection. Monitored noise data, terrain data, and prediction models were used for the prediction of noise levels. The predicted noise levels for 34 points and the surrounding locations were integrated with GIS to develop the noise map for the study area. The noise predictions were done at different times of the day. Noise exposure levels were also computed based on the levels of noise with their likely exposure durations for various locations. Noise level and noise exposure level mapping were finally related to the health hazard study for the noisy intersection. The results were compared with that of a non-noisy nearby area. The technique of hazard estimation and its comparison were used to relate hazards of noise pollution to the vulnerable population of the study area. The authors realized that many people set up their roadside shops within 1 m from fringe/pavement and they work there 8–10 h daily. These people were exposed to high noise levels throughout their working period. Their health hazards from noise exposure were required to be evaluated. Research questions were: (i) did these people suffer due to noise exposure; (ii) did they have any health concerns, i.e., physiological, or psychological; (iii) to what extent did the health concerns exist among the dwellers of the study sites (iv) to what extent were the health concerns related to the duration of noise exposure, time of the day, and/or noise level for a location. It was attempted to address these research questions for the vulnerable population of the study site.
The prolonged intense noise exposure can lead to auditory losses along with non-auditory damage. It can very significantly impact the nervous system through the inner ear, which in turn can adversely impact the cardiovascular system and human abilities for cognition. Hypertension, ailment of the heart, stroke, stress, sleep disturbance, annoyance, and tinnitus, have frequently been reported with exposure to traffic noises (literature review can be seen in Table 1 and 
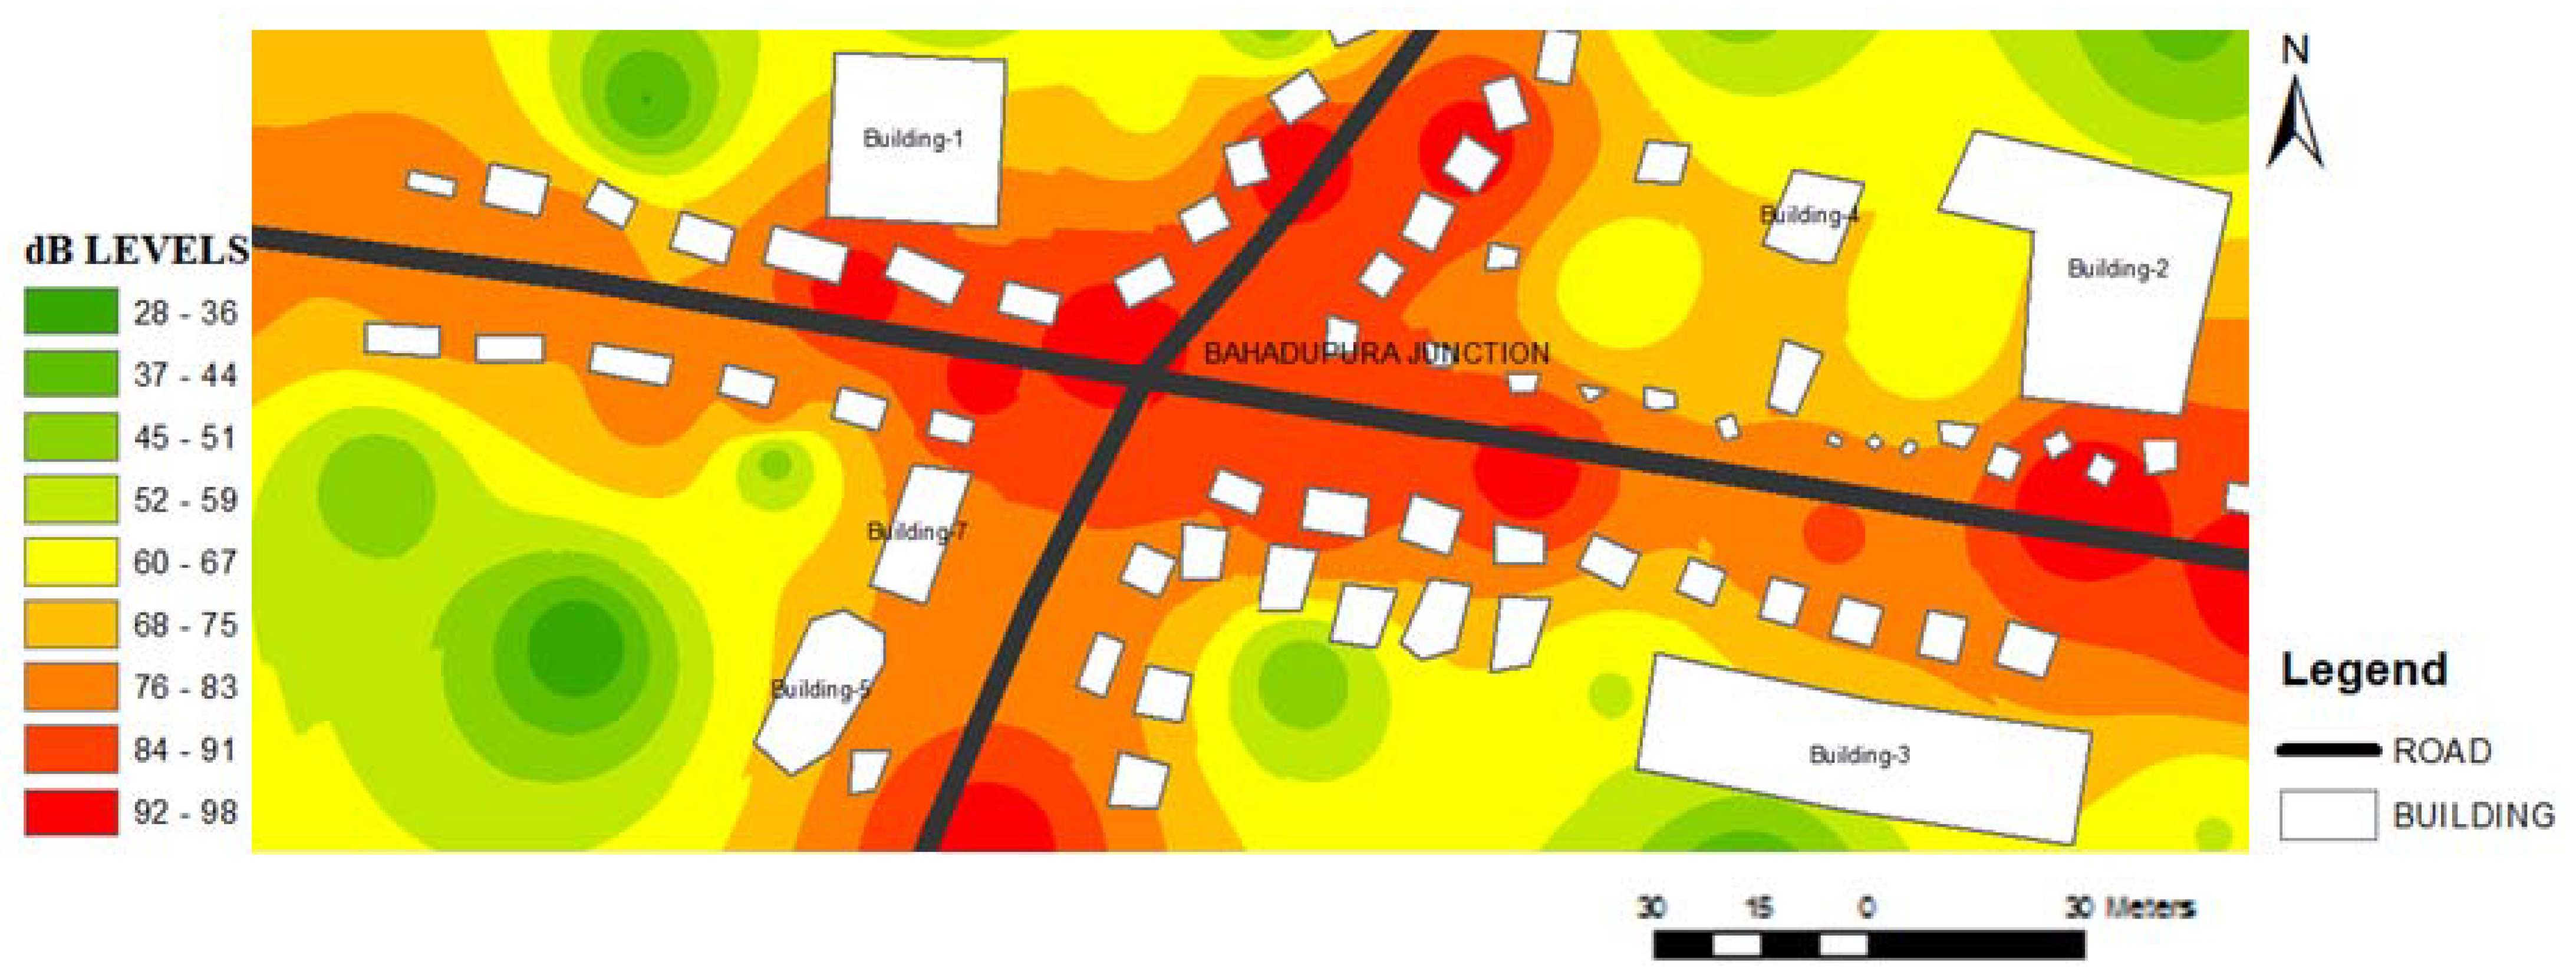
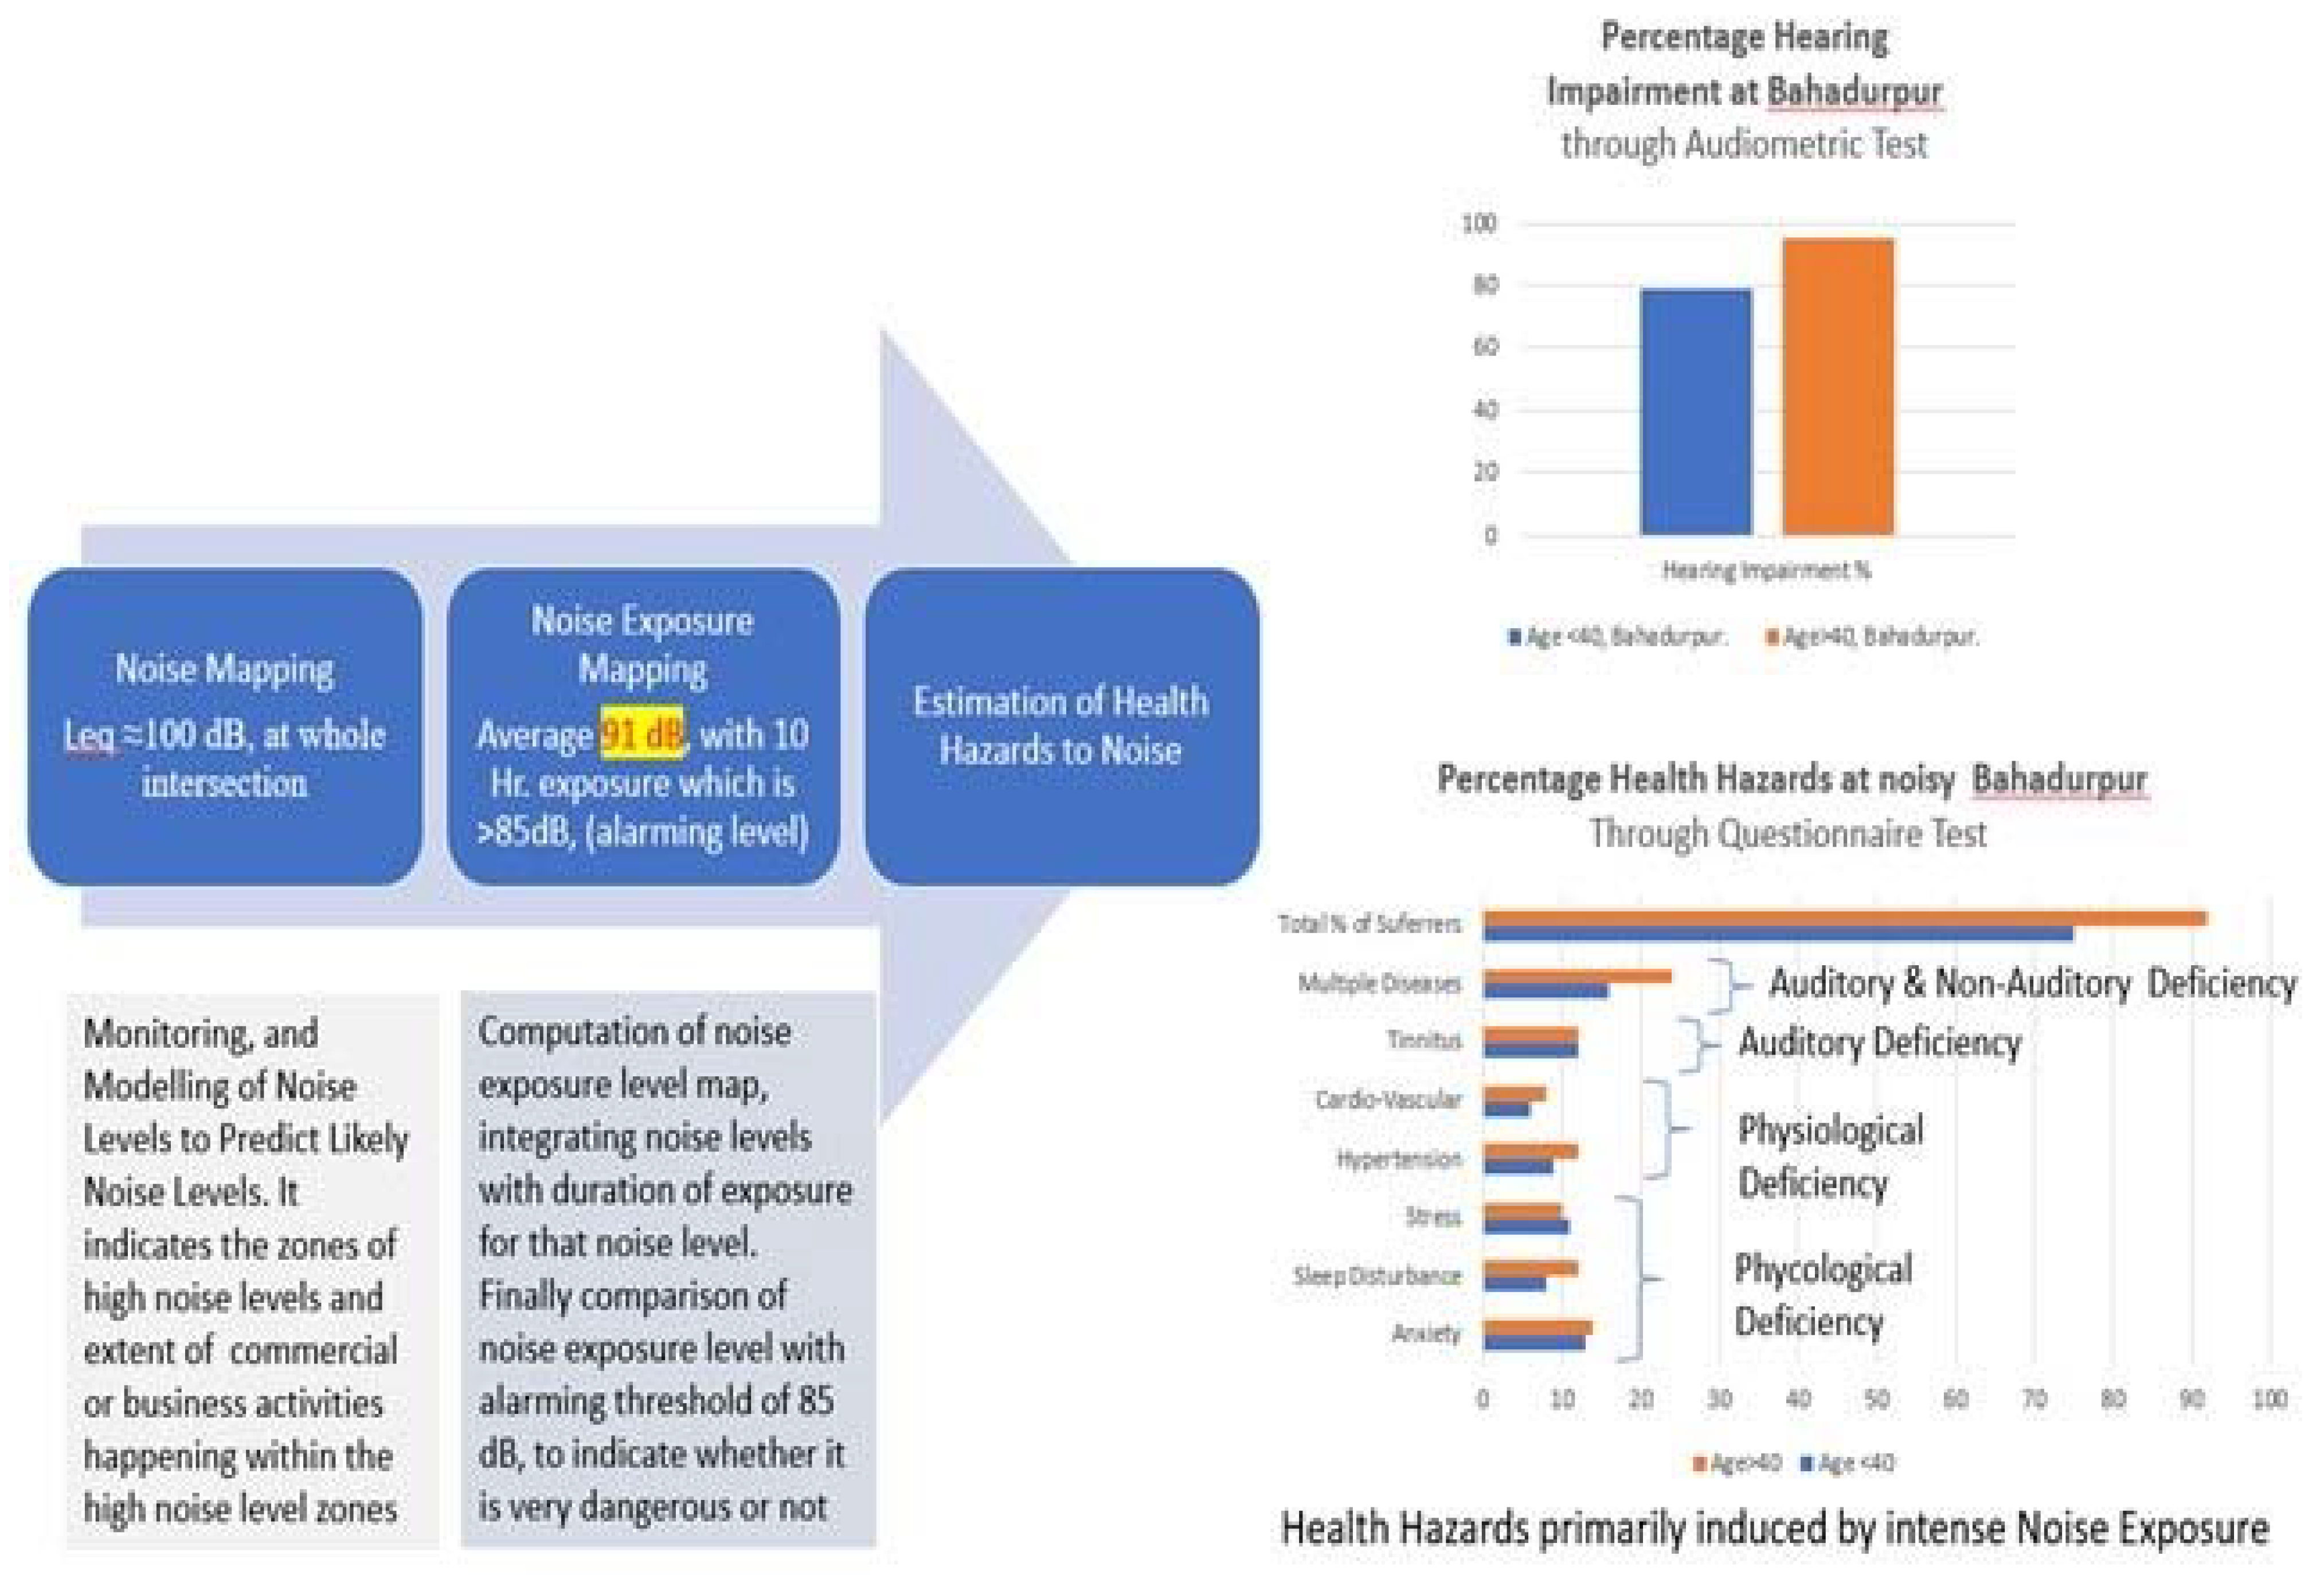
Figure 12). There is primarily limited literature on the quantification of the adverse effects of traffic noises on human life. In case the noise level or noise exposure level reduces significantly, it becomes difficult to relate the noise level with any palpable health effect. For example, at 5 m, 10 m, and 20 m from a noise source of 100 dB the receiving noise levels will be 75 dB, 69 dB, and 63 dB respectively, following the inverse square law of noise modeling as explained in equations 1 and 2. In the case of the developed intersection, people live further away from the busy intersection, and the presence of noise barriers (if present) reduces the noise levels even further. In the cases of developing intersections vendors setup their shops at the edge of road where noise levels cannot attenuate any significantly, as in the present intersection of Bahadurpur, the equivalent noise levels (Leq) become close to 100 dB and noise exposure levels become >85dB, which is alarming. A large number of shops can be identified within the 100 dB level zones of the noise map (Figure 13). To assess the health hazards for the dwellers the audiometric test, questionnaire and physiological tests were conducted.
Auditory losses of hearing impairments are primarily caused by the prolonged exposure to high-intensity noise levels. The non-auditory damages leading to hypertension, cardiovascular diseases, stress, annoyance, and sleep disturbances can be related to exposure of high-intensity noise levels and other causes which include lifestyle diseases, dietary patterns, air pollution, etc. The non-auditory diseases if occur due to lifestyle diseases, dietary patterns, and air pollution will not cause any damage to the auditory system or hearing impairment. It was thus, required to establish that the health hazards to dwellers of the intersection (who live/work there for 8–10 h) are primarily caused by exposure to intense noise levels. The health hazards caused by long duration noise exposure at Bahadurpur intersection were thus compared with the health hazards to non-noisy nearby study sites of Pure Ganga (village) and health hazards to visitors of the Bahadurpur intersection with a limited time of exposure (e.g., 1 h and 30 min in a round trip).
A detailed questionnaire was conducted on 100 people at each of Bahadurpur and Pure Ganga study sites. Questionnaires were strategically designed in the native language (Hindi) to estimate hours of exposure to high noise levels or working adjacent to the road intersection. It also enquired about any feeling of stress or anxiety in their life or working place (in the intersection), the experience of disturbed sleep, etc. were also enquired about separately. Feedback was taken further about any complaint of cardiovascular disease and/or related family history. Age, gender, career goal, income, expectation, etc. were also enquired about to register physiological and psychological deficiencies. A separate medical examination was conducted to identify individuals with hypertension, high pulse rate, etc. Audiometric tests were conducted on every individual to determine cases of hearing impairments. Similar tests were also conducted on 100 people at the less noisy Pure Ganga site as well. Comparing the observations of the two sites (Figure 26 and 
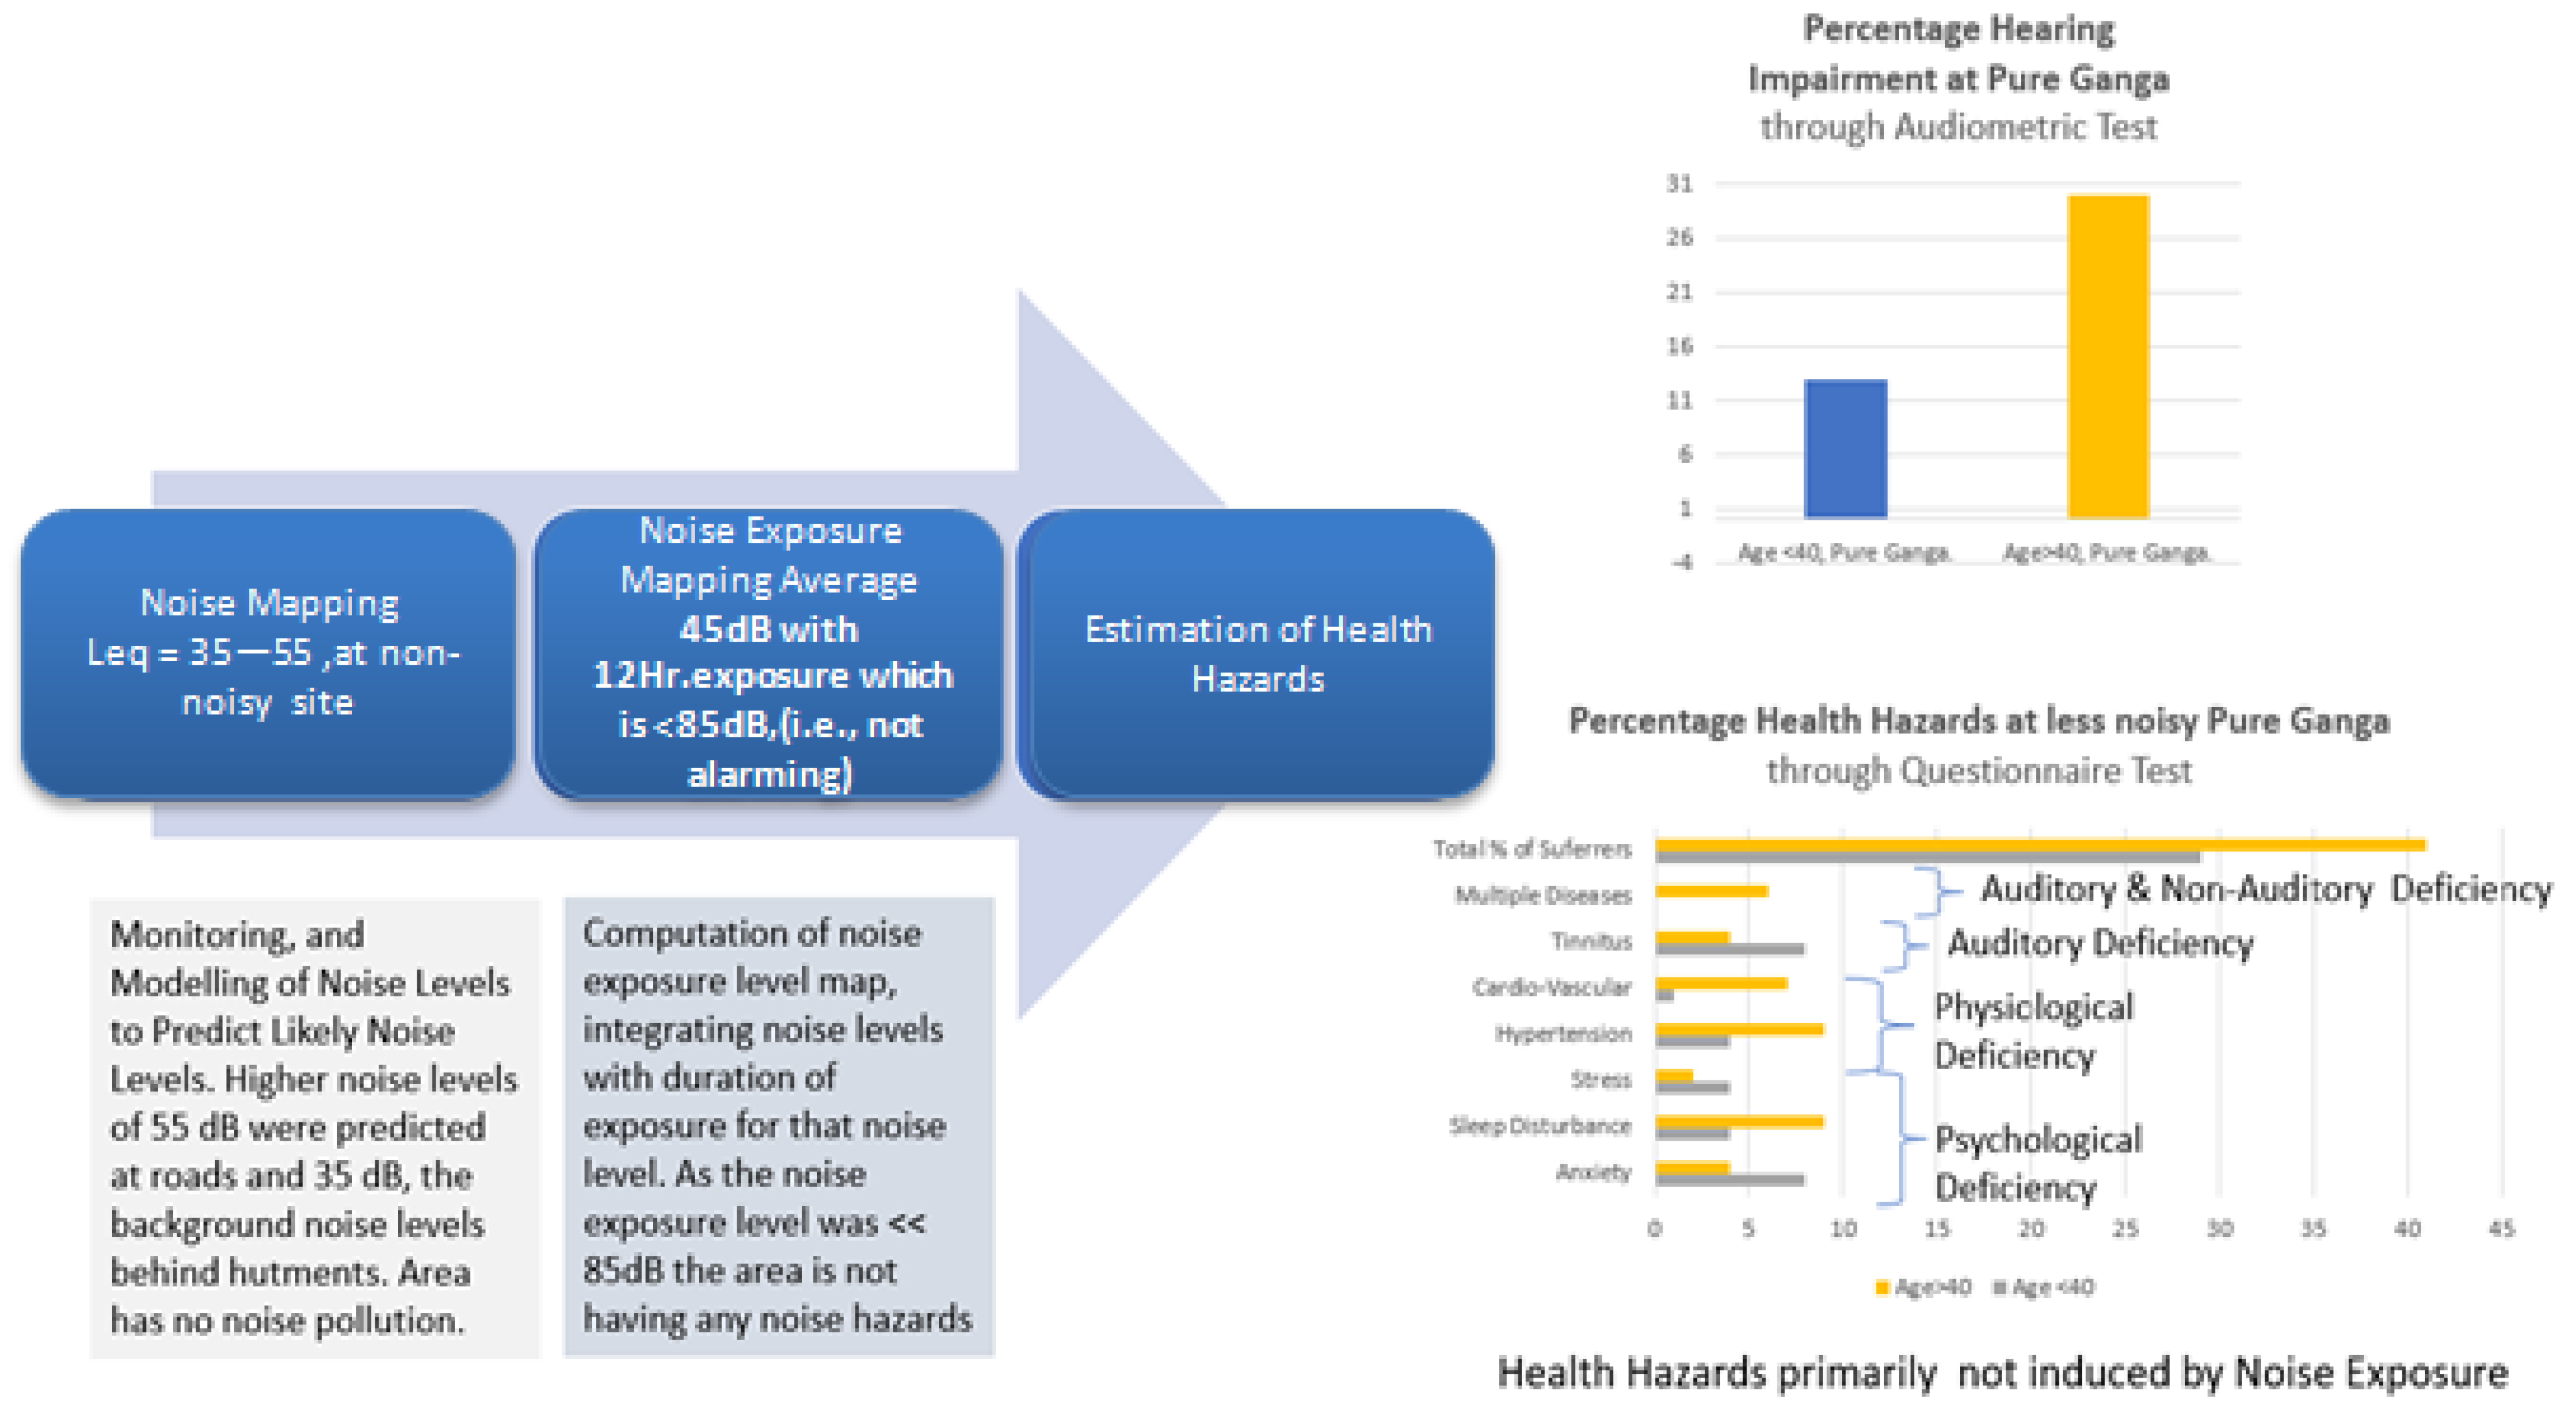
Figure 27), the authors found very interesting results. For people who are living near the noisy Bahadurpur intersection and in the <40 age group, 75% of people were suffering from some diseases and 25% of people were not suffering. In the >40 age group 92% of people were suffering from some diseases. Further, it was found that the hearing problem was prevalent in 79% of the people in the <40 age group, and it was 95% in the >40 age group. In the second location (Pure Ganga village), it was found that 29% of people were having certain diseases in the <40 age group, which came up to 41% in the >40 age group. In the age group of <40 years, the hearing problem was found among 13% of the population, which increased to 30% for the people of >40 age group in Pure Ganga village. This survey confirmed the traffic noise to be the prime causative factor for health hazards for the people working near the noisy Bahadurpur intersection (who spend a significant time throughout the day at the intersection).
A total of 6% of people in the Bahadurpur intersection of the <40 age group complained about cardiovascular ailments which were only 1% in the case of Pure Ganga village. Although in the >40 age group both the places had a similar percentage (7–8%) of people suffering from cardiovascular diseases. 9–12% of people in two age groups in Bahadurpur were suffering from high blood pressure which was nearly half in the case of the <40 age group people of Pure Ganga. Psychological diseases of anxiety, sleep disturbance, and stress, if combined, will be 32–36% in the Bahadurpur intersection, which was much higher than the similar figure of the Pure Ganga village area (16–15%). There were cases when people complained about suffering from multiple diseases (auditory and non-auditory in nature). In terms of suffering from multiple diseases too, the Bahadurpur intersection was found to be very harmful (16–24%) compared to that of Pure Ganga (0–6%). Tinnitus, the hearing-related ailment was also reported higher at the Bahadurpur intersection (12%) compared to that of Pure Ganga of 4–8%. The hearing impairment measured through the audiometric test corroborated further the alarming state of health hazards in the Bahadurpur intersection (79–95%) compared to that of Pure Ganga (13–30%). Different ailments were primarily found to increase with age. In the case of the noisy Bahadurpur intersection, the noise exposure had adversely impacted health even in the lower age group.
The occupation of dwellers probably played a very important role in establishing a relationship between noise exposure and health hazards. A very significant number of peoples work around the noisy Bahadurpur road intersection for over 8–10 h every day. Mostly, they set up their shops with temporary setups very close to the edge of the road (often over the road pavements). This working-class population is involved in selling fruits, vegetables, granaries, utensils, and other day-to-day items. Owners of these unshaded shops are the most vulnerable population exposed to high noise exposure. Compared to these people there were populations in Pure Ganga village in the nearby area (away from the intersection) not influenced by high noise levels. These people are primarily involved in farming and animal husbandry. They had lesser stress, sleep disturbances, and cardiovascular problems. In the absence of traffic, noise, and other external hassles, they were found to be calmer, although economically may not be better off than the noisy Bahadurpur intersection people.
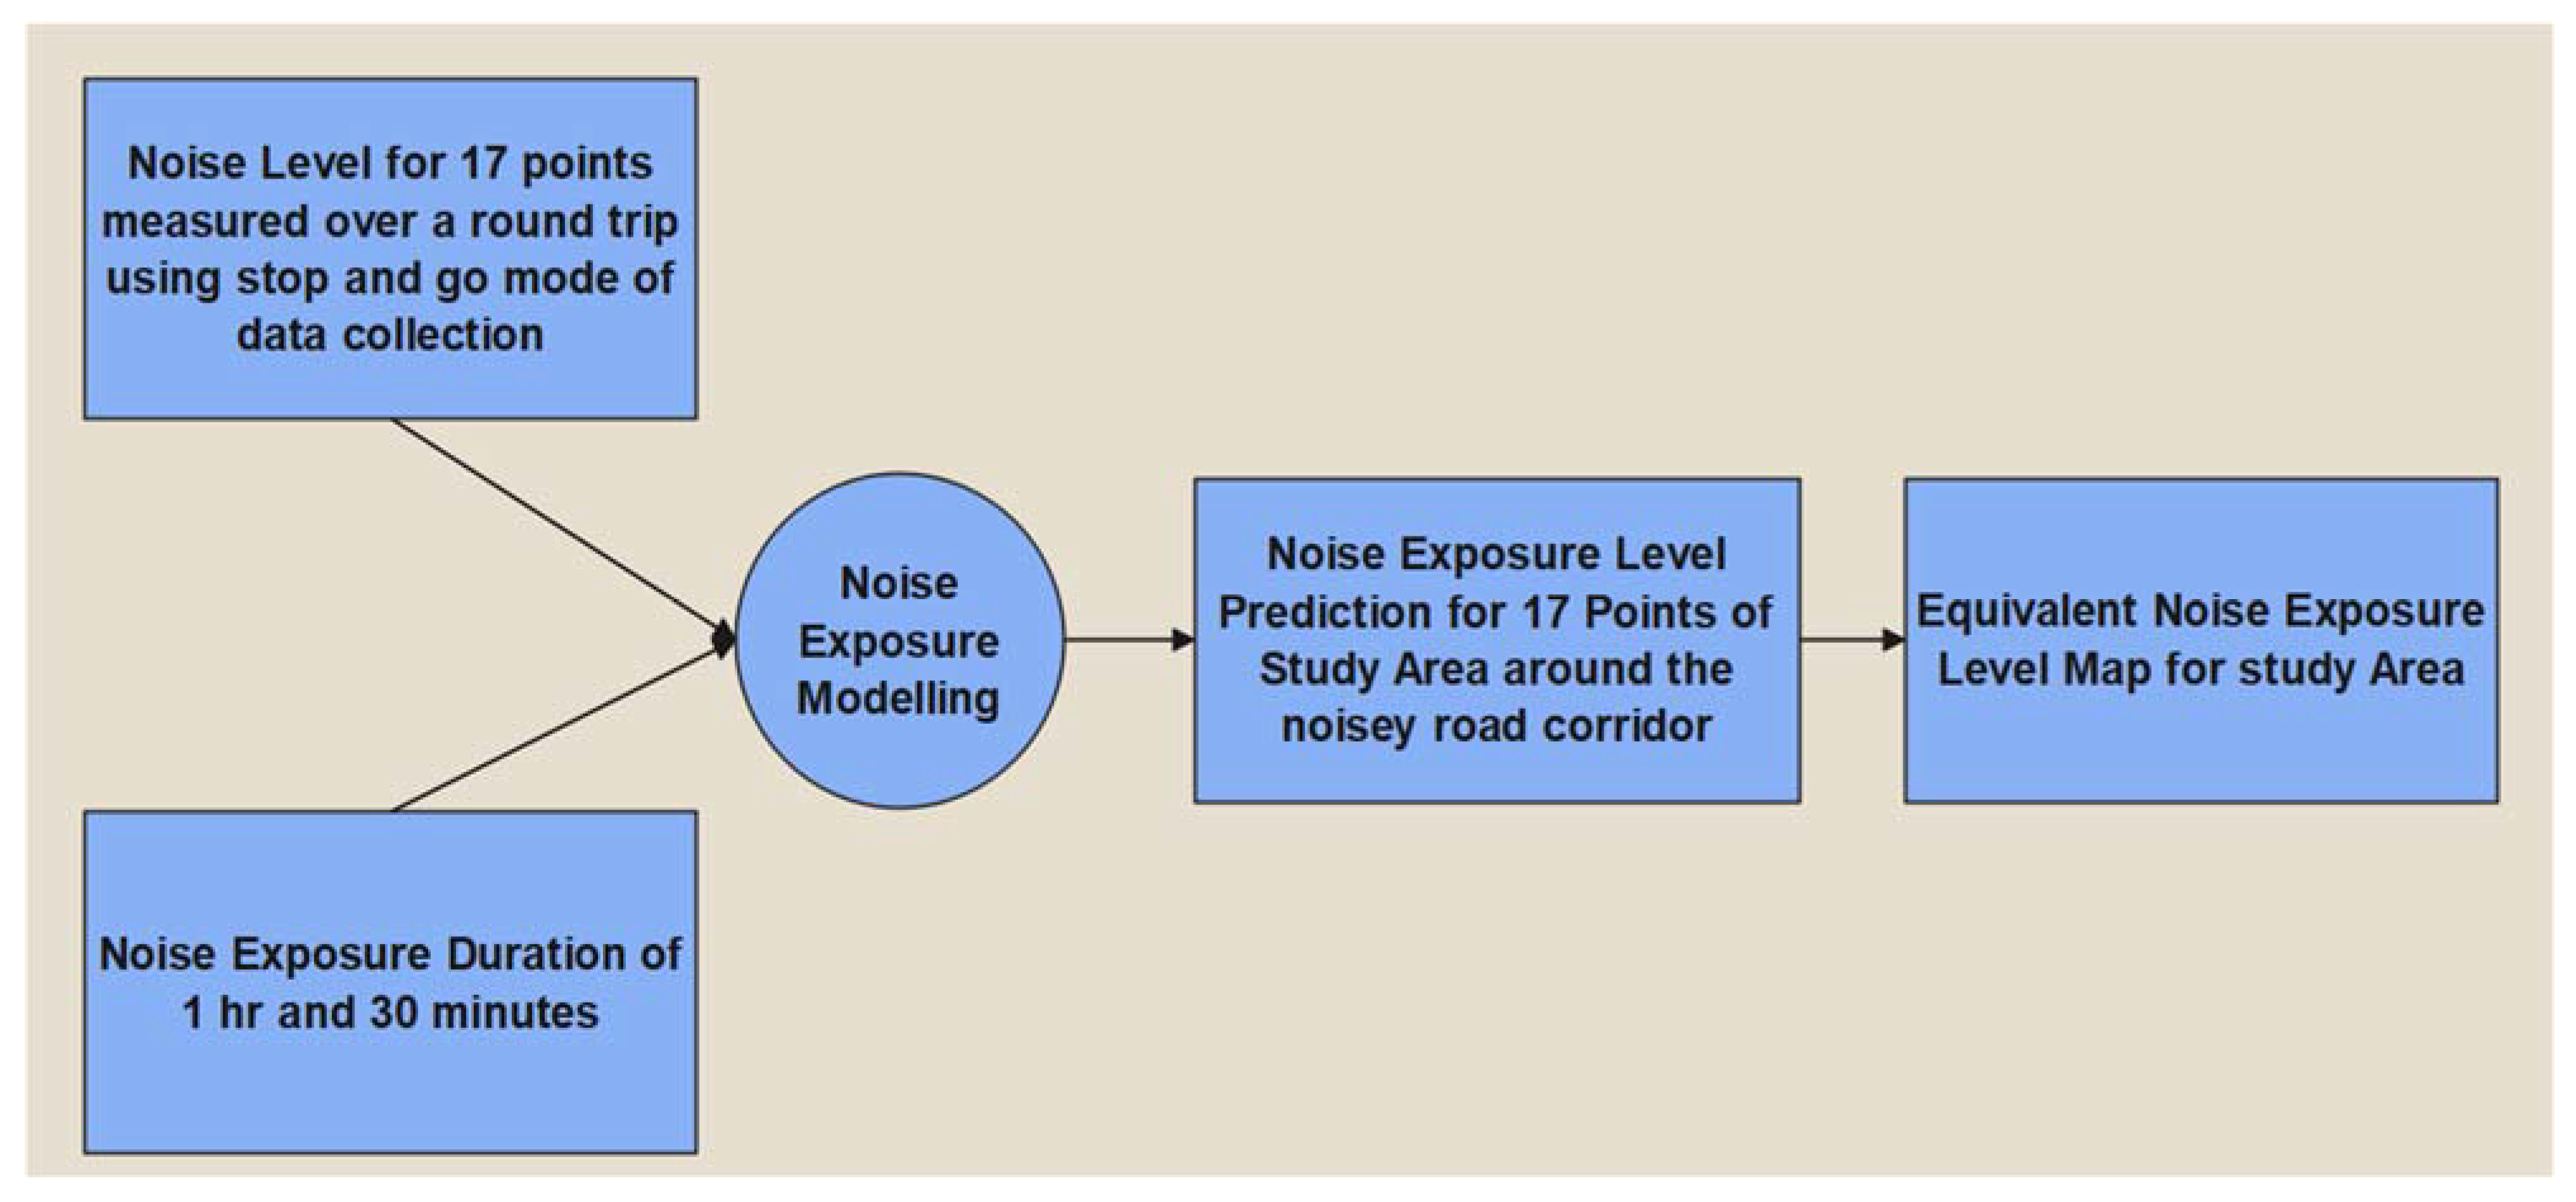
The Bahadurpur intersection was very noisy and the health hazards at the place were related to the duration of exposure to noise. The visitors to Bahadurpur intersection are exposed to intense noise levels but the durations of exposure is generally significantly lesser than that of the dwellers working in the intersection 8–10 h regularly. A typical case of a visit to Bahadurpur intersection from a non-noisy nearby place (about 250–500 m away) and back taking 1 h and 30 min was considered to estimate its noise exposure during the visit. It was determined that a regular round trip to the Bahadurpur intersection by a visitor for 1 h and 30 min can have exposure levels primarily less than the alarming threshold of 85 dB. However, in the busy evening hour (5:00–7:00 p.m.) it can be more than 85 dB. Thus, regular visits to Bahadurpur intersection at a busy hour can be harmful, but that generally does not happen. The authors being native to the place approach the Bahadurpur intersection from a non-noisy place 500 m away, and hardly experience any adverse health hazard as they do not visit the intersection regularly.
The technique has been able to predict the levels of noise exposure for the noise corridor, the place of working for the vulnerable group. The attempt used monitoring of noise levels and to predict noise level and generate the exposure maps. More number of data points and a greater number of time intervals could have been chosen to generate higher resolutions of exposure maps (in space and time). However, it would have involved a larger cost and time for data collection, processing, and modeling which might improve the prediction accuracies somewhat. On the other hand, it may be more desirable to devise a technique that involves a lesser number of noise data sampling but still can generate a noise map and reasonably predict exposure and health effects for the vulnerable pockets in the city intersection. Keeping this in mind the authors had devised short-term noise monitoring for 20 s instead of 10 min and came up with similar noise maps which deviate little and still indicate high noise level adjacent to the intersection. It could have also been used for noise exposure mapping and for relating to health hazards. In the future work, attempts can be made to reduce the sampling further and still relate to noise hazards for a place conservatively.
The noise exposure levels at the roadside open-air shops near the noisy urban intersection of Bahadurpur were found to be very high (close to 100 dB). The results of physiological study and audiometric studies also indicated the marks of serious damage to hearing, cardio-vascular and psychological abilities (as explained in the Section 4 and Section 5, Figure 15 and Table 1). The questionnaire-based survey conducted on the 100 people living at the Bahadurpur study site also confirmed serious adverse impacts (e.g., hearing impairment, tinnitus, sleep disturbance, cardiovascular diseases, hypertension, etc.). The serious noise pollution at Bahadurpur was considered to be the prime cause of the adverse health impacts on the population. Auditory, cardiovascular, and psychological diseases were significantly less among the population of the nearby Pure Ganga village having no significant traffic noise problem (Table 1 and Table 2). Further, the authors found a parallel in terms of noise-induced adverse health impacts of Bahadurpur intersection with that of Quito Ecuador (published by Virginia et al in Int. J. Environ. Res. Public Health 2022) [61]. Their study indicated the community response to noise in the hotspot at the major Road of Quito (Ecuador). The authors found that 13.11% of participants were not annoyed while 25% were slightly annoyed, 35.66% were moderately annoyed and 26.23% participants were highly annoyed; thus, in total 85.89% of participants were annoyed with light to high intensity of annoyance. Similarly, 32.38% were slightly sleep-disturbed, 31.15% were moderately sleep-disturbed, and 19.67% were highly disturbed of sleep; thus, in total, 83.2% of participants were sleep disturbed with low to high intensity. Similar to the Bahadurpur intersection, the study site of Mariscal Sucre Avenue at Quito Ecuador was underdeveloped and people there used to live in temporary roadside accommodation, experiencing very intense traffic noise levels, causing serious health damages.

6. Conclusions

Noise pollution has been a menace for the developing Bahadurpur city intersections. In the unplanned urban areas, the city was built around the road intersections. Traffic of different types, speed, and direction crowds the city intersections. Roadside shops, markets, businesses, and public establishments pull many people close to the roadway intersection adding congestion. There have been studies to predict the noise levels in different parts of the city due to road traffic. However, determination of noise exposure levels, especially the health hazards (of noise pollution) for people working close to road intersections are generally not attempted. A typical underdeveloped city intersection in Bahadurpur, UP, India was chosen. A technique was established to determine the noise exposure levels relating to health hazards. The novel technique suggested a way to first characterize the noise levels at places in terms of noise levels. The characterized noise levels were then related to noise exposure levels. During exposure prediction, it used an approach practiced in industrial exposure calculation. Finally, the noise exposure maps were related to ground truths of health parameters for the dwellers working at the noisy intersection. The tinnitus, sleep disturbance, annoyance, hypertension, cardiovascular ailment, etc., near the noisy Bahadurpur intersection were found to be high. A total of 79% of the dwellers (of <40 Age group) working close to the noisy Bahadurpur intersection were found to experience severe health hazards, which increased to 95% with the elderly population. The statistics decreases to 13% (of <40 age group) and 30% (of >40 age group) for the less noisy Pure Ganga study area. Similarly, the hearing impairments were also found to be high among the dwellers of the noisy intersection area. For example, over 12% of the responders in the noisy Bahadurpur intersection indicated cases of tinnitus, which become 8% for the quieter Pure Ganga study area. The health matrix of the noisy intersection area was compared to the same as that of the non-noisy area and was found to be very significantly less harmful. The statistical comparison with ANOVA confirmed that the noisy and non-noisy areas are not equally impacted. Further, the high health hazards observed amongst people of the noisy area was primarily due to high exposure to traffic noise.
The noise maps and noise exposure level maps indicated that pronounced health hazards can be expected around the noisy road intersection. The vendors, sellers, hawkers, etc. working adjacent to noisy roads become the most vulnerable groups. The locations of these shops within 1–2 m from the road edge, their nature of structure (open or semi-open), the nature of congestion to the roads, and the nature of congregation of people to shops or roads increasing noise levels contribute to the health hazards.
The study showcased techniques to relate noise exposure to its likely health effects. It clearly indicates how to monitor the noise data and then use a prediction technique to develop a noise map for an area. It also showcased how the time-varying noise map is integrated with noise exposure duration to generate the exposure map for an area. The noise map and exposure map indicated vulnerable zones in the intersection where noise exposure levels can be alarming and mark the shops/people who are working or living there are going to experience severe health hazards. The study also indicated the types of diseases expected when people are exposed to high noise levels for a long duration.
The noise and health hazard mapping integrated noise and exposure levels over space and time. The use of a different sampling time for noise monitoring (i.e., long-term and short-term) and using them for noise prediction showcased that noise or exposure level maps of reasonable accuracy can be generated using lesser sampling time, or sampling points as well. Thus, noise hazard zonation mapping is possible with smart planning, and monitoring using lesser cost in a GIS environment.
The established technique not only generates the noise or exposure map for an area, but it also indicates the potential health hazards in an area and the nature of health deficiencies that are likely from noise exposure. Along with serious hearing impairments, people are likely to suffer more from cardiovascular diseases, hypertension, and psychological challenges such as anxiety, stress, sleep disturbance, etc. Elderly people exposed to intense noise levels for a long duration will have more severe damaging impacts.
The predicted noise maps/hazard maps have been able to demarcate the hazardous zone successfully. The risk or vulnerability reduces sharply with distance (e.g., 25 dB attenuation in 5 m). Thus, any idea for noise management can be planned for the dwellers, keeping their shops away from the hazardous corridor. Keeping the vendors away will reduce the crowds on the roads, which would enable a smoother flow of traffic, and less honking causing a reduction in noise. The research clearly indicated that the vendors of roadside shops at the Bahadurpur intersection are badly exposed to intense noise levels. The temporary shops at the edges of roads in the intersections are about 5 m from the road center. These shops can be shifted back further by at least 5 m, which will cause an attenuation in noise level by 25 dB as per the inverse square law used in the noise modeling (Equations (1) and (2)). Further, instead of setting up a temporary shop in open spaces, if the vendors are encouraged to construct their shops far away (from the intersection, which can be closed from all sides), the direct propagation of sounds from vehicles can be obstructed, which will very significantly attenuate the noise exposure levels. The Government’s understanding, planning, and regulation to set up separate places for commercial activities will safeguard the vendors or shopkeepers form exposure to high noise levels. Shifting the shops away from the intersection will also reduce the congestion at the intersection, traffic flow will be smoother, and honking will reduce significantly which will reduce the noise levels at the intersection very significantly.
The use of noise-absorbing materials for building the shops and nearby hutments can reduce noise exposure levels. Further, the use of absorbing noise barriers and guide walls adjacent to the fringes of the road intersections will stop vendors from occupying the roads. It will reduce the congestion and the levels of exposure to high noise levels for the vendors or shopkeepers. The measures of traffic control will improve the speed of the traffic, and will reduce the noise levels greatly (Schiavi et al. 2006).
The introduction of electric vehicles can also contribute to an improvement in the local acoustics. Noise levels from electrical vehicles can be up to 6 dB (A) quieter than those of conventional vehicles. However, only slower speeds have been proven to be useful (Grubesa and Suhanek 2021). The implementation of a “smart traffic management” policy with centralized control over traffic signals and sensors can manage traffic flow in accordance with the current condition of the roads in cities. This may lead to fewer instances of congestion and less honking overall, especially in developing nations. The authors plan to improve the noise-induced health hazard estimation technique. So that the technique can be applied over a large area and efficiently predict the likely health hazards at several intersections or around hotspots. Further, the authors plan to predict the impact of various mitigating measures, in terms of deciding the optimum location for the relocation of vendors’ shops, design of barrier and traffic guide, use of E-vehicles, and the smart traffic management plans that will reduce the noise pollution and the noise-induced health hazards.

Supplementary Materials

The following supporting information can be downloaded at: https://www.mdpi.com/article/10.3390/acoustics5010006/s1, Introduction: Noise pollution; Figure S1: Noise Exposure, its Health Hazard and Monitoring; Table S1: Sample Data for Leq Noise Levels at 34 points; Table S2: Difference of long-duration vs. short duration noise data in prediction at 34 points; Table S3: Noise exposure value in one cycle of journey for visitor to noisy intersection; Table S4: Questionnaire for Health Hazard determination; Table S5: Noise exposure value for 8 h; Figure S2: Noise level mapping in a round trip at noisy crossing at 9:00–10:30 a.m.; Figure S3: Noise level mapping in a round trip at noisy crossing at 1:00–2:30 p.m.; Figure S4: Noise level mapping in a round trip at noisy crossing at 5:00–6:30 p.m.; Figure S5: Total suffering and not suffering people percentage for Bahadurpur area for <40 age group; Figure S6: Total suffering and non suffering people percentage for Bahadurpur area for >40 age group; Figure S7: Comparison of percentages of different ailments for Bahadurpur and Pureganga areas in different age groups; Figure S8: Comparison of percentages of different hearing impairments for Bahadurpur and Pureganga areas in different age groups; Figure S9: Total suffering and non suffering people percentage for Pureganga village in <40 age group; Figure S10: Total suffering and non suffering people percentage for Pureganga village in >40 age group; Figure S11: Variations in average noise levels over 17 road points at M1 to M5 times; Table: S6 Data Collection Schedule; Additional references: [1,2,3,4,5,6,7,8,9,10,11,12,13,14,15,16,17,18,19,20,21,22,23,24,25].

Author Contributions

Conceptualization, M.I.Z., R.D., A.S. and S.B.(Susham Biswas); methodology, M.I.Z., R.D., A.S. and S.B. (Susham Biswas); software, R.D. and S.B. (Shruti Bharadwaj); Validation, S.B.; formal analysis, S.B. (Shruti Bharadwaj), M.I.Z. and R.D.; investigation, R.D.; data curation, R.D. and M.I.Z.; writing—original draft preparation, M.I.Z. and S.B. (Shruti Bharadwaj); writing—review and editing, A.K., K.K.P., and S.K.T.; Visualization, M.I.Z., A.S., S.B. (Shruti Bharadwaj) and S.B. (Susham Biswas); supervision, A.S. and S.B. (Susham Biswas); project administration, M.I.Z. All authors have read and agreed to the published version of the manuscript.

Funding

This research received no external funding.

Data Availability Statement

The data presented in this study are available on request from the corresponding author.

Acknowledgments

The authors are thankful to the Rajiv Gandhi Institute of Petroleum Technology, established by the Ministry of Petroleum and Natural Gas, India, for providing infrastructural supports and facilities required to carry out this research work.

Conflicts of Interest

The authors declare no conflict of interest.

References

  1. Wang, H.; Chen, H.; Cai, M. Evaluation of an urban traffic Noise-Exposed population based on points of interest and noise maps: The case of Guangzhou. Environ. Pollut. 2018, 239, 741–750. [Google Scholar] [CrossRef] [PubMed]
  2. Sonaviya, D.R.; Tandel, B.N. A Review on GIS-based Approach for Road Traffic Noise Mapping. Indian J. Sci. Technol. 2019, 12, 1–6. [Google Scholar] [CrossRef]
  3. Lee, J.; Gu, J.; Park, H.; Yun, H.; Kim, S.; Lee, W.; Han, J.; Cha, J.S. Estimation of Populations Exposed to Road Traffic Noise in Districts of Seoul Metropolitan Area of Korea. Int. J. Environ. Res. Public Health 2014, 11, 2729. [Google Scholar] [CrossRef] [PubMed] [Green Version]
  4. Alam, W. GIS based Assessment of Noise Pollution in Guwahati City of Assam, India. Int. J. Environ. Sci. 2011, 2. [Google Scholar] [CrossRef]
  5. Kalaiselvi, R.; Ramachandraiah, A. Honking noise corrections for traffic noise prediction models in heterogeneous traffic conditions like India. Appl. Acoust. 2016, 111, 25–38. [Google Scholar] [CrossRef]
  6. Andersson, J.; Oudin, A.; Sundström, A.; Forsberg, B.; Adolfsson, R.; Nordin, M. Road traffic noise, air pollution, and risk of dementia—Results from the Betula project. Environ. Res. 2018, 166, 334–339. [Google Scholar] [CrossRef]
  7. Douglas, O.; Murphy, E. Source-based subjective responses to sleep disturbance from transportation noise. Environ. Int. 2016, 92–93, 450–456. [Google Scholar] [CrossRef]
  8. Deafness and Hearing Loss. Available online: https://www.who.int/news-room/fact-sheets/detail/deafness-and-hearing-loss (accessed on 31 December 2021).
  9. Fritschi, L.; Brown, L.; Kim, R. Burden of disease from environmental noise—Quantification of healthy life years lost in Europe, WHO European Centre for Environment and Health. Bonn Off. 2011, 106. [Google Scholar]
  10. Babisch, W.; Beule, B.; Schust, M.; Kersten, N.; Ising, H. Traffic noise and risk of myocardial infarction. Epidemiology 2005, 16, 33–40. [Google Scholar] [CrossRef]
  11. Bluhm, G.L.; Berglind, N.; Nordling, E.; Rosenlund, M. Road traffic noise and hypertension. Occup. Environ. Med. 2007, 64, 122–126. [Google Scholar] [CrossRef] [Green Version]
  12. Tian, J.; Chen, D.M. Evaluating satellite-based measurements for mapping air quality in Ontario, Canada. J. Environ. Inform. 2007, 10, 30–36. [Google Scholar] [CrossRef]
  13. Dubey, R.; Bharadwaj, S.; Zafar, I.; Sharma, V.B.; Biswas, S. Collaborative noise mapping using smartphone. Int. Arch. Photogramm. Remote Sens. Spat. Inf. Sci. 2020, XLIII-B4-2020, 253–260. [Google Scholar] [CrossRef]
  14. Dubey, R.; Bharadwaj, S.; Zafar, M.I.; Biswas, S. Collaborative air quality mapping of different metropolitan cities of India. Int. Arch. Photogramm. Remote Sens. Spat. Inf. Sci. 2021, XLIII-B4-2021, 87–94. [Google Scholar] [CrossRef]
  15. Bharadwaj, S.; Dubey, R.; Zafar, M.I.; Tiwary, S.K.; Faridi, R.A.; Biswas, S. A Novel Method to Determine the Optimal Location for a Cellular Tower by Using LiDAR Data. Appl. Syst. Innov. 2022, 5, 30. [Google Scholar] [CrossRef]
  16. Bharadwaj, S.; Dubey, R. Raster data based automated noise data integration for noise raster data based automated noise data integration for noise. Int. Arch. Photogramm. Remote Sens. Spat. Inf. Sci. 2021, XLIII-B4-2, 159–166. [Google Scholar] [CrossRef]
  17. Bharadwaj, S.; Dubey, R.; Biswas, S. Determination of the best location for setting up a transmission tower in the city. In Proceedings of the 2020 International Conference on Smart Innovations in Design, Environment, Management, Planning and Computing (ICSIDEMPC), Aurangabad, India, 30–31 October 2020; pp. 63–68. [Google Scholar] [CrossRef]
  18. Esmeray, E.; Eren, S. GIS-based mapping and assessment of noise pollution in Safranbolu, Karabuk, Turkey. Environ. Dev. Sustain. 2021, 23, 15413–15431. [Google Scholar] [CrossRef]
  19. Dursun, Ş.; Dursun, Ş.; Özdemïr, C.; Karabörk, H.; Koçak, S. Noise pollution and map of Konya city in Turkey. J. Int. Environ. Appl. Sci. 2006, 1, 63–72. [Google Scholar]
  20. Dubey, R.; Bharadwaj, S.; Zafar, M.I.; Mahajan, V.; Srivastava, A.; Biswas, S. GIS Mapping of Short-Term Noisy Event of Diwali Night in Lucknow City. ISPRS Int. J. Geo-Inf. 2021, 11, 25. [Google Scholar] [CrossRef]
  21. Road Traffic Noise: Gis Tools for Noise Mapping and a Case Study for Skåne Region. Available online: https://www.researchgate.net/publication/228557646_Road_traffic_noise_Gis_tools_for_noise_mapping_and_a_case_study_for_skane_region (accessed on 6 March 2022).
  22. Naish, D. A method of developing regional road traffic noise management strategies. Appl. Acoust. 2010, 71, 640–652. [Google Scholar] [CrossRef]
  23. Dubey, R.; Bharadwaj, S.; Biswas, S. Automatic generation of dem using svm classifier. Int. Arch. Photogramm. Remote Sens. Spat. Inf. Sci. 2022, XLIII-B2-2022, 121–127. [Google Scholar] [CrossRef]
  24. Kitcher, E.; Ocansey, G.; Abaidoo, B.; Atule, A. Occupational hearing loss of market mill workers in the city of Accra, Ghana. Noise Health 2014, 16, 183. [Google Scholar] [CrossRef]
  25. Abbaspour, M.; Golmohammadi, R.; Nassiri, P.; Mahjub, H. An investigation on time-interval optimisation of traffic noise measurement. J. Low Freq. Noise Vib. Act. Control 2006, 25, 267–273. [Google Scholar] [CrossRef]
  26. Debnath, S.; Tiwary, S.K.; Ojha, U. Dynamic Carboxylate Linkage Based Reprocessable and Self-Healable Segmented Polyurethane Vitrimers Displaying Creep Resistance Behavior and Triple Shape Memory Ability. ACS Appl. Polym. Mater. 2021, 3, 2166–2177. [Google Scholar] [CrossRef]
  27. Sonker, M.; Bajpai, S.; Khan, M.A.; Yu, X.; Tiwary, S.K.; Shreyash, N. Review of Recent Advances and Their Improvement in the Effectiveness of Hydrogel-Based Targeted Drug Delivery: A Hope for Treating Cancer. ACS Appl. Bio. Mater. 2021, 4, 8080–8109. [Google Scholar] [CrossRef]
  28. Dubey, R.; Bharadwaj, S.; Biswas, D.S. Intelligent Noise Mapping using Smart Phone on Web platform. In Proceedings of the 2020 International Conference on Smart Innovations in Design, Environment, Management, Planning and Computing (ICSIDEMPC), Aurangabad, India, 30–31 October 2020. [Google Scholar]
  29. D’Alessandro, F.; Asdrubali, F.; Schiavoni, S. The Noise Abatement Plan of an Italian Road Network: A Comparison Between Standard and Innovative Methodologies. Open Transp. J. 2014, 8, 26–38. [Google Scholar] [CrossRef]
  30. Bharadwaj, S.; Dubey, R.; Zafar, M.I.; Faridi, R.; Jena, D.; Biswas, S. Determination of Point-to-Point 3D Routing Algorithm Using LiDAR Data for Noise Prediction. Appl. Syst. Innov. 2022, 5, 58. [Google Scholar] [CrossRef]
  31. Dubey, R.; Bharadwaj, S.; Biswas, S. Gis Based Smart Noise Mapping To Compare Organized Traffic and Unorganized Traffic for a Developing Smartcity. Available online: https://doi.org/10.5194/ISPRS-ARCHIVES-XLVIII-4-W3-2022-41-2022 (accessed on 31 December 2021).
  32. Nembhnani, J.; Yadav, A.; Biswas, S. Developing an intelligent fire alarming, monitoring and rescuing system using UAV. Int. Arch. Photogramm. Remote Sens. Spat. Inf. Sci.-ISPRS Arch. 2020, 43, 409–414. [Google Scholar] [CrossRef]
  33. Biswas, S.; Lohani, B. Development of High Resolution 3D Sound Propagation Model Using LIDAR Data and Air Photo. Int. Arch. Photogramm. 2008, 1735–1740. [Google Scholar]
  34. Weyde, K.V.; Krog, N.H.; Oftedal, B.; Evandt, J.; Magnus, P.; Øverland, S.; Clark, C.; Stansfeld, S.; Aasvang, G.M. Nocturnal Road Traffic Noise Exposure and Children’s Sleep Duration and Sleep Problems. Int. J. Environ. Res. Public Health 2017, 14, 491. [Google Scholar] [CrossRef] [Green Version]
  35. Morel, J.; Marquis-Favre, C.; Gille, L.A. Noise annoyance assessment of various urban road vehicle pass-by noises in isolation and combined with industrial noise: A laboratory study. Appl. Acoust. 2016, 101, 47–57. [Google Scholar] [CrossRef]
  36. Alnuman, N.; Ghnimat, T. Awareness of Noise-Induced Hearing Loss and Use of Hearing Protection among Young Adults in Jordan. Int. J. Environ. Res. Public Health 2019, 16, 2961. [Google Scholar] [CrossRef] [Green Version]
  37. Lazzarotto, S.; Baumstarck, K.; Auquier, P. Age-Related Hearing Impairment and Impact on Quality of Life: A Review of Available Questionnaires. Ann. Otolaryngol. Rhinol. 2016, 3, 1107. [Google Scholar]
  38. Agrawal, Y.; Platz, E.A.; Niparko, J.K. Prevalence of hearing loss and differences by demographic characteristics among US adults: Data from the National Health and Nutrition Examination Survey, 1999–2004. Arch. Intern. Med. 2008, 168, 1522–1530. [Google Scholar] [CrossRef]
  39. Bodin, T.; Albin, M.; Ardö, J.; Stroh, E.; Stergren, P.O.; Björk, J. Road traffic noise and hypertension: Results from a cross-sectional public health survey in southern Sweden. Environ. Health Glob. Access Sci. Source 2009, 8, 38. [Google Scholar] [CrossRef] [Green Version]
  40. Banerjee, D. Road traffic noise exposure and annoyance: A cross-sectional study among adult Indian population. Noise Health 2013, 15, 342–346. [Google Scholar] [CrossRef] [PubMed]
  41. Burr, H.; Lund, S.P.; Sperling, B.B.; Kristensen, T.S.; Poulsen, O.M. Smoking and height as risk factors for prevalence and 5-year incidence of hearing loss. A questionnaire-based follow-up study of employees in Denmark aged 18–59 years exposed and unexposed to noise. Int. J. Audiol. 2005, 44, 531–539. [Google Scholar] [CrossRef] [PubMed]
  42. Cruz, M.S.; de Oliveira, L.R.; Carandina, L.; Lima, M.C.P.; César, C.L.G.; Barros, M.B.d.A.; Alves, M.C.G.P.; Goldbaum, M. Prevalence of self-reported hearing loss and attributed causes: A population-based study. Cad. Saude Publica 2009, 25, 1123–1131. [Google Scholar] [CrossRef] [PubMed] [Green Version]
  43. Prevention of Deafness and Hearing Loss. Available online: https://apps.who.int/iris/handle/10665/275682 (accessed on 7 October 2022).
  44. Noise-Induced Hearing Loss (NIHL)|NIDCD. Available online: https://www.nidcd.nih.gov/health/noise-induced-hearing-loss (accessed on 10 June 2022).
  45. Kong, N.; Zhang, T.; Stonebraker, I. Common metrics for web-based mapping applications in academic libraries. Online Inf. Rev. 2014, 38, 918–935. [Google Scholar] [CrossRef]
  46. Manar, M.; Shukla, S.; Mohan, U.; Singh, S.; Verma, V. Validation of a questionnaire to identify noise-induced hearing loss among drivers. J. Fam. Med. Prim. Care 2019, 8, 1196. [Google Scholar] [CrossRef]
  47. Bogoch, I.I.; House, R.A.; Kudla, I. Perceptions about hearing protection and noise-induced hearing loss of attendees of rock concerts. Can. J. Public Health 2005, 96, 69–72. [Google Scholar] [CrossRef]
  48. Degeest, S.; Corthals, P.; Vinck, B.; Keppler, H. Prevalence and characteristics of tinnitus after leisure noise exposure in young adults. Noise Health 2014, 16, 26–33. [Google Scholar] [CrossRef] [Green Version]
  49. Balanay, J.A.G.; Kearney, G.D. Attitudes toward noise, perceived hearing symptoms, and reported use of hearing protection among college students: Influence of youth culture. Noise Health 2015, 17, 394. [Google Scholar] [CrossRef] [PubMed]
  50. Johnson, T.A.; Cooper, S.; Stamper, G.C.; Chertoff, M. Noise Exposure Questionnaire (NEQ): A Tool for Quantifying Annual Noise Exposure. J. Am. Acad. Audiol. 2017, 28, 14. [Google Scholar] [CrossRef] [PubMed]
  51. Gilani, T.A.; Mir, M.S. A study on the assessment of traffic noise induced annoyance and awareness levels about the potential health effects among residents living around a noise-sensitive area. Environ. Sci. Pollut. Res. 2021, 28, 63045–63064. [Google Scholar] [CrossRef]
  52. Banerjee, D. Association between transportation noise and cardiovascular disease: A meta-analysis of cross-sectional studies among adult populations from 1980 to 2010. Indian J. Public Health 2022, 58, 84. [Google Scholar] [CrossRef]
  53. Alías, F.; Alsina-Pagès, R.M.; Orga, F.; Socoró, J.C. Detection of anomalous noise events for real-time road-traflc noise mapping: The DYNAMAP’s project case study. Noise Mapp. 2018, 5, 71–85. [Google Scholar] [CrossRef]
  54. Babisch, W.; Swart, W.; Houthuijs, D.; Selander, J.; Bluhm, G.; Pershagen, G.; Dimakopoulou, K.; Haralabidis, A.S.; Katsouyanni, K.; Davou, E.; et al. Exposure modifiers of the relationships of transportation noise with high blood pressure and noise annoyance. J. Acoust. Soc. Am. 2012, 132, 3788–3808. [Google Scholar] [CrossRef]
  55. Glasson, J.; Therivel, R. Introduction to Environmental Impact Assessment; Routledge: London, UK, 2019. [Google Scholar]
  56. Bharadwaj, S.; Dubey, R.; Zafar, M.I.; Srivastava, A.; Bhushan Sharma, V.; Biswas, S. Determination of Optimal Location for Setting Up Cell Phone Tower in City Environment Using Lidar Data. ISPRS-Int. Arch. Photogramm. Remote Sens. Spat. Inf. Sci. 2020, XLIII-B4-2, 647–654. [Google Scholar] [CrossRef]
  57. O.Reg. 381/15: NOISE. Available online: https://www.ontario.ca/laws/regulation/150381 (accessed on 31 December 2021).
  58. Zafar, M.I.; Bharadwaj, S.; Dubey, R.; Biswas, S. Different scales of urban traffic noise prediction. Int. Arch. Photogramm. Remote Sens. Spat. Inf. Sci.-ISPRS Arch. 2020, 43, 1181–1188. [Google Scholar] [CrossRef]
  59. Sharma, V.B.; Singh, K.; Gupta, R.; Joshi, A.; Dubey, R.; Gupta, V.; Bharadwaj, S.; Zafar, M.I.; Bajpai, S.; Khan, M.A.; et al. Review of Structural Health Monitoring Techniques in Pipeline and Wind Turbine Industries. Appl. Syst. Innov. 2021, 4, 59. [Google Scholar] [CrossRef]
  60. Bharadwaj, S.; Deepika, K.; Dubey, R.; Biswas, S. Noise Prediction Using LIDAR 3D Point Data—Determination of Terrain Parameters for Modelling. Commun. Comput. Inf. Sci. 2022, 1613, 281–295. [Google Scholar] [CrossRef]
  61. Nega, T.; Smith, C.; Bethune, J.; Fu, W.H. An analysis of landscape penetration by road infrastructure and traffic noise. Comput. Environ. Urban Syst. 2012, 36, 245–256. [Google Scholar] [CrossRef]
Figure 1. Noise Hazard Assessment Techniques.
Acoustics 05 00006 g001
Figure 2. Study area location at Bahadurpur and Pure Ganga Gaon.
Acoustics 05 00006 g002
Figure 3. Study area location at Pure Ganga Gaon.
Acoustics 05 00006 g003
Figure 4. Study area location at Bahadurpur.
Acoustics 05 00006 g004
Figure 5. Data collection and questionnaire at (a) Pure Ganga Gaon (b) Bahadurpur.
Acoustics 05 00006 g005
Figure 6. Noise pollution reflected in a noise map. The noise map relates with the noise exposure map and the noise exposure level relates with hazards to health.
Acoustics 05 00006 g006
Figure 8. Prediction and Mapping of Noise Levels for Noisy Bahadurpur Intersection as 12 h Leq.
Acoustics 05 00006 g008
Figure 9. Noise exposure level mapping for noisy bahadurpur intersection for the people working in roadside shops for 10 h daily.
Acoustics 05 00006 g009
Figure 10. Noise exposure level mapping for the visitors to noisy Bahadurpur intersection.
Acoustics 05 00006 g010
Figure 11. Testing noise exposure for health hazards.
Acoustics 05 00006 g011
Figure 12. Identification and comparison of health hazards for noisy and less noisy intersections.
Acoustics 05 00006 g012
Figure 13. Various health hazards of noise exposure as reported in the literature.
Acoustics 05 00006 g013
Figure 14. Predicted Leq noise map for daytime 7:00 a.m. to 7:00 p.m.
Acoustics 05 00006 g014
Figure 15. Long vs short noise sampling duration based noise prediction and their difference at M1 time interval (7:00–9:00 a.m.) for the Bahadurpur study area.
Acoustics 05 00006 g015
Figure 16. Long vs short noise sampling duration based noise prediction and their difference at M2 time interval (9:00 a.m.–1:00 p.m.) for the Bahadurpur study area.
Acoustics 05 00006 g016
Figure 17. Long vs short noise sampling duration based noise prediction and their difference at M3 time interval (1:00–3:00 p.m.) for the Bahadurpur study area.
Acoustics 05 00006 g017
Figure 18. Long vs. short noise sampling duration based noise prediction and their difference at the M4 time interval (3:00–5:00 p.m.) for the Bahadurpur study area.
Acoustics 05 00006 g018
Figure 19. Long vs. short noise sampling duration based noise prediction and their difference at M5 time interval (5:00–7:00 p.m.) for the Bahadurpur study area.
Acoustics 05 00006 g019
Figure 20. Predicted noise exposure level at the Bahadurpur intersection normalized for 8 h.
Acoustics 05 00006 g020
Figure 21. Noise exposure map for short duration at noise value 84.2 dB in event wise at time 9:00–10:30 a.m.
Acoustics 05 00006 g021
Figure 22. Noise exposures map for short duration at noise value 79.8 dB in event wise at time 1:00–2:30 p.m.
Acoustics 05 00006 g022
Figure 23. Noise exposures map for short duration at noise value 90 dB in event wise at time 5:00–6:30 p.m.
Acoustics 05 00006 g023
Figure 24. Noise level map (dB) of Pure Ganga village. The area was away from the noisy intersection.
Acoustics 05 00006 g024
Figure 25. Audiogram of the surveyed population at the Bahadurpur and Pure Ganga intersections. The majority in Bahadurpur are found to have moderate to profound hearing loss, while the majority in Pure Ganga have been diagnosed with mild to moderate hearing loss.
Acoustics 05 00006 g025
Figure 26. Health hazards of the noisy Bahadurpur area.
Acoustics 05 00006 g026
Figure 27. Health hazards of the non-noisy Pure Ganga area.
Acoustics 05 00006 g027
Table 1. Reference of traffic noise-induced health hazards estimated through the questionnaire survey.
1Hearing Impairment100%Hearing Loss (High, Moderate, and Low).Refs. [34,35,36,37,38,39,40,41,42,43]
Hearing Impairment (High, Moderate, and Low).
Hearing Problem (Strong, Moderate, and Mild).
Sound Hearing (Good, Poor, Very Poor).
2Sleep Disturbance100%Sleep Disturbance (High, Moderate, Low).Refs. [37,39,40,41,42,44,45,46,47,48,49,50,51,52]
Sleep quality (difficulty in falling asleep; waking up during sleep; waking up too early).
sleep disturbance in noisy environments (High, Moderate, Low)
3Tinnitus:80%Tinnitus (Temporary, Permanent)Refs. [34,37,38,39,40,41,42]
4Annoyance80%Annoyance (High Moderate, Low)Refs. [41,52,53,54]
feeling of displeasure (High, Moderate, Low)
Magnitudes of annoyance
5Cardiovascular and Physiological Effects65%Heart Problem (Strong, Moderate, Mild)Refs. [17,35,39,44,48,49,50,54,55,56]
Heart Stroke (Slightly, Moderately, to a good extent, completely agree
6Hypertension70%Blood Pressure (High, Normal, Low)Refs. [13,14,17,28,36,40,41,42,46,47,48,56,57,58,59,60]
Hypertension (Slightly, Moderately, to a Good Extent, Completely Agree).
Table 2. Health hazard-based comparative analysis at Bahadurpur and Pure ganga.
S.No.FactorBahadurpur (Near to Source)Pure Ganga (Away from Source)
 Disease<40 (Young) Age>40 (Old) Age<40 (Young) Age>40 (Old) Age
1Tinnitus12%12%8%4%
2Anxiety13%14%8%4%
3High-BP (Hypertension)9%12%4%9%
4Cardio-vascular disease6%8%1%7%
5Stress11%10%4%2%
6Sleep disturbance8%12%4%9%
7Multiple diseases16%24%0%6%
8Total percentage of sufferers75%92%29%41%
9Total percentage of non sufferers 25%8%71%59%
10Grand total 100%100%100%100%
Table 3. Comparison of Health hazards of Bahadurpur and Pure ganga areas obtained through Audiometric Test.
S.No.FactorBahadurpur (Near to Source)Pure Ganga (Away from Source)
1Hearing Problems<40 (Young) Age>40 (Old) Age<40 (Young) Age>40 (Old) Age
2Total percentage of Hearing Impairment79%95%13%30%
3Total percentage of non-hearing Impairment21%5%87%70%
4Grand Total100%100%100%100%
Table 4. The minimum audible noise level for Bahadurpur and Pure Ganga study was determined through an audiometric test (the average of responses for most responders are plotted).
S.No.FrequencyBahadurpur (Near to Noise Source)Pure Ganga (Away from Noise Source)
1250 Hz50 dB 35 dB
2500 Hz60 dB 40 dB
32500 Hz90dB *50 dB
45000 Hz>95 dB *60 dB
* Only a few could hear high frequency tonal noises at the very high intensity at the Bahadurpur intersection.
Table 5. ANOVA description of Descending Order of Health Hazard.
ANOVA
SourceSSdfMSFProb > F
Columns464.3333154.77814.43.14795 × 10−5
Error215.0002010.750
Total679.33323
SS—Sum of square; df—Degree of freedom; MS—Mean Square; F—F statistics.
Disclaimer/Publisher’s Note: The statements, opinions and data contained in all publications are solely those of the individual author(s) and contributor(s) and not of MDPI and/or the editor(s). MDPI and/or the editor(s) disclaim responsibility for any injury to people or property resulting from any ideas, methods, instructions or products referred to in the content.

