Article

Performance and Surface Modification of Cast Iron Corrosion Products by a Green Rust Converter (Mimosa tenuiflora Extract)

by
David Enrique Arceo-Gómez
1,
Javier Reyes-Trujeque
2,
Patricia Balderas-Hernández
3,
Andrés Carmona-Hernández
4,
Araceli Espinoza-Vázquez
4,
Ricardo Galván-Martínez
4 and
Ricardo Orozco-Cruz
4,*
1
Centro de Investigación en Micro y Nanotecnología (MICRONA), Universidad Veracruzana, Boca del Río 94294, Veracruz, Mexico
2
LANCIC-Centro de Investigación en Corrosión (CICORR), Universidad Autónoma de Campeche, San Francisco de Campeche 24070, Campeche, Mexico
3
Centro Conjunto de Investigación en Química Sustentable (CCIQS) UAEMex-UNAM, Carretera Toluca-Atlacomulco Km 14.5, Toluca 50200, Estado de Mexico, Mexico
4
Instituto de Ingeniería, Universidad Veracruzana, Boca del Río 94294, Veracruz, Mexico
*
Author to whom correspondence should be addressed.
Surfaces 2024, 7(1), 143-163; https://doi.org/10.3390/surfaces7010010
Submission received: 30 January 2024 / Revised: 19 February 2024 / Accepted: 26 February 2024 / Published: 13 March 2024
(This article belongs to the Special Issue Surface Treatments to Improve the Corrosion Resistance of Metals)

Abstract

:
One of the alternative materials used for conducting conservation treatment of iron artifacts is the rust converter, since it generates barrier properties and more stable oxides. The protective properties and surface modifications from using Mimosa tenuiflora extract as a green rust converter on a gray iron oxide layer were studied. The surface characterization was carried out using a Scanning Electron Microscope coupled to an energy-dispersive X-ray spectrometer (SEM-EDS), along with infrared spectroscopy (IR), Raman spectroscopy, X-ray Diffraction (XRD), and Water Contact Angle (WCA). Electrochemical characterization was performed with an Electrochemical Impedance Spectroscope (EIS) using 3.5 wt.% NaCl as the electrolyte. According to the results of the Raman spectroscopy and XRD, the layer of corrosion products formed after 90 days in the atmosphere was composed of goethite, lepidocrocite, maghemite, hematite, and magnetite. The surface of the corrosion products was transformed with the rust converter into an amorphous and microcracked layer. By IR, the Fe-O and C-O-Fe bonds associated with the iron chelate were found with absorption bands at 1540 and 1567 cm−1, respectively. By XRD, a modification of the magnetite crystallinity was observed. Finally, the Water Contact Angle and the protective capacity of the corrosion products were improved by the presence of the rust converter.

1. Introduction

Corrosion is a serious worldwide problem that affects a wide variety of metallic structures [1,2,3]. Therefore, numerous methods and materials have been developed in order to minimize the damage caused by the corrosion process [4,5,6]. Corrosion protection and prevention are remarkably important, given that a considerable portion of the gross domestic product is consumed annually by corrosion. Among the most frequently used corrosion protection methods are organic and inorganic coatings, electrochemical protection, and corrosion inhibition [7,8,9,10]. Paints protecting steel structures contain mostly lead oxide; these compounds are dangerous for the environment due to their toxicity and must be replaced by environmentally friendly substances [11].
Stabilizing the rust layer before applying a paint coating is an attractive alternative to steel cleaning and is a worldwide trend in anti-corrosion technology [12]. An alternative that has been studied for more than 20 years is the rust converter, whose main function is to react with the iron oxides that cannot be completely removed from a surface, leading to a layer where paint systems can be applied. Rust converters are based on chemical formulations that can be applied to corroded surfaces, promoting their passivation and the possible elimination of new corrosion; the difficulty is in finding the appropriate components, their optimum concentration and reaction time, and the appropriate conditions for their most effective application [13]. Among rust converters, special attention should be drawn to those based on tannins and phosphoric acid. Such products have low toxicity, and tannic acid is obtained from renewable sources [14].
The components of tannins are sugars, gallic acid, and flavonoids. They are of high molecular weight, and the idea is that their presence converts an active oxide into a protective non-reactive rust, presumably magnetite [15]. Tannic acid belongs to the high-molecular-weight group of phenolic compounds and contains a carbohydrate in the central core (glucose), which is esterified by polyphenols (gallic acid). Tannic acid is a subclass of plant tannin and is formed by the secondary metabolism of plants [16]. Tannins and tannic acid can be found in different species of trees, such as acacia bark Mimosa and Pine radiata [17,18]. Some researchers have used plant extracts as corrosion inhibitors and have reported satisfactory results [19,20,21]. There has also been the synthesis of new rust converters that present excellent chelating capacity and anticorrosive properties [22].
It is important to note that tannins are biodegradable, non-toxic, and natural compounds, and most commercial rust converters are based on tannic and phosphoric acids, which are environmentally safe, in contrast to toxic inhibitors and coatings, such as red lead or zinc chromates. However, there is a strong controversy about their efficiency; depending on the conditions, the results can even be contradictory. Several reasons can explain this fact; among them, the different natures of the rust layer to be converted (their nature, density, thickness, and pH) and the concentration or origin of the tannic solution seem to be the most important. In addition, the reaction mechanism and, mainly, the transformations taking place in the oxide layer have not been established [23,24].
Mimosa tenuiflora is a tree found in Mexico, mainly in the states of Chiapas and Oaxaca. It is traditionally known in Mexico as “tepezcohuite”, which is a tree of the Mimosaceae family that has been characterized as having anti-inflammatory, antibacterial, anesthetic, and regenerative properties for the epidermis. In Mexico, it is a resource of cultural and economic interest at the regional level in the states of Oaxaca and Chiapas; its use in the treatment of burns and superficial skin wounds, gastrointestinal problems, and for the recovery of soils and vegetation stands out [25,26].
On the other hand, it has been shown to have anticorrosive properties in AISI 1018 carbon steel corrosion products [27]. From this, an opportunity arises for the area of metallic cultural heritage from the application of a green rust converter. Iron vestiges have the most corrosion damage, as their corrosion product layers are highly porous and non-protective. In this work, a green rust converter from Mimosa tenuiflora extract was applied on cast iron corrosion products.
Our aim is to characterize its anticorrosive properties and how it acts on the surface of corrosion products as a possible conservation treatment for historical iron pieces. The identification of the corrosion products was carried out by Raman spectroscopy. The morphological and chemical characterizations of the corrosion product layer, with and without the rust converter, were carried out by a Scanning Electron Microscope coupled to an energy-dispersive X-ray spectrometer (SEM-EDS). The structural characterization and crystalline phases were carried out by Fourier Transform Infrared Spectroscopy (FTIR) and X-ray Diffraction (XRD), respectively. A Water Contact Angle (WCA) tester was used to observe changes in the properties of the corrosion products with a rust converter. Finally, the protective behavior of the cast iron corrosion products in the absence and presence of the rust converter was evaluated for 72 h in a 3.5% wt.% NaCl solution using Electrochemical Impedance Spectroscopy (EIS).

2. Materials and Methods

2.1. Materials

Round cast iron coupons with a nominal composition of 3.42% C, 2.62% Si, 0.45% Mn, 0.06% S, 0.05% P, 0.04% Cr, and balanced Fe were used. The coupons, 3.8 cm in diameter and 0.5 cm thick, were superficially prepared by chemical pickling to remove residues and rust on the surface; the pickling solution used was hydrochloric acid and 0.1 M hexamethylenetetramine [28]. Subsequently, the parts were mechanically roughened with 220-, 400-, and 600-grade SiC sandpaper. Finally, they were degreased with acetone and distilled water. Round cast iron coupons were cut in dimensions of 1.5 cm × 1.5 cm × 0.5 cm for SEM-EDS measurements and metallographic, Raman spectroscopy, FTIR, XRD, and AC analysis. The same surface preparation procedure was followed for these square pieces.

2.2. Methods

2.2.1. Hardness Assay and Microstructural Analysis

The hardness of the cast iron was measured using a portable Equotip 550 hardness tester. The native scale of the equipment is HLD Leeb D, and the calibration of the equipment was carried out using a standard steel coupon with a hardness of 765 HLD. The Leeb hardness principle is based on the dynamic rebound method and lends itself to in situ analysis. The device parameters were as follows: impact velocity 2.05 ± 0.1 m/s, impact body mass 5.45 ± 0.1 g, spherical radius of the indentation ball 1.5 ± 0.005 mm, CoC/W indenter material. The measurements are referenced in ISO16859-1 (Metallic materials—Leeb Hardness Test) [29] and ASTM A956 (Standard Test Method for Leeb Hardness Testing of Steel Products) [30].
The metallographic analysis consisted of mechanical roughing of square coupons using sandpaper with grit sizes of 220, 400, 600, and 1000. Subsequently, it was mirror-polished using 1-micron diamond paste (Buehler). For chemical etching, a 3% nital solution was prepared, consisting of 3 mL of HNO3 (JT Baker) in 100 mL of methanol. Moreover, surface morphology and EDS analysis of the cast iron microstructure, and corrosion products with/without the rust converter were studied using a Scanning Electron Microscope (SEM) model Flexem 1000 Hitachi equipped with secondary electron (SE), backscattered electron (BSE) detectors, and an energy-dispersive X-ray spectrometer (EDS) model Quantax75 Bruker (Billerica, MA, USA).

2.2.2. Polyphenol Quantification and Rust Converter Extraction

The extraction of the rust converter was performed by dynamic maceration, consisting of 20 g of Mimosa tenuiflora bark added to 100 mL of ethanol. The maceration time was 72 h at 40 °C. The preparation of the rust converter formulation was a 1:1 volumetric ratio of Mimosa tenuiflora extract (pH = 5) with isopropyl/terbutyl alcohol. The formulations were applied to the corrosion products by spraying and allowed to dry for 48 h at room temperature.
The Folin–Ciocalteu reagent method was adapted to evaluate the total polyphenol content of Mimosa tenuiflora extract using the gallic acid standard. A volume of 0.5 mL of the extract or gallic acid standard diluted 1:10 (v/v) was mixed with 5 mL of Folin–Ciocalteu reagent diluted 1:10 (v/v), and 4 mL of a 1 M Na2CO3 solution was added. Solutions of the gallic acid standard were prepared at concentrations of 20, 40, 60, 80, and 100 ppm to construct the calibration curve. The solutions were kept in a dark place for 1 h, and then the colorimetric determination of each sample was performed at 765 nm using a UV–visible spectrophotometer (UNICO). The total phenolic content of the sample was denoted as gallic acid equivalent, GAE (mg g−1, dry weight) [31].

2.2.3. FTIR and Raman Spectroscopy Characterization

Raman spectroscopy of the corrosion products was performed using a portable i-Raman Plus spectrometer (B&WTEK). The sample was irradiated with a 785 nm wavelength laser. The laser was adjusted to different powers, always avoiding thermal effects on the samples. The conditions were 15 ms and 15% power. The analysis area was focused through a video optical microscope and an XYZ positioning probe holder.
The layer of corrosion products with/without the rust converter and Mimosa tenuiflora extract were analyzed by Fourier Transform Infrared Spectroscopy (FTIR). FTIR was performed with a portable Alpha spectrophotometer (Bruker) in Reflectance mode. The resolution of the spectrum was 4 cm−1 using 24 scans per minute. The spectra were recorded in absorbance mode in the mid-infrared range of 500–4000 cm−1.

2.2.4. XRD Analysis

Identification of the crystalline phases by X-ray Diffraction was carried out on the layer of corrosion products with and without the rust converter on the cast iron pieces. Sample preparation was carried out by the powder method, so it was necessary to remove the corrosion products or converted film and crush them with an agate mortar until fine particles were obtained. The X-ray Diffraction technique was carried out in a D8 Advance diffractometer (Bruker) with Davinci design, θ-θ geometry using monochromatic radiation from the Cu tube, and a Linxeye silicon detector. Preliminary tests were performed to define the appropriate recording and diffractional field conditions. The analysis conditions were as follows: NiO 0.02 monochromator, 0.1 mm collimator, 0.15 s step time, 0.01 increments, and a diffractional field of 10–80°. The identification of the diffractograms was performed using the DIFFRAC software, EVA version 3.1.

2.2.5. Water Contact Angle (WCA)

Static contact angle measurements were performed by the sessile drop method using an ESr-N measuring instrument (Dataphysics) and distilled water. The equipment contains an optical system and an automatic dosing unit. Drops of 5 μL were dispensed at five different points on each specimen and from a height as close as possible to the substrate so that the needle remained in contact with the liquid droplet. Then, the needle was carefully withdrawn, and the droplet image was immediately captured to measure the static contact angle. The SCA20 software 1.0 enabled the measurement of the contact angle.

2.2.6. EIS Characterization

Electrochemical experiments were performed using a conventional three-electrode cell: a saturated Ag/AgCl reference electrode, a graphite counter electrode, and a working electrode (corrosion products with and without rust converter) with an exposed surface area of 1 cm2. The measurements were evaluated for 72 h with a 3.5 wt.% NaCl electrolyte solution. Electrochemical Impedance Spectroscopy (EIS) studies were performed by imposing a sinusoidal voltage of ±10 mV concerning the corrosion potential (Ecorr) and a frequency range from 10 KHz to 1 mHz [32].

3. Results and Discussion

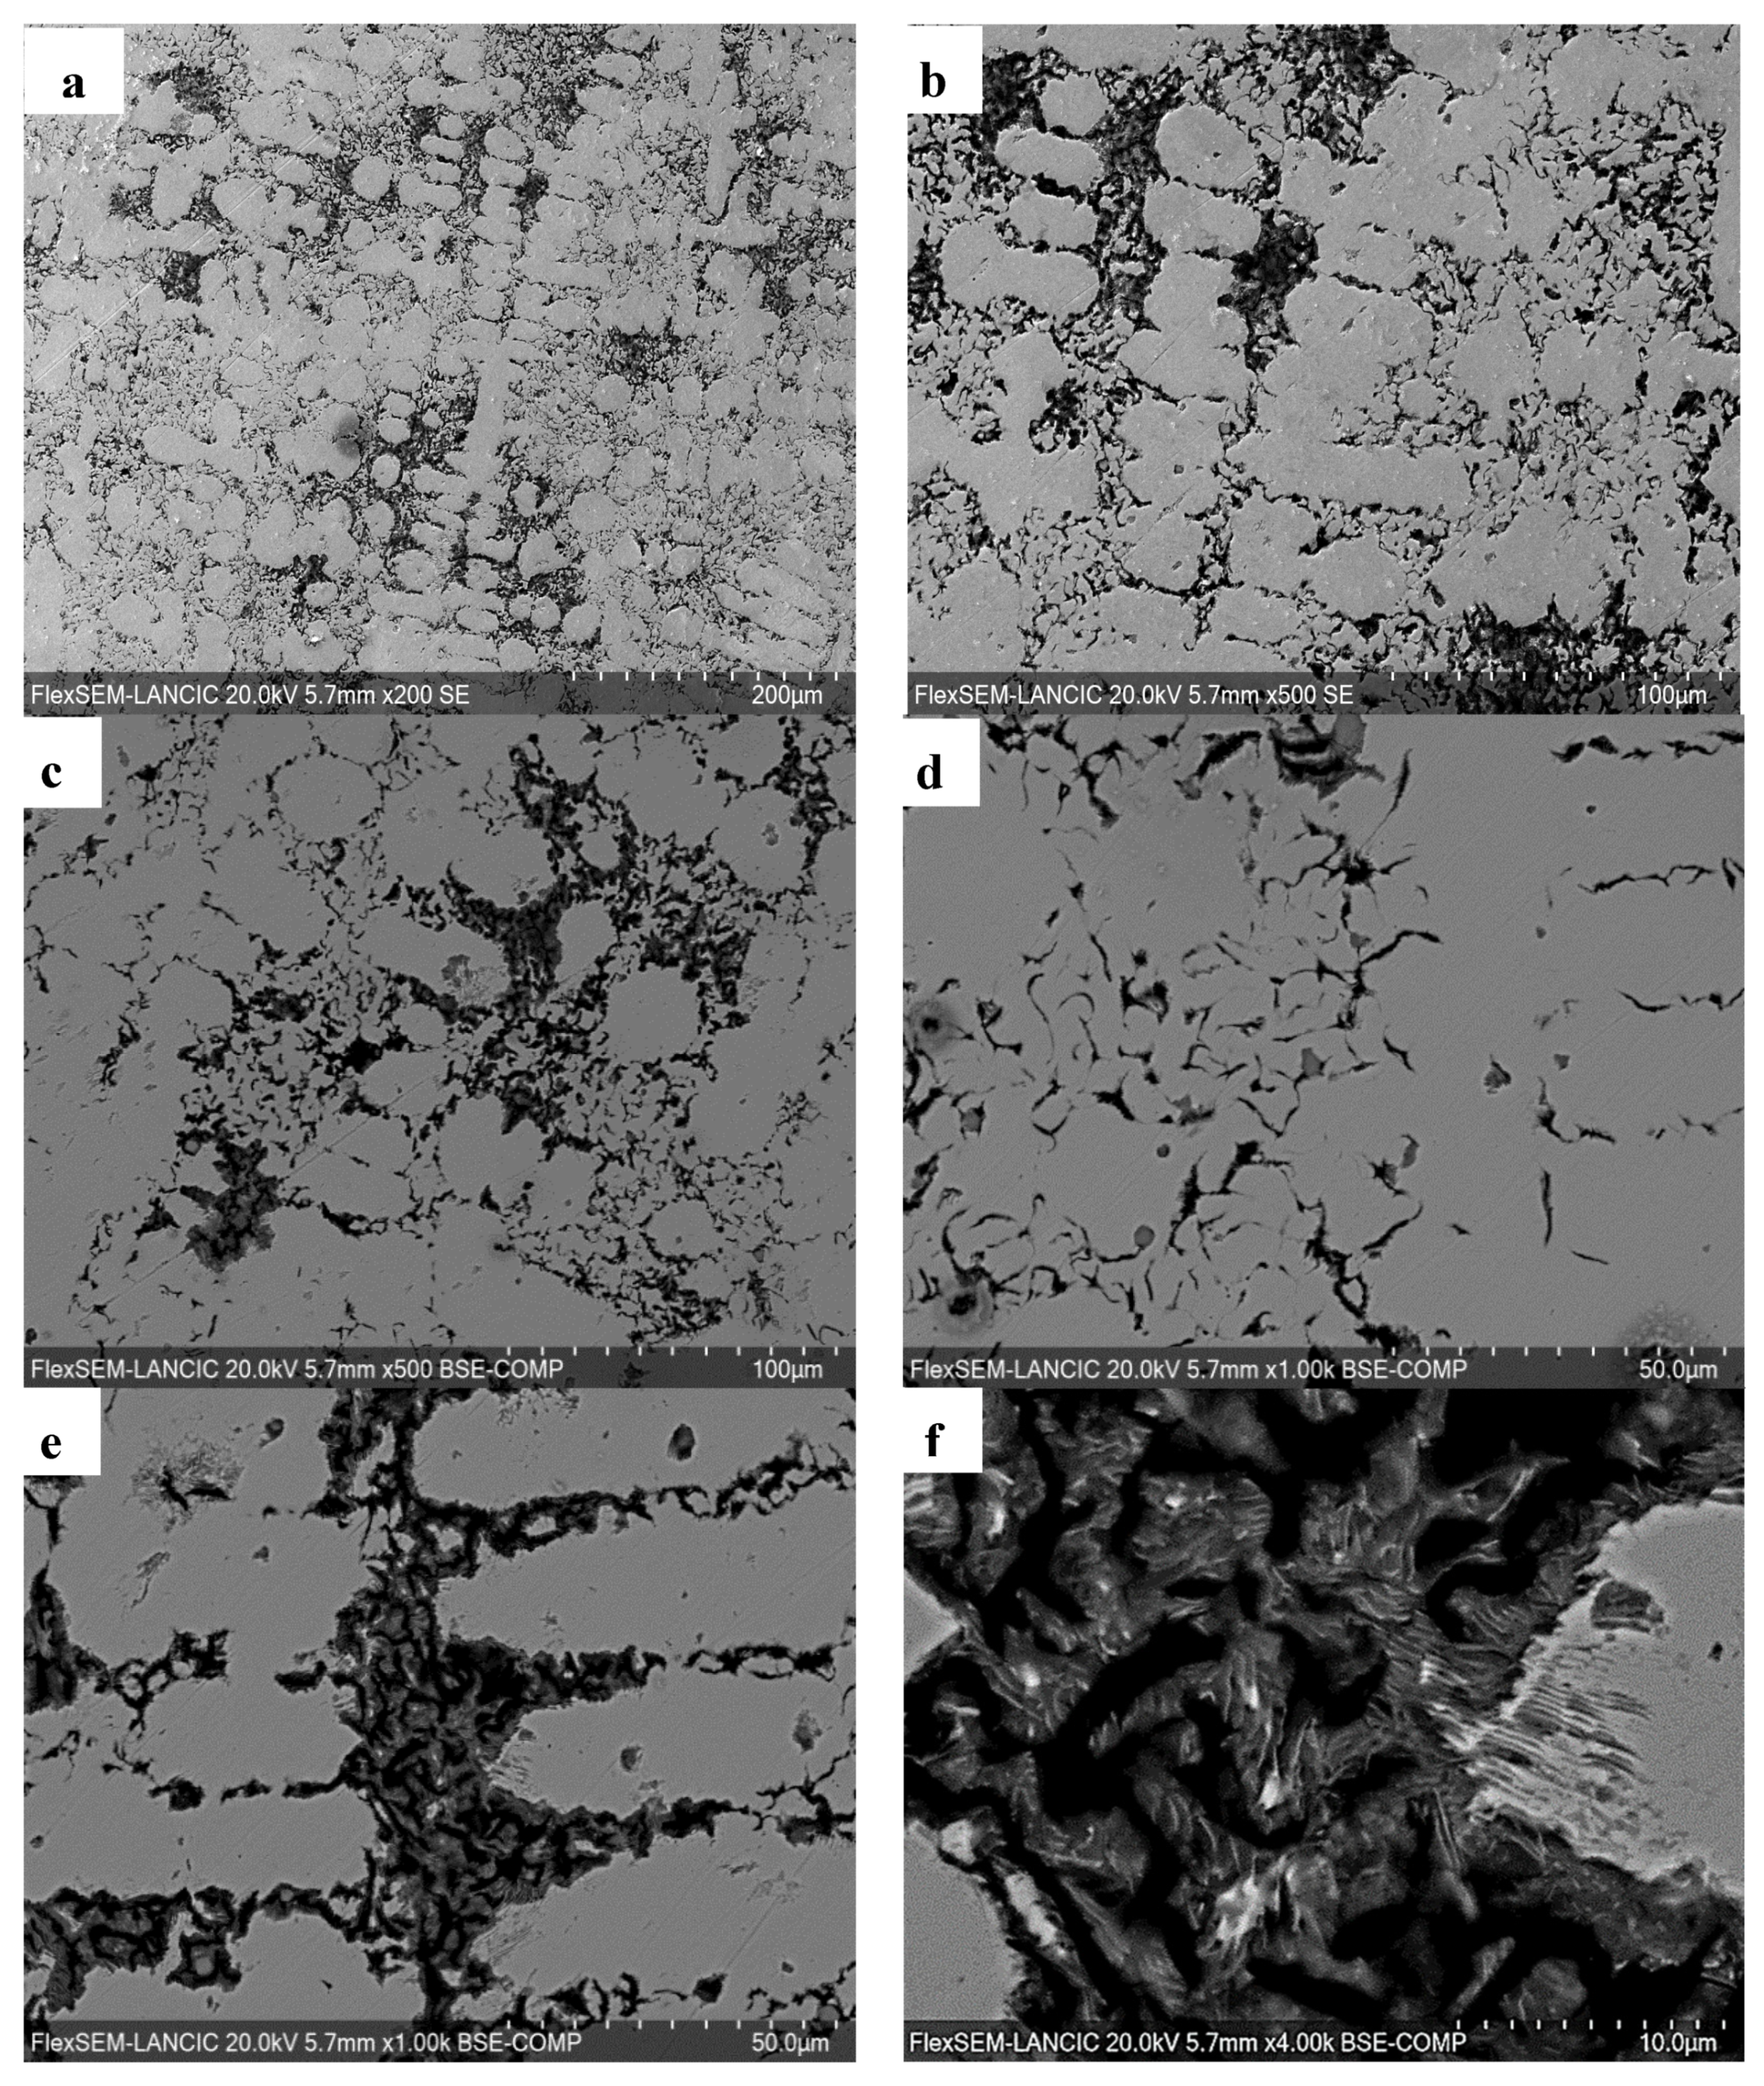
3.1. Metallographic Analysis and Hardness

The Leeb hardness analysis yielded an average value of 412.9 ± 4 HLD; the conversion to Brinell hardness gives an estimate of 192.2 HB (Brinell hardness). According to ASTM A48-41, gray cast iron has a value between 140 and 250 HB and a tensile strength of 220 to 260 ksi. Supplier data indicate that the tensile strength is 37.1 ksi (kLb/in2). According to the above values, gray iron cast iron corresponds to class 35 [33,34].
Using SEM, micrographs were taken at 200× and 500× (Figure 1a,b) of the cast iron microstructure, where dendrites are observed in an essentially ferritic matrix with interdendritic graphite flakes [35,36]. With the backscattered electron detector (BSE), it is possible to differentiate by atomic number contrast the presence of two phases; the light zone is a pearlitic matrix and the dark one is associated with graphite. Given the type of microstructure in Figure 1c,d at 500× and 1000×, after attack with 3% nital, the high carbon content in the cast iron or gray cast iron can be appreciated, since all the filler surrounding the type A graphite flakes is a pearlitic matrix [37,38]. Similarly, type B or rosette graphite is observed. In Figure 1d, the pearlitic phase is not observed, only the ferritic phase, which is a solid solution with a minimum amount of carbon dissolved in iron [39]. In Figure 1e,f, the characteristic morphology of graphite flakes is observed at 1000× and 4000×.
Gray iron derives its name from its fractured gray surface, which occurs because graphitic flakes deflect one crack that grinds and initiates countless new cracks when the material breaks. Large flakes of graphite reduce strength and ductility. A characteristic of graphite flakes is their damping and machinability, because graphite acts as a chip breaker and lubricates cutting tools [40].
In the elemental chemical mapping (Figure 2), it is observed that the dark zones are certainly composed of C, and the gray zone of Fe. A homogeneous distribution of Si in the microstructure can be observed. In the graphite flakes, C, O, Fe, and Si were found in majority percentages. Na, S, Cl, Ca, and Mn were found in smaller amounts (Table 1). Na, Cl, and Ca are impurities incorporated during surface preparation. However, S found by EDS analysis favors the formation of graphite flakes. Si decreases pearlite stability, hardness, and wear resistance, and increases machinability; Mn increases hardness and pearlite stability, while Cr increases pearlite stability, wear resistance, and hardness, and decreases machinability. On the other hand, the composition coincides with gray cast iron, having a content of 3.63% C and 2.22% Si dissolved in Fe. Si and Mn are the most common alloying elements in cast irons. In the case of silicon, a generally accepted theory is that the introduction of Si and its dissolution in molten iron contributes to the formation of graphite. Mn dissolves in solid solution and also forms MnS inclusions that can be observed in elemental chemical mapping (Figure 2e,f), in the form of polygonal-shaped particles [41].

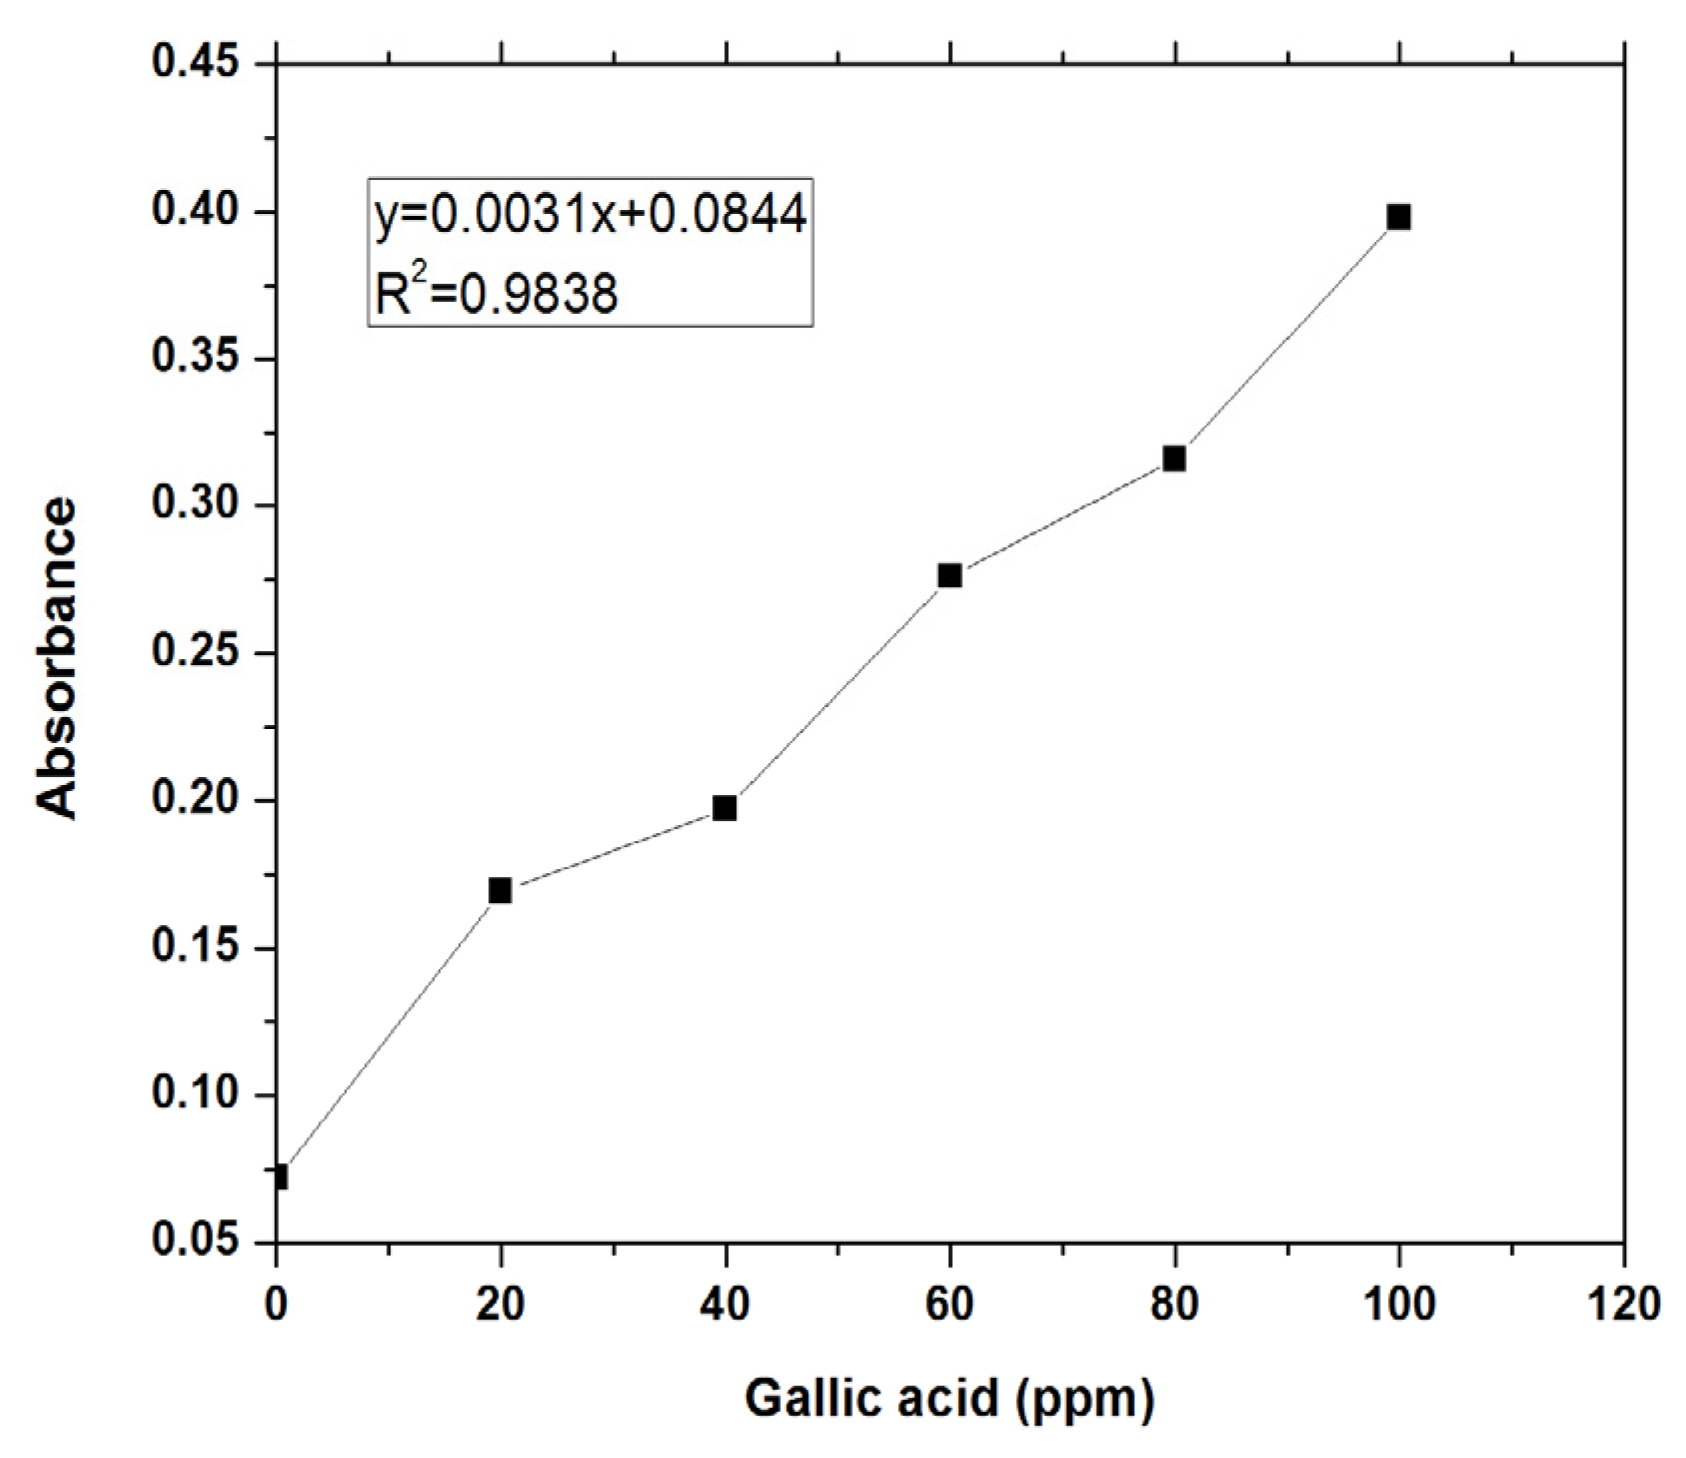
3.2. Total Polyphenol Content

The Folin–Ciocalteu (F-C) assay is a reaction based on electron transfer that measures the reducing capacity of an antioxidant and is used to compare the presence of phenolic compounds extracted by different solvents. The F-C method provides the reducing capacity of a sample, which is usually expressed in terms of phenolic content, i.e., the phenolic ion that changes from yellow to blue. Therefore, the absorbance is measured at 765 nm [42,43]. Figure 3 shows the calibration curve of absorbance vs. concentration of gallic acid standard obtained at 765 nm. The ethanolic extract of Mimosa tenuiflora has a total polyphenol concentration of 609 mg/g GAE. The color of the extract with the F-C reagent was dark blue.

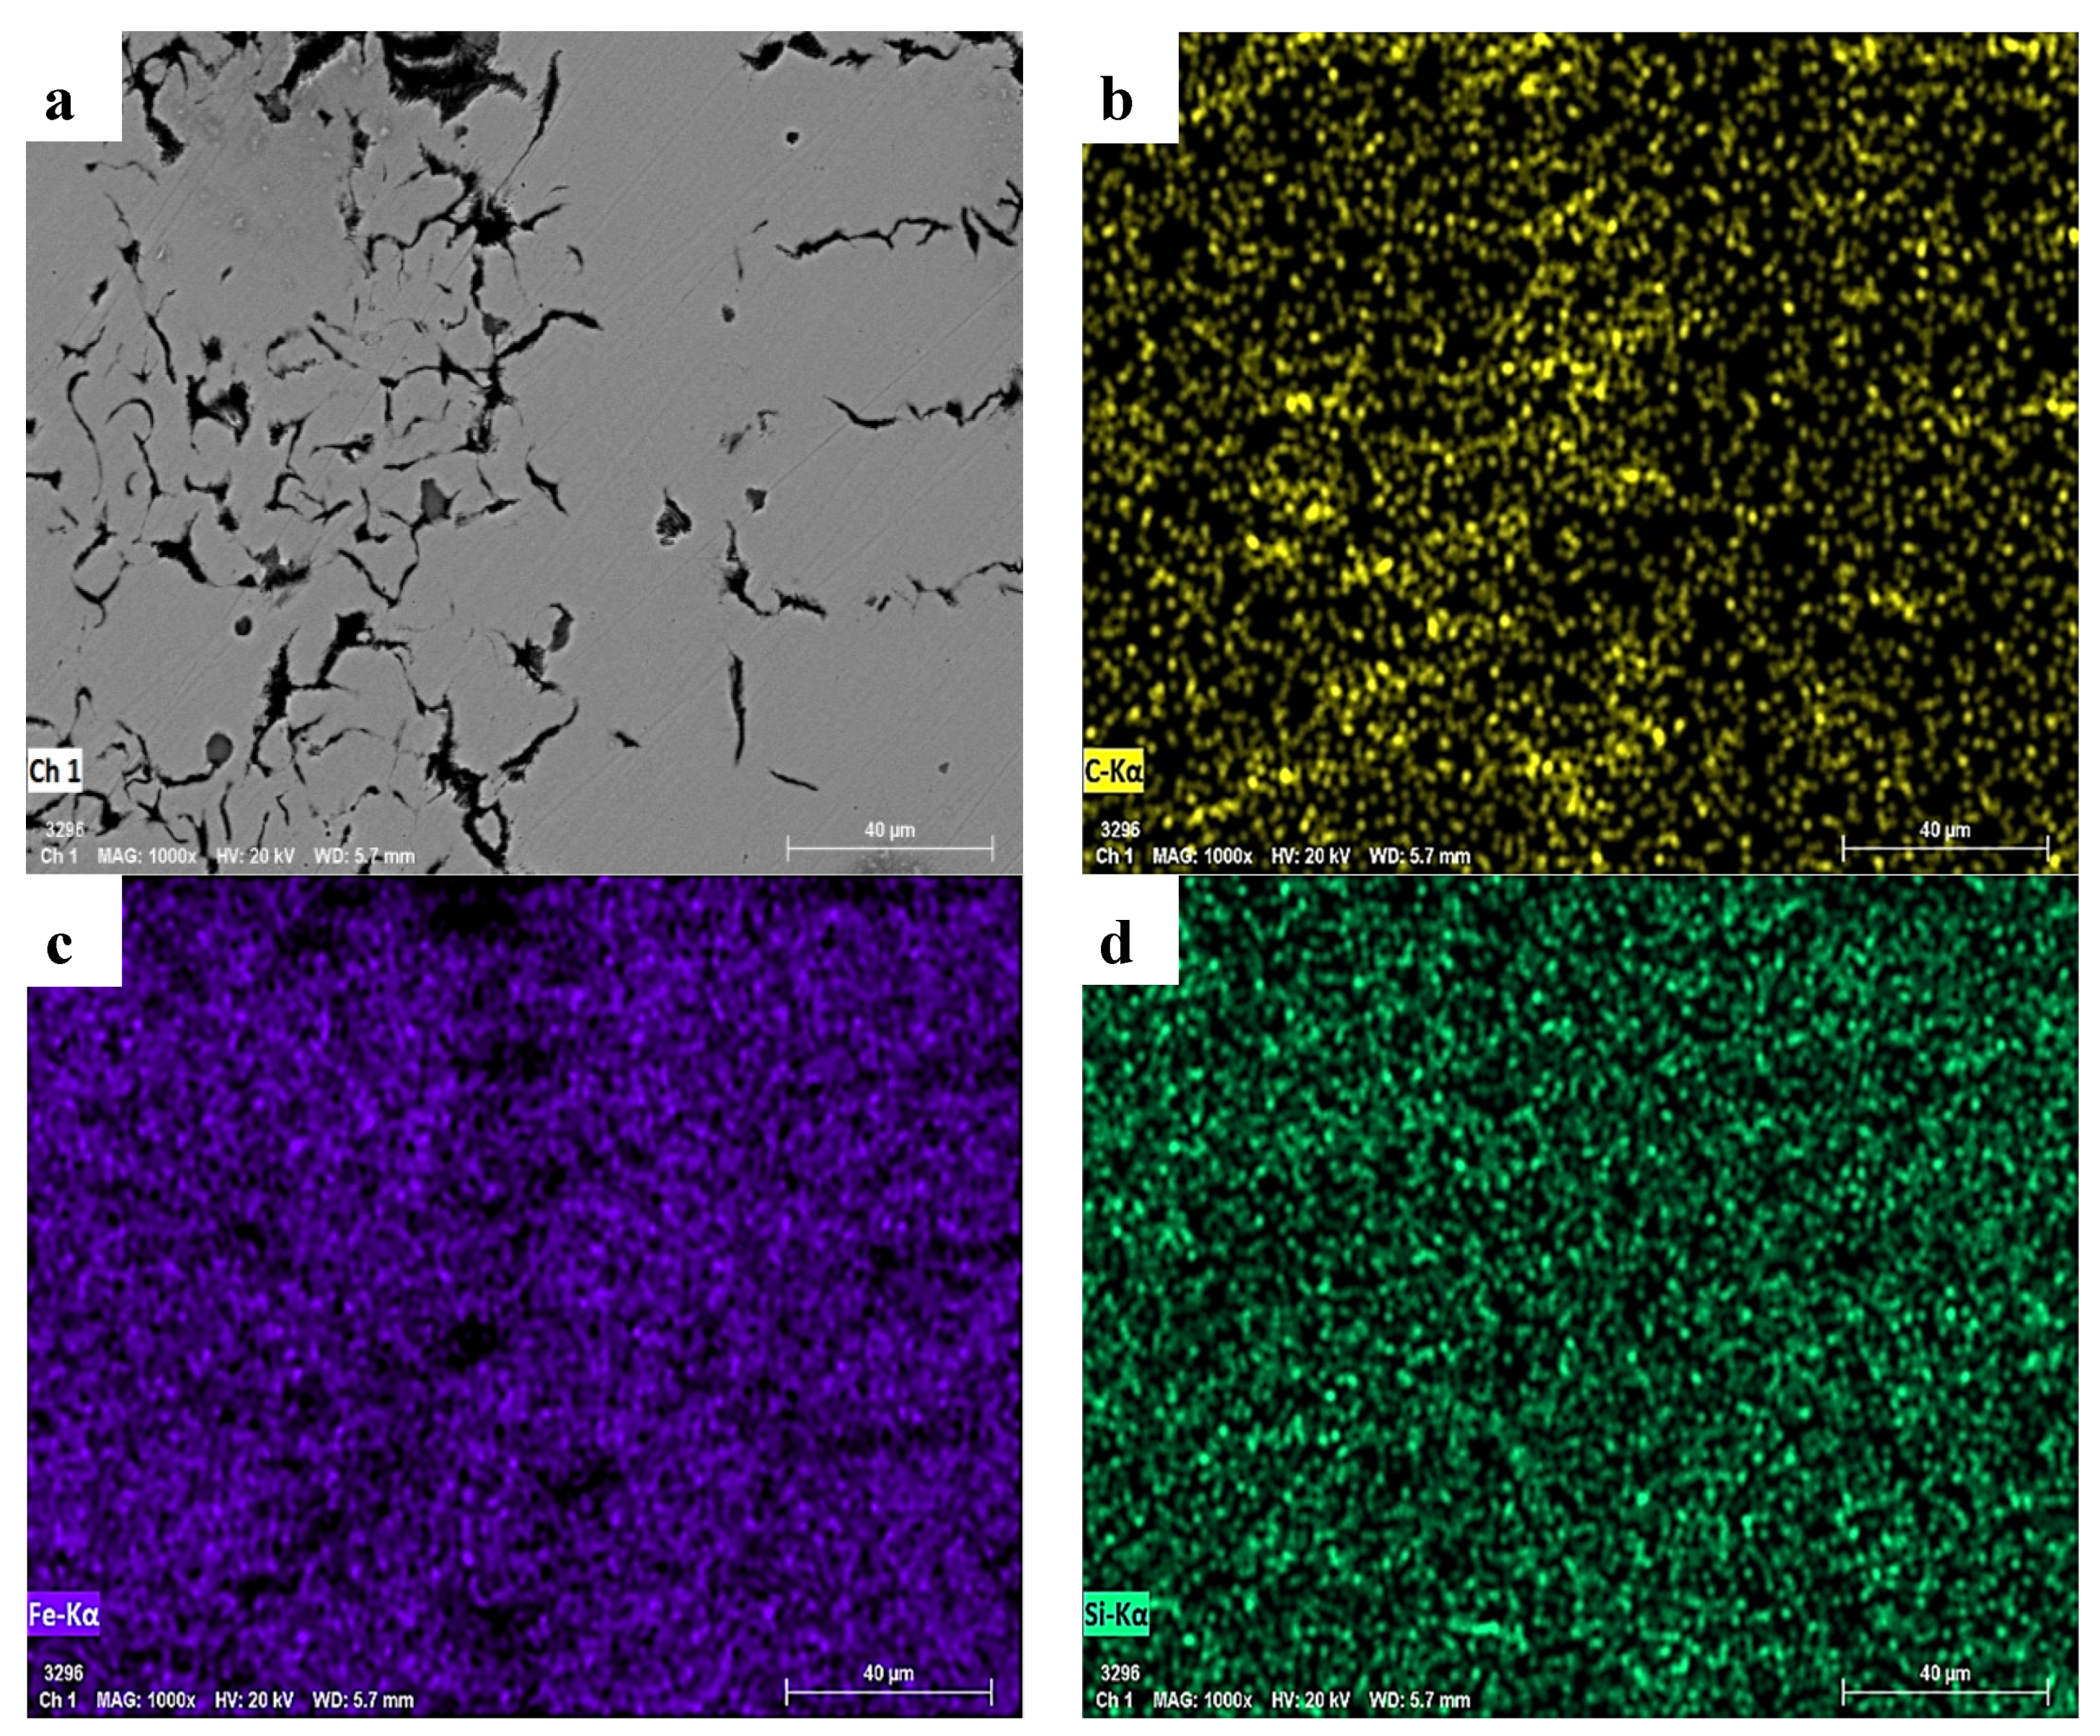
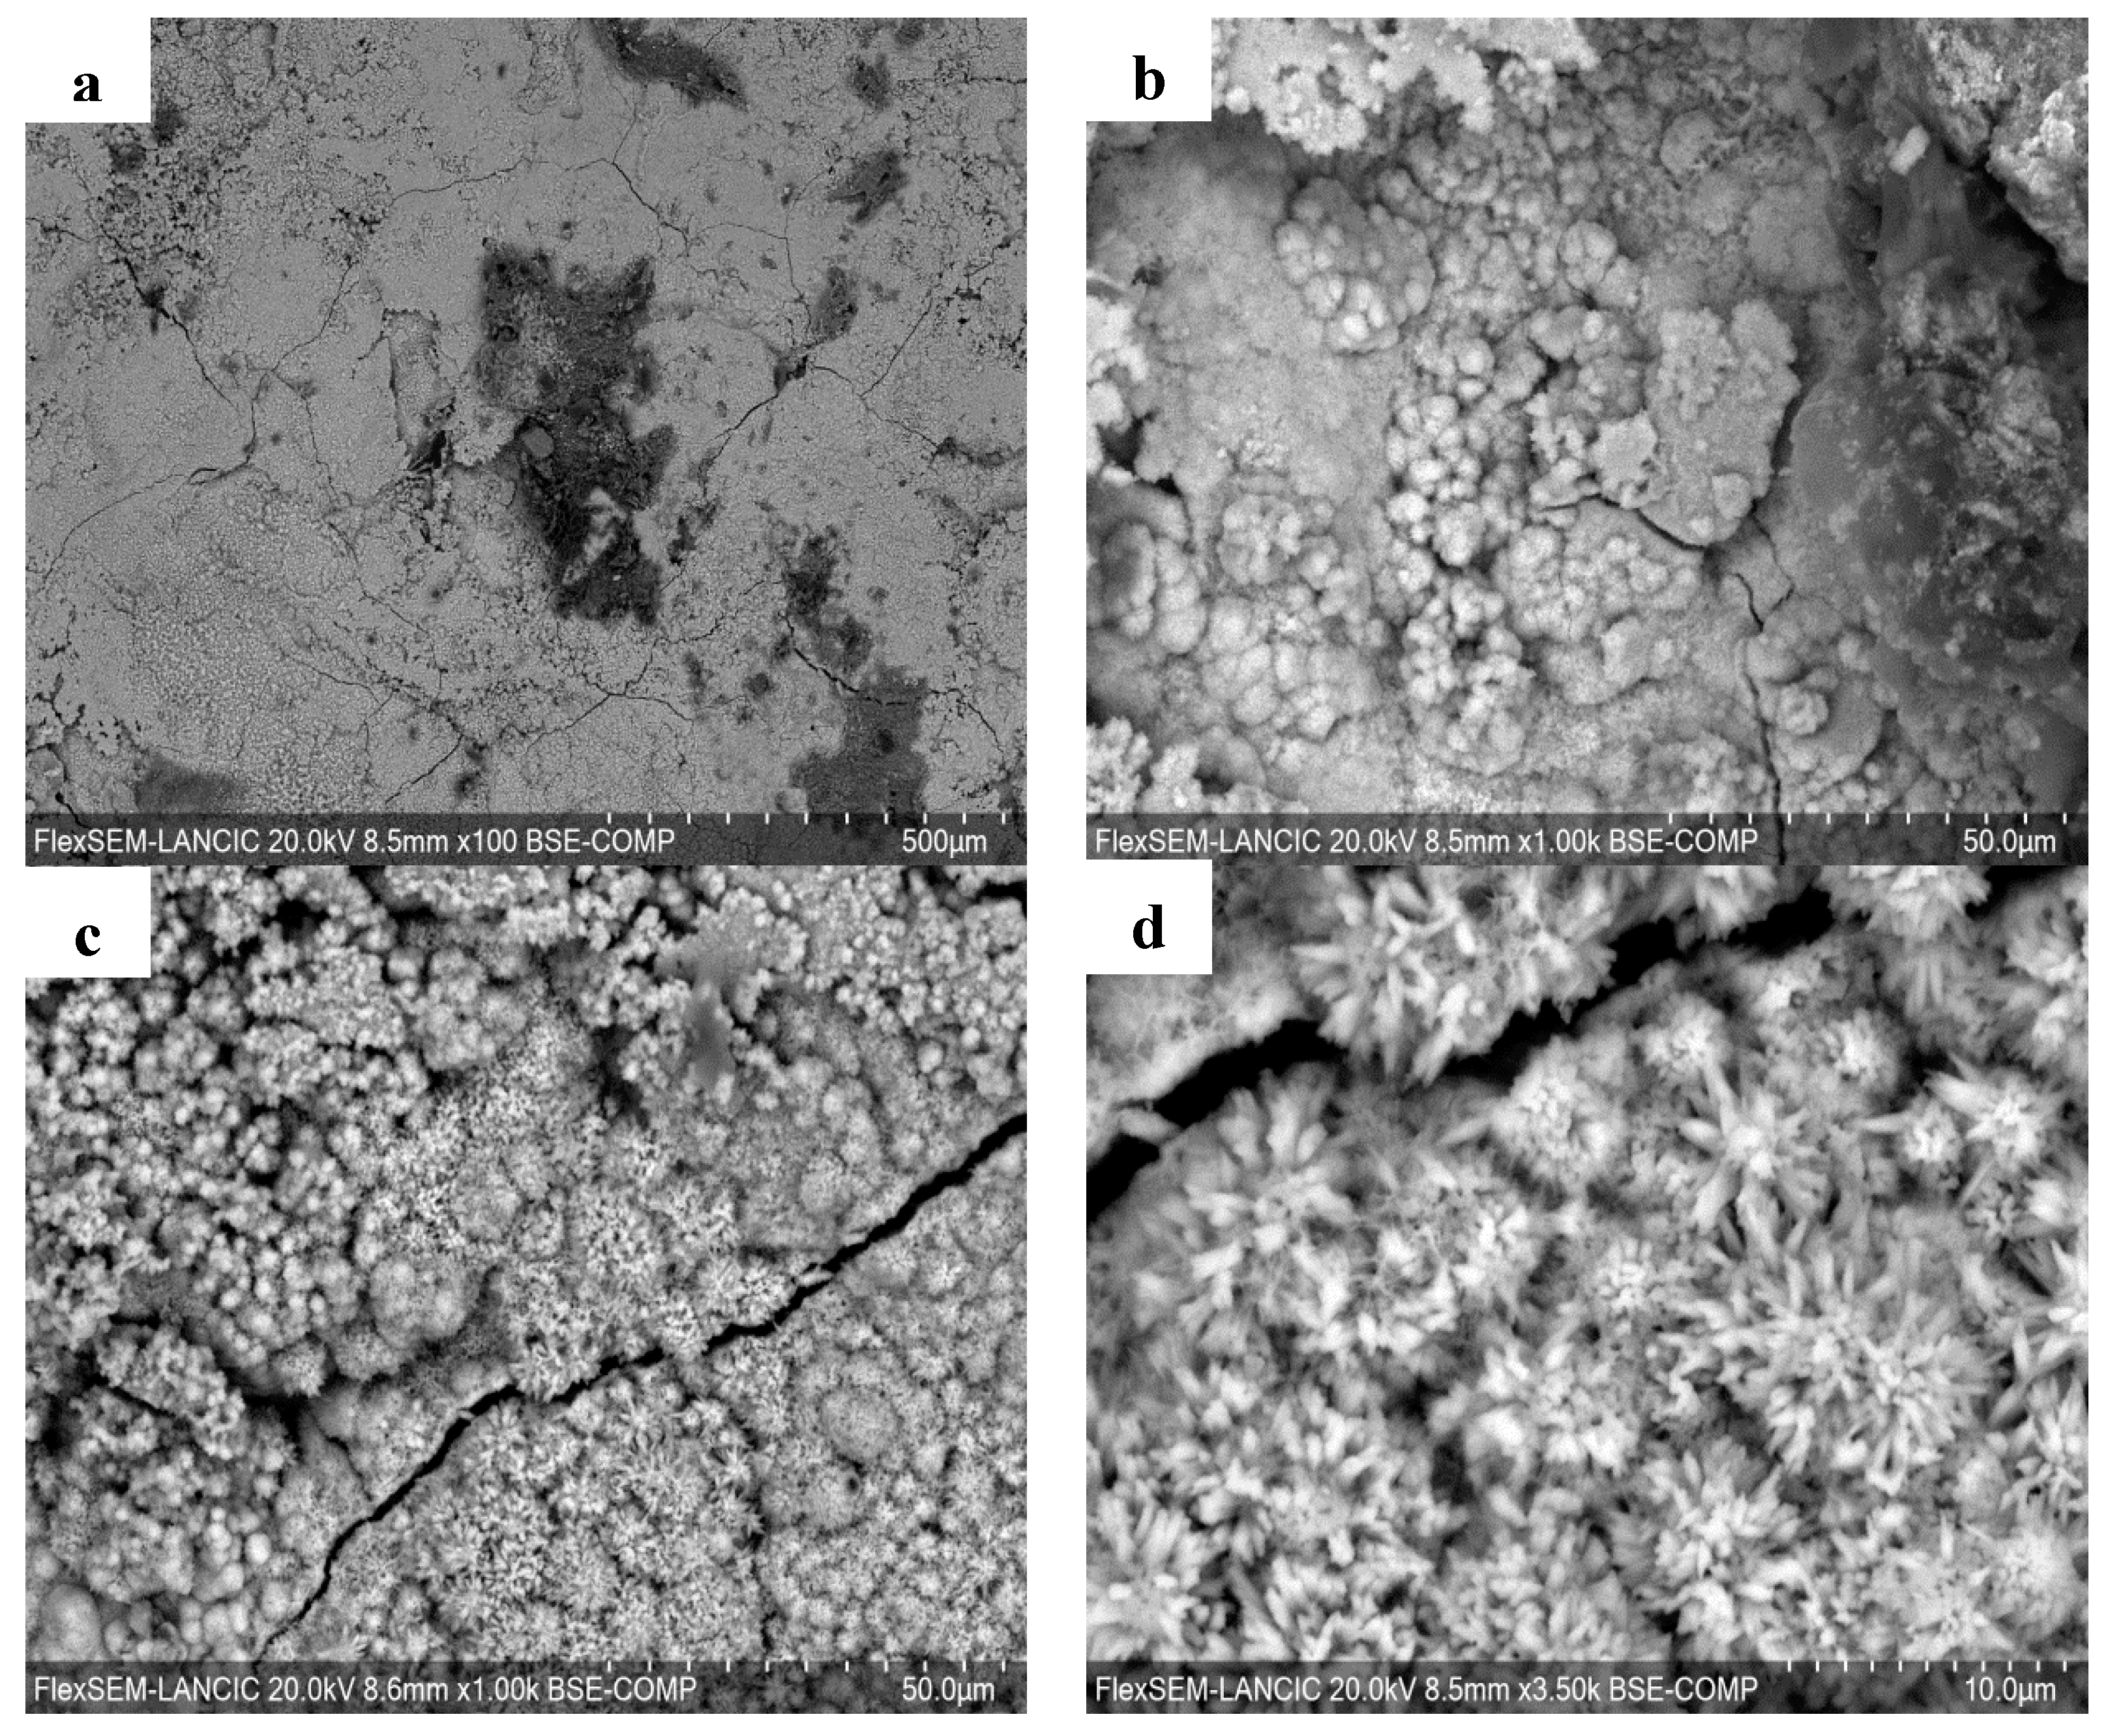
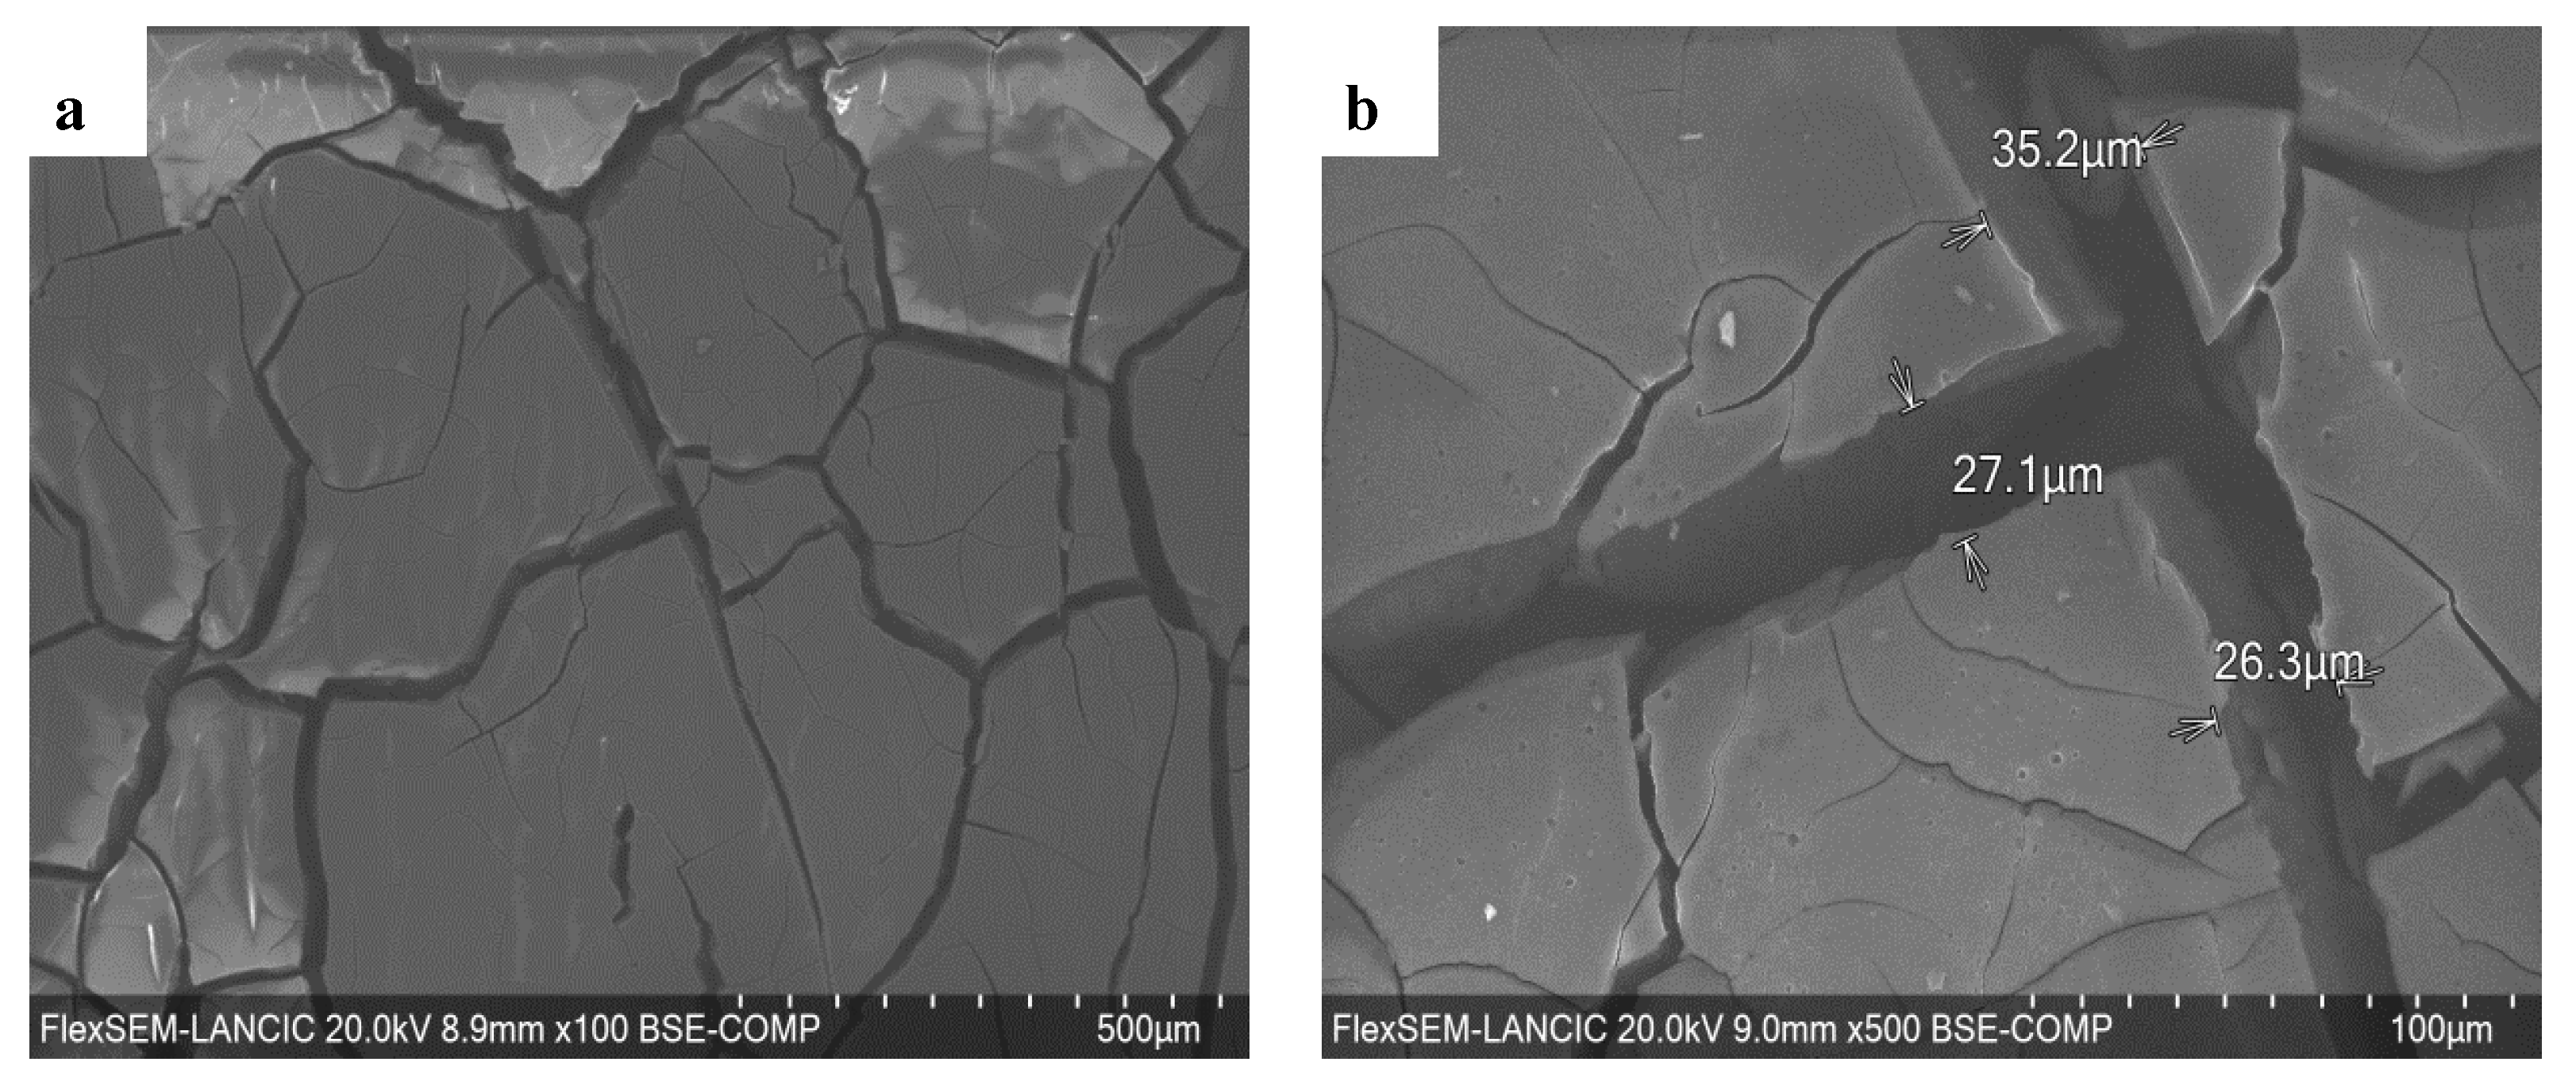
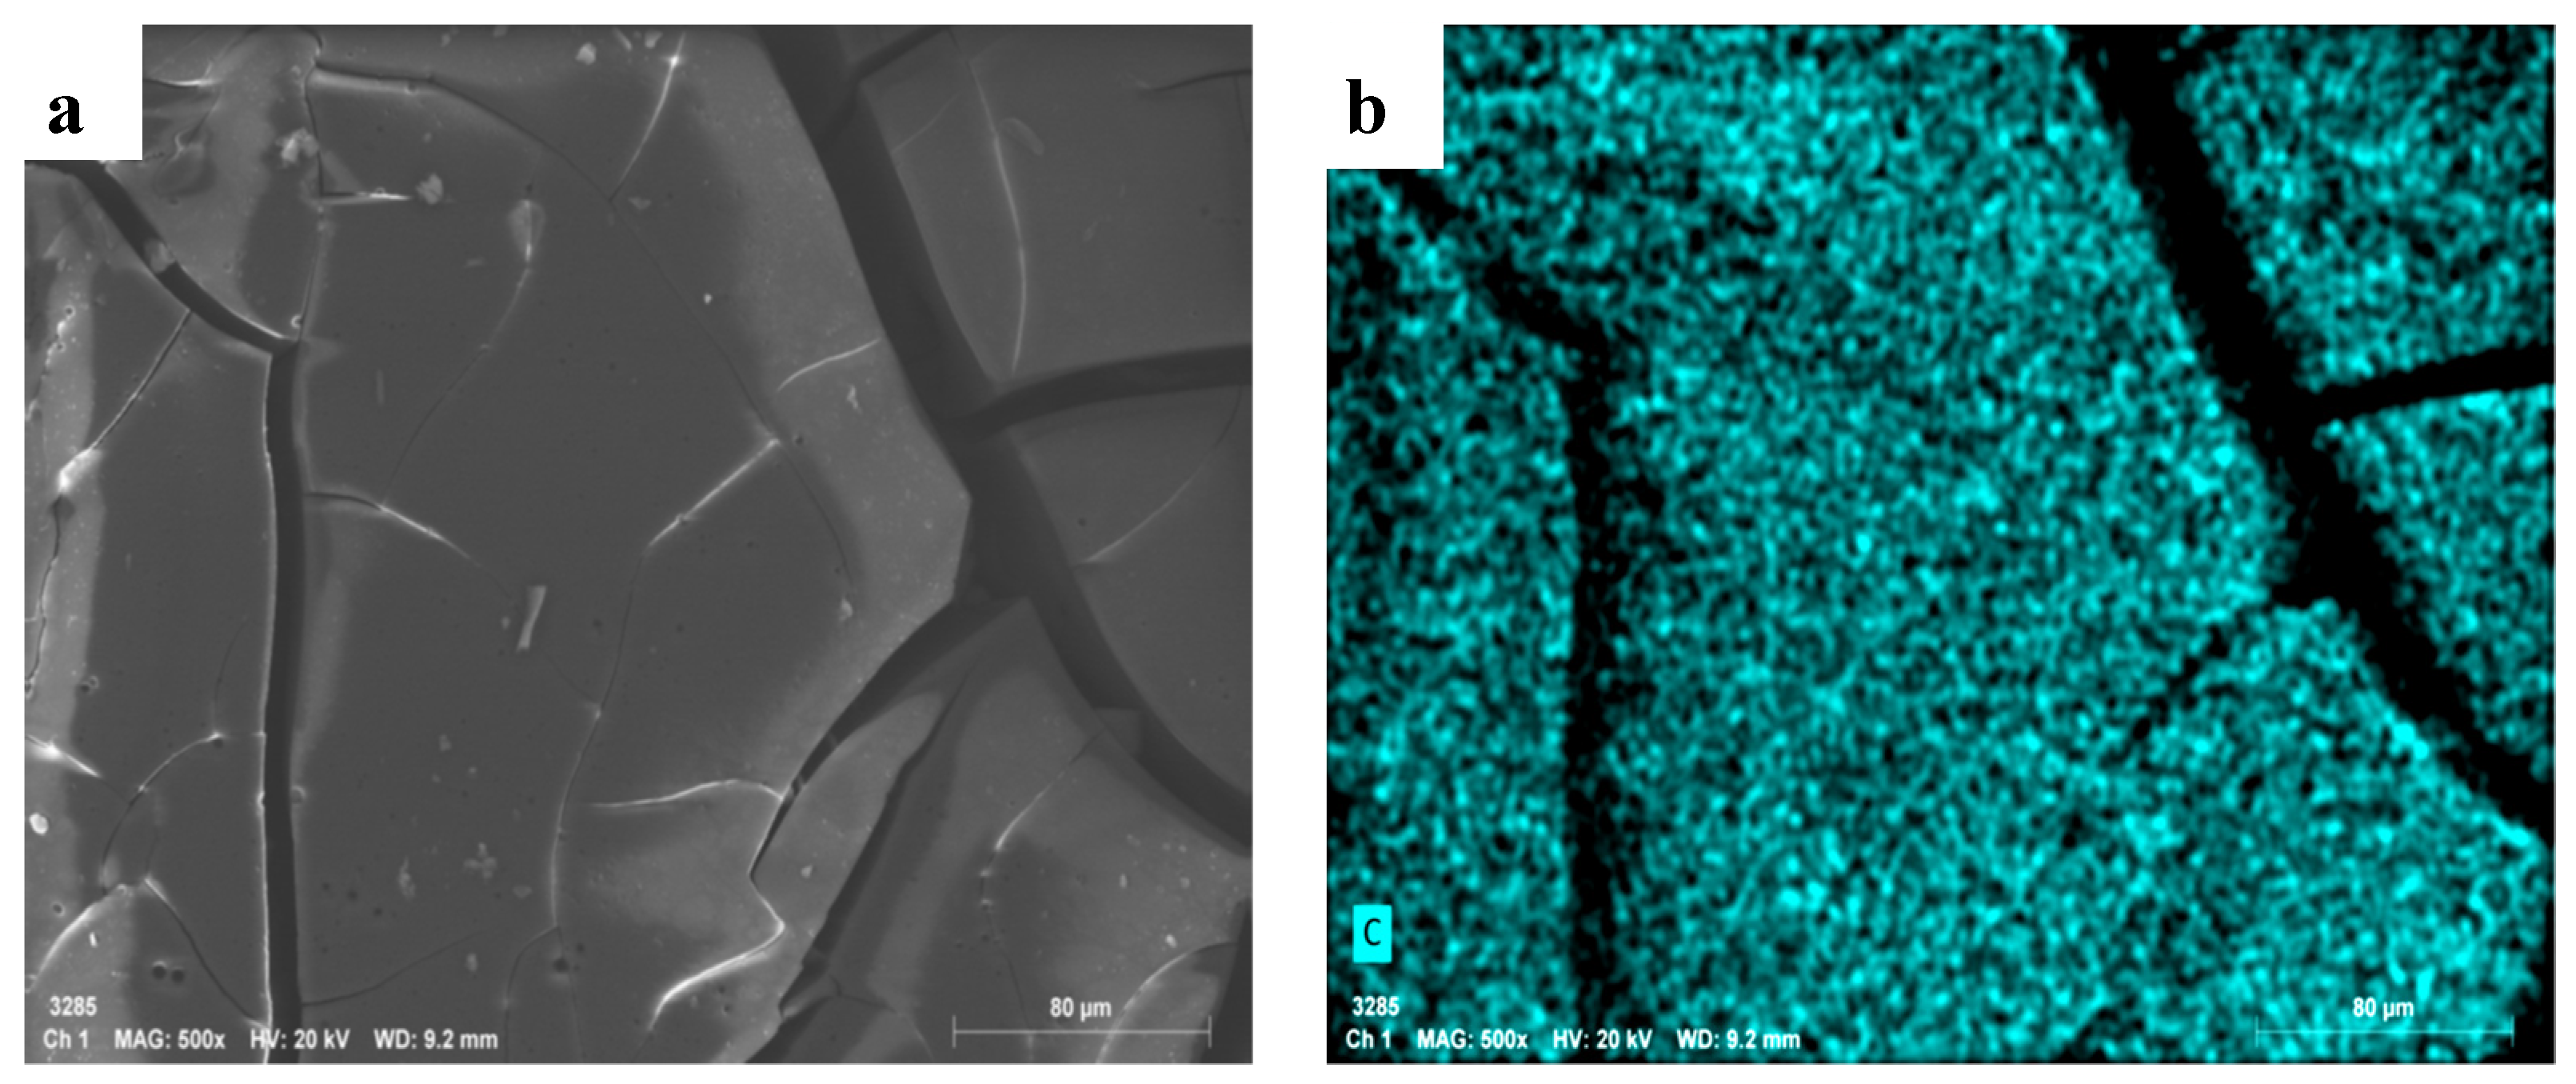
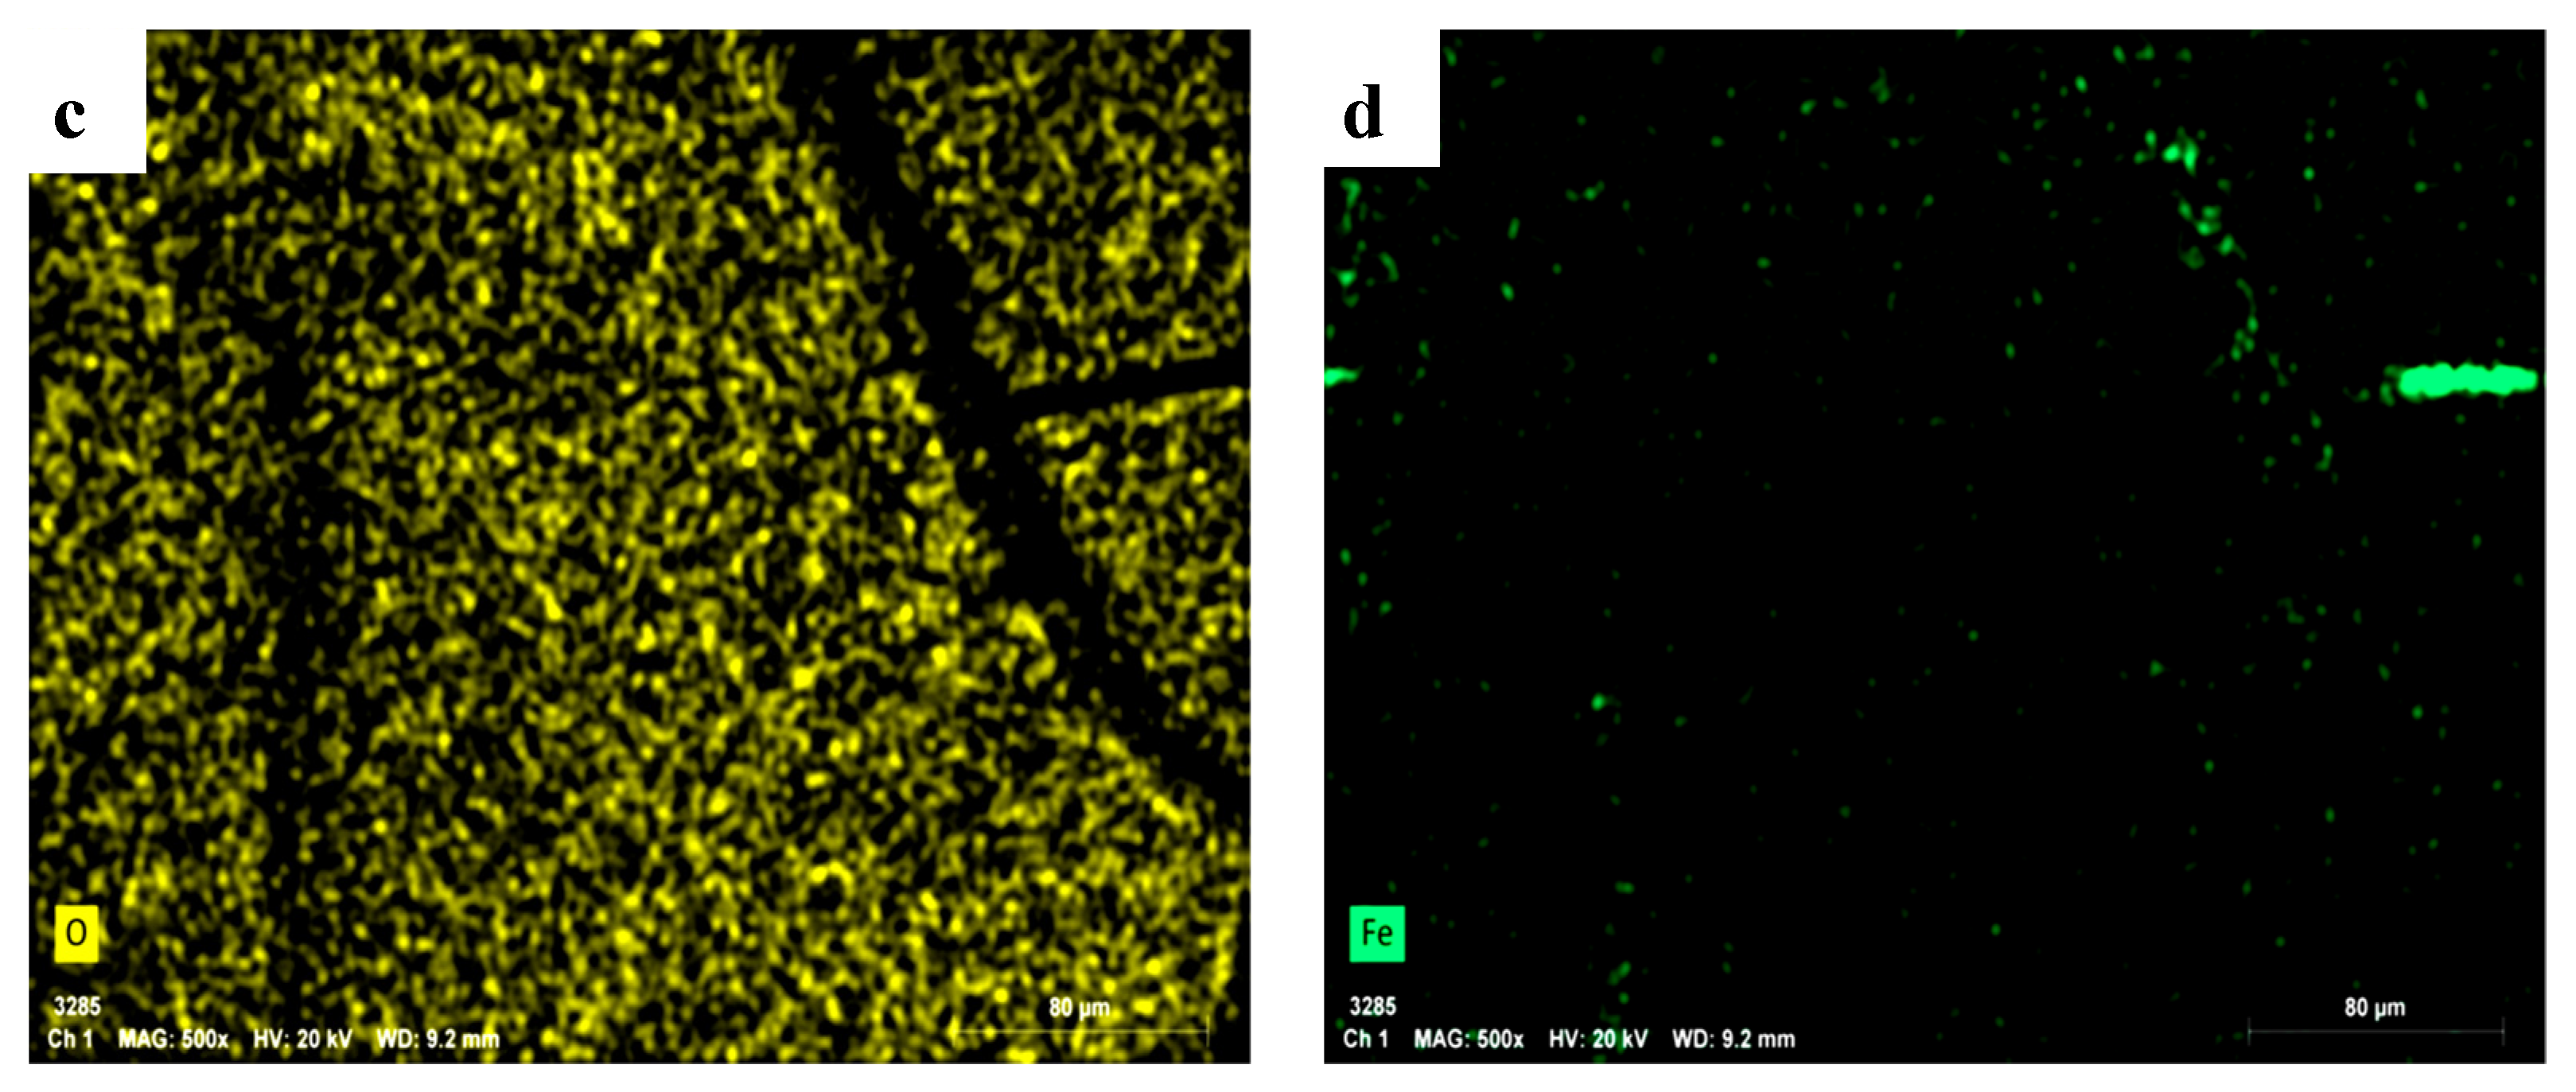
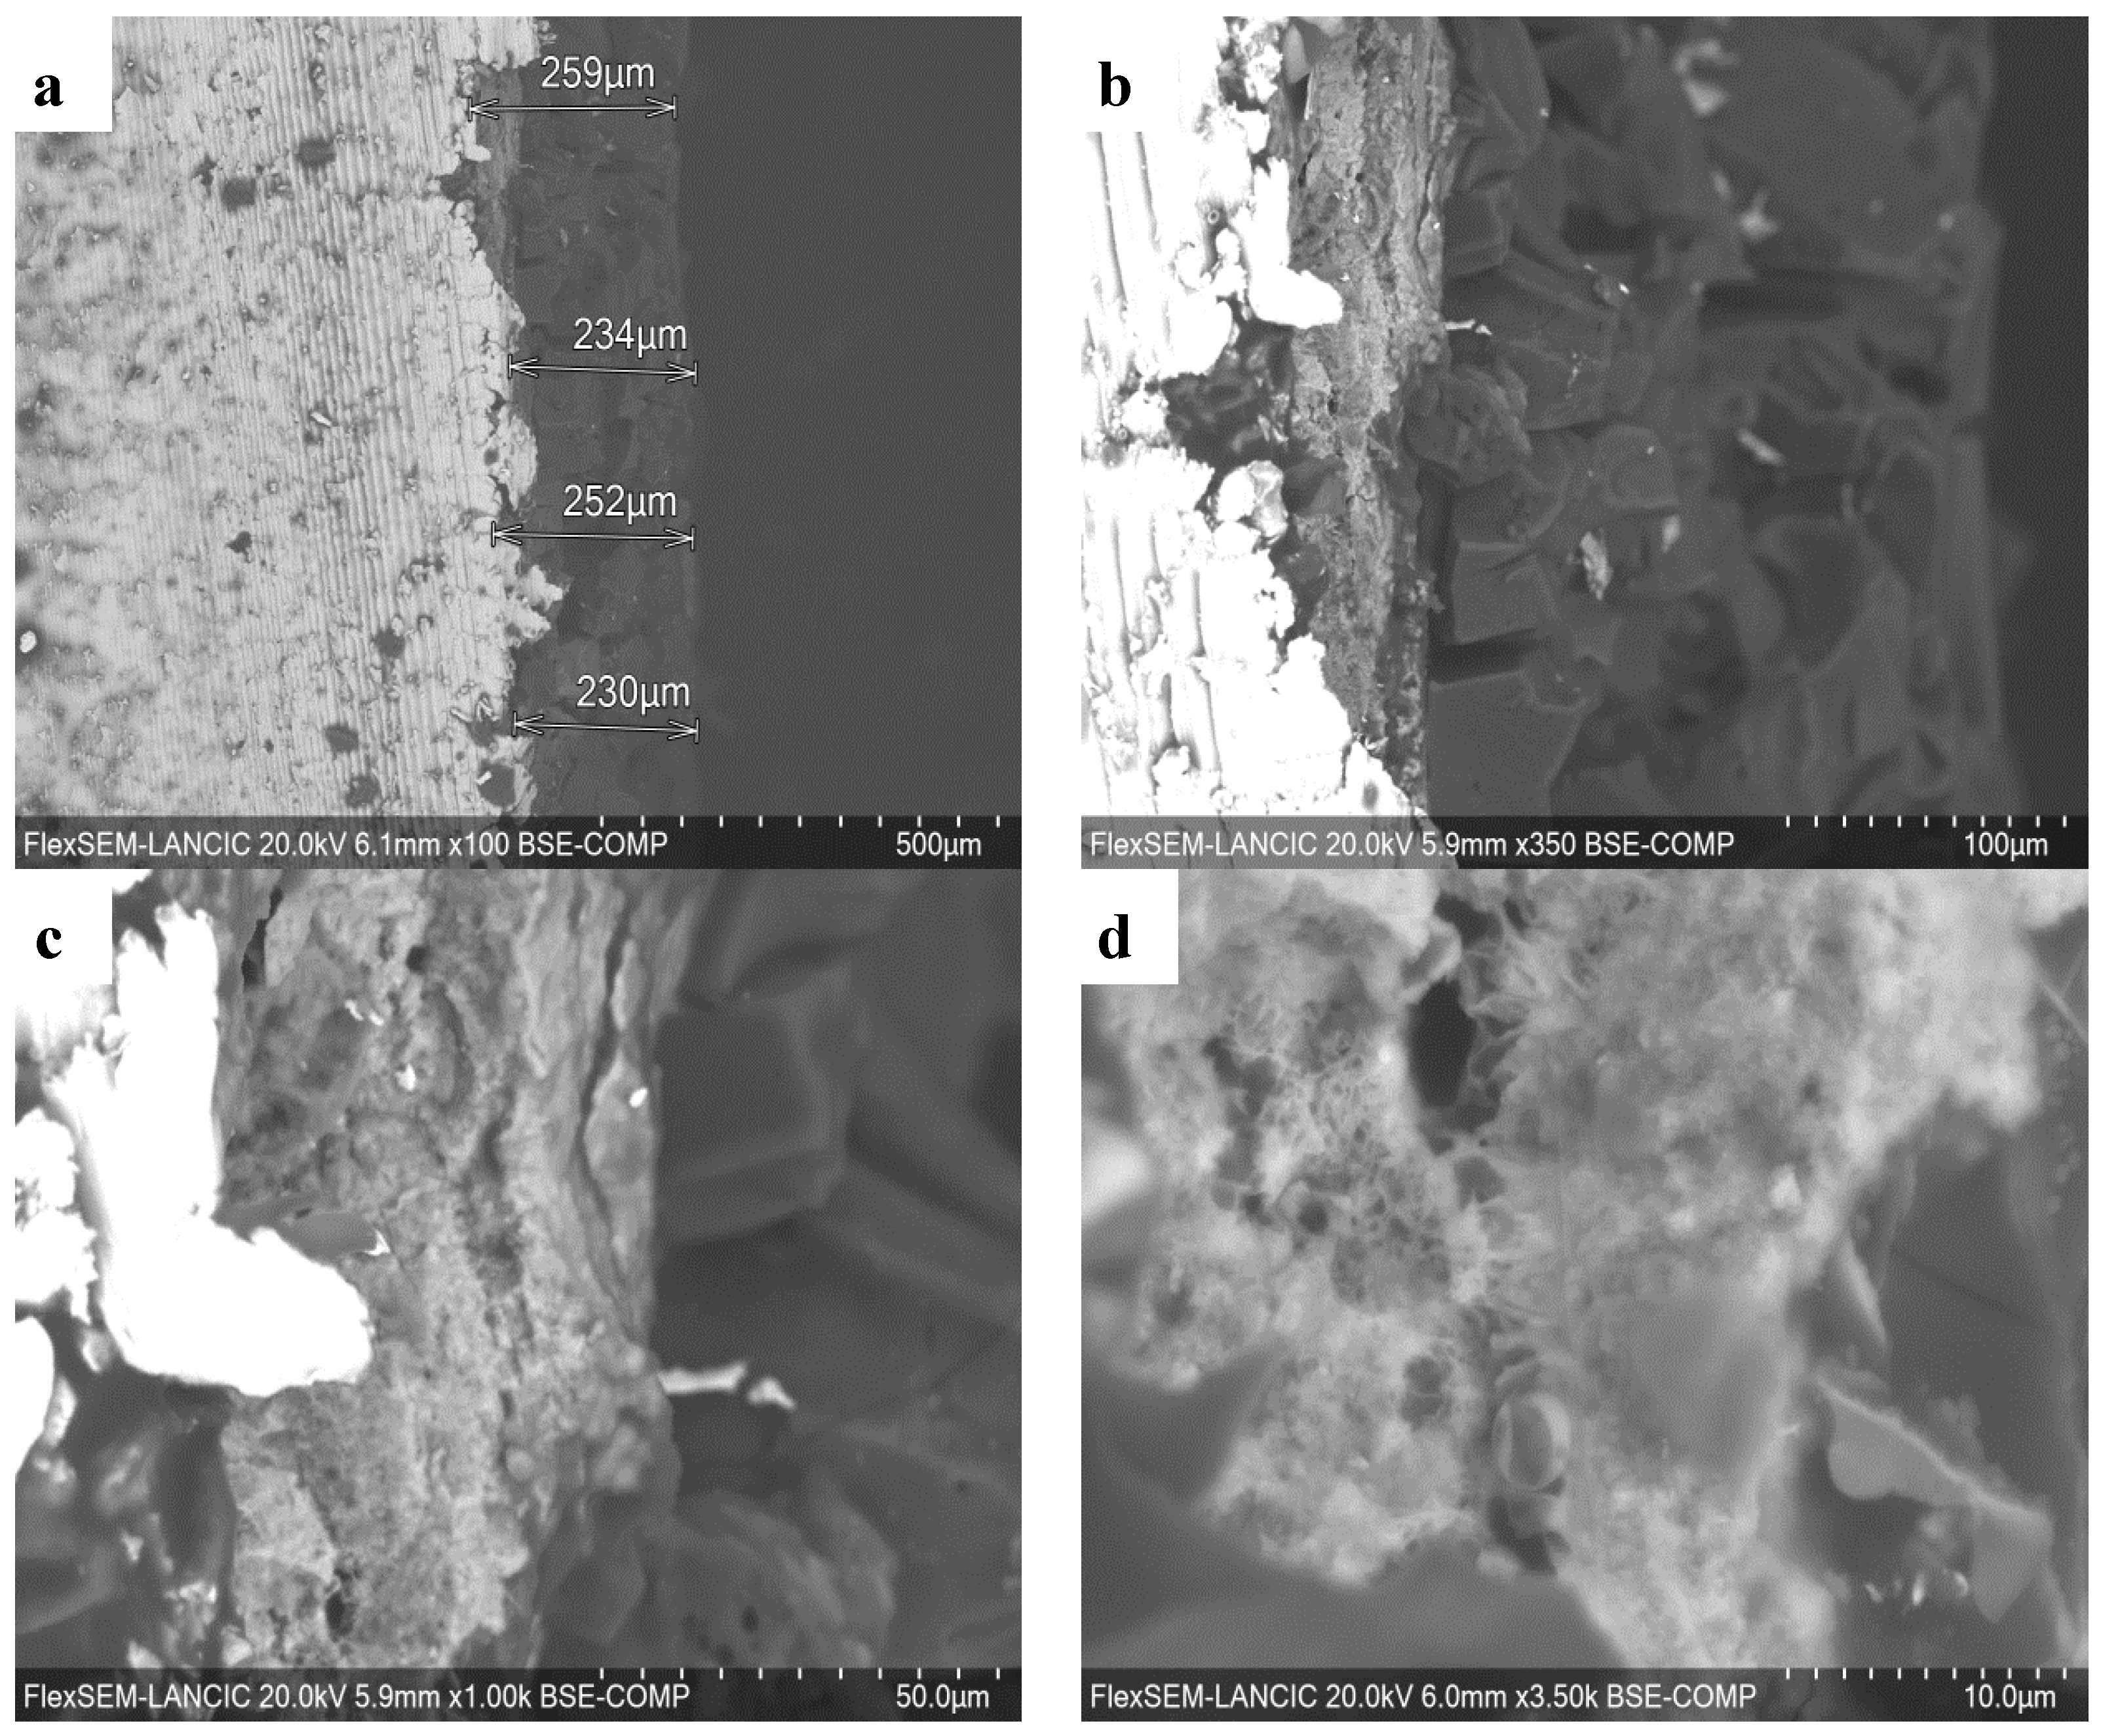
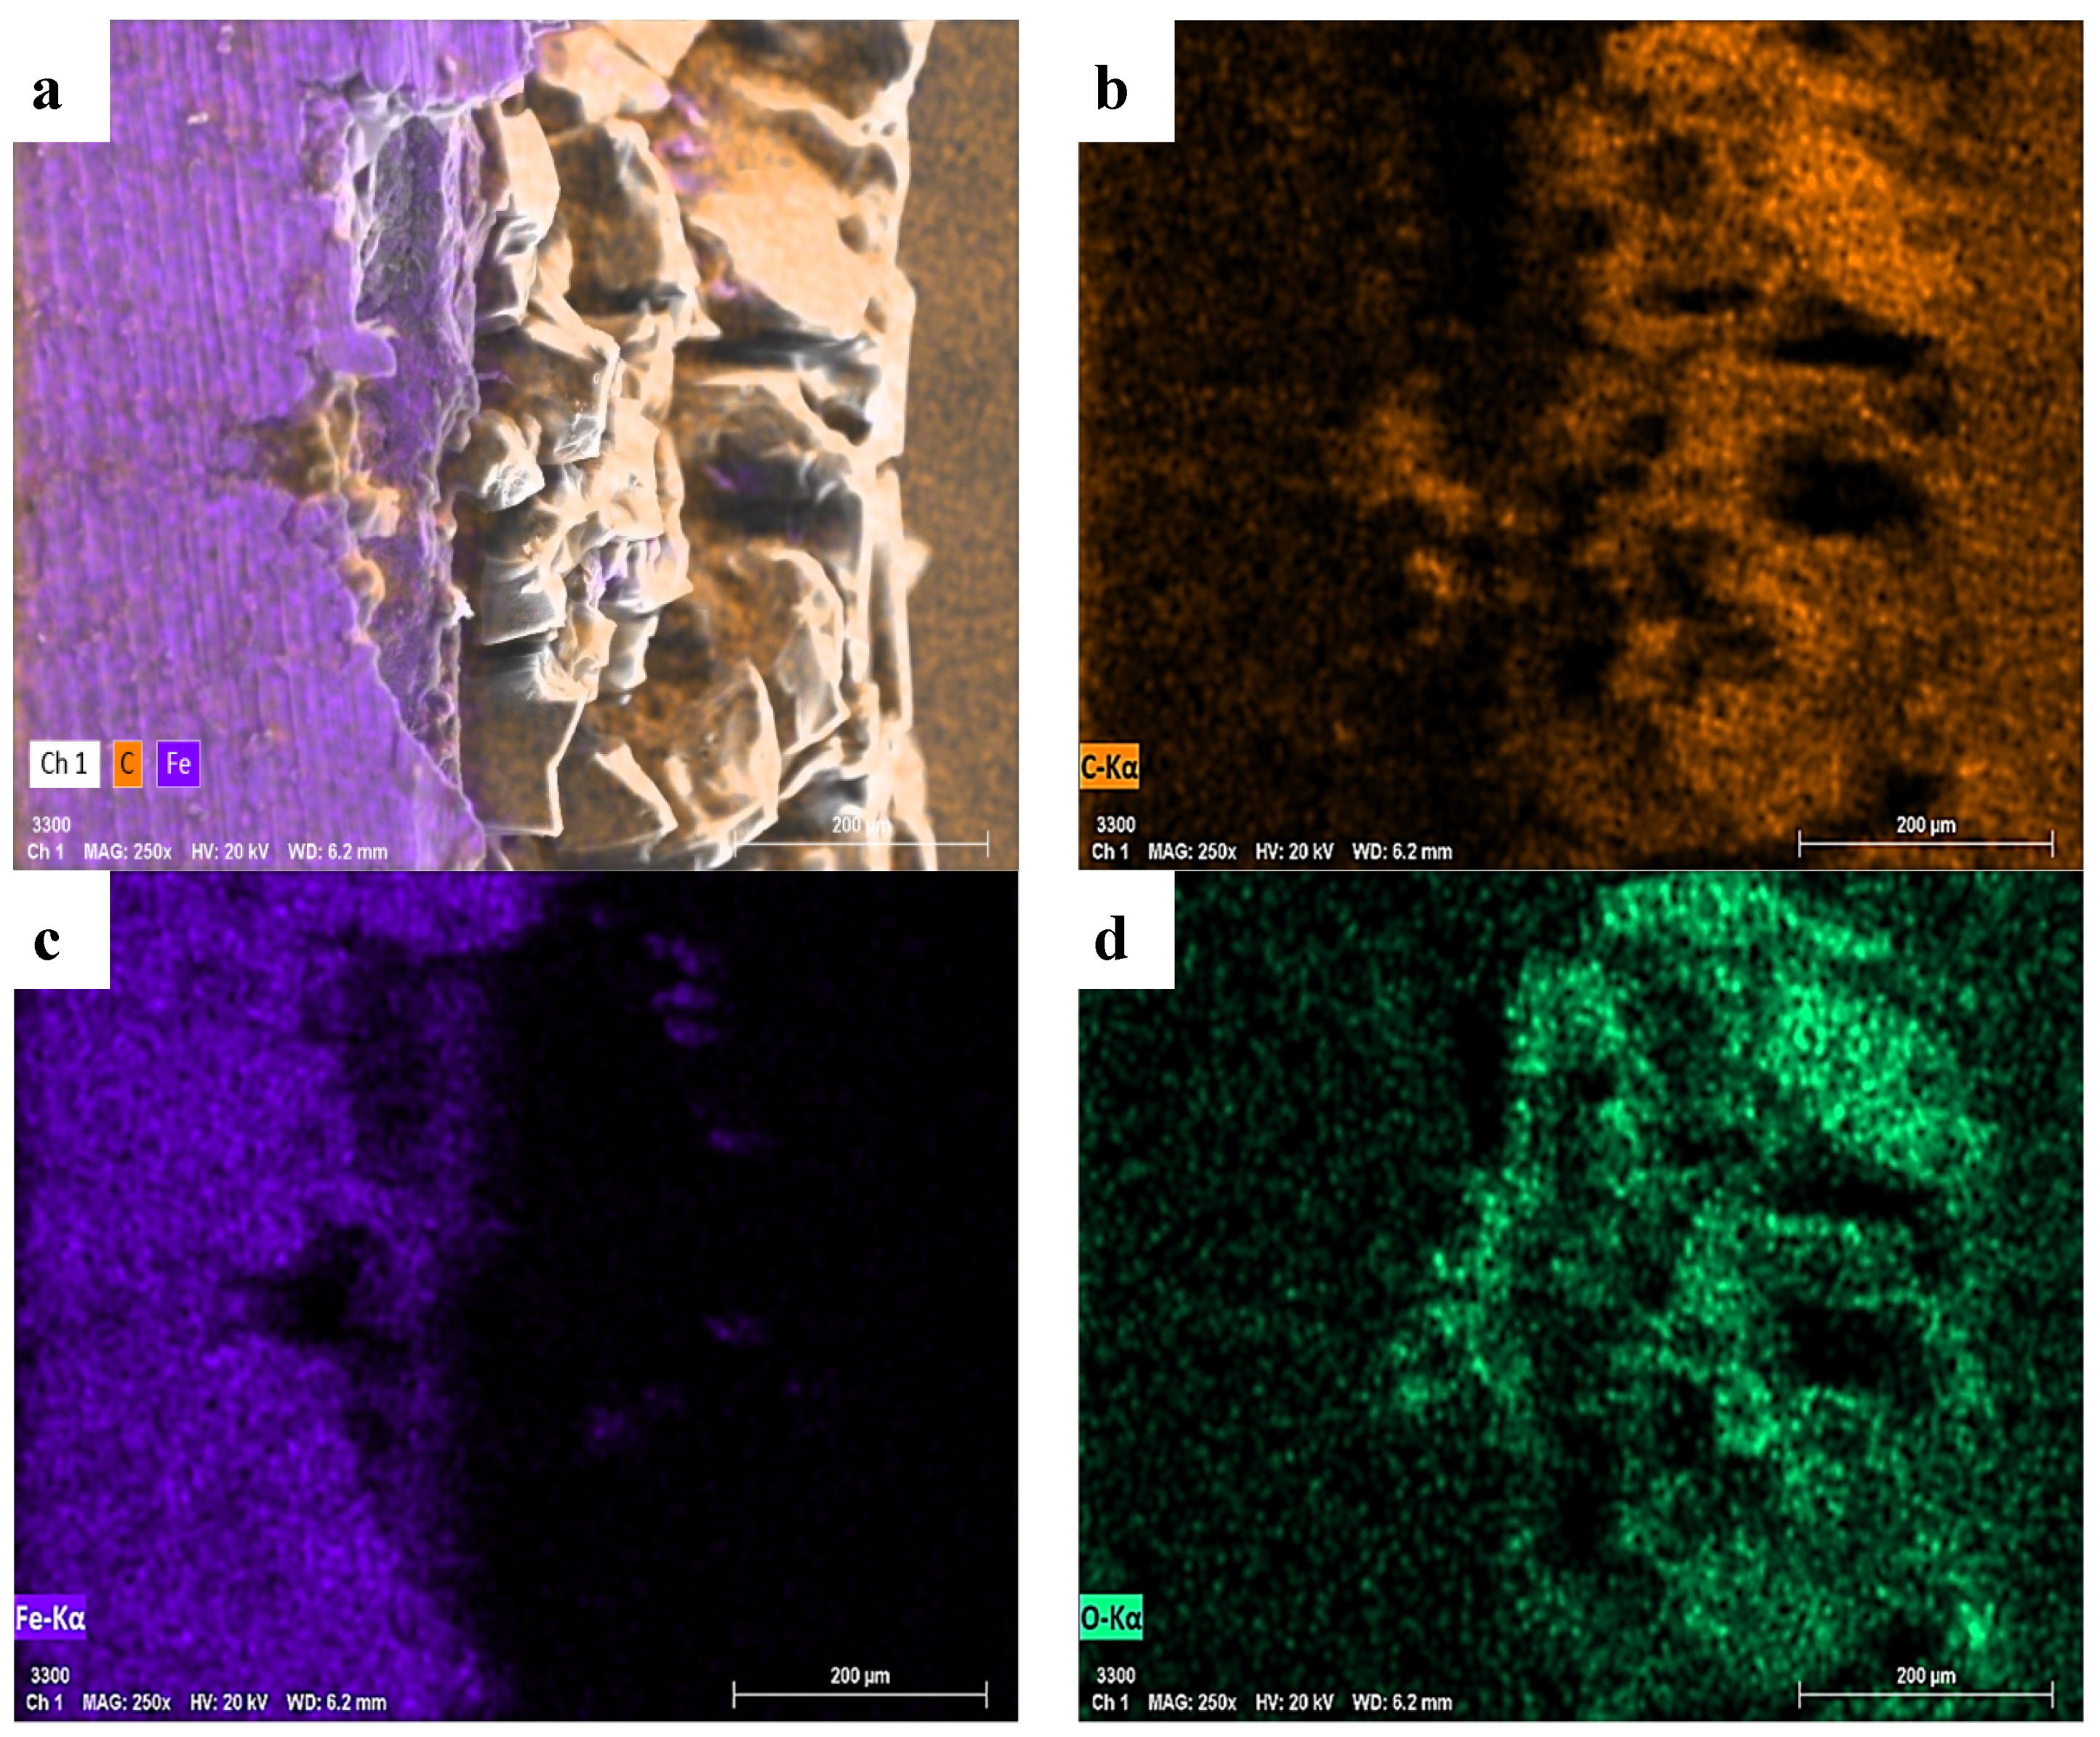
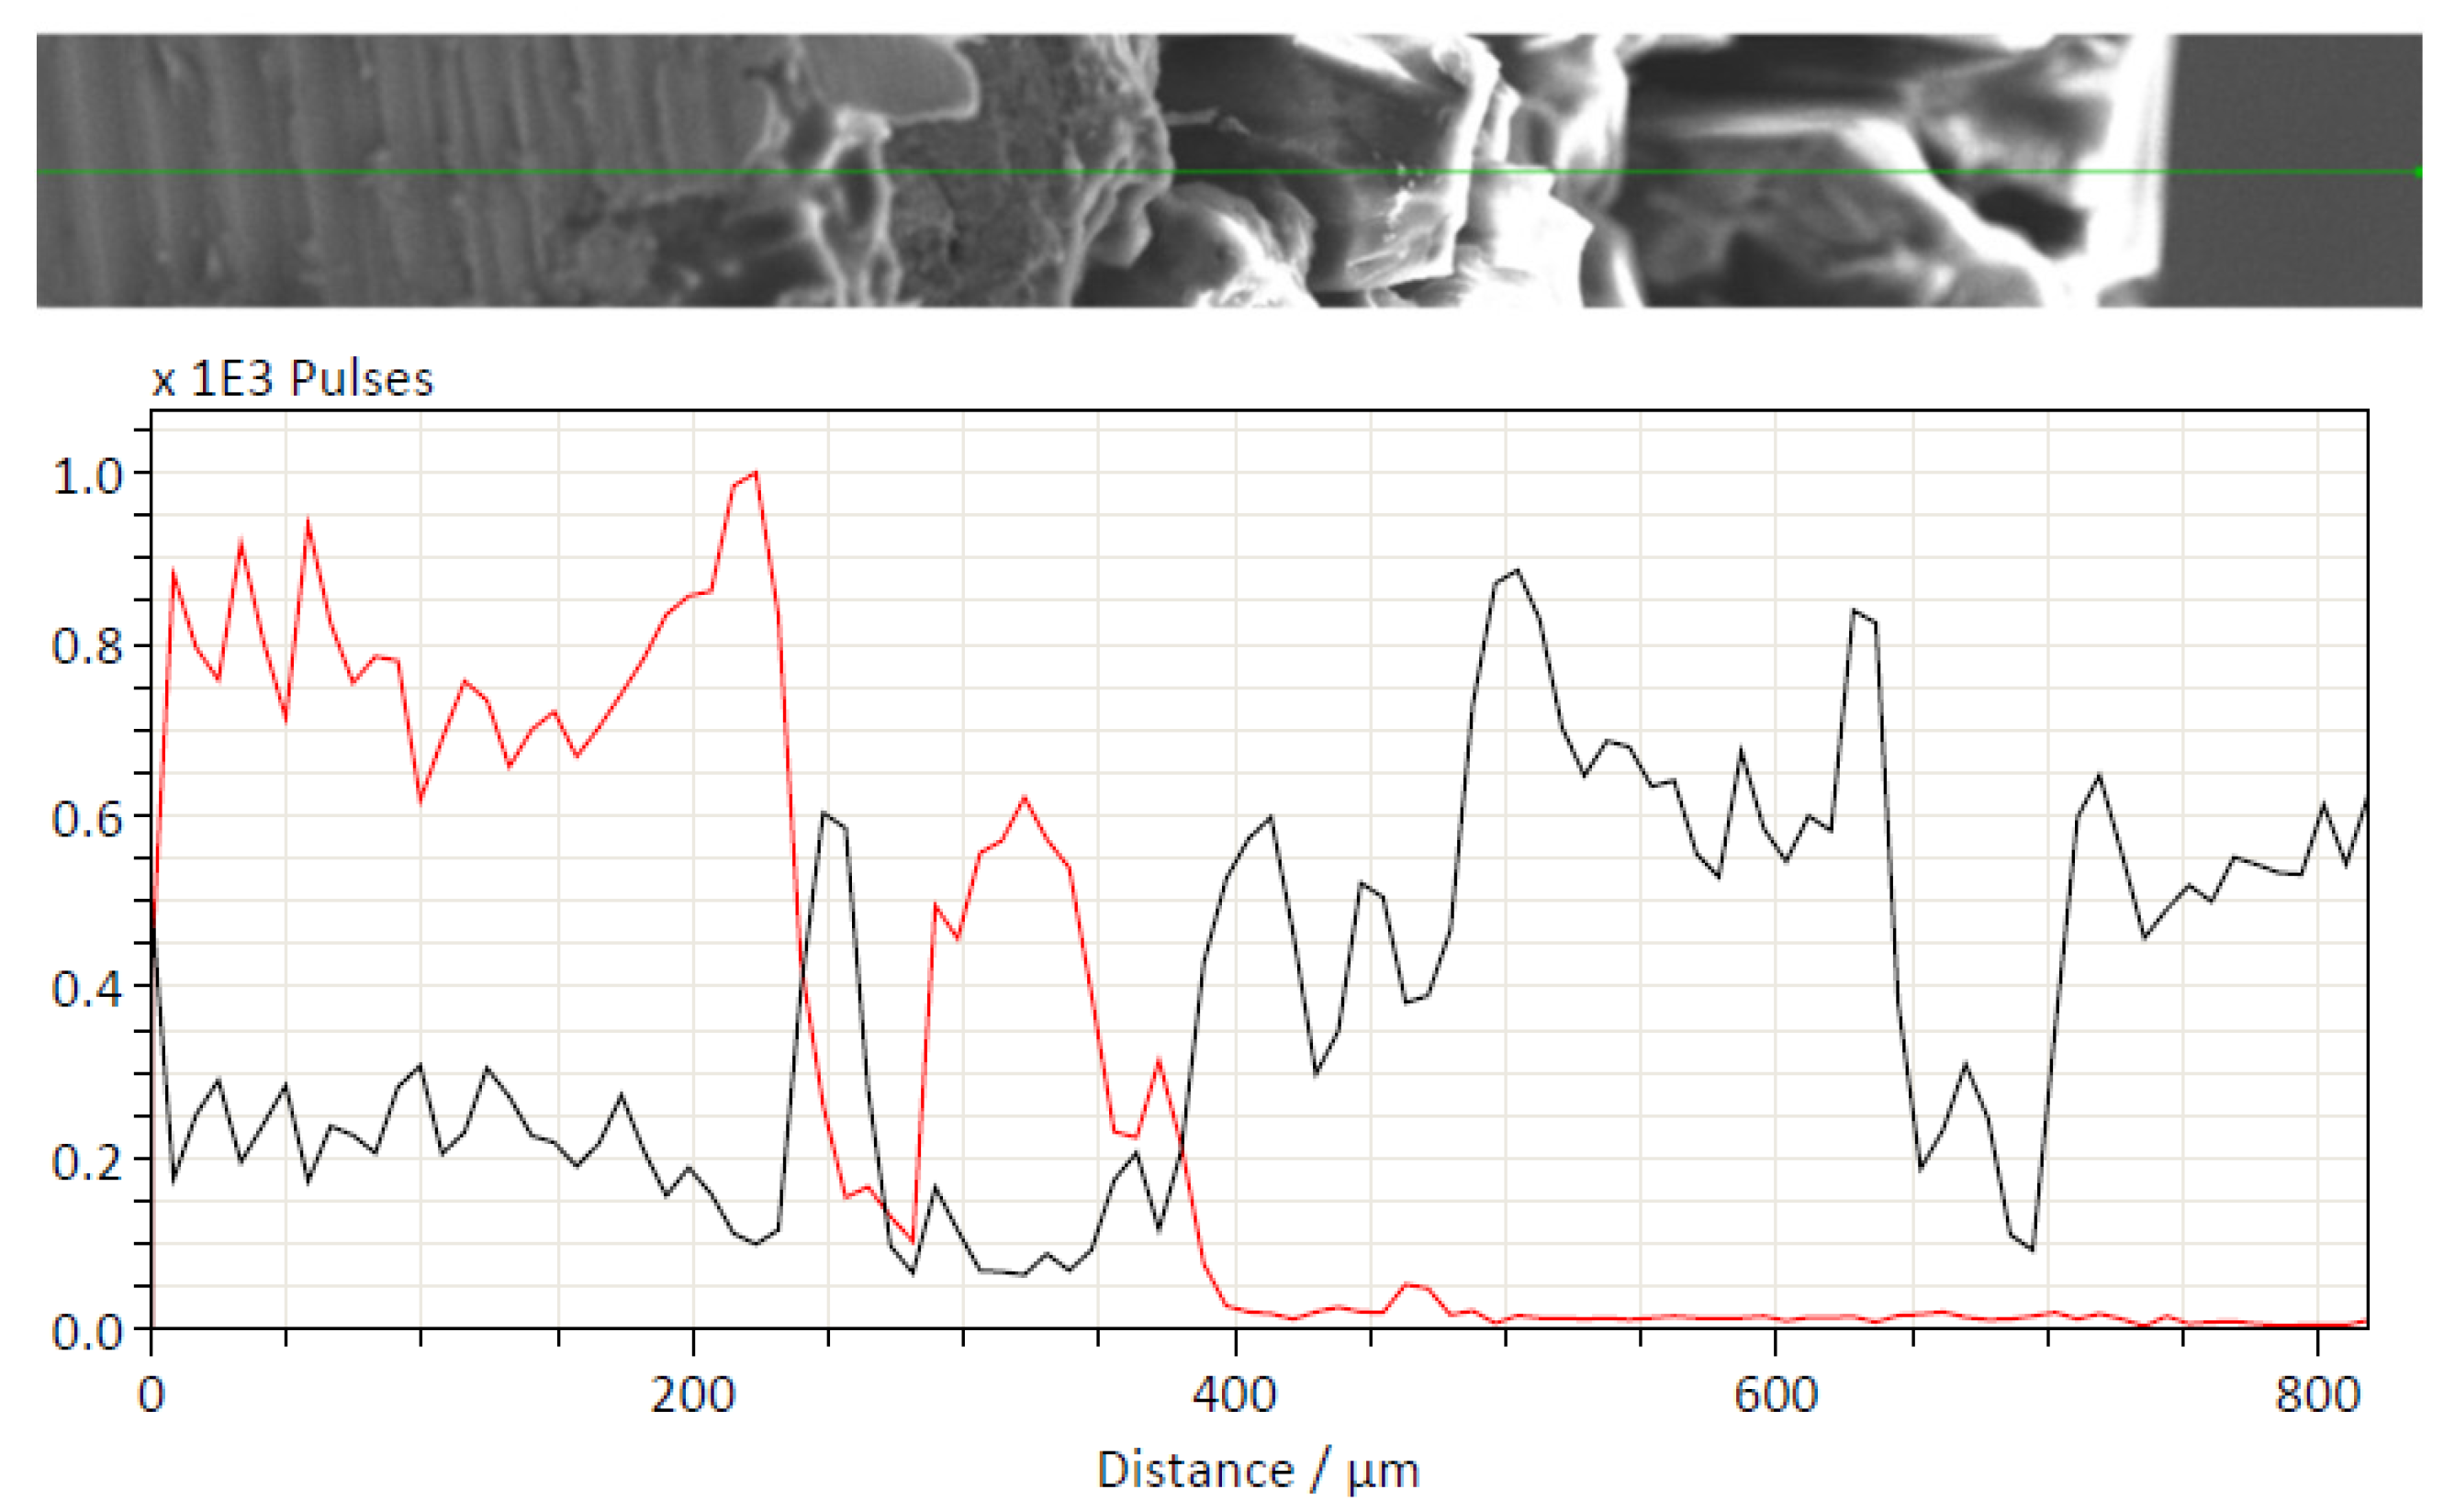
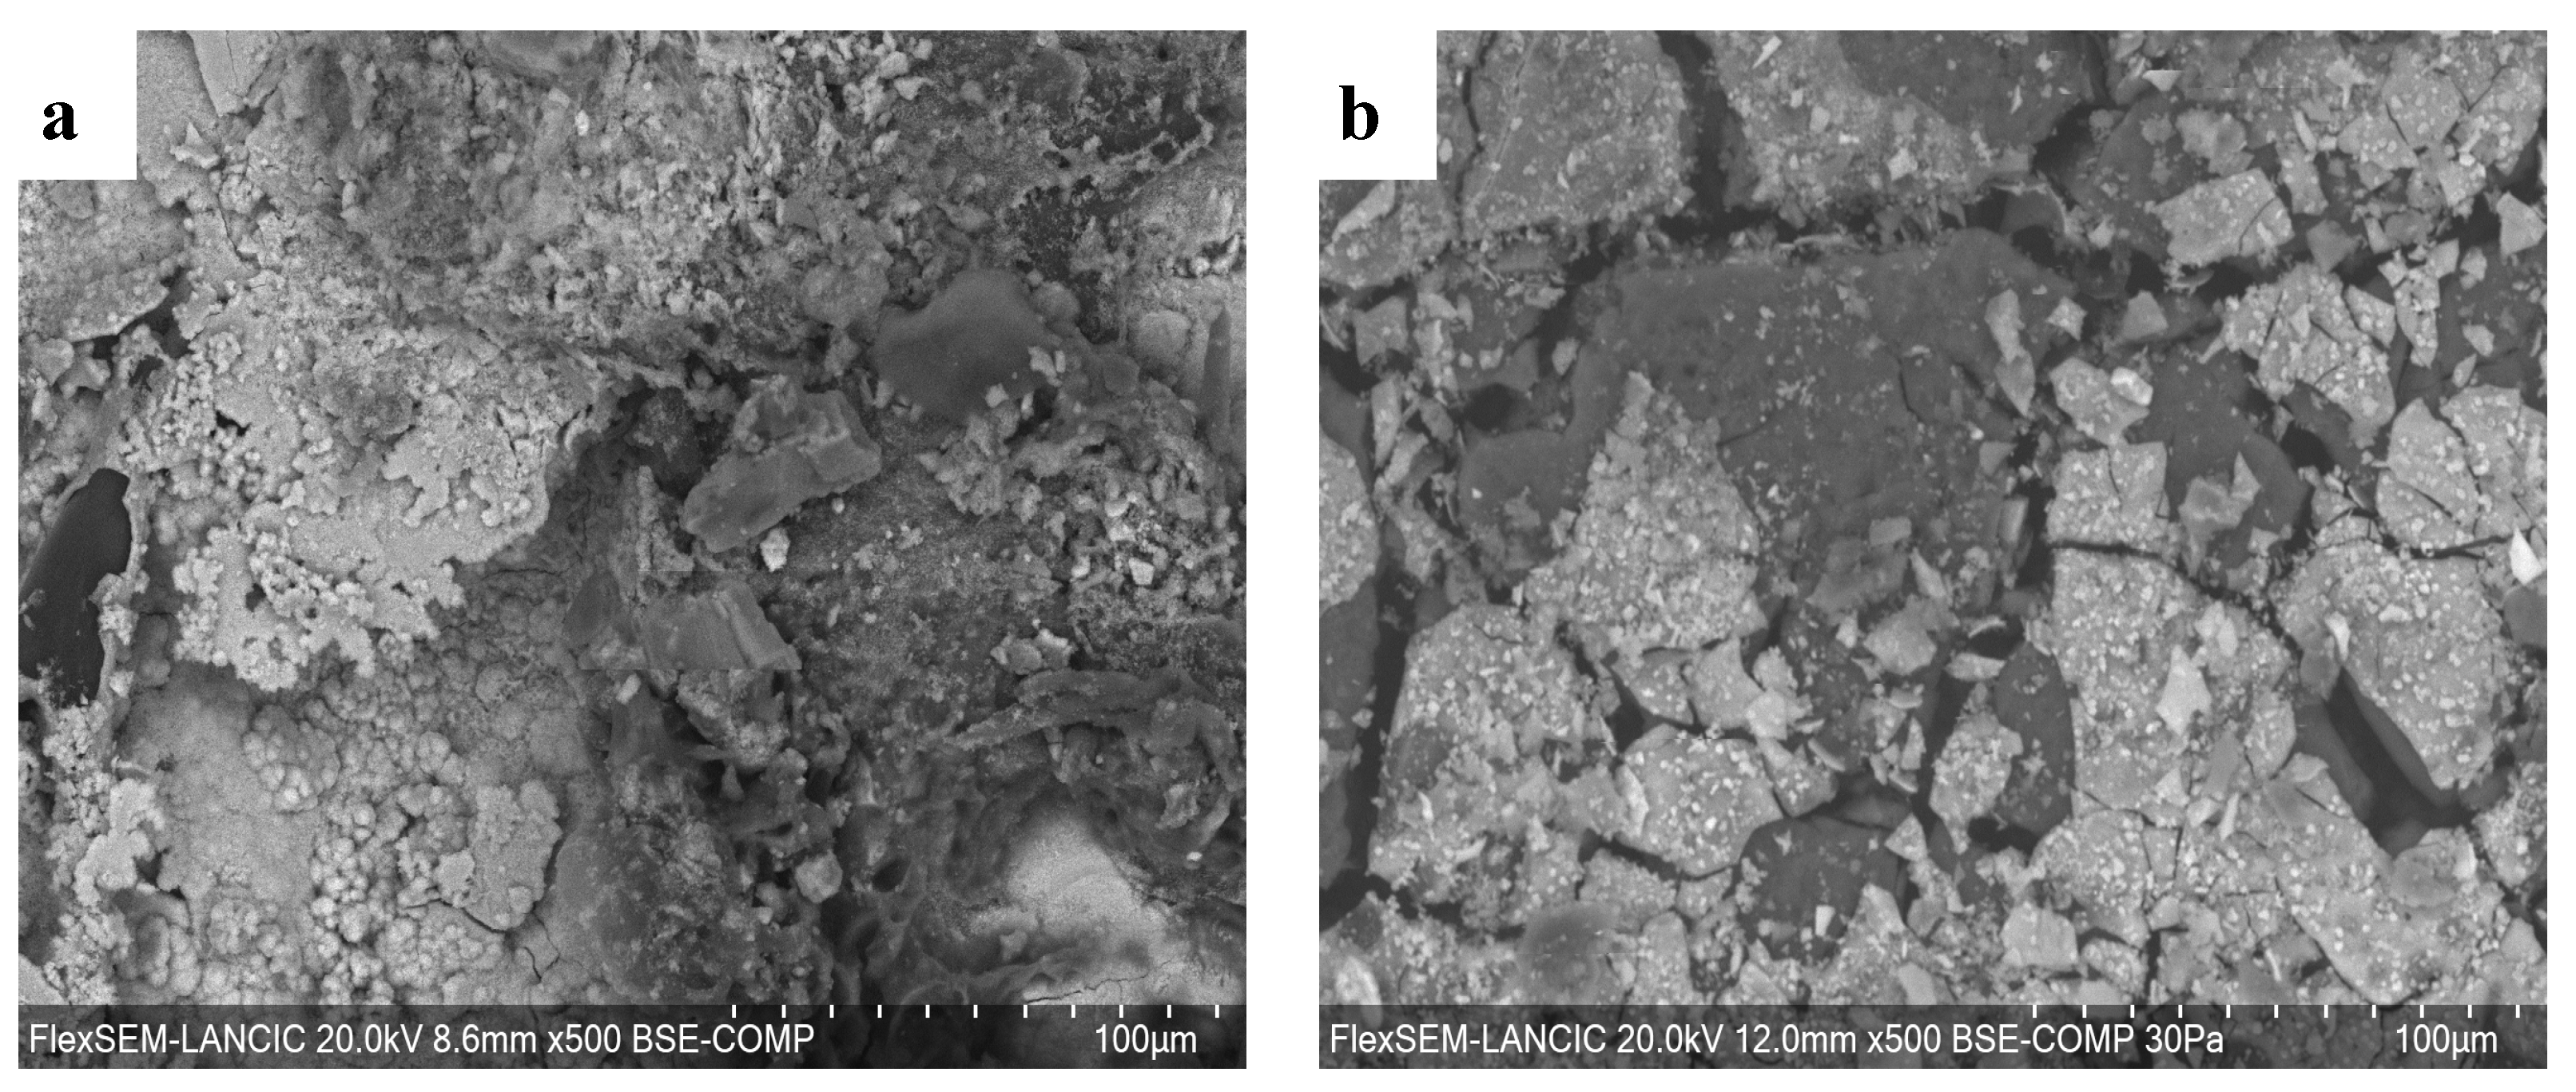
3.3. SEM-EDS of Corrosion Product with/without Rust Converter

In Figure 4a at 100×, the layer of corrosion products formed after 70 days of exposure to the atmosphere is compact in appearance. However, at 1000× (Figure 4b), a porous and cracked structure is observed. At the same magnification in a different area (Figure 4c), needle or whisker morphologies are observed on the periphery of lepidocrocite globules and are on a compact layer [44]. At 3500×, the needle-like morphology is appreciated, and could be attributed to an outer layer of corrosion products.
Iron oxides are shaped like cauliflowers and hexagons. Likewise, the needles grown as small rods, when put together, form balls with the appearance of flower petals [45,46]. Goethite has good continuity and compactness in texture; it is supposed to be a non-reactive phase with important protection due to its ability to effectively prevent the iron matrix attack by environmental factors such as oxygen, moisture, and polluting gases. On the other hand, lepidocrocite has a petal-like structure, being porous and similar in absorbency to a sponge skeleton [47,48].
The application of the tannic acid extract formulation to the cast iron corrosion products formed an amorphous and micro-cracked layer of 26.3–35.2 µm (Figure 5), with the presence of lumps and shiny particles [13,21]. These shiny particles may correspond to either converter residues or corrosion products [13]. The converted layer appears to be thicker, in agreement with the smooth surface observed by SEM [23]. This type of structure indicates that the formulation can chelate with iron ions and has been reported in several investigations [13,21,22,23,24,36].
Crack formation is caused by the removal of rust converter components during drying or excess moisture, which promotes regrowth of the existing rust [49]. It has been shown that in the rust converter, when dried on an inert material, a cross-linked pattern is observed under the microscope. The grains formed when a rust layer of steel reacts with the rust converter are less angular in shape and much more adherent than in rust-free steel [50].
EDS analysis of the corrosion product layer in the absence and presence of the rust converter is summarized in Table 2. The elements Cl and K in the corrosion product layer belong to marine aerosol particles. On the other hand, the S may be due to contamination by sulfur compounds or sulphates, which are part of the seawater composition. Table 2 shows the change that occurs when the formulation is applied to the corrosion product layer, where the C content increases from about 4 wt% to values greater than 60 wt%. Otherwise, the Fe content decreases to values less than 1 wt%. This is best observed in the elemental chemical mapping (Figure 6), where the C and O content is homogeneous throughout the converted surface. Fe is still apparent but in smaller amounts.

Cross-Section of the Converted Layer

Figure 7a shows BSE-SEM images of the cross section of corrosion products with a rust converter. According to the EDS analysis, the thickness of the converted layer is 230–254 µm, and the visible product layer is approximately 28–30 µm thick. With the BSE detector, the system can differentiate by contrast by atomic number; the bright zone is the metallic substrate, the gray zone is the corrosion products, and the dark zone is the converted layer (Figure 7b). In Figure 7c, at 1000×, the interface between the corrosion product layer and the converted layer is observed, even though a few bright particles associated with the cast iron are observed. At higher magnifications, specifically at 3500× (Figure 7d), particles of iron oxides are identified. Finally, amorphous and crystalline structures are also observed on the corrosion product layer, in addition to the existence of adhesion of the rust converter.
Elemental chemical mapping of how the rust converter is deposited on the surface of the corrosion products is shown in detail in Figure 8. The orientation is similar to amorphous blocks of high-molecular-weight organic structures that settle during spraying and drying. Voids or cavities are also observed, as shown in Figure 4. EDS elemental chemical mapping shows that Fe is still present in the converted layer. The oxygen (O) is present in the layer of corrosion products and the rust converter. Finally, C enters the corrosion product layer, converting them into more stable rust.
In relation to the previous idea, the linear scan by EDS (Figure 9) shows an interaction between the corrosion products and the converter film that covers approximately 40 µm. With this analysis, the thickness of the converted film and corrosion products is estimated to be approximately 260 µm and 80 µm, respectively.

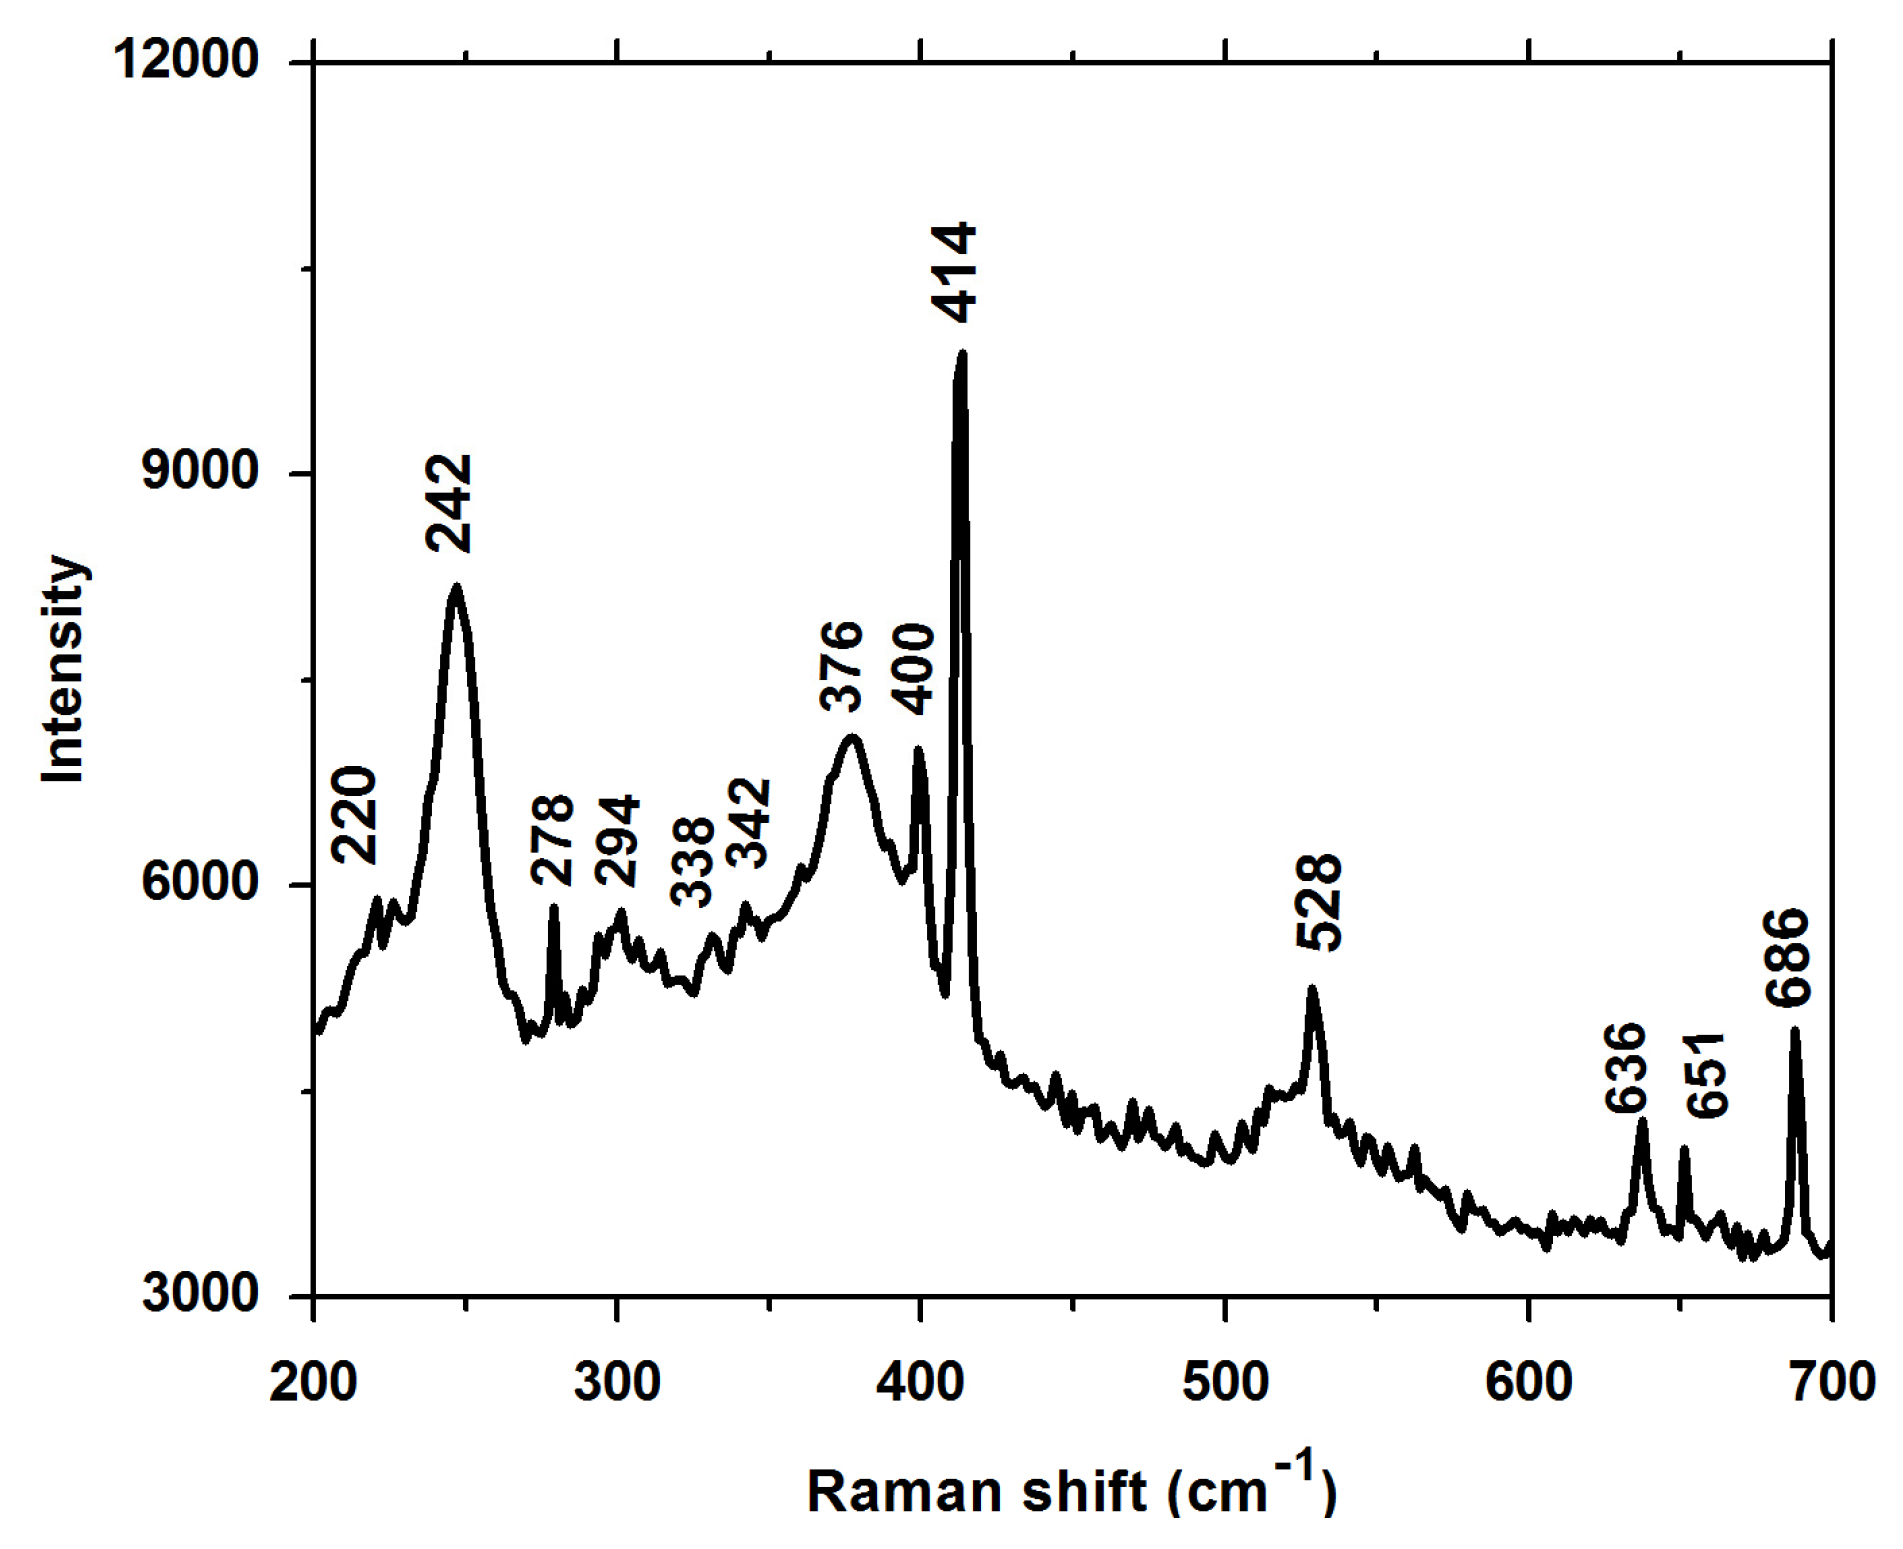
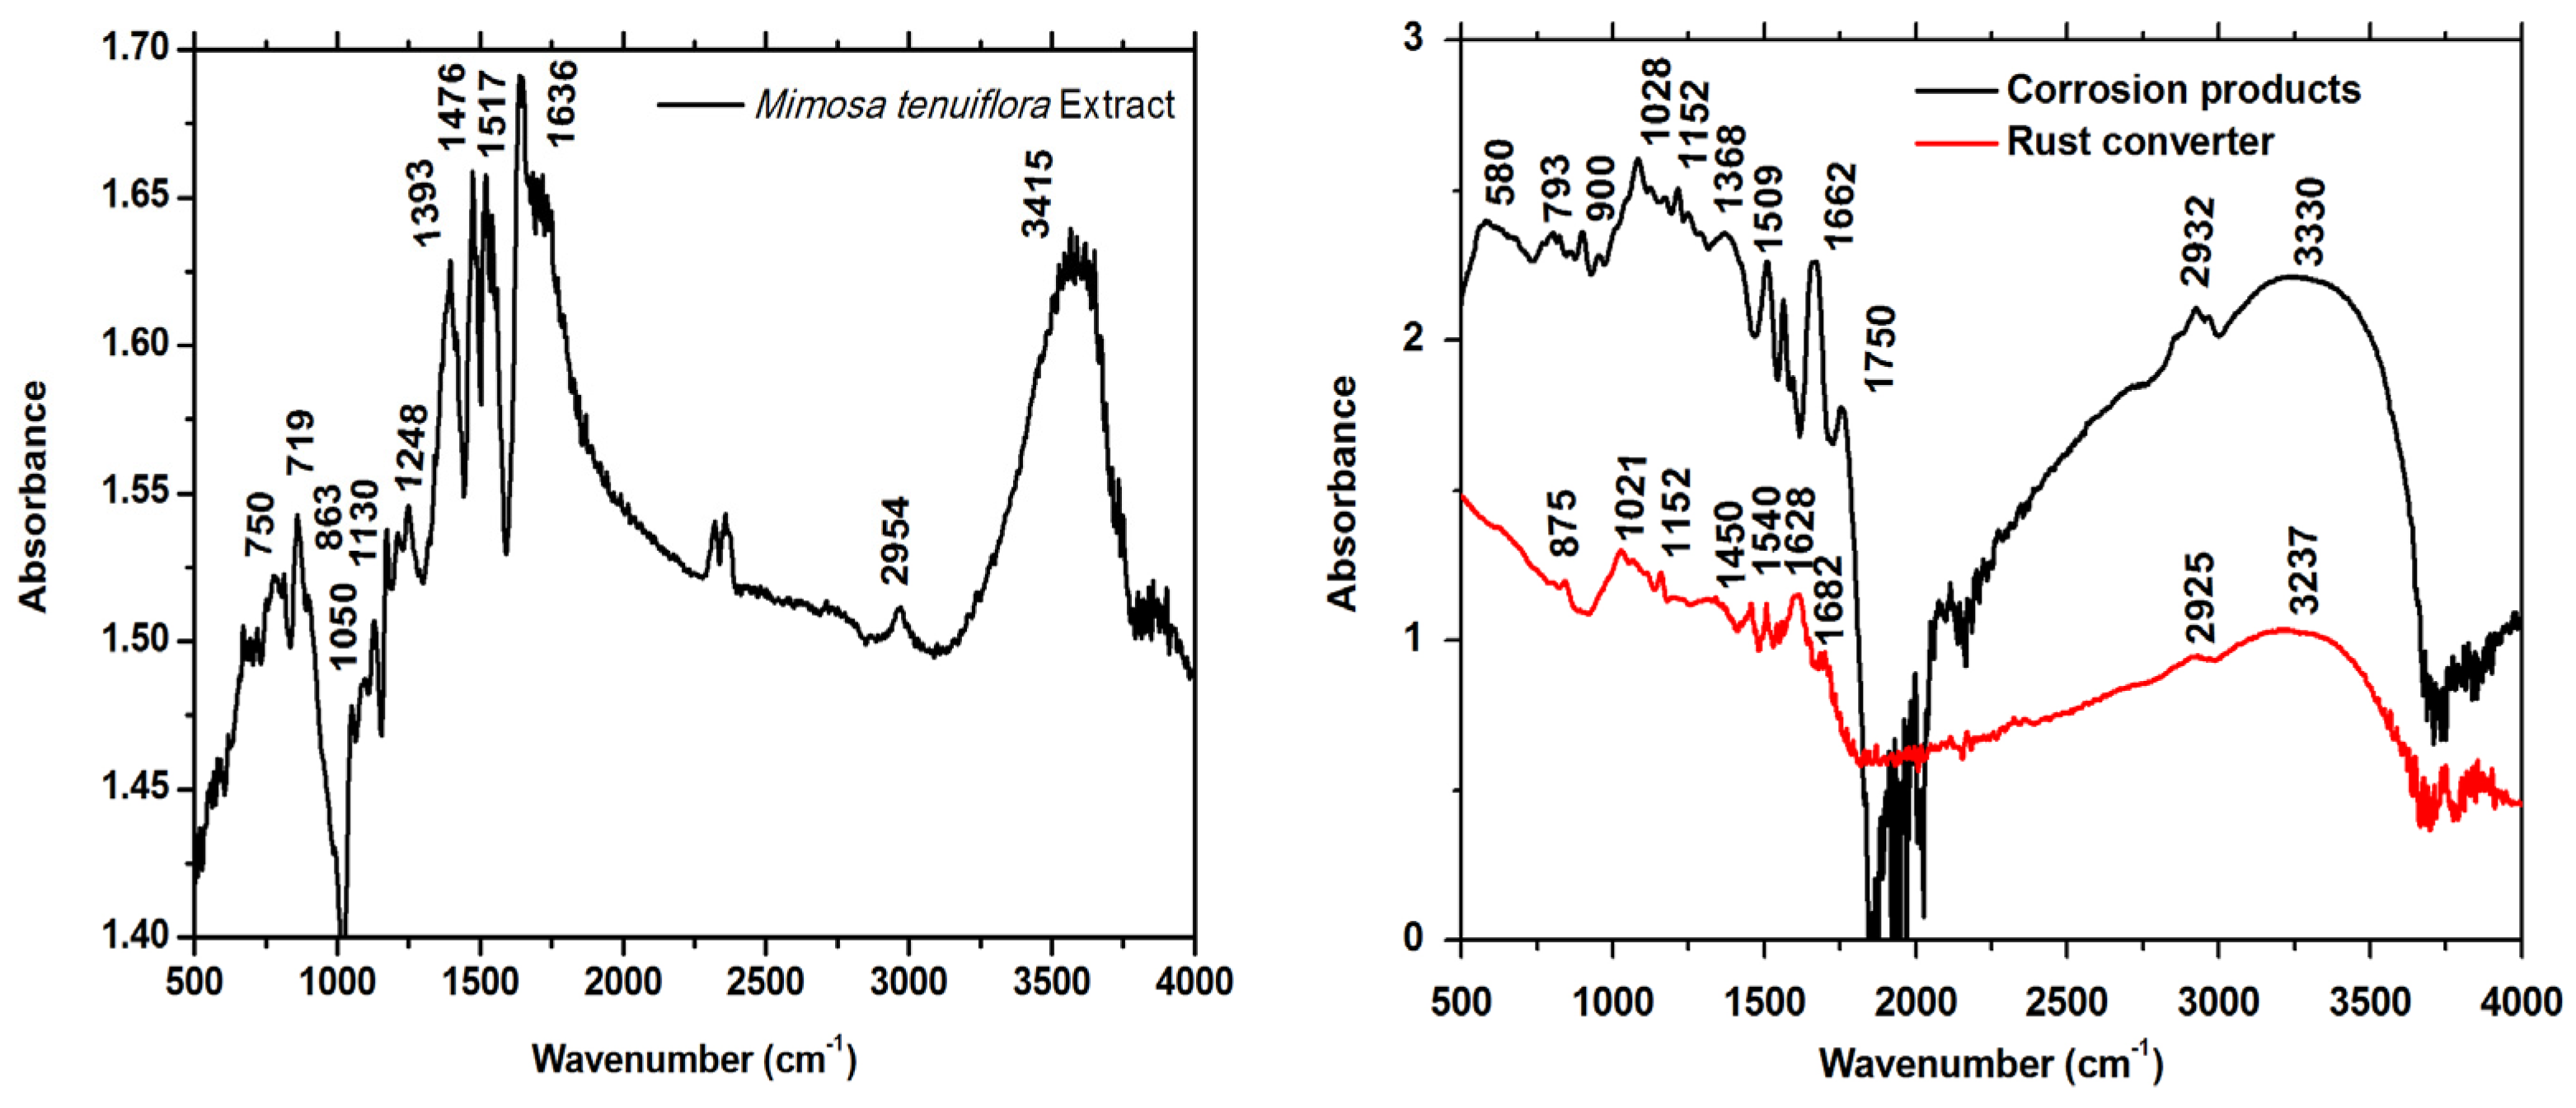
3.4. Spectroscopic Analysis

Raman spectroscopy results are presented in Figure 10. This spectrum corresponds to a mixture of lepidocrocite (220, 242, 376, and a broad band around 528 cm−1) and goethite (294, 400, 414, 376, and 686 cm−1) with sharp peaks (278, 636, and 651 cm−1), which may not correspond to corrosion products and may be associated with atmospheric particles (phosphates, sulphates, or silicates) deposited on the rust layer [44,51]. Lepidocrocite has a peak of higher intensity at 242 cm−1. Other characteristic peaks of this phase were found at 376, 528, and 650 cm−1 [51]. Goethite has a symmetrical bending band at 388 cm−1 attributed to Fe-OH bonds. The peaks at 299 and 686 cm−1 belong to goethite [44,46,51,52,53,54].
The extract of Mimosa tenuiflora (Figure 11 left) demonstrated adsorption bands at 750, 863, 1050, 1130, 1169, 1476, 1517, 1636, and 3415 cm−1; these values are in agreement with those previously reported [55]. Of the tannin components, gallic acid was identified in absorption bands at 750, 899, 1050, 1248, 1540, 1633, and 1683 cm−1, while catechin bands were observed at 719, 750, 812, 863, 1050, 1169, 1476, 1541, and 1648 cm−1. The absorption bands at 719, 750, 812, and 1732 cm−1 are due to aromatic substitutions. However, the bands at 719 and 750 cm−1 are attributed to -CH2- (rocking) bonds. At 1560 cm−1, it is possibly due to the benzene nucleus conjugated to dienes. The peaks at 1050, 1093, and 1130 cm−1 are characteristic of OH groups. Phenols were found in adsorption bands at 1169, 1212, and 1248 cm−1. At 1393 and 1476 cm−1, they are characteristic of CH3 and CH2 bonds. The extract contains aromatic substitutions in its structure and two peaks are found at 1541 and 1557 cm−1. Other functional groups identified were carboxylic acids at 1700 and 1716 cm−1; polyenes at 1636, 1648, and 1683 cm−1; C=CH2 bonds at 1770 and 1869 cm−1; and CH3 (vas) bonds at 2963 cm−1. Finally, the absorption band at 2361 cm−1 belongs to atmospheric CO2.
In the corrosion product layer (Figure 11 right-black line), characteristic lepidocrocite bands were found at 580 and 740 cm−1, attributed to Fe-O bonds. Two other bands at 1028 and 1152 cm−1 are associated with δOH (Fe-OH) bending vibrations. The absorption bands of goethite were found at 793, 900, and 1368 cm−1. The band at 3330 cm−1 is associated with the OH group of the Fe-OH bond. The bands at 1509, 1600, 1750, and 2932 cm−1 are associated with conjugated C=C bonds, C=O carboxylic acid, and CH3 asymmetric vibration, respectively. At 1520 cm−1, it is a characteristic signal of a carbonyl group (C=O) [56,57,58,59,60,61,62,63].
The converted film using Mimosa tenuiflora extract is presented in Figure 11 (right-red line), in which there is a decrease in the band at 820 cm−1 of goethite. Another band of goethite remained intact at 875 cm−1; this was expected, since the converter reacts very little with this iron oxyhydroxide. The lepidocrocite bands still appear at 1021 and 1152 cm−1 but with lower intensity. The presence of absorption bands at 1540 and 1567 cm−1 is due to a new formation of O-Fe-O and C-O-Fe bonds in the Fe2+/Fe3+ chelate between the reaction of corrosion products and the rust converter. Possibly, in these bonds, there is an aromatic substitution. At 1628, 1642, and 1682 cm−1 are characteristic polyenes found in structures such as catechin, gallic acid, and tannic acid. Other bands characteristic of ferric tannate were found at 1450, 1657, 1682, and 1712 cm−1. Small peaks at 1338 and 1703 cm−1 can be attributed to gallic acid monohydrate [11,13,15,17,64].

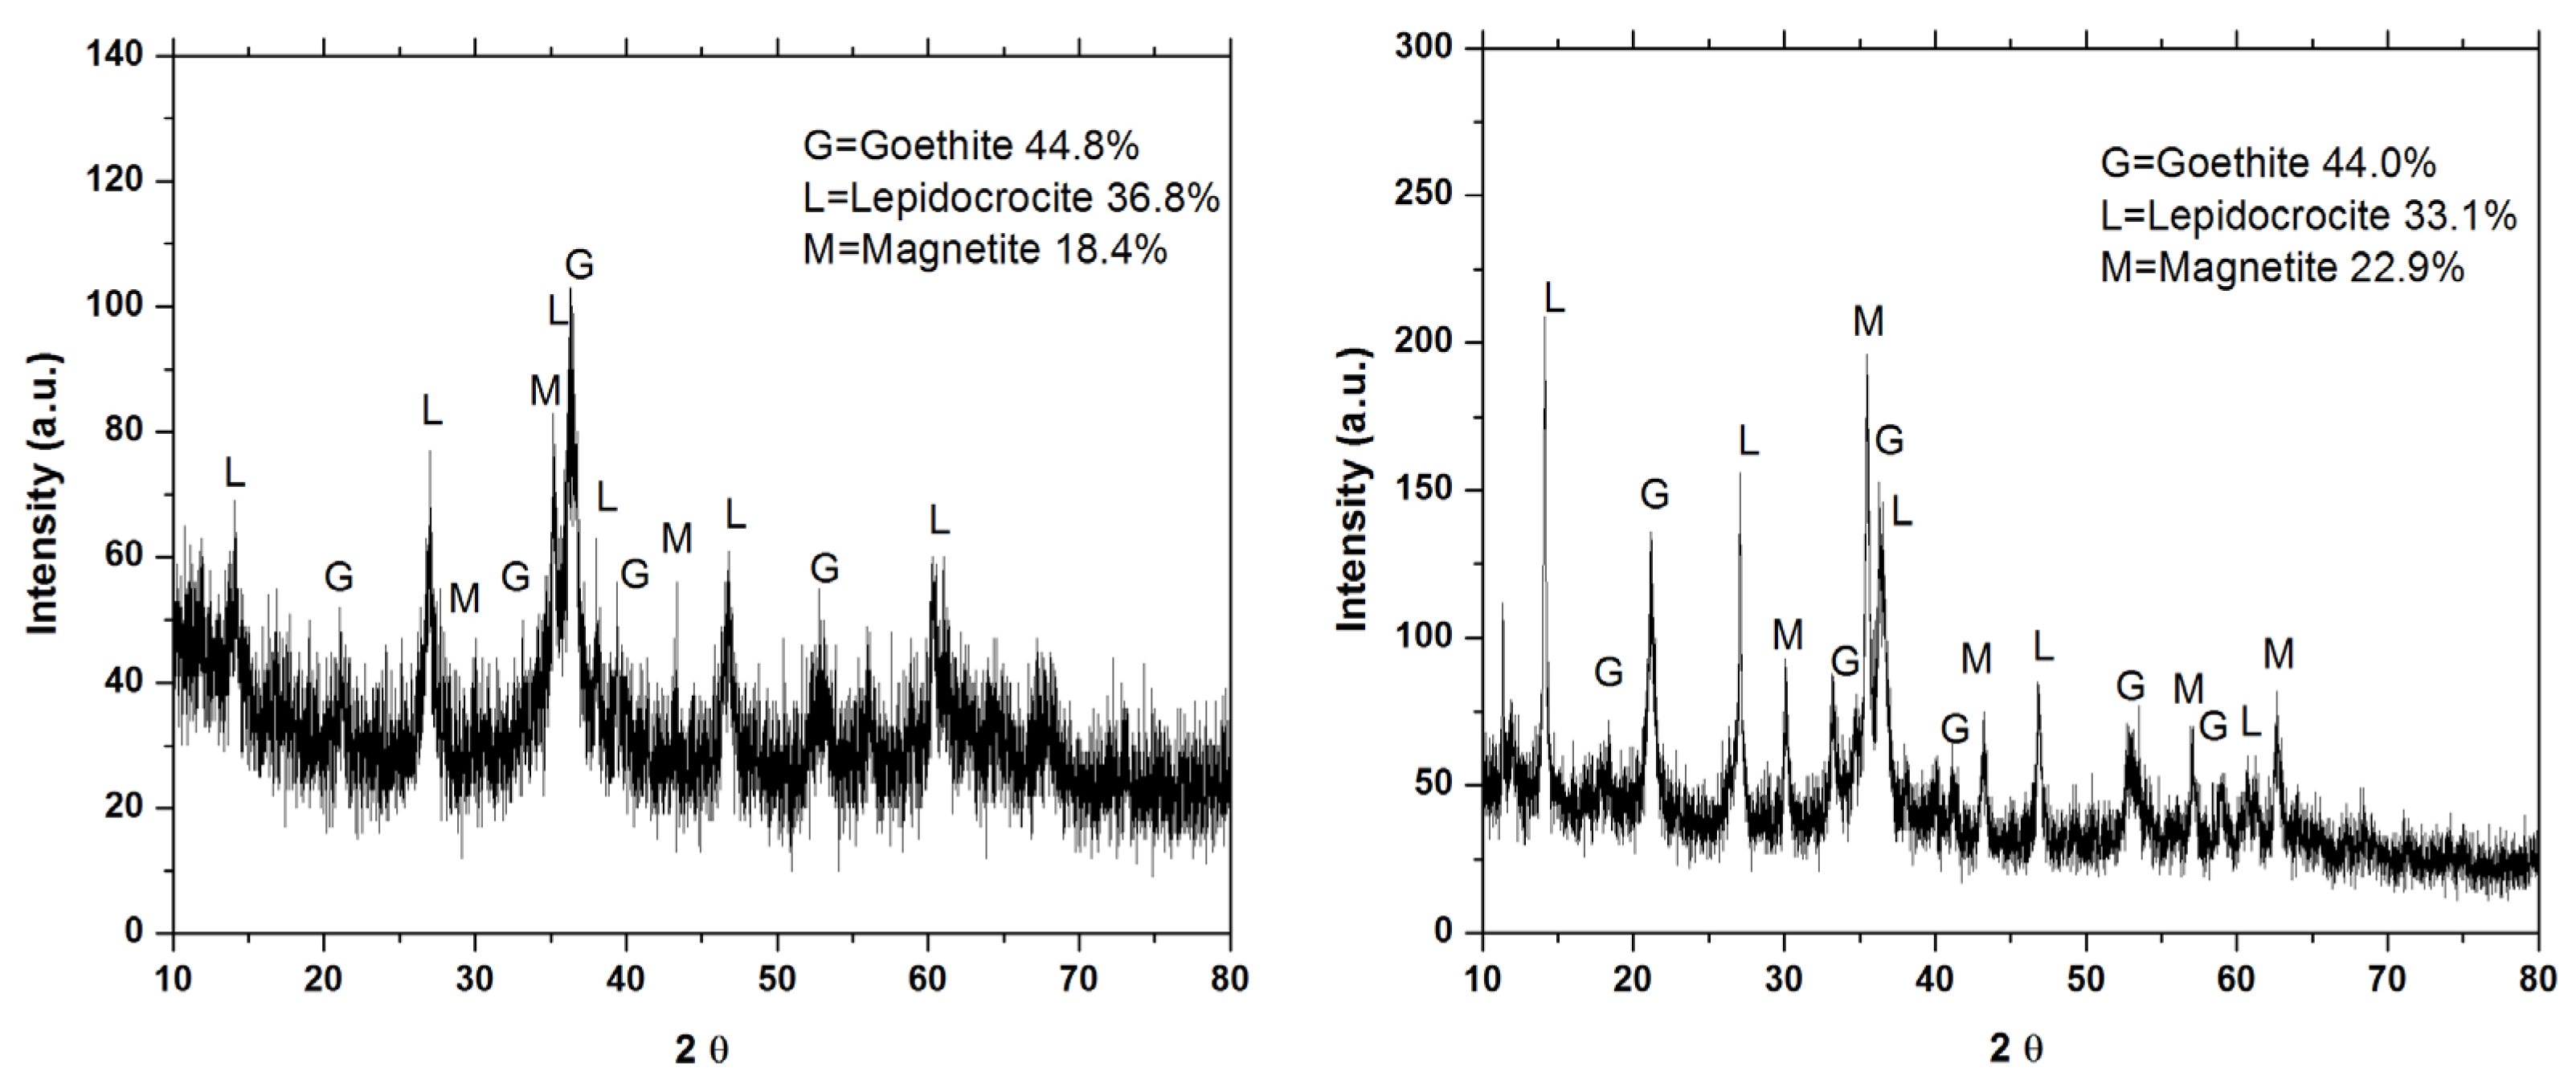
3.5. X-ray Diffraction
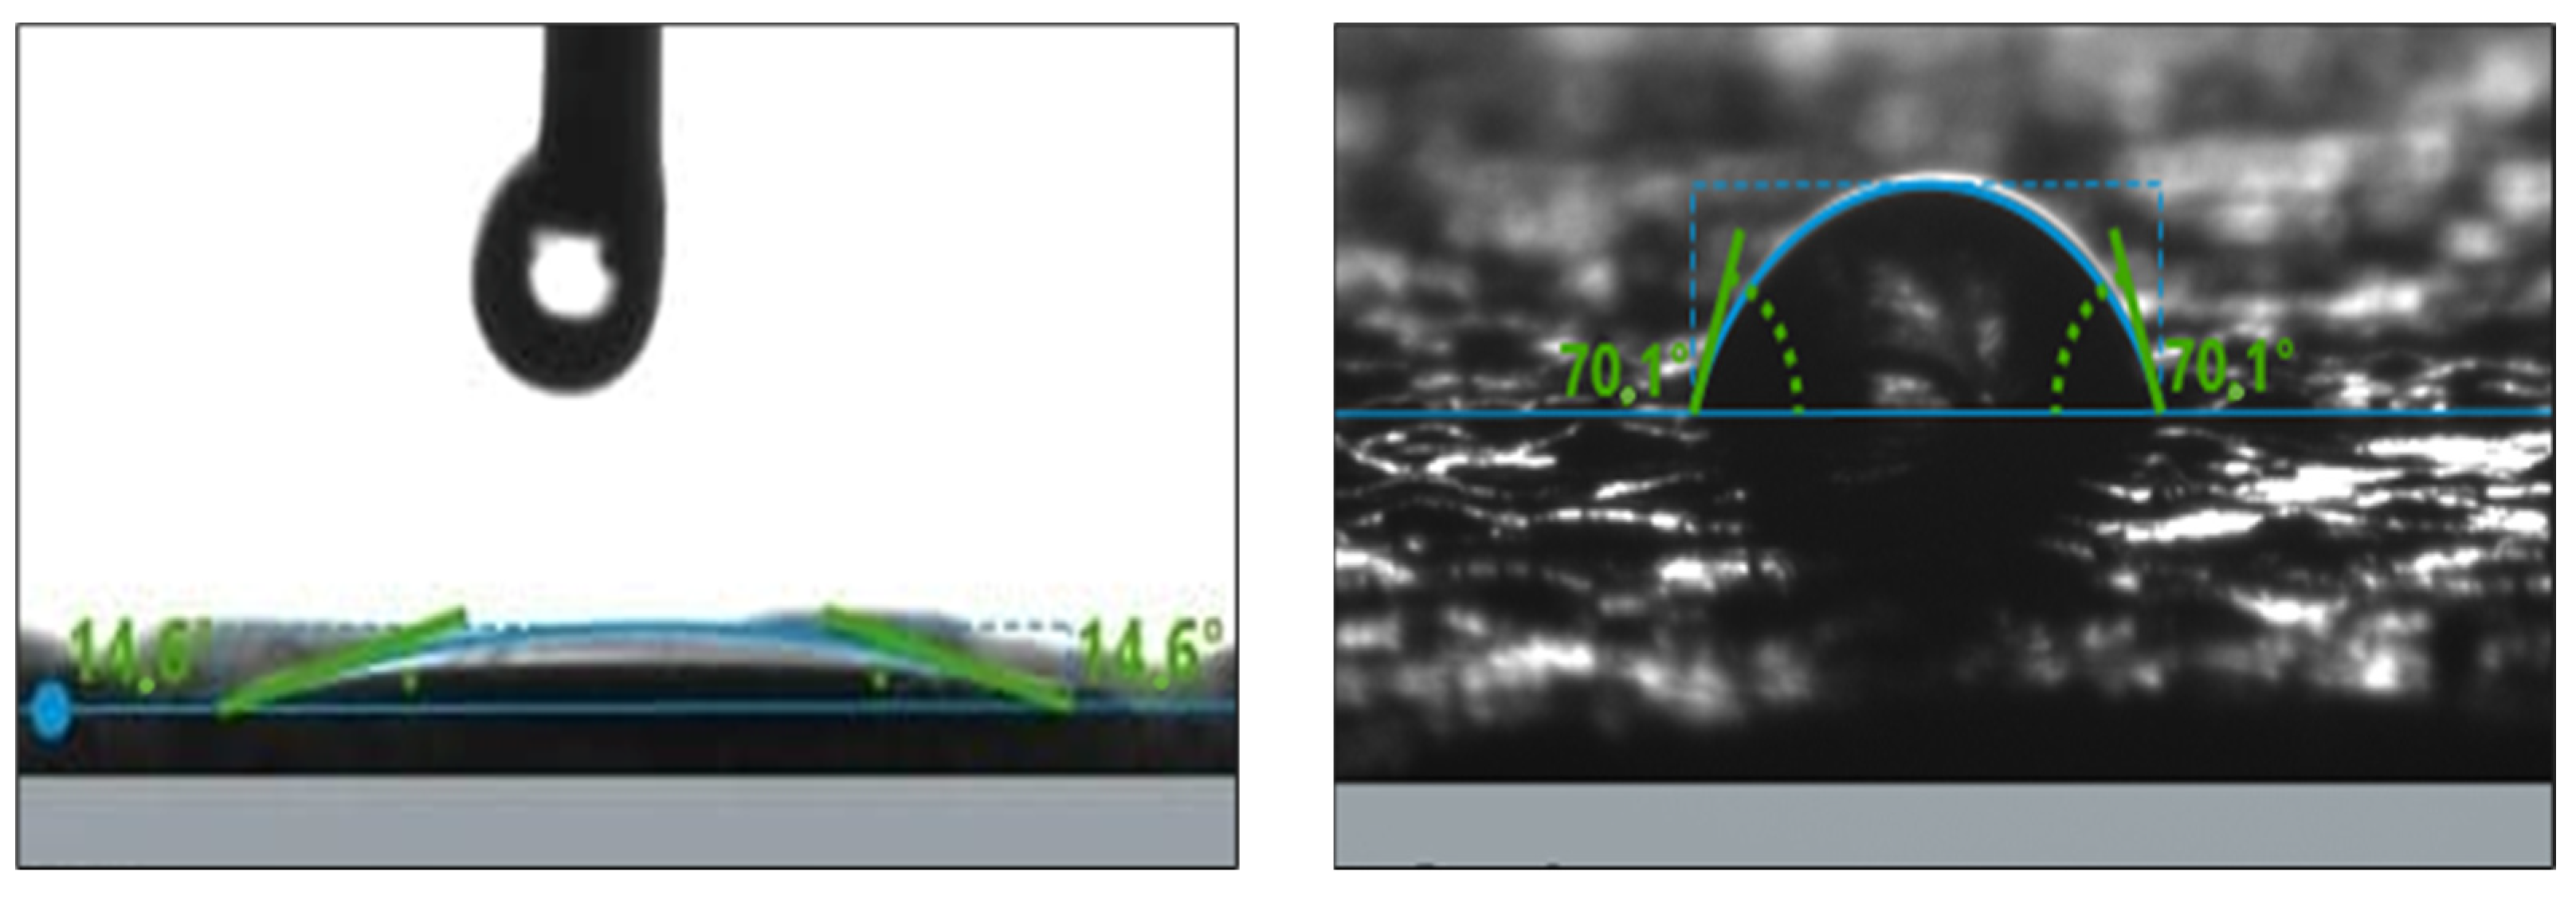
The type of ferrous material does not affect the composition of corrosion products. The common corrosion products in modern and old iron alloys are mixtures of oxyhydroxides (lepidocrocite and goethite) and oxides (magnetite, maghemite, and hematite) [65,66].
Figure 12 left presents the X-ray Diffraction pattern of the corrosion products identified after 90 days of weathering. The corrosion product layer is composed of goethite (orthorhombic), lepidocrocite (orthorhombic), and magnetite (cubic). The diffraction peaks with the highest intensity and where the preferential growth orientation is present in the corrosion products were found at (111), (201), and (311) for goethite, lepidocrocite, and magnetite, respectively. However, the standard of goethite peaks with higher intensity is located at (101).
Scherrer’s Equation (1) was used to calculate the crystallite size:
β = ( k ) ( λ ) ( FWHM ) ( Cos θ )
where β is the crystallite size; k is the crystal factor, whose value can be between 0.9 and 1; λ is the wavelength of the radiation used; FWHM is the width at the average height of the diffraction peak of the sample; and θ is the angle of the diffraction peak [67].
The crystallite sizes for each corrosion product were 13.08 nm (goethite), 28.22 nm (lepidocrocite), and 31.63 nm (magnetite). According to Scherrer’s Equation, it is possible to infer that the relationship between FWHM and crystal size is inversely proportional. That is, as the FWHM increases, the crystal size decreases.
The addition of the rust converter (Figure 12 right) did not alter the crystalline phases identified, which are goethite, lepidocrocite, and magnetite. Magnetite and maghemite have similar structures to spinel; it is not easy to differentiate them, at least by XRD analysis. Therefore, the peaks could also be maghemite [47,68].
The diffraction peaks with the highest intensity and where the preferential growth orientation is present in the corrosion products were found at (111), (200), and (311) for goethite, lepidocrocite, and magnetite, respectively.
The crystallite sizes for each corrosion product with the rust converter are 11.08 nm (goethite), 2.27 nm (lepidocrocite), and 1.31 nm (magnetite). Applying the rust converter of Mimosa tenuiflora extract produces a reduction in the intensity of the magnetite peaks. The decrease in crystallite size, in addition to the broadening of the peaks, also causes a certain decrease in the peak size [69]. Therefore, the crystallinity of magnetite is altered in the presence of Mimosa tenuiflora extract.
A decrease in peak intensity can also be observed in lepidocrocite due to iron chelation [70]. This can also lead to an increase in crystallite size in the (301) orientation with a crystallite size of 4.94 nm up to 73.95 nm.

3.6. Contac Angle

Condensed water is one of the main factors in the corrosion process because different contaminants from the atmosphere can be dissolved in the water and accelerate this process. Therefore, it is important to know the contact angle to describe the surface’s washability.
The high porosity and hygroscopicity of the layer of corrosion products (Figure 13 left) results in a static contact angle of 14.6°; however, when the rust converter is present, this value increases to 70.1° (Figure 13 right). Despite this modification of the surface by the molecules contained in the Mimosa tenuiflora extract, a hydrophobic film is not obtained.

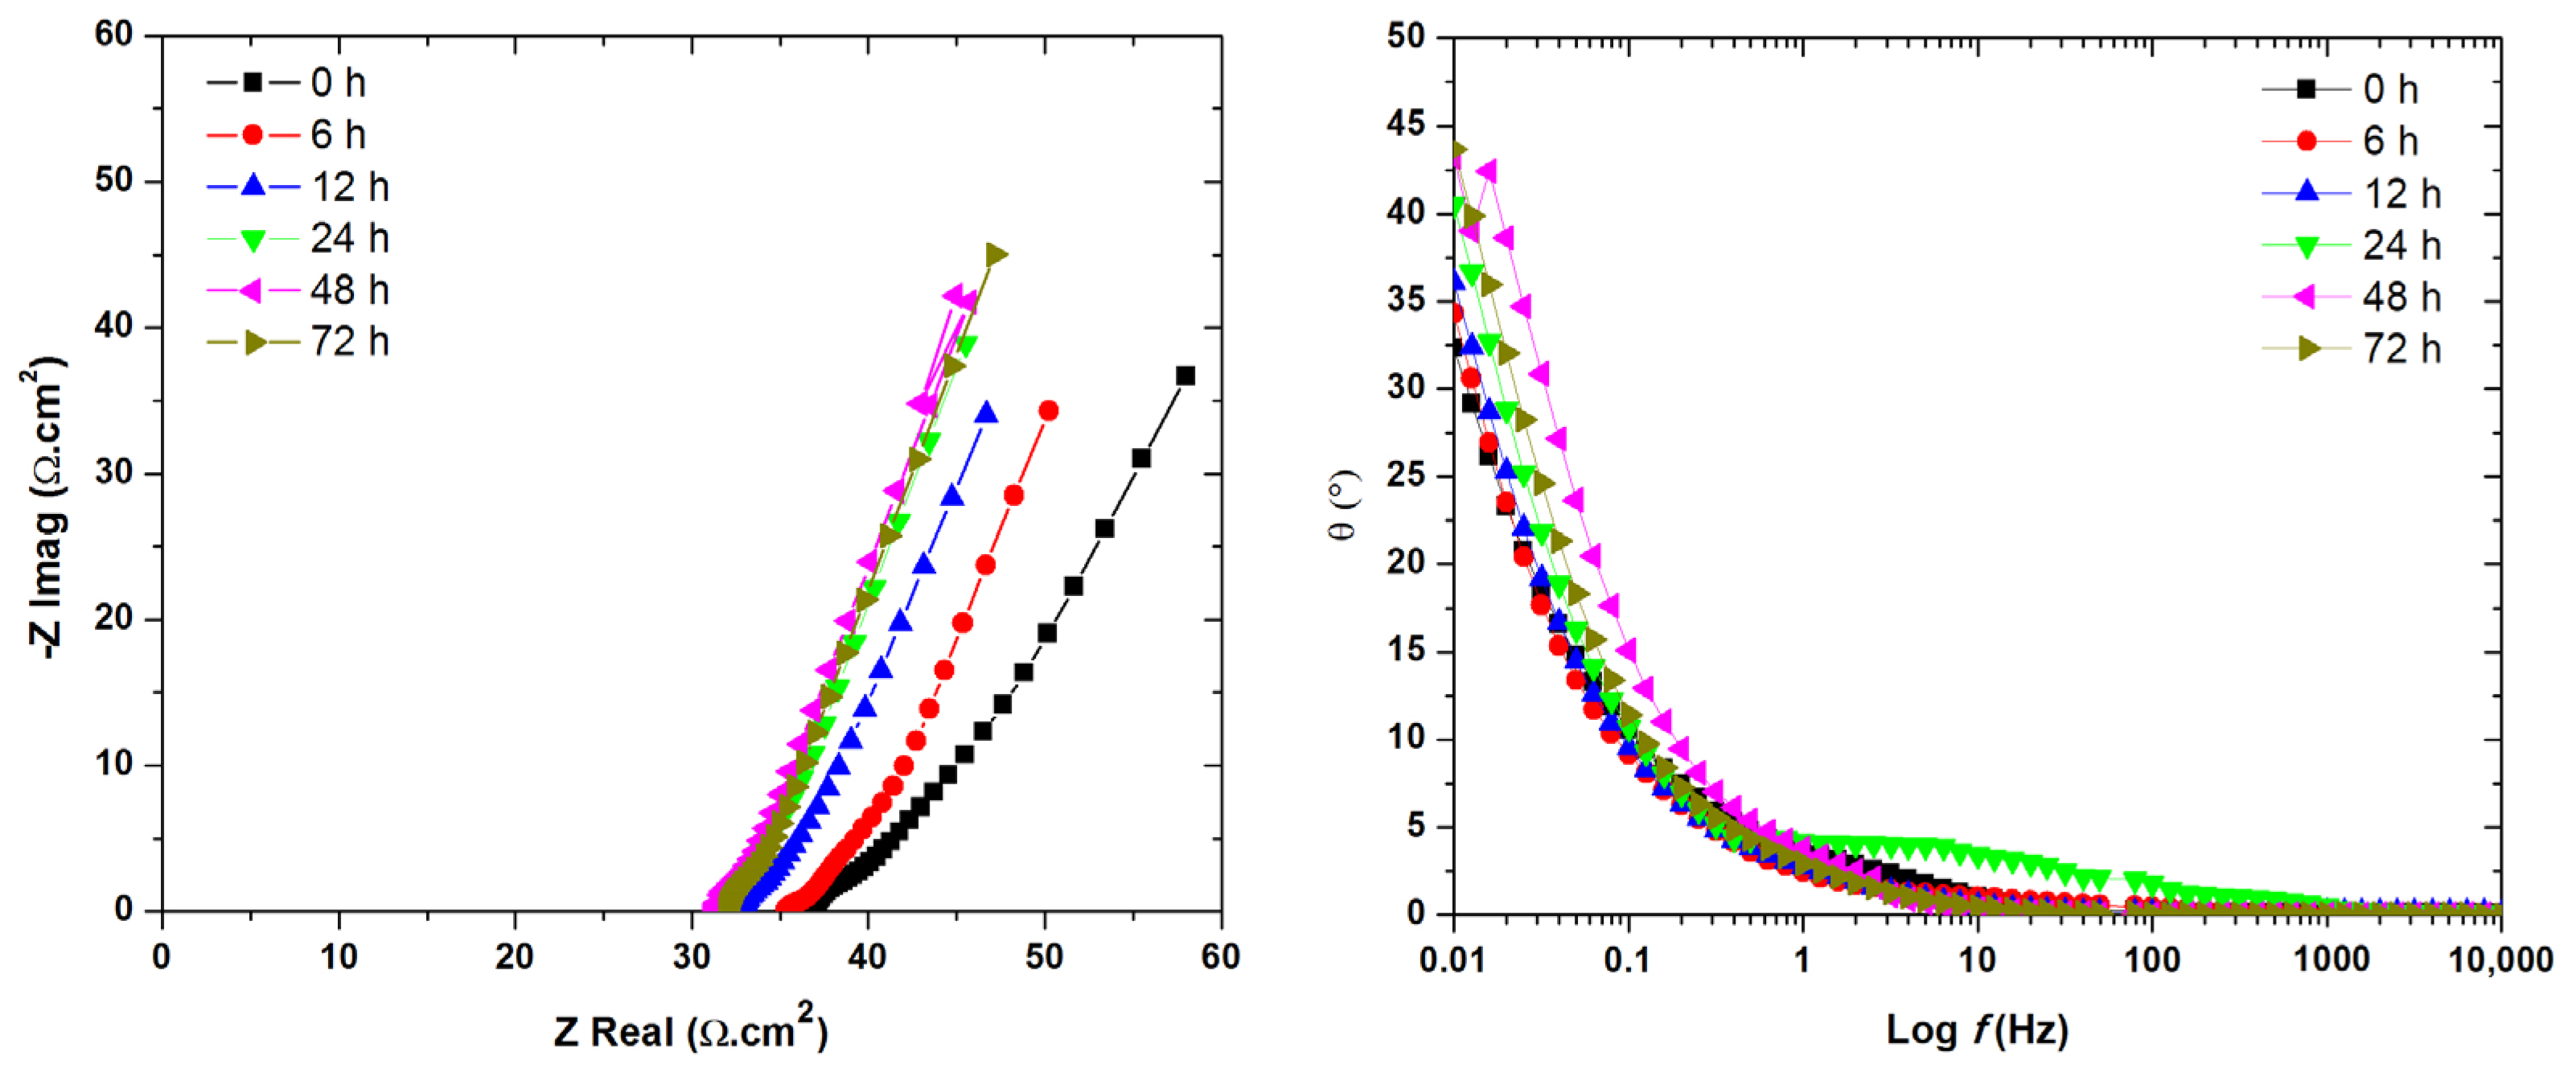
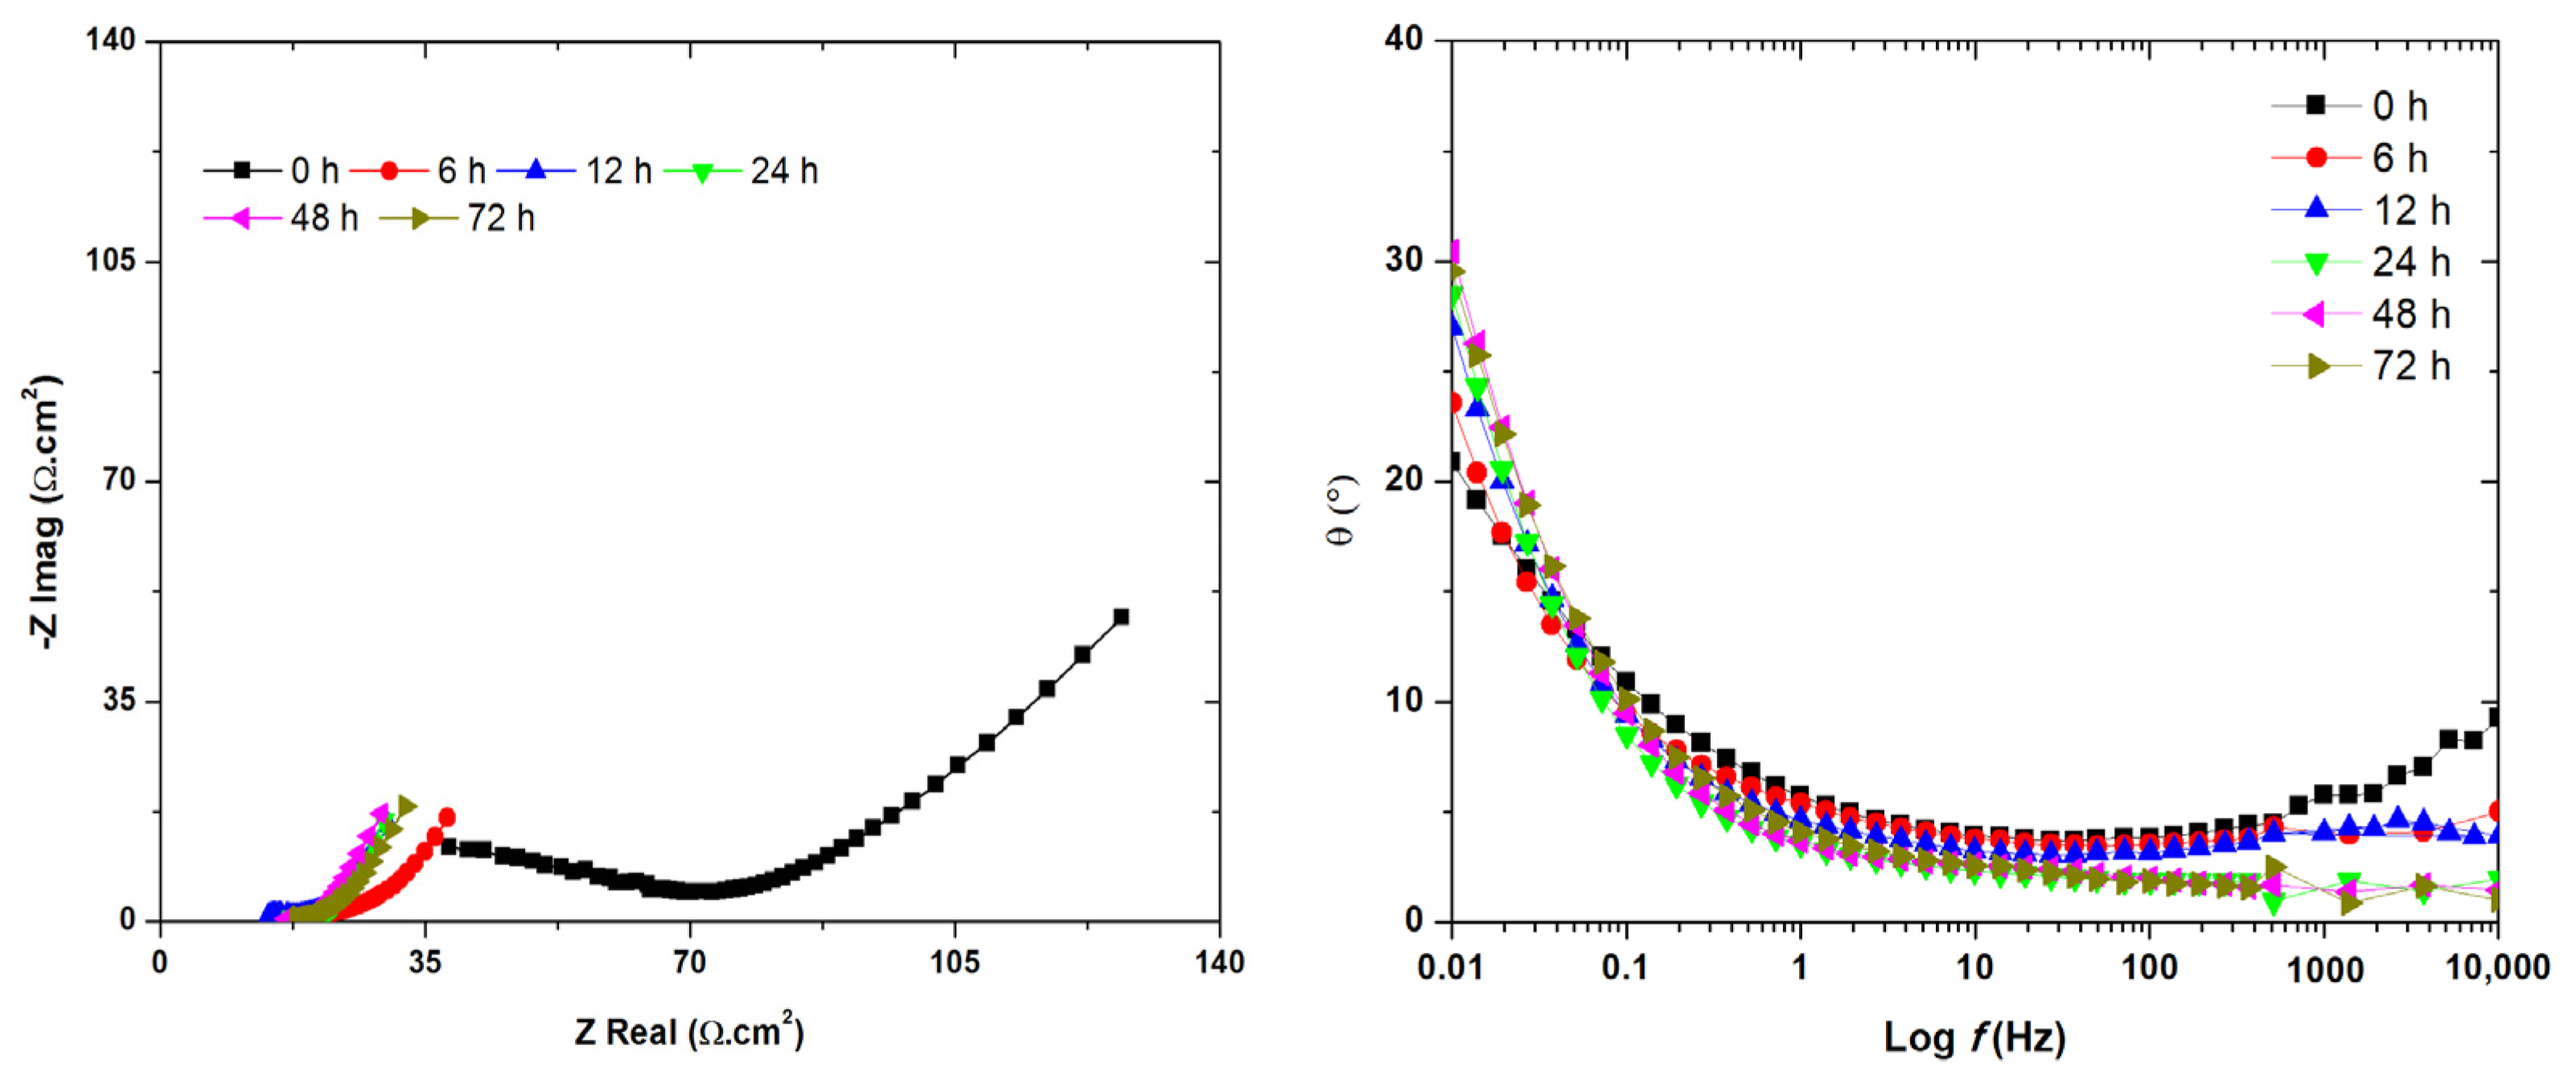
3.7. Electrochemical Characterization

Figure 14 shows the Nyquist plots of the corrosion product layer with and without the rust converter immersed in a 3.5% NaCl solution for 72 h. The porosity and hydrophilic nature of the corrosion product layer do not favor the protection of the cast iron. In the Nyquist plot (Figure 14 left), a Zreal value of about 60 Ω.cm2 is observed at the beginning, which decreases with time to values below 40 Ω.cm2. On the other hand, the converted layer (Figure 15 left) reaches initial values of approximately 140 Ω.cm2, which decreases after 6 h of exposure due to the fact that the corrosion product layer is not stable until this time. In general, in the evaluated times, the process that dominates the system is diffusion or mass transfer, since it is observed with a slope of approximately 45° at low frequencies [12]. The diffusion process is associated with the mass transfer behavior that occurs either in the solution, the rust layer, or the converted layer [21]. Although the slopes are less than 45°, as the immersion time increases, the slopes increase to 45°, as can be seen from the Bode plot of the phase angle (Figure 14 right and Figure 15 right).
The fitting of the experimental data of the corrosion products (Figure 16a) and converted layer (Figure 16b) was achieved through equivalent electrical circuits (EECs), as shown in Figure 12, where Rs is the solution resistance; Csyst and Rsyst, are related to the capacitance and resistance of the systems with corrosion products and converted layer; CPEdl is due to the capacitance of the electrochemical double layer, which is affected by the roughness of the systems; Rct is the resistance to the transfer load of the cast iron; and finally, Zw is related to the Warburg diffusion processes. In the second time constant at low frequencies (very limited appreciation), Cole–Cole-type dispersion is exhibited, which has the corresponding parameter n, with 0 < n ≤ 1, mainly attributed to the layer of corrosion products that had already formed to simulate a rust layer [70,71].
To explain why CPE or Q is used instead of C in the proposed circuit, it is because the processes involved are more complex, and therefore, other electrochemical parameters, such as the constant phase element (CPE), are used, since this can explain the heterogeneity or roughness on the metal surface [64].
The impedance of the constant phase element (ZCPE) can be expressed as in Equation (2) [72,73]:
Z CPE = 1 Y o ( jw ) n
where Yo = amount of CPE, j = imaginary unit (j2 = −1), n = phase shift parameter (n = 2α/(π)), w = angular frequency. The components Yo and n were used for the calculation of the capacitance of the converted film (Cfilm) and double layer (Cdl), following Equation (3) [74]. The obtained CPE values were used to calculate the capacitance values using the Brug Equation, as shown below [75]:
C = ( Q 1 R Ω α ) 1 / ( 1 α )
Table 3 shows the electrochemical parameters obtained by EEC. At the beginning of the test, the capacitance of corrosion products (Ccp) has a value of 1.67 × 10⁻² F/cm2. This value is considered low in comparison with a rust converter, which reaches a capacitance (Crc) of 3.81 × 10⁻⁶ F/cm2. At the end of the evaluation, both the capacitance (Crc) and resistance (Rrc) of the converted layer decrease drastically, leading to the breakdown of the protection initially granted. The values of Rtc and Rco decrease during the 72 h of immersion, indicating the penetration of chloride ions towards the metal, favoring the dissolution of the metal and interfering in the formation of the corrosion product layer. On the other hand, the values of n in the corrosion product layer confirm that the dominant step of the process is diffusion. In the case of the converted film, it initially presents low values of n, due to the heterogeneity caused by the oxide layer presenting a Cole–Cole dispersion, and as the immersion time increases, the value of n tends to 0.5, due to the entry of electroactive species.
Diffusion or mass transfer is the dominant or slowest process in the systems evaluated, and this behavior is observed in the Nyquist plots with a slope of approximately 45° at low frequencies (<1 Hz) [24]. Therefore, the diffusion process occurs through the pores of the rust layer and the converted film, suggesting a Warburg-type component or impedance of an infinite porous medium [76]. Although the slopes are less than 45°, as the immersion time progresses, the slopes should increase to values close to 45° and can be clearly observed in the phase Nyquist diagram. It seems reasonable to associate them to a diffusion process [77]. Through the EEC fitting, it was observed that the values of n confirm the diffusion process in the evaluated systems.
The impedance depends on the frequency of the potential perturbation. At high frequencies, the Warburg impedance is small because the diffusing reactants do not move much. On the other hand, at low frequencies, the reactants have to diffuse faster, increasing the Warburg impedance. Equation (4) for the Warburg impedance is as follows [78,79]:
Z w = σ w   ( ω ) 1 2 ( 1 j )
The Zw values shown in Table 3 indicate that this value increases as the immersion time progresses due to the reduced protection of the rust layer. However, the presence of the extract as a converter increases the resistance to Warburg diffusion and decreases the amount of electric charge in the electric double layer. Therefore, due to the presence of the polyphenol-converted layer of the extract, the oxygen entry to the surface for the cathodic reaction is slower to occur; although it is evident that in saline conditions, this layer tends to detach due to rust growth, even so, a greater stability is presented during the 72 h of electrochemical evaluation.
Therefore, the electrolyte could activate the diffusion processes, accelerating the kinetics at the interface by increasing the cathodic reaction O2 + 2H2O + 4e → 4OH [27]. The latter causes the release of Fe2+ ionic species which are released by the corrosion process. Finally, the rust converter is delaminated by the growth of rust.
Figure 17 shows the surfaces of the rust layer and the converted layer after 72 h of immersion in a 3.5 wt.% NaCl solution. It can be seen that there is a breakdown of the rust layer during the test. On the other hand, the presence of the rust converter remains on the surface where the cracked morphology of the converted film is still shown, but in spite of this, precipitates of iron oxides are observed (clear zones), indicating that the ferrous ions migrating towards the surface react by precipitating on the converted layer. Another reason for the presence of iron oxides can be related to the growth of the rust layer and this causes damage to the converted film by the extract, and thus its protective capacity decreases. The EDS analysis has shown that the presence of Cl in the precipitation zone is less than 0.28%, which confirms that it is only the iron oxide compounds that are present.

4. Conclusions

Raman and XRD spectroscopic analysis of the corrosion products identified the crystalline phases lepidocrocite, goethite, and magnetite. The Mimosa tenuiflora extract allowed the effective conversion of the oxide present on the surface of the cast iron, with an increase in C content from 4.60% to 64.63%, and a decrease in Fe from 65.10% to 0.82%. The cross-section confirmed the penetration of C belonging to the extract towards the interior of the layer of corrosion products, indicating the existence of a stable oxide conversion and how small particles of rust remained intact. FTIR absorption bands of the extract were identified, possibly composed of tannic acid, catechin, and gallic acid. When the converter was applied, absorption bands appeared mainly of iron chelates, and with XRD, the alteration of magnetite crystallinity was observed. The static contact angle showed an increase in the protective properties of the corrosion products with the oxide converter, with an increase from 14.6° to 70.1°. The EIS results showed that the protective capacity of the corrosion products is improved with the green extract; however, it is affected by the chloride ions, which enter the microcracks of the protective film surface, leading to its degradation. The green rust converter could be used in the protection of metallic heritage and in the industrial field in environmental conditions with high chloride ion contents, but further evaluation could prove better protection in non-saline conditions and indoor environments. In addition, this rust converter may be able to combine and enhance its properties with other materials to provide hydrophobic properties.

Author Contributions

Conceptualization, D.E.A.-G. and R.O.-C.; Data curation, J.R.-T.; Formal analysis, A.E.-V. and R.O.-C.; Investigation, R.G.-M.; Methodology, J.R.-T., A.C.-H. and A.E.-V.; Project administration, R.O.-C.; Resources, P.B.-H.; Software, R.G.-M. and A.C.-H.; Supervision, R.O.-C.; Validation, D.E.A.-G., J.R.-T. and R.O.-C.; Visualization, J.R.-T.; Writing—original draft, D.E.A.-G. and R.O.-C.; Writing—review and editing, J.R.-T., P.B.-H., A.E.-V. and R.G.-M. All authors have read and agreed to the published version of the manuscript.

Funding

This research received no external funding.

Institutional Review Board Statement

Not applicable.

Informed Consent Statement

Not applicable.

Data Availability Statement

The data presented in this study are available on request from the correspondence author.

Acknowledgments

The authors express their gratitude to the Laboratorio Nacional de Ciencias para la Investigación y Conservación del Patrimonio Cultural-Centro de Investigación en Corrosión (LANCIC-CICORR) of the Universidad Autonoma de Campeche and to the Conacyt Project 279740 of the Laboratorio Nacional de Ciencias para la Investigación y Conservación del Patrimonio Cultural for allowing the use of its equipment and facilities. Also, the authors extend special thanks to Isabel Silva and Ildefonso Pech for their support with XRD and SEM-EDS analysis, respectively, and to the Instituto de Ingeniería at Universidad Veracruzana for the facilities provided during the electrochemical analysis.

Conflicts of Interest

The authors declare no conflicts of interest.

References

  1. Huang, Y.; Qin, G.; Yang, M. A risk-based approach to inspection planning for pipelines considering the coupling effect of corrosion and dents. Process Saf. Environ. Prot. 2023, 180, 588–600. [Google Scholar] [CrossRef]
  2. Hussein Farh, H.M.; Ben Seghier, M.E.A.; Zayed, T. A comprehensive review of corrosion protection and control techniques for metallic pipelines. Eng. Fail. Anal. 2023, 143, 1350–6307. [Google Scholar] [CrossRef]
  3. Sliem, M.H.; Fayyad, E.M.; Abdullah, A.M.; Younan, N.A.; Al-Qahtani, N.; Nabhan, F.F.; Ramesh, A.; Laycock, N.; Ryan, M.P.; Maqbool, M.; et al. Monitoring of under deposit corrosion for the oil and gas industry: A review. J. Pet. Sci. Eng. 2021, 204, 108752. [Google Scholar] [CrossRef]
  4. Katunin, A.; Lis, K.; Joszko, K.; Żak, P.; Dragan, K. Quantification of hidden corrosion in aircraft structures using enhanced D-Sight NDT technique. Measurement 2023, 216, 112977. [Google Scholar] [CrossRef]
  5. Eslamian, H.; Javidi, M.; Zamani, M.R.; Dana, M.M.; Mansoori, E. Effect of pulsed current cathodic protection on pipeline steel API 5L X65 corrosion mitigation: An investigation and machine learning-assisted modeling. Corros. Commun. 2023, 12, 29–45. [Google Scholar] [CrossRef]
  6. Molina, M.T.; Cano, E.; Ramírez-Barat, B. Protective coatings for metallic heritage conservation: A review. J. Cult. Herit. 2023, 62, 99–113. [Google Scholar] [CrossRef]
  7. Verma, C.; Quraishi, M.A.; Alfantazi, A.; Rhee, K.Y. Biodegradable synthetic polymers in sustainable corrosion protection: Present and future scenarios. Adv. Ind. Eng. Polym. Res. 2023, 6, 407–435. [Google Scholar] [CrossRef]
  8. Zaher, A.; Aslam, R.; Lee, H.S.; Khafouri, A.; Boufellous, M.; Alrashdi, A.A.; El Aoufir, Y.; Lgaz, H.; Ouhssine, M. A combined computational & electrochemical exploration of the Ammi visnaga L. extract as a green corrosion inhibitor for carbon steel in HCl solution. Arab. J. Chem. 2022, 15, 103573. [Google Scholar] [CrossRef]
  9. Zakeri, A.; Bahmani, E.; Aghdam, A.S.R. Plant extracts as sustainable and green corrosion inhibitors for protection of ferrous metals in corrosive media: A mini review. Corros. Commun. 2022, 5, 25–38. [Google Scholar] [CrossRef]
  10. Njoku, C.N.; Enendu, B.N.; Okechukwu, S.J.; Igboko, N.; Anyikwa, S.O.; Ikeuba, A.I.; Onyeachu, I.B.; Etim, I.I.N.; Njoku, D.I. Review on anti-corrosion properties of expired antihypertensive drugs as benign corrosion inhibitors for metallic materials in various environments. Results Eng. 2023, 18, 101183. [Google Scholar] [CrossRef]
  11. Li, J.; Ge, S.; Wang, J.; Du, H.; Song, K.; Fei, Z.; Guo, Z. Water-based rust converter and its polymer composites for surface anticorrosion. Colloids Surf. A Physicochem. Eng. Asp. 2018, 537, 334–342. [Google Scholar] [CrossRef]
  12. Galván, J.C.; Simancas, J.; Morcillo, M.; Bastidas, J.M.; Almeida, E.; Feliu, S. Effect of treatment with tannic, gallic and phosphoric acids on the electrochemical behaviour of rusted steel. Electrochim. Acta 1992, 37, 1983–1985. [Google Scholar] [CrossRef]
  13. Barrero, C.A.; Ocampo, L.M.; Arroyave, C.E. Possible improvements in the action of some rust converters. Corros. Sci. 2001, 43, 1003–1018. [Google Scholar] [CrossRef]
  14. Ocampo, L.M.; Margarit, I.C.P.; Mattos, O.R.; Córdoba-de-Torresi, S.I.; Fragata, F.D.L. Performance of rust converter based in phosphoric and tannic acids. Corros. Sci. 2004, 46, 1515–1525. [Google Scholar] [CrossRef]
  15. Favre, M.; Landolt, D. The influence of gallic acid on the reduction of rust on painted steel surfaces. Corros. Sci. 1993, 34, 1481–1494. [Google Scholar] [CrossRef]
  16. Çakar, S.; Özacar, M. The pH dependent tannic acid and Fe-tannic acid complex dye for dye sensitized solar cell applications. J. Photochem. Photobiol. A 2019, 371, 282–291. [Google Scholar] [CrossRef]
  17. Ross, T.K.; Francis, R.A. The treatment of rusted steel with mimosa tannin. Corros. Sci. 1978, 18, 351–361. [Google Scholar] [CrossRef]
  18. Matamala, G.; Smeltzer, W.; Droguett, G. Use of tannin anticorrosive reaction primer to improve traditional coating systems. Corrosion 1994, 50, 270–275. [Google Scholar] [CrossRef]
  19. Ostovari, A.; Hoseinieh, S.M.; Peikari, M.; Shadizadeh, S.R.; Hashemi, S.J. Corrosion inhibition of mild steel in 1 M HCl solution by henna extract: A comparative study of the inhibition by henna and its constituents (Lawsone, Gallic acid, Œ±-d-Glucose and Tannic acid). Corros. Sci. 2009, 51, 1935–1949. [Google Scholar] [CrossRef]
  20. Martinez, S.; Štagljar, I. Correlation between the molecular structure and the corrosion inhibition efficiency of chestnut tannin in acidic solutions. J. Mol. Struct. 2003, 640, 167–174. [Google Scholar] [CrossRef]
  21. Zhao, X.D.; Cheng, Y.F.; Fan, W.; Vladimir, C.; Volha, V.; Alla, T. Inhibitive performance of a rust converter on corrosion of mild steel. J. Mater. Eng. Perform. 2014, 23, 4102–4108. [Google Scholar] [CrossRef]
  22. Feng, Y.; Ge, S.; Li, J.; Li, S.; Zhang, H.; Chen, Y.; Guo, Z. Synthesis of 3, 4, 5-trihydroxy-2-[(hydroxyimino) methyl] benzoic acid as a novel rust converter. Green Chem. Lett. Rev. 2017, 10, 455–461. [Google Scholar] [CrossRef]
  23. Collazo, A.; Nóvoa, X.R.; Pérez, C.; Puga, B. EIS study of the rust converter effectiveness under different conditions. Electrochim. Acta 2008, 53, 7565–7757. [Google Scholar] [CrossRef]
  24. Xu, W.; Han, E.H.; Wang, Z. Effect of tannic acid on corrosion behavior of carbon steel in NaCl solution. J. Mater. Sci. Technol. 2019, 35, 64–75. [Google Scholar] [CrossRef]
  25. Martel, S.A.; Olivas, I.; Alvarado, M.L.; Urquizo-Monrreal, P. Mimosa Tenuiflora: Redefinición de concepto durante el ciclo de vida del producto. Acad. J. 2014, 6, 478–483. [Google Scholar]
  26. Camargo, S.L.; Grether, R. Germinación, dispersión y establecimiento de plántulas de Mimosa tenuiflora (Leguminosae) en México. Rev. Biol. Trop. 1998, 46, 543–554. [Google Scholar] [CrossRef]
  27. Morteo, A.O.; Galván, R.; Fernández, I.; Orozco, R. Assessing Mimosa Tenuiflora Extract as Rust Converter on Iron Corrosion Products. ECS Trans. 2018, 84, 341–348. [Google Scholar] [CrossRef]
  28. ASTM G1-03; Standard Practice for Preparing, Cleaning, and Evaluating Corrosion Test Specimens. American Society for Testing and Materials International: West Conshohocken, PA, USA, 2012; pp. 1–9.
  29. ISO16859-1; Metallic Materials—Leeb Hardness Test Part 1: Test Method. International Organization for Standardization: Geneva, Switzerland, 2015.
  30. ASTM A956-06; Standard Test Method for Leeb Hardness Testing of Steel Products. ASTM: West Conshohocken, PA, USA, 2006; pp. 1–6.
  31. Hamidon, T.S.; Qiang, T.Z.; Hussin, M.H. Anticorrosive performance of AA6061 aluminium alloy treated with sol-gel coatings doped with mangrove bark tannins in 3.5 wt% NaCl. Mater. Res. Express 2019, 6, 096417. [Google Scholar] [CrossRef]
  32. ASTM G-106-89; Standard Practice for Verification of Algorithm and Equipment for Electrochemical Impedance Measurements. ASTM: West Conshohocken, PA, USA, 2015; pp. 89–106.
  33. A48/A48M-03; Standard Specification for Gray Iron Castings. ASTM: West Conshohocken, PA, USA, 2012; pp. 1–6.
  34. Davis, J.R. ASM Specialty Handbook: Cast Irons, 1st ed.; ASM International: Materials Park, OH, USA, 1996; p. 494. [Google Scholar]
  35. Elliott, R. Cast Iron Technology, 1st ed.; Butterworth-Heinemann: Toronto, ON, Canada, 1988; p. 244. [Google Scholar]
  36. Angus, H.T. Cast Iron: Physical and Engineering Properties, 2nd ed.; Butterworths: London, UK, 2013; p. 554. [Google Scholar]
  37. Scott, D.A. Metallography and Microstructure in Ancient and Historic Metals; Getty Publications: Singapore, 1992; p. 176. [Google Scholar] [CrossRef]
  38. Vander, G.F.; Lampman, S.R.; Sanders, B.R.; Anton, G.J.; Polakowski, C.; Kinson, J.; Scott, W.W., Jr. ASM Handbook: Metallography and Microstructures; ASM International: Materials Park, OH, USA, 2004; Volume 9, p. 775. ISSN 08170379. Available online: http://books.google.com.hk/books?id=eC-Zt1J4oCgC (accessed on 29 January 2024).
  39. Reyes Trujeque, J.; Villegas, P. Conservación del Patrimonio Cultural-Una Mirada Multidisciplinaria, 1st ed.; Editorial Morevalladolid: Michoacán, México, 2008; p. 209. ISBN 978-607-424-100-6. [Google Scholar]
  40. Singh, R. Applied Welding Engineering: Processes, Codes, and Standards; Butterworth-Heinemann: Oxford, UK, 2012; p. 334. [Google Scholar] [CrossRef]
  41. Ashkenazi, D.; Nusbaum, I.; Shacham-Diamand, Y.; Cvikel, D.; Kahanov, Y.; Inberg, A. A method of conserving ancient iron artefacts retrieved from shipwrecks using a combination of silane self-assembled monolayers and wax coating. Corros. Sci. 2017, 123, 88–102. [Google Scholar] [CrossRef]
  42. Hamidon, T.S.; Hussin, M.H. Susceptibility of hybrid sol-gel (TEOS-APTES) doped with caffeine as potent corrosion protective coatings for mild steel in 3.5 wt.% NaCl. Prog. Org. Coat. 2020, 140, 105478. [Google Scholar] [CrossRef]
  43. Lamuela-Raventós, R.M. Folin-Ciocalteu method for the measurement of total phenolic content and antioxidant capacity. In Measurement of Antioxidant Activity & Capacity Recent Trends and Applications, 1st ed.; Apak, R., Capanoglu, E., Shahidi, F., Eds.; John Wiley & Sons Ltd.: New York, NY, USA, 2017; pp. 107–117. [Google Scholar] [CrossRef]
  44. De la Fuente, D.; Alcántara, J.; Chico, B.; Díaz, I.; Jiménez, J.A.; Morcillo, M. Characterisation of rust surfaces formed on mild steel exposed to marine atmospheres using XRD and SEM/Micro-Raman techniques. Corros. Sci. 2016, 110, 253–264. [Google Scholar] [CrossRef]
  45. Sancy, M.; Gourbeyre, Y.; Sutter, E.M.; Tribollet, B. Mechanism of corrosion of cast iron covered by aged corrosion products: Application of electrochemical impedance spectrometry. Corros. Sci. 2010, 52, 1222–1227. [Google Scholar] [CrossRef]
  46. Raman, A.; Nasrazadani, S.; Sharma, L. Morphology of rust phases formed on weathering steels in various laboratory corrosion tests. Metallography 1989, 22, 79–96. [Google Scholar] [CrossRef]
  47. Alcántara, J.; Chico, B.; Díaz, I.; De la Fuente, D.; Morcillo, M. Airborne chloride deposit and its effect on marine atmospheric corrosion of mild steel. Corros. Sci. 2015, 97, 74–88. [Google Scholar] [CrossRef]
  48. Zise, W.; Chunchun, X.; Xia, C.A.; Ben, X. The morphology, phase composition and effect of corrosion product on simulated archaeological iron. Chin. J. Chem. Eng. 2007, 15, 433–438. [Google Scholar] [CrossRef]
  49. Božović, S.; Gvozdanović, T.; Kraš, A.; Grudić, V.; Kurajica, S.; Martinez, S. Rust layer growth and modification by a tannin-based mixture for lowering steel corrosion rates in neutral saline solution. Corros. Eng. Sci. 2020, 55, 372–380. [Google Scholar] [CrossRef]
  50. De Faria, D.L.; Venâcio, S.; De Oliveira, S.M. Raman microspectroscopy of some iron oxides and oxyhydroxides. J. Raman Spectrosc. 1997, 28, 873–878. [Google Scholar] [CrossRef]
  51. Legodi, M.A.; de Waal, D. The preparation of magnetite, goethite, hematite and maghemite of pigment quality from mill scale iron waste. Dye. Pigment. 2010, 74, 161–168. [Google Scholar] [CrossRef]
  52. Ramanaidou, E.; Wells, M.; Lau, I.; Laukamp, C. Characterization of iron ore by visible and infrared reflectance and, Raman spectroscopies, In Iron Ore: Mineralogy, Processing, and Environmental Sustainability; Lu, L., Ed.; Woodhead Publishing: Cambridge, UK, 2015; pp. 191–228. [Google Scholar] [CrossRef]
  53. Zhang, X.; Xiao, K.; Dong, C.; Wu, J.; Li, X.; Huang, Y. In situ Raman spectroscopy study of corrosion products on the surface of carbon steel in solution containing Cl and SO42−. Eng. Fail. Anal. 2011, 18, 1981–1989. [Google Scholar] [CrossRef]
  54. Criado, M.; Martínez, S.; Bastidas, J.M. A Raman spectroscopy study of steel corrosion products in activated fly ash mortar containing chlorides. Constr. Build. Mater. 2015, 96, 383–390. [Google Scholar] [CrossRef]
  55. Giurginca, M.; Badea, N.; Miu, L.; Meghea, L.A. Spectral technics for identifying tanning agents in the heritage leather items. Rev. Chim. 2007, 58, 923–928. [Google Scholar]
  56. Gehring, A.U.; Hofmeister, A.M. The transformation of lepidocrocite during heating: A magnetic and spectroscopic study. Clays Clay Miner. 1994, 42, 409–415. [Google Scholar] [CrossRef]
  57. Jaén, J.A.; de Araque, L. Caracterización de los productos de corrosión de aceros al carbono en el clima tropical marino de Sherman (provincia de Colón, Panamá). Tecnociencia 2006, 8, 49–63. Available online: https://revistas.up.ac.pa/index.php/tecnociencia/article/view/715 (accessed on 18 January 2024).
  58. Berrones, M.D.; Lascano, L. Síntesis de nanopartículas de hematita por el método de precipitación controlada. Rev. Politécnica 2009, 30, 91–99. [Google Scholar]
  59. Gómez, P.G.; González, V.A.; Garza, M.A.; Esquivel, R. Síntesis y caracterización de nanocompósitos de óxido de hierro en un polímero semiconductor. Ingenierías 2011, 14, 9–16. Available online: http://eprints.uanl.mx/10454/1/50_Sintesis_y_caracterizacion.pdf (accessed on 29 January 2024).
  60. Jaén, J.A.; Adames, O.; Iglesias, J.; Hernández, C. Caracterización de la pátina protectora del acero patinable ASTM A709 HPS 70W del puente Centenario. Tecnociencia 2011, 13, 81–99. Available online: https://revistas.up.ac.pa/index.php/tecnociencia/article/view/936 (accessed on 18 January 2024).
  61. Song, J.; Jia, S.Y.; Yu, B.; Wu, S.H.; Han, X. Formation of iron (hydr) oxides during the abiotic oxidation of Fe (II) in the presence of arsenate. J. Hazard. Mater. 2015, 294, 70–79. [Google Scholar] [CrossRef]
  62. Karimzadeh, I.; Dizaji, H.R.; Aghazadeh, M. Development of a facile and effective electrochemical strategy for preparation of iron oxides (Fe3O4 and γ-Fe2O3) nanoparticles from aqueous and ethanol mediums and in situ PVC coating of Fe3O4 superparamagnetic nanoparticles for biomedical applications. J. Magn. 2016, 416, 81–88. [Google Scholar] [CrossRef]
  63. Nasrazadani, S. The application of infrared spectroscopy to a study of phosphoric and tannic acids interactions with magnetite (Fe3O4), goethite (α-FeOOH) and lepidocrocite (γ-FeOOH). Corros. Sci. 1997, 39, 1845–1859. [Google Scholar] [CrossRef]
  64. Jaramillo, A.F.; Montoya, L.F.; Prabhakar, J.M.; Sanhueza, J.P.; Fernández, K.; Rohwerder, M.; Melendrez, M.F. Formulation of a multifunctional coating based on polyphenols extracted from the Pine radiata bark and functionalized zinc oxide nanoparticles: Evaluation of hydrophobic and anticorrosive properties. Prog. Org. Coat. 2019, 135, 191–204. [Google Scholar] [CrossRef]
  65. Kreislova, K.; Knotkova, D.; Geiplova, H. Atmospheric corrosion of historical industrial structures. In Corrosion and Conservation of Cultural Heritage Metallic Artefacts; Dillman, P., Watkinson, D., Angellini, E., Adriaens, A., Eds.; Woodhead Publishing: Sawston, Reino Unido, 2013; pp. 311–343. [Google Scholar] [CrossRef]
  66. Dillmann, P.; Mazaudier, F.; Hœrlé, S. Advances in understanding atmospheric corrosion of iron. I. Rust characterization of ancient ferrous artefacts exposed to indoor atmospheric corrosion. Corros. Sci. 2004, 46, 1401–1429. [Google Scholar] [CrossRef]
  67. Contreras, E.; Galindez, Y.; Rodas, M.A.; Bejarano, G.; Gómez, M.A. CrVN/TiN nanoscale multilayer coatings deposited by DC unbalanced magnetron sputtering. Surf. Coat. Technol. 2017, 332, 214–222. [Google Scholar] [CrossRef]
  68. Hernández, M.; Hernández-Escampa, M.; Abreu, C.; Uruchurtu, J.; Bethencourt, M.; Covelo, A. Caracterización de una bala de cañón histórica de la Fortaleza de San Juan de Ulúa expuesta a un medio marino. Arqueometría 2016, 58, 610–623. [Google Scholar]
  69. Rahim, A.A.; Kassim, M.J.; Rocca, E.; Steinmetz, J. Mangrove (Rhizophora apiculata) tannins: An eco-friendly rust converter. Corros. Eng. Sci. 2011, 46, 425–431. [Google Scholar] [CrossRef]
  70. Pérez, C.; Collazo, A.; Izquierdo, M.; Merino, P.; Novoa, X. Electrochemical Impedance Spectroscopy Study of the Corrosion Process on Coated Galvanized Steel in a Salt Spray Fog Chamber. Corrosion 2000, 56, 1220–1232. [Google Scholar] [CrossRef]
  71. Díaz, B.; Nóvoa, X.; Pérez, C.; Morgado, M. Influence of Graphene Oxide Additions on the Corrosion Resistance of a Rust Converter Primer. Coatings 2022, 12, 345. [Google Scholar] [CrossRef]
  72. Watkinson, D. Preservation of Metallic Cultural Heritage; Cottis, R.A., Ed.; Elsevier: Amsterdam, The Netherlands, 2010. [Google Scholar] [CrossRef]
  73. Feliu, S.; Galván, J.; Feliu Jr, S.; Bastidas, J.; Simancas, J.; Morcillo, M.; Almeida, E. An electrochemical impedance study of the behaviour of some pretreatments applied to rusted steel surfaces. Corros. Sci. 1993, 35, 1351–1358. [Google Scholar] [CrossRef]
  74. Rocca, E.; Faiz, H.; Dillmann, P.; Neff, D.; Mirambet, F. Electrochemical behavior of thick rust layers on steel artefact: Mechanism of corrosion inhibition. Electrochim. Acta 2019, 316, 219–227. [Google Scholar] [CrossRef]
  75. Brug, G.; Van Den Eeden, A.; Sluyters, M.; Sluyters, J.H. The analysis of electrode impedances complicated by the presence of a constant phase element. J. Electroanal. Chem. 1984, 176, 275–295. [Google Scholar] [CrossRef]
  76. Amirudin, A.; Thierry, D. Application of electrochemical impedance spectroscopy to study the degradation of polymer-coated metals. Prog. Org. Coat. 1995, 26, 1–28. [Google Scholar] [CrossRef]
  77. Muralidharan, V. Warburg impedance-basics revisited. Anti-Corros 1997, 44, 26–29. [Google Scholar] [CrossRef]
  78. Vedalakshmi, R.; Saraswathy, V.; Son, H.; Palaniswamy, N. Determination of diffusion coefficient of chloride in concrete using Warburg diffusion coefficient. Corros. Sci. 2009, 51, 1299–1307. [Google Scholar] [CrossRef]
  79. Skale, S.; Dolecek, V.; Slemnik, M. Substitution of the constant phase element by Warburg impedance for protective coatings. Corros. Sci. 2007, 49, 1045–1055. [Google Scholar] [CrossRef]
Figure 1. Microstructure of cast iron (a) 200×, (b) 500×, (c) 500×, (d) 1000×, (e) 1000×, and (f) 4000×.
Surfaces 07 00010 g001
Figure 2. Elemental chemical mapping of the cast iron microstructure: (a) analyzed zone, (b) distribution of C, (c) Fe, (d) Si, (e) S, and (f) Mn.
Surfaces 07 00010 g002aSurfaces 07 00010 g002b
Figure 3. Calibration curve for total polyphenol determination.
Surfaces 07 00010 g003
Figure 4. Morphology of the corrosion product layer: (a) 100×, (b) 1000×, (c) 1000×, and (d) 3500×.
Surfaces 07 00010 g004
Figure 5. (a) Morphology and (b) thickness of microcracks in the converted layer.
Surfaces 07 00010 g005
Figure 6. Elemental chemical mapping of the converted layer: (a) analyzed zone, (b) C distribution, and (c) O and (d) Fe residues.
Surfaces 07 00010 g006aSurfaces 07 00010 g006b
Figure 7. Cross-section: (a) thickness of the converted layer at 100×, (b) contrast difference by atomic number at 350×, (c,d) interface corrosion products/rust converter at 1000× and 3500×.
Surfaces 07 00010 g007
Figure 8. Elemental chemical mapping of the cross-section: (a) distribution of Fe and C, (b) C, (c) Fe, and (d) O.
Surfaces 07 00010 g008
Figure 9. Linear scan by EDS: C (dark line) and Fe (red line) content.
Surfaces 07 00010 g009
Figure 10. Raman spectrum of cast iron corrosion products.
Surfaces 07 00010 g010
Figure 11. FTIR spectrum, (left) Mimosa tenuiflora extract (right) corrosion products and rust converter.
Surfaces 07 00010 g011
Figure 12. Diffractograms: (left) layer of corrosion products and (right) with rust converter.
Surfaces 07 00010 g012
Figure 13. Static contact angle of (left) corrosion products and (right) converted layer.
Surfaces 07 00010 g013
Figure 14. Nyquist (left) and Bode plots of phase angle vs. log frequency of corrosion products (right).
Surfaces 07 00010 g014
Figure 15. Nyquist (left) and Bode plots of phase angle vs. log frequency of rust converter (right).
Surfaces 07 00010 g015
Figure 16. CEE used to fit the electrochemical data in the (a) corrosion products and (b) converted layer.
Surfaces 07 00010 g016
Figure 17. Layer of corrosion products (a) and converted film (b) after 72 h of immersion in saline solution.
Surfaces 07 00010 g017
Table 1. Elemental chemical composition of cast iron.
Cast IronElement (wt.%)
CONaSiSClCa MnFe
Graphite flake (dark zone)12.5524.760.651.920.340.230.810.3658.39
Metal base (gray zone)3.63--2.22----93.59
Table 2. Elemental chemical composition of corrosion products with and without rust converter.
Element (wt.%)
SampleCONaSClK Fe
Corrosion products4.6027.00-0.243.060.5665.10
Rust converter64.6333.760.69--0.090.82
Table 3. Electrochemical parameters obtained by CEE of the corrosion products and converted layer after 72 h of immersion in NaCl at 3.5%.
Time Rs
(Ω.cm2)
Ccp
(F/cm2)
Rcp
(Ω.cm2)
Cdl
(F/cm2)
nRct
(Ω.cm2)
Zw
(S.s−5)
Chi2
Corrosion products037.061.67 × 10−24.910.1960.4822.316.33 × 10−32.50 × 10⁻⁴
635.421.01 × 10−22.110.1290.488.146.38 × 10−31.54 × 10⁻⁴
1232.895.45 × 10−23.650.1540.514.107.12 × 10−31.70 × 10⁻⁴
2431.236.37 × 10−31.760.1300.525.657.45 × 10−31.11 × 10⁻⁵
4831.246.89 × 10−21.730.1330.555.568.34 × 10−33.66 × 10⁻⁴
7230.681.63 × 10−23.880.1460.553.298.72 × 10−38.69 × 10⁻⁴
Rust converter022.893.81 × 10−649.042.86 × 10−50.3781.154.36 × 10−31.86 × 10⁻⁴
617.942.68 × 10−518.126.11 × 10−40.4423.115.30 × 10−35.64 × 10⁻⁵
1215.781.42 × 10−41.351.28 × 10−30.4412.145.72 × 10−39.71 × 10⁻⁵
2418.673.99 × 10−21.163.78 × 10−20.499.236.65 × 10−38.46 × 10⁻⁵
4817.582.88 × 10−21.490.1210.557.986.78 × 10−38.34 × 10⁻⁵
7219.203.78 × 10−21.410.1160.567.346.89 × 10−35.76 × 10⁻⁵
Disclaimer/Publisher’s Note: The statements, opinions and data contained in all publications are solely those of the individual author(s) and contributor(s) and not of MDPI and/or the editor(s). MDPI and/or the editor(s) disclaim responsibility for any injury to people or property resulting from any ideas, methods, instructions or products referred to in the content.

