Article

Epoxy Resin Nanocomposites: The Influence of Interface Modification on the Dispersion Structure—A Small-Angle-X-ray-Scattering Study

1
Institute of Materials Chemistry, TU Wien, Getreidemarkt 9, 1060 Vienna, Austria
2
Inorganic Solid State Chemistry, Saarland University, Campus Building C4.1, 66123 Saarbrücken, Germany
3
Faculty of Physics, University of Vienna, Boltzmanngasse 5, 1090 Vienna, Austria
4
Institute of Materials Science and Technology, TU Wien, Getreidemarkt 9, 1060 Vienna, Austria
*
Author to whom correspondence should be addressed.
Surfaces 2020, 3(4), 664-682; https://doi.org/10.3390/surfaces3040044
Submission received: 3 November 2020 / Revised: 8 December 2020 / Accepted: 9 December 2020 / Published: 12 December 2020

Abstract

:
The surface functionalization of inorganic nanoparticles is an important tool for the production of homogeneous nanocomposites. The chemical adaptation of the nano-filler surface can lead to effective weak to strong interactions between the fillers and the organic matrix. Here we present a detailed systematic study of different surface-functionalized particles in combination with a SAXS method for the systematic investigation of the interface interaction in the development of epoxy nanocomposites. We investigated the effect of surface modification of spherical SiO2 nanoparticles with 9 nm and 72 nm diameter and crystalline ZrO2 nanoparticles with 22 nm diameter on the homogeneous distribution of the fillers in diethylenetriamine (DETA) cured bisphenol-F-diglycidylether epoxy resin nanocomposites. Unmodified nanoparticles were compared with surface-modified oxides having diethylene glycol monomethyl ethers (DEG), 1,2-diols, or epoxy groups attached to the surface. The influence of surface modification on dispersion quality was investigated by transmission electron microscopy (TEM) and small angle X-ray scattering (SAXS) for inorganic filler contents of 3, 5 and 10 wt%. It was shown that the dispersion quality can be optimized by varying the coupling agent end group to obtain homogeneous and transparent nanomaterials. UV/VIS measurements confirmed the transparency/translucency of the obtained materials. The relationship between particle–matrix interaction and particle–particle interaction plays a decisive role in homogeneity and is controlled by the surface groups as well as by the type, size, and morphology of the nanoparticles themselves.

Graphical Abstract

1. Introduction

Reinforced epoxy resins are widely used in applications, such as coatings, laminates, encapsulation, and others, due to their good adhesion to various surfaces, their heat curing, and the resulting mechanical properties [1,2,3,4,5]. Inorganic nano-sized building blocks, such as silicon dioxide and metal oxide nanoparticles or carbon structures, are regularly used for mechanical and thermal reinforcement in this class of crosslinked polymers [6,7,8,9,10]. Particularly layered systems, such as clays or more recently graphene sheets, have been investigated as reinforcing fillers [11,12,13,14]. Due to the high surface energy of nanoscale objects and a possible incompatibility between the unmodified filler surface and the prepolymer monomers, agglomeration often occurs during the chemical crosslinking, which is counterproductive regarding the preparation of a homogeneous material. A chemical surface adaptation of the inorganic components can lead to a much better dispersion of the nanofillers and to a tight bonding between inorganic fillers and matrix, which reduces crack formation. Besides the bonding at the interface, the homogeneous distribution of the components in the matrix can dramatically increase by surface modification. This is particularly necessary when novel mechanical effects associated with nanoparticles together with a high transparency of the final material are desired, for example in coating applications [6,15]. Often metal oxides are used as filler materials because of their inertness and broad availability. Improvement of (thermo)mechanical properties of epoxy resins such as fracture toughness [16,17,18], tensile strength [19], impact strength [20], as well as tailoring of glass transition temperature [21,22,23] has been reported for metal oxide nanoparticle filled epoxy resins.
The surface functionalization of the fillers also has an impact on the processing of the materials, e.g., it can reduce shear forces when mixing the components [21]. This allows the use of more cost-effective and energy-saving techniques such as mixing by extrusion. Techniques with high shear forces are particularly necessary to obtain homogeneous dispersions of the inorganic components in the organic matrix when the two are not compatible.
Methods for determining the dispersion structure are transmission electron (TEM) or scanning electron microscopy (SEM) on ultra-thin cuts of the material, both are very localized techniques only focusing on a small part of the sample. In addition, small angle X-ray-scattering (SAXS) or small angle neutron scattering (SANS) can be applied as a complementary method [24,25,26,27,28]. The combination of microscopic and scattering techniques can be helpful in a precise chemical tailoring of nanocomposite interfaces [29]. In comparison to TEM, SAXS has a higher statistical accuracy with respect to the average structure of the whole nanocomposite [30]. A difficulty of SAXS is, however, that numerical fitting of SAXS intensities with model functions is required. Different approaches are frequently used, such as the polydispersity index, if global scattering functions are used [31], or the Percus–Yevick approximation, which was extended for polydisperse particles by the decoupling or the local monodisperse approximation, see [32,33] for an overview. In the presented study, for a weakly aggregated system, the simple Percus–Yevick approximation was sufficient (as described in chapter 2).
SAXS is frequently used to determine the structure and morphology of nanocomposites such as the quality of the nanoparticle distribution, but more often for the combination of rubber and nanoparticles from clay [34], silica [35], or carbon [36] than for epoxy resin. Many examples of high-quality inorganic nanoparticle distributions in organic matrices have already been shown from powder or suspension precursors [19,20,21,37]. Sometimes unmodified nanoparticles are already well dispersible due to low energy input, but in general a specific organic modification gives the best interface adaptation and thus the best dispersion quality [29,38]. In the literature, the advantage of an interfacial match in epoxy resin nanocomposites has already been proven for specific systems [39,40].
While a variety of different organic surface groups can be used to enhance the interactions between the epoxy matrix and the filler particles, it remains unclear which type of interaction should be preferred and whether the morphology of the nanoparticulate fillers also has an influence on the dispersion in combination with the surface function. To answer these questions, it is necessary to apply tailor-made organic surface functions and to control the size and shape of the fillers. For a statistically meaningful interpretation of the dispersion, SAXS is ideally suited as a volume method compared to the more localized electron microscopic techniques.
We were able to show in a previous publication that the dispersion of zirconia and silica nanoparticles can be greatly enhanced if ethylene glycol groups are attached to the surface [24]. In this earlier study we investigated the effect of this specific organic function and the size of the particles on mechanical properties of the resulting nanocomposites. In the current study we systematically investigated the impact of the variation of the surface modifications on the dispersion quality by a multi-method approach. A detailed SAXS analysis underpinned by selected TEM images allows assumptions on the dispersion quality of the nanomaterial. We selected two different model systems. On the one hand SiO2 nanoparticles were used because of their straightforward synthesis, their tunable size, and their widespread application as fillers in nanocomposites [18,20,21,22,37,40]. A second system were ZrO2 nanoparticles, due to their high optical density and their currently increasing interest in nanocomposite research and application [19,41,42,43]. An amine cured bisphenol-F-diglycidyl ether-based epoxy resin material, prepared via in situ curing was the matrix. As surface modifying agents, trialkoxysilanes are used for silica while phosphonic acid coupling agents are used for the zirconia surface modification [44]. Three different types of organic end groups of the coupling agent were selected, whereby the interaction with the matrix varied from strong (covalent) to moderate (e.g., hydrogen bonding via OH groups) to weak (ethylene glycol derivatives, polar interactions). Recent systematic studies on the dispersion quality of fillers in polymers using Monte Carlo simulations, TEM images, and SAXS intensities show the efficiency of this approach [45]. Our study provides further evidence that systematic tailoring of the surface chemistry of fillers in combination with SAXS studies is an excellent tool for estimating the interface-controlled dispersion behavior of fillers in polymers.

2. Materials and Methods

The methods and also various results described in this paper have been already published in the Ph.D. thesis of one of the co-authors [46]. The solvents (HPLC grade) and all other precursor compounds were purchased either from Sigma Aldrich (Munich, Germany) or abcr (Karlsruhe, Germany). Deionized water was used in all reactions. Purified methanol was obtained applying a PureSolv solvent purification system (Inert, Amesbury, MA, USA). All other chemicals were used without further purification.
Liquid state NMR spectra were recorded on a Avance 250 spectrometer (Bruker Corporation, Billerica, MA, USA) (1H at 250.13 MHz, 31P at 101.26 MHz, 13C at 62.80 MHz). 29Si NMR spectra were performed on a Avance DPX 300 instrument (Bruker Corporation, Billerica, MA, USA) at 59.63 MHz. Solid-state NMR spectra were recorded on a Avance DPX 300 spectrometer (Bruker Corporation, Billerica, MA, USA) equipped with a 4 mm broad band MAS probe head operating at 75.40 MHz for 13C, at 121.39 MHz for 31P and at 59.63 MHz for 29Si. 29Si as well as 13C NMR spectra were recorded with ramped CP/MAS (Cross Polarization and Magic angle spinning) and 31P NMR with HPDEC (high power decoupling) at a rotor frequency of 8 kHz.
Fourier transform infrared spectroscopy (FT-IR) measurements were performed on a Bruker Tensor 27 spectrometer under ambient air applying attenuated total reflectance (ATR) on a ZnSe crystal from 4500–400 cm−1 with a resolution of 4 cm−1 increment and 64 scans averaged. The software used for analysis was OPUS™ version 4.0 (Inert, Amesbury, MA, USA).
UV-VIS transmission measurements were performed on a Lambda 35 UV/Vis spectrometer (PerkinElmer Inc., Waltham, MA, USA) equipped with a 50 mm integrating sphere. The spectra were recorded from 200 to 700 nm with a data interval of 1 nm, a scan speed of 480 nm/min, a cycle time of 1 s and a slit with of 1 nm. The light source was changed at 326 nm.
Surface analysis was carried out via nitrogen sorption measurements on an ASAP 2020 instrument (Micromeritics Europe, Aachen, Germany) at 77 K. The prepared samples were degassed under vacuum at 60 °C for at least 8 h prior to measurement. The surface area was calculated according to Brunauer, Emmett, and Teller (BET) [47] assuming a demand of 0.162 nm2 per N2 molecule.
Thermogravimetric analyses (TGA) were performed on a Iris TG 209 C (Netzsch Holding, Selb, Germany) in a platinum crucible heated from room temperature to 900 °C with a heating rate of 10 °C/min under synthetic air. Grafting densities ρ (molecules/nm2) of the surface-attached molecules were calculated using the formula for non-microporous systems [48].
ρ = Δ m M R · 1 S B E T · N A · 10 18
where Δm is the mass loss from TGA between 200 °C and 800 °C (g/g). This is feasible, because the onset of the thermal desorption for all used coupling agents was higher than 250 °C, MR is the molecular mass of the organic moiety (g/mol), SBET is the calculated surface area of the bare metal oxide sample (m2/g) and NA is the Avogadro’s constant.
Differential scanning calorimetry (DSC) measurements were recorded on a DSC—Q2000 (TA Instruments, New Castle, DE, USA) in a 50 mL/min nitrogen gas flow with a heating rate of 3 °C/min. The glass transition temperature (Tg) was characterized as the mid-point of the change in specific heat cv during the thermal event from the DSC-cooling-curve.
Elemental analyses were carried out at the Microanalytical Laboratory at the University of Vienna.
Powder X-ray diffraction patterns were measured on a X’Pert Pro instrument (PANalytical, Almelo, The Netherlands) in a Bragg-Brentano geometry and an angle speed of 6°/min using at CuKα-radiation. The samples were prepared on Si single crystal wafers sample holder under ambient conditions.
Transmission electron microscopy (TEM) images were recorded on a JEM-100CX (JEOL GmbH, Freising, Germany) and on a TECNAI G20 transmission electron microscope (FEI, Hillsboro, OR, USA). The powder samples were attached to Formvar copper grids by dispersing them in ethanol using an ultrasound cleaning bath, adding one drop on the copper grid, and evaporating the solvent. Ultra-microtome cuts with a thickness of ca 100 nm were performed on an Ultra cut E (Leica Microsystems GmbH, Wetzlar, Germany) instrument at room temperature.
Dynamic light scattering (DLS) measurements were carried out at 25 °C using an ALV/CGS-3 Compact Goniometer System (ALV-GmbH, Langen, Germany) with an ALV/LSE-5003 correlator (ALV-GmbH, Langen, Germany) and multiple tau correlator (ALV-GmbH, Langen, Germany) at a wavelength of 632.8 nm (He-Ne Laser) at a 90° goniometer angle. The used solvents were purified before use with a syringe-filter (200 nm mesh). The particle radius was determined by the analysis of the correlation-function via the g2(t) method followed by a linearized mass-weighting (m.w.) of the distribution function.
Small angle X-ray-scattering (SAXS) analysis was performed under vacuum in transmission geometry using a rotating anode X-Ray generator with a pinhole camera and a 2D position sensitive detector (Vantec 2000) (all from Bruker AXS, Karlsruhe, Germany). Monochromized CuKα radiation was collimated from crossed Goebel mirrors (Bruker AXS, Karlsruhe, Germany). Measurements were carried out at two different distances (13 cm and 108 cm) to cover a wide q range. All SAXS patterns were radially averaged and corrected from background scattering to obtain the scattering intensities in dependence on the scattering vector q = 4π/λ sinθ, where 2θ is the scattering angle and λ = 154.2 pm the X-ray wavelength.
Nanoparticle separation was carried out in a EBA 20 S centrifuge (Andreas Hettich GmbH & Co.KG, Tuttlingen, Germany) (86 mm rotor radius).
Synthetic details for the preparation of the coupling-agents, the nanoparticles, the surface functionalization, and the preparation of the nanocomposites are given in the supplementary materials.
Small angle X-ray scattering (SAXS) analysis was used for investigation of the agglomeration behavior of the mixed monolayer end capped nanoparticle powders. The particle size was calculated from the SAXS profile applying the following formula for spherical particles with a Gaussian size distribution for the form factor, which can be analytically solved [30,49].
P ( q )   d R R 6 exp ( 1 2 ( R r ) 2 σ 2 ) ( 3 sin ( q R ) q R cos ( q R ) ( q R ) 3 )
In the hard-sphere model, a structure factor for weakly aggregated systems is delivered by the Percus–Yevick approximation [50], which describes the interference of the scattering of particles with two parameters, a hard-sphere radius RHS and a mean hard-sphere volume fraction η [32,51].
S ( q ) = 1 1 + 24 η G ( 2 q R H S ) / ( 2 q R H S )
with the function G(2qRHS) being defined by Kinning and Thomas [51]. The hard-sphere diameter 2 RHS gives information on the correlation distance of particles within a cluster or an aggregate and the hard-sphere volume fraction η on the probability to find particles in vicinity. Therefore, η describes the degree of agglomeration of the modified nanoparticles—the higher η, the stronger the agglomeration. Fitting was performed by the software Mathematica Version 11.0 (Wolfram Research, Champaign, IL, USA) [52].

3. Results

3.1. Nanoparticles

In this study we focused on the dispersion behavior of inorganic particles in an epoxy matrix depending on their morphology and the type of surface modification. Nanoparticle sizes were optimized for obtaining the best sizes for SAXS results. Hence, hydrothermally prepared ZrO2 (XRD: 100% Baddeleyite) nanoparticles with a 22 ± 7 nm spherical equivalent diameter (DLS) and two samples of SiO2 nanoparticles prepared via the Stöber process (X-ray amorphous SiO2), one with 9 ± 2 nm and another one showing a diameter of 72 ± 10 nm (DLS) were used. The particles in the lower nano-size range present ideal dimensions for SAXS-experiments. Larger SiO2 nanoparticles, which are close to the detection limit in a conventional laboratory SAXS equipment, were prepared for the reason of demonstration and comparison with smaller particle showing a stronger curved surface. Nevertheless, larger particles are of better visibility in TEM in the corresponding studies. Additionally, by applying the oxides of Zr and Si, the experimental applicability will be demonstrated for high (ZrO2/resin) and lower (SiO2/resin) scattering contrast. For the quality of such a study, it is essential to use particle model systems of very uniform size and shape. Previous studies on these types of particles confirm the formation of uniform ZrO2 nanocrystals and spherical SiO2 particles [49].

3.2. Chemical Tailoring of the Nanoparticle Surface with Coupling Agents

The described nanoparticle model systems were surface functionalized using various coupling agents. With this method we intended to introduce a specific organic function at the nanoparticle surface and to investigate its effect on the particle–polymer interface. For interface functionalization in epoxy nanocomposites, three different organic groups were attached to the inorganic particle surface with different anchor groups depending on the particle type. Transparent nanocomposites can only be achieved if the particles are small enough and the agglomeration of the particles is avoided by enhancing the particle–matrix interaction. In detail, we used the following functional organic groups:
(i) Diethylene glycol (DEG) groups that allow a good but quite weak chemical interaction of the modified particle surface with the organic matrix as DEG and matrix are both polar and (oligo)ethylene glycols are highly miscible with epoxy resins [53].
(ii) Epoxide end-groups which show excellent physical intermediating properties between inorganic-organic surfaces [54] and they can form covalent bonds with the polymer resin during the applied in situ curing approach [40], which may result in a higher dispersion quality.
(iii) Diol end-groups, which are a less reactive analogue to the used epoxide end-groups. These OH end-groups can also form covalent bonds to the epoxy resin during the curing process. Interactions via hydrogen bonds with the polar organic component are also possible [22], resulting in a mediate strong interacting group (strength in between DEG and epoxide).
(iv) For reasons of comparison, non-modified metal oxide nanoparticles, which can in principle also form interactions between surface OH groups and the resin [55].
For SiO2 nanoparticle surface modification, the organic functions were attached via a trimethoxysilane anchor group and the ZrO2 nanoparticles were modified using phosphonic acid coupling agents (Figure 1). The thus applied coupling agents are listed in Table 1. For practical synthetic reasons of the coupling agent molecule, instead of a glycydoxy-moiety phosphonic acid, a 3-epoxy coupling agent was used.
A strong covalent bond of the coupling agents to the surface of the nanoparticles was proven by IR and solid-state NMR spectroscopic methods. The spectra and a detailed discussion are presented in the supplementary materials.
As a significant quantity of surface modification is crucial in surface tailoring, grafting densities were calculated from TGA and BET applying Equation (1) where the mass loss of neat ZrO2 was negligible and the mass loss of neat larger SiO2 was 7.4% and 5.0% for the small SiO2 nanoparticles, respectively. Resulting from residual ethoxy groups from the particle synthesis and adsorbed water molecules. The calculated grafting densities are listed in Table 2. Generally, more uncertainty is expected for the values for the SiO2 particles as already the unmodified systems show relatively high mass losses.
The maximum reported grafting density for a monolayer is reported in literature for both, organosiloxane and phosphonic acid groups to be ~4–5 molecules/nm2 in the optimal case of a densely covered particle surface applying long alkyl chain agents which form self-assembled monolayer structures on the µm particle surfaces [56]. Our systems reveal lower grafting density, except the Ep-PPA@ZrO2 system (Table 2). We never observed such high coverage for our systems as real nanoparticle surfaces do not represent perfect surfaces and show defect sites, different quantities of reactive surface OH-groups and high curvature which leads to a practical grafting density lower than the theoretical value. One reason for this difference between the surface coverage values presented in this work and values found by Fadeev and Helmy [56] is the assumption of a demand of 0.135 nm2 per N2 during the nitrogen sorption experiments whereas we assume 0.162 nm2 our model according to the recommendation of IUPAC [57]. This results in a higher specific surface area and thus in lower grafting densities, by a factor of 0.83, in our work compared to the report of Fadeev. The curvature influence is visible by comparing the smaller SiO2 with the larger SiO2 nanoparticle fraction with the latter showing lower curvature and, in all cases, higher surface coverage values [58]. For the Ep-PPA covering the ZrO2 surface with 8.8 molecules/nm2 the presence of a partial bilayer or even multilayer is possible. At least it can be assumed that more molecules than possible surface anchoring sites are bound to the particle. This is possible keeping in mind the high reactivity of the Ep-PPA molecule and possible homo-linking reactions between the coupling agent molecules, as described in the literature for various reactive organic moieties [59].
However, we assume a significant qualitative and quantitative presence of surface molecules which is also supported by FT-IR data (see supplementary materials Figures S2 and S3). Taking into account that these quantitative values may also differ from the reality because of systematic errors, e.g., resulting from the assumed accessible surface of the powder or by assuming a specific Si-C cleaving or P-C- bond cleaving mechanism during the decomposition in the TGA-instrument, etc. [58].

3.3. Preparation of Epoxy Resin Nanocomposites

The preparation of the nanocomposites was carried out via an in-situ curing approach in which the nanoparticles (3%, 5% and 10%) were dispersed in the molten monomer bisphenol-F-diglycidyl ether to yield better elastic properties compared to bisphenol-A based formulations applying only little shear force by magnetic stirring at 250 rpm for homogenization. After the addition of the hardener, the aliphatic amine diethylene triamine, which initiates the curing by nucleophilic attack of the amine group at the epoxy ring of the monomer, the system was cured at 120 °C on a metal plate. Throughout the curing process, several reactions between the nanoparticle surface and the reaction mixture are possible, depending on the surface-functionalization, which all can influence the dispersion structure in the cured nanocomposite: (i) reactions between hydroxy-groups located at the nanoparticle surfaces with epoxides of the resin mixture, (ii) epoxide groups from the nanoparticle surface are attacked by the hardener molecules to form covalent bonds between the nanoparticles and the matrix, (iii) strong polar interaction between particle and resin (DEG), and (iv) hydrogen-bond formation (OH) (Figure 2).
The described procedure resulted in 1.4 mm thick nanocomposite samples. Depending on the surface-properties of the nanoparticles the samples varied in their transparency. Samples containing unmodified nanoparticles appeared translucent and specific combinations of surface functionalization and nanoparticle compositions appeared transparent, for example DEG-PPA@ZrO2 or Gly-TMeOs@SiO2 (Figure 3). Other modifications resulted in materials with a visual appearance ranging from transparent to opaque. This already indicates that the application of a suitable nanoparticle surface modification leads to a higher dispersion quality in these materials. This conclusion can be drawn according to Rayleigh’s law. Two decisive parameters are mainly responsible for the optical transmittance, the particle radius, which decreases dramatically with an increase in transmittance (by the 3rd power) and the refractive index difference between matrix and particle, whereby according to Rayleigh the transmittance is 100% for the same refractive indices (index matching). Calculations based on this equation show that nanoparticles <100 nm should lead to transparent materials if the particles are well dispersed, while the presence of larger particle agglomerates would lead to non-transparent materials [15]. UV/VIS spectroscopical measurements at the 1.4 mm thick plates from Figure 3, confirm the macroscopic observed improvements in transparency using appropriate surface modifications (see supplementary materials Figure S1). Thereby, the average transmittance (%T) in the visible range (400–700 nm) is 91.6% for the pristine matrix. The incorporation of 5 wt% of unmodified ZrO2 lowered the transmittance to 52%. A maximum improvement to 84% of a filled sample was achieved by DEG-PPA modification of the particles. For 5% larger SiO2 unmodified particles %T was 69% and 70% for the Gly- modified ones. This slight difference can be explained by the already very good matching of refractive index in the case of the SiO2/epoxy material compared to the ZrO2/epoxy material. However, in the particle containing samples, generally slightly lower transmittances were recorded because of stronger embrowning of the materials and more bubble inclusion.
For a better insight in the dispersion structure representative TEM images of ultramicrotome thin slices (100 to 300 nm thickness) of the nanocomposite materials containing 5 wt% nanoparticles with different surface modifications were recorded (Figure 4 and Figure 5). The presented TEM micrographs show ZrO2/epoxy and SiO2/epoxy resin nanocomposites with epoxy-, diol-, and diethylene glycol interface tailoring as well as without surface modification. The TEM images reveal in case of the unmodified ZrO2 as well as the SiO2 particles agglomeration of the fillers in the matrix. Unmodified particles often only show a good dispersion in a solvent that allows a strong interaction with the surface, such as OH-groups with protic solvents. In other cases, the interparticle interaction is larger than the one with the matrix. Because in our samples the unmodified particles were mixed with the not very polar bisphenol-F-diglycidyl ether the interparticle interaction is quite large and therefore in both cases ZrO2 and SiO2 particles prefer an agglomeration (Figure 4a and Figure 5a). DEG-PPA modification of both particle types leads to a better dispersion, which seems to be more effectively in case of the ZrO2 than the SiO2 particles (see also numerical values from SAXS fits in Table 3). The largest difference between the two particles types from the TEM images is their behavior when diol and glycidyl-modified particles are used. While in the case of ZrO2 particles the diol groups lead to a moderate agglomeration with small clusters (Figure 4c), there is strong agglomeration behavior for the glycidyl modified particles (Figure 4d), most likely because of interparticle hydrogen bonding. The epoxy-modified systems show strong agglomeration behavior, which seems not to be disturbed by the resin formation. In case of the spherical SiO2 particles, the trend is vice versa, as the diol modified particles at 5 wt% loading still show some a weak tendency to agglomeration while the glycidyl particles are well dispersed.
Regarding the thermomechanical properties of these materials, the glass transition temperature (DSC and DMA) of all prepared materials was located between 110 °C and 90 °C, the lowest values were observed in samples containing silica. The thermal decomposition temperature was 353 ± 7 °C (onset, TGA, see supplementary materials Table S3) for all samples. From these data we concluded that the matrix properties were not significantly affected by the particle incorporation. The mechanical properties of the prepared materials were also investigated. Properties such as Vickers hardness or tensile strength were significantly improved for DEG-modified silica and zirconia in epoxy resins (see supplementary materials Table S2) [24]. For example, Vickers hardness has been gradually improved by the incorporation of larger nanoparticles, by about 45% for both SiO2 and ZrO2 at 10% filler content. Interestingly, with a strong particle matrix compound modification (epoxy), the indentation hardness could be more improved for smaller nanoparticles at the same filler content. This is what one would expect as they introduce a higher interface area. Interfacial adhesion is assumed to play a major role in this process. For all other materials there was a slight increase in Vickers hardness with increasing inorganic filler content. For example, for every filler concentration, the Vickers hardness could be increased from 0.16 GPa (neat matrix) by 20% for every type of incorporated particle, modified with diol-end groups (see supplementary materials, Table S1). Generally, we observed better thermo-mechanical properties for better dispersed systems (see supplementary materials Tables S2 and S3).

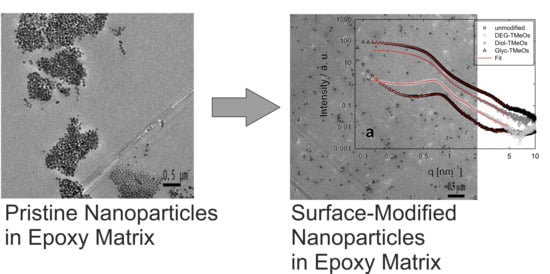
3.4. Structural Investigations Using Small Angle X-ray-Scattering (SAXS)

Nanocomposites, containing 3, 5 and 10 wt% of differently surface functionalized nanoparticles were investigated via SAXS. Exemplarily the scattering curves with the corresponding fit curves for 5 wt% filler content are shown in Figure 6.
The hard sphere volume fraction η, which is an indicator for the strength of agglomeration of the particles in the matrix, was calculated from the scattering data (Table 3).

4. Discussion

The obtained results from SAXS correspond to the observations in TEM micrographs for all samples within one series of nanoparticle type. For higher observed agglomeration tendency in TEM (Figure 4 and Figure 5), larger numbers for η have been obtained by SAXS (Table 3). This is for example clearly visible for high agglomeration in Figure 4d compared to Figure 4b with η being 0.09 and 0.001, respectively, or high agglomeration in Figure 5d compared to Figure 5a, with η being 0.223 and 0.121. When comparing SiO2 and ZrO2 filled materials it must be kept in mind that the same filler wt% corresponds to different volume fractions because of the density differences of ZrO2 and SiO2.
For the ZrO2 nanocomposites the DEG surface modification led to the best dispersion quality whereas the unmodified nanoparticles were slightly more agglomerated, which corresponds also to the observed optical transparencies in the photographs of the materials (Figure 3). The diol-modification led to a formation of sub-micron size particle agglomerates and finally the epoxy end groups result in the largest aggregates. The SiO2 nanocomposites do not follow the observations for ZrO2. Here, the best results in homogeneity could be observed for the epoxide end group modification followed by the diol- modification. The degree of agglomeration was higher for the DEG modification and the highest for the unmodified systems.
A possible reason for the high agglomeration in case of the epoxy modified ZrO2 nanoparticles is the presence of a strong interparticle interaction via co-linkage of surface epoxy group. This is very likely, even though the modification would chemically fit well to the matrix. For SiO2 nanoparticles the opposite was the case. This different behavior can result from the fact that between the ZrO2 nanoparticles, as they are crystal shaped, a strong interaction between two facets can occur. The possibility of irreversible interparticle co-condensation can increase for the higher plane contact areas than for the spherical SiO2 particles which theoretically only can contact each other at one point. Furthermore, a very homogeneous dispersion is observed as expected from the compatibility of epoxide groups with the resin matrix. The presence of OH-groups at the particle surface, from the diol group from coupling agent as well as from the bare oxide surface seems to allow a mediated interaction with the polymer, except in the case of SiO2. Thereby, it is very plausible that, at the synthetic conditions of amine-milieu at 120 °C, a highly favored interparticle silanol condensation (which is analogously not expected for ZrO2) inhibits the formation of a homogeneous dispersion. Even though the silanol groups show a good interaction with the epoxy resin matrices which has been reported in a previous study [55,60]. This is another reason for the necessity of chemical surface tailoring of nanoparticles. SEM investigations carried out by Kang et al. support this observation: Unmodified Stöber particles, when incorporated into an epoxy resin, showed huge agglomeration compared to epoxide or amine modified nanoparticles [38], which react immediately with the surrounding polymer environment to give separated particles.
Finally, the introduction of a DEG residue, which interacts with the epoxy resin, highly promoted the dispersing of the ZrO2 powder, homogeneously, in the epoxy material, but was less successful in the case of silica. Presumably the dispersibility enhancement effect was not able to overcompensate a possible interparticle-co-condensation which can occur by residual surface silanol groups. We assume that the silica particles applied in this study stick to the rule, due to their spherical shape: Stronger possible interactions between particle and matrix, excluding silanol condensation reactions, result in a more homogeneous final material (covalent > H-bridges > polar-polar). Contrary in ZrO2 nanocrystals the interparticle interaction is predominant to the particle–matrix interaction if strong interacting groups are applied.
SAXS results are based on a probe volume in the mm3 range and can be considered more representative for the bulk material than TEM results with probe volumes in the nm3 range. Silica samples reveal a higher hard-sphere volume fraction than zirconia nanoparticles, which can be based on a higher agglomeration tendency of silica compared to zirconia confirming the assumptions from TEM (even when the density difference of ZrO2/SiO2 is kept in mind when discussing the same wt% fractions). An additional argument for the agglomeration of SiO2 nanoparticles might be their perfect spherical shape which eases dense sphere packing. This seems to be a common phenomenon for uniform spherical silica particles, also when they are organically modified [61]. Nanoparticles generally minimize their surface energy via agglomeration. In the case of the SiO2 samples, this effect seems to be higher and enthalpy can thereby play an important role, which is commonly a crucial parameter for the dispersion of nanoparticles in polymer [62]. Therefore, η values for small SiO2 nanoparticles are commonly higher compared to the larger SiO2 nanoparticles.

4.1. ZrO2 Nanocrystals

The η values from SAXS representing the particle agglomeration from Table 3, they are plotted in the Figure 7, Figure 8 and Figure 9 to ease the discussions on agglomeration trends for each nanoparticle type series. For the ZrO2 nanoparticles (Figure 7) the agglomeration tendency obtained by SAXS is the same as from TEM. DEG-PPA modified particles give the best dispersion quality with η values close to zero which represents single dispersed particles (at 3 wt% and 5 wt%). Interestingly, for one type of modification the agglomeration can vary with increasing filler degree to lower or higher values, in some cases, significantly. This depends on the interaction of two different opposing phenomena. On the one hand, a higher filler content increases the viscosity, which increases the shear force at the same stirring speed and thus breaks up agglomerates. On the other hand, in thick suspensions the possibility that two particles can interact more easily is higher and agglomerates can be formed if the interaction between the particles dominates over the particle–matrix interaction. A literature study on the shear-thickening effect of silica nanoparticles in PEO points to the complex viscosity change behavior with suspension concentration: It was observed that viscosity increases dramatically at filler levels above 7%, depending on nanoparticle size and polymer radius of gyration [60]. Therefore, in certain cases, dispersion minima or maxima can be observed in the agglomeration curves, depending on which of these two effects is predominant and how strong the matrix-particle interaction is compared to the particle–particle interaction.

4.2. Spherical SiO2 Nanoparticles

The agglomeration trend for the small SiO2 nanoparticles also follows this assumption. Gly- and Diol modification also allows strong particle–particle interaction in an irreversible way (Gly). η first decreases when the reaction mixture is more concentrated but then increases again. An optimum filler content for homogeneous nanocomposites seems to be below 10 wt%.
If we compare the agglomeration trends for the small SiO2 (Figure 8) with the trends for the large SiO2 nanoparticle system (Figure 9), we can deduce that the nanoparticle size also plays a decisive role in the search for the optimal surface modification to achieve maximum homogeneity. For example, the Diol modification gives good homogeneities in case of the smaller particles, whereas more inhomogeneous materials are obtained for the larger particles which can be related to particle curvature effects (as discussed for ZrO2). A flatter structure allows more particle–particle interaction and thus results in stronger agglomeration. This behavior can also be observed for the strong interacting Gly-group for lower filler degrees whereas for higher filler degrees the viscosity shear force effect, which we expect to be stronger pronounced for the larger particles, plays a role and the agglomeration decreases. This behavior also indicates that the matrix–particle interaction dominates the particle–particle interaction during the curing process. The trend for η within one modification for different filler percentages is also different. This is assumed to originate from the fact that different sized particles result in different viscosities of the suspensions, changing the overall agglomeration behavior, namely the relation between particle size and polymer domain size is important [60]. However, the obtained data are the result of a complex interplay of the various described phenomena.

5. Conclusions

We investigated the agglomeration behavior of SiO2 nanoparticles in a lower (6–10 nm) and upper (60–70 nm) nano-size range, and of ZrO2 nanoparticles with an equivalent spherical diameter of 22 nm in epoxy resin matrices with and without surface modifications. Both unmodified nanoparticles and particles with surface-bound diethylene glycol, 1,2-diol groups, and epoxy groups were used to investigate the effect of different interaction strengths of the particle surface with the surrounding matrix in the epoxy resin curing process. The applied surface functions lead to interfacial interactions ranging from weak hydrogen bonds to strong covalent bonds. TEM and SAXS data show that the dispersion quality is given by the interplay of several effects in this complex system. Epoxy groups on the surface of the fillers allow a covalent interaction with the matrix, resulting in a good and stable dispersion of the particles after polymerization. However, this surface modification can also lead to non-reversible agglomeration through particle–particle crosslinking. Therefore, it is important to control the matrix-particle interaction in such a way that the interaction is stronger than the interaction between the particles. In addition to the organic function on the surface, the type and shape of the nanoparticles is also important for their dispersion behavior. Flat crystalline facets, as in the case of ZrO2, improve the overall inter-particle interaction due to the high contact area compared to the interaction between spherical particles as in the case of SiO2. This can lead to the effect that poorer matrix-interacting modifications such as DEG in ZrO2 result in optimal homogeneity of the particles in the matrix because the particle–matrix interaction prevails, while more strongly interacting components lead to increased particle agglomeration because the particle–particle interaction dominates. In addition, suspension concentration effects can occur which, with increasing viscosity and thus increasing shear forces at the same stirring speed, can reduce agglomeration, but also increase the probability that two particles will come together and agglomerate. Taking all these effects into account, functional organosilanes or organophosphonic acids must be chemically tailored and the shear forces should be optimized for good filler dispersion. SAXS measurements and data analysis using the model presented here allow to find the optimal surface modification for best homogeneity when testing nanocomposite systems. It is a well-suited complementary method, particularly in cases in which TEM ultramicrotome-cuts are more difficult to obtain or where the microtome cut leads to changes in the material, e.g., in nanocomposites with quite soft polymer matrices.

Supplementary Materials

The following are available online at https://www.mdpi.com/2571-9637/3/4/44/s1, Synthetic details for the preparation of the coupling-agents, the nanoparticles, the surface-functionalization and the preparation of the nanocomposites, Figure S1: UV/VIS Spectra of 1.4 mm thick epoxy resin plates containing different nanoparticles, Figure S2: FT-IR spectra of phosphonic acids in pure state and after grafting onto ZrO2, Figure S3: FT-IR spectra of neat and organically surface modified 7.8 nm diameter SiO2 nanoparticles, Table S1: Vickers hardness values (GPa) for epoxy resin nanocomposites with diol-end group organically modified silica and zirconia nanoparticles, Table S2: Glass transition temperatures of the epoxy resin nanocomposites from DSC for epoxy resin nanocomposites with diol-end group organically modified silica and zirconia nanoparticles, Table S3: Thermal decomposition onset temperatures of the epoxy resin nanocomposites from TGA for epoxy resin nanocomposites with diol-end group organically modified silica and zirconia nanoparticles.

Author Contributions

Conceptualization, G.K.; methodology, H.P., and S.P.; validation, G.K., H.P., and T.K.; investigation, B.F., S.P., J.S., and M.S.; resources, G.K., H.P., and T.K.; writing—original draft preparation, B.F., S.P., J.S., and M.S.; writing—review and editing, G.K., H.P., and T.K.; supervision, G.K., H.P., and T.K.; project administration, G.K.; funding acquisition, G.K. All authors have read and agreed to the published version of the manuscript.

Funding

This research was funded by the Austrian Science Fund (FWF, Project Nr. P20693).

Conflicts of Interest

The authors declare no conflict of interest.

References

  1. Jin, F.L.; Li, X.; Park, S.J. Synthesis and application of epoxy resins: A review. J. Ind. Eng. Chem. 2015, 29, 1–11. [Google Scholar] [CrossRef]
  2. Atif, R.; Shyha, I.; Inam, F. Mechanical, thermal, and electrical properties of graphene-epoxy nanocomposites-a review. Polymers 2016, 8, 281. [Google Scholar] [CrossRef] [PubMed]
  3. Gu, H.; Ma, C.; Gu, J.; Guo, J.; Yan, X.; Huang, J.; Zhang, Q.; Guo, Z. An overview of multifunctional epoxy nanocomposites. J. Mater. Chem. C 2016, 4, 5890–5906. [Google Scholar] [CrossRef]
  4. Irzhak, T.F.; Irzhak, V.I. Epoxy Nanocomposites. Polym. Sci. Ser. A 2017, 59, 791–825. [Google Scholar] [CrossRef]
  5. Li, Y.; Huang, X.; Zeng, L.; Li, R.; Tian, H.; Fu, X.; Wang, Y.; Zhong, W.-H. A review of the electrical and mechanical properties of carbon nanofiller-reinforced polymer composites. J. Mater. Sci. 2019, 54, 1036–1076. [Google Scholar] [CrossRef]
  6. Crosby, A.J.; Lee, J.Y. Polymer nanocomposites: The “nano” effect on mechanical properties. Polym. Rev. 2007, 47, 217–229. [Google Scholar] [CrossRef]
  7. Sprenger, S. Epoxy resin composites with surface-modified silicon dioxide nanoparticles: A review. J. Appl. Polym. Sci. 2013, 130, 1421–1428. [Google Scholar] [CrossRef]
  8. Chrusciel, J.J.; Lesniak, E. Modification of epoxy resins with functional silanes, polysiloxanes, silsesquioxanes, silica and silicates. Prog. Polym. Sci. 2015, 41, 67–121. [Google Scholar] [CrossRef]
  9. Pinto, D.; Bernardo, L.; Amaro, A.; Lopes, S. Mechanical properties of epoxy nanocomposites using alumina as reinforcement—A review. J. Nano Res. 2015, 30, 9–38. [Google Scholar] [CrossRef]
  10. Singh, N.P.; Gupta, V.K.; Singh, A.P. Graphene and carbon nanotube reinforced epoxy nanocomposites: A review. Polymer 2019, 180, 121724. [Google Scholar] [CrossRef]
  11. Zaman, I.; Manshoor, B.; Khalid, A.; Araby, S. From clay to graphene for polymer nanocomposites—A survey. J. Polym. Res. 2014, 21, 429. [Google Scholar] [CrossRef] [Green Version]
  12. Zhao, S.; Zhang, H.-B.; Luo, J.-Q.; Wang, Q.-W.; Xu, B.; Hong, S.; Yu, Z.-Z. Highly Electrically Conductive Three-Dimensional Ti3C2Tx MXene/Reduced Graphene Oxide Hybrid Aerogels with Excellent Electromagnetic Interference Shielding Performances. ACS Nano 2018, 12, 11193–11202. [Google Scholar] [CrossRef] [PubMed]
  13. Sliozberg, Y.; Andzelm, J.; Hatter, C.B.; Anasori, B.; Gogotsi, Y.; Hall, A. Interface binding and mechanical properties of MXene-epoxy nanocomposites. Compos. Sci. Technol. 2020, 192, 108124. [Google Scholar] [CrossRef]
  14. Hatter, C.B.; Shah, J.; Anasori, B.; Gogotsi, Y. Micromechanical response of two-dimensional transition metal carbonitride (MXene) reinforced epoxy composites. Compos. Part B Eng. 2020, 182, 107603. [Google Scholar] [CrossRef]
  15. Althues, H.; Henle, J.; Kaskel, S. Functional inorganic nanofillers for transparent polymers. Chem. Soc. Rev. 2007, 36, 1454–1465. [Google Scholar] [CrossRef] [PubMed]
  16. Kinloch, A.J.; Mohammed, R.D.; Taylor, A.C.; Eger, C.; Sprenger, S.; Egan, D. The effect of silica nano particles and rubber particles on the toughness of multiphase thermosetting epoxy polymers. J. Mater. Sci. 2005, 40, 5083–5086. [Google Scholar] [CrossRef] [Green Version]
  17. Liu, W.P.; Hoa, S.V.; Pugh, M. Fracture toughness and water uptake of high-performance epoxy/nanoclay nanocomposites. Compos. Sci. Technol. 2005, 65, 2364–2373. [Google Scholar] [CrossRef]
  18. Zhao, R.G.; Luo, W.B. Fracture surface analysis on nano-SiO2/epoxy composite. Mater. Sci. Eng. A 2008, 483, 313–315. [Google Scholar] [CrossRef]
  19. Medina, R.; Haupert, F.; Schlarb, A.K. Improvement of tensile properties and toughness of an epoxy resin by nanozirconium-dioxide reinforcement. J. Mater. Sci. 2008, 43, 3245–3252. [Google Scholar] [CrossRef]
  20. Li, H.; Zhang, Z.; Ma, X.; Hu, M.; Wang, X.; Fan, P. Synthesis and characterization of epoxy resin modified with nano-SiO2 and γ-glycidoxypropyltrimethoxy silane. Surf. Coat. Technol. 2007, 201, 5269–5272. [Google Scholar] [CrossRef]
  21. Chen, C.; Morgan, A.B. Mild processing and characterization of silica epoxy hybrid nanocomposite. Polymer 2009, 50, 6265–6273. [Google Scholar] [CrossRef]
  22. Chiu, Y.C.; Riang, L.; Chou, I.C.; Ma, C.C.M.; Chiang, C.L.; Yang, C.C. The Poss Side Chain Epoxy Nanocomposite: Synthesis and Thermal Properties. J. Polym. Sci. Part B Polym. Phys. 2010, 48, 643–652. [Google Scholar] [CrossRef]
  23. Sun, Y.Y.; Zhang, Z.Q.; Moon, K.S.; Wong, C.P. Glass transition and relaxation behavior of epoxy nanocomposites. J. Polym. Sci. Part B Polym. Phys. 2004, 42, 3849–3858. [Google Scholar] [CrossRef]
  24. Sajjad, M.; Feichtenschlager, B.; Pabisch, S.; Svehla, J.; Koch, T.; Seidler, S.; Peterlik, H.; Kickelbick, G. Study of the effect of the concentration, size and surface chemistry of zirconia and silica nanoparticle fillers within an epoxy resin on the bulk properties of the resulting nanocomposites. Polym. Int. 2012, 61, 274–285. [Google Scholar] [CrossRef]
  25. Jouault, N.; Dalmas, F.; Said, S.; Di Cola, E.; Schweins, R.; Jestin, J.; Boue, F. Direct Measurement of Polymer Chain Conformation in Well-Controlled Model Nanocomposites by Combining SANS and SAXS. Macromolecules 2010, 43, 9881–9891. [Google Scholar] [CrossRef]
  26. Jouault, N.; Vallat, P.; Dalmas, F.; Said, S.; Jestin, J.; Boue, F. Well-Dispersed Fractal Aggregates as Filler in Polymer-Silica Nanocomposites: Long-Range Effects in Rheology. Macromolecules 2009, 42, 2031–2040. [Google Scholar] [CrossRef] [Green Version]
  27. Kim, S.Y.; Hall, L.M.; Schweizer, K.S.; Zukoski, C.F. Long Wavelength Concentration Fluctuations and Cage Scale Ordering of Nanoparticles in Concentrated Polymer Solutions. Macromolecules 2010, 43, 10123–10131. [Google Scholar] [CrossRef]
  28. Strachota, A.; Ribot, F.; Matejka, L.; Whelan, P.; Starovoytova, L.; Plestil, J.; Steinhart, M.; Slouf, M.; Hromadkova, J.; Kovarova, J.; et al. Preparation of Novel, Nanocomposite Stannoxane-Based Organic-Inorganic Epoxy Polymers containing Ionic bonds. Macromolecules 2012, 45, 221–237. [Google Scholar] [CrossRef]
  29. Chevigny, C.; Dalmas, F.; Di Cola, E.; Gigmes, D.; Bertin, D.; Boue, F.; Jestin, J. Polymer-Grafted-Nanoparticles Nanocomposites: Dispersion, Grafted Chain Conformation, and Rheological Behavior. Macromolecules 2011, 44, 122–133. [Google Scholar] [CrossRef]
  30. Peterlik, H.; Fratzl, P. Small-angle X-ray scattering to characterize nanostructures in inorganic and hybrid materials chemistry. Monatsh. Chem. 2006, 137, 529–543. [Google Scholar] [CrossRef]
  31. Beaucage, G.; Kammler, H.K.; Pratsinis, S.E. Particle size distributions from small-angle scattering using global scattering functions. J. Appl. Crystallogr. 2004, 37, 523–535. [Google Scholar] [CrossRef]
  32. Pedersen, J.S. Analysis of small-angle scattering data from colloids and polymer solutions: Modeling and least-squares fitting. Adv. Colloid Interface Sci. 1997, 70, 171–210. [Google Scholar] [CrossRef]
  33. Takenaka, M. Analysis of structures of rubber-filler systems with combined scattering methods. Polym. J. 2013, 45, 10–19. [Google Scholar] [CrossRef] [Green Version]
  34. Silva, A.A.; Dahmouche, K.; Soares, B.G. Nanostructure and dynamic mechanical properties of silane-functionalized montmorillonite/epoxy nanocomposites. Appl. Clay Sci. 2011, 54, 151–158. [Google Scholar] [CrossRef]
  35. Baeza, G.P.; Genix, A.-C.; Paupy-Peyronnet, N.; Degrandcourt, C.; Couty, M.; Oberdisse, J. Revealing nanocomposite filler structures by swelling and small-angle X-ray scattering. Faraday Discuss. 2016, 186, 295–309. [Google Scholar] [CrossRef]
  36. Yan, N.; Buonocore, G.; Lavorgna, M.; Kaciulis, S.; Balijepalli, S.K.; Zhan, Y.; Xia, H.; Ambrosio, L. The role of reduced graphene oxide on chemical, mechanical and barrier properties of natural rubber composites. Compos. Sci. Technol. 2014, 102, 74–81. [Google Scholar] [CrossRef]
  37. Zheng, Y.; Chonung, K.; Wang, G.L.; Wei, P.; Jiang, P.K. Epoxy/Nano-Silica Composites: Curing Kinetics, Glass Transition Temperatures, Dielectric, and Thermal-Mechanical Performances. J. Appl. Polym. Sci. 2009, 111, 917–927. [Google Scholar] [CrossRef]
  38. Kang, S.; Hong, S.I.; Choe, C.R.; Park, M.; Rim, S.; Kim, J. Preparation and characterization of epoxy composites filled with functionalized nanosilica particles obtained via sol-gel process. Polymer 2001, 42, 879–887. [Google Scholar] [CrossRef]
  39. Becker, O.; Simon, G.P.; Dusek, K. Epoxy Layered Silicate Nanocomposites. In Inorganic Polymeric Nanocomposites and Membranes; Guida-Pietrasanta, F., Boutevin, B., Nuyken, O., Becker, O., Simon, G.P., Dusek, K., Rusanov, A.L., Likhatchev, D., Kostoglodov, P.V., Müllen, K., et al., Eds.; Springer: Berlin/Heidelberg, Germany, 2005; pp. 29–82. [Google Scholar]
  40. Mascia, L.; Prezzi, L.; Haworth, B. Substantiating the role of phase bicontinuity and interfacial bonding in epoxy-silica nanocomposites. J. Mater. Sci. 2006, 41, 1145–1155. [Google Scholar] [CrossRef]
  41. Ikemura, K.; Endo, T. A review of our development of dental adhesives—Effects of radical polymerization initiators and adhesive monomers on adhesion. Dent. Mater. J. 2010, 29, 109–121. [Google Scholar] [CrossRef] [Green Version]
  42. Imai, Y.; Terahara, A.; Hakuta, Y.; Matsui, K.; Hayashi, H.; Ueno, N. Transparent poly(bisphenol A carbonate)-based nanocomposites with high refractive index nanoparticles. Eur. Polym. J. 2009, 45, 630–638. [Google Scholar] [CrossRef]
  43. Ochi, M.; Nii, D.; Suzuki, Y.; Harada, M. Thermal and optical properties of epoxy/zirconia hybrid materials synthesized via in situ polymerization. J. Mater. Sci. 2010, 45, 2655–2661. [Google Scholar] [CrossRef] [Green Version]
  44. Mutin, P.H.; Lafond, V.; Popa, A.F.; Granier, M.; Markey, L.; Dereux, A. Selective Surface Modification of SiO2-TiO2 Supports with Phosphonic Acids. Chem. Mater. 2004, 16, 5670–5675. [Google Scholar] [CrossRef]
  45. Gundlach, N.; Hentschke, R. Modelling Filler Dispersion in Elastomers: Relating Filler Morphology to Interface Free Energies via SAXS and TEM Simulation Studies. Polymers 2018, 10, 446. [Google Scholar] [CrossRef] [PubMed] [Green Version]
  46. Pabisch, S. Increased Structural Order in Nanocomposites. Ph.D. Thesis, University of Vienna, Vienna, Austria, 2012. [Google Scholar]
  47. Brunauer, S.; Emmett, P.H.; Teller, E. Adsorption of gases in multimolecular layers. J. Am. Chem. Soc. 1938, 60, 309–319. [Google Scholar] [CrossRef]
  48. Fadeev, A.Y.; Helmy, R.; Marcinko, S. Self-Assembled Monolayers of Organosilicon Hydrides Supported on Titanium, Zirconium, and Hafnium Dioxides. Langmuir 2002, 18, 7521–7529. [Google Scholar] [CrossRef]
  49. Pabisch, S.; Feichtenschlager, B.; Kickelbick, G.; Peterlik, H. Effect of interparticle interactions on size determination of zirconia and silica based systems—A comparison of SAXS, DLS, BET, XRD and TEM. Chem. Phys. Lett. 2012, 521, 91–97. [Google Scholar] [CrossRef] [Green Version]
  50. Percus, J.K.; Yevick, G.J. Analysis of classical statistical mechanics by means of collective co.ovrddot.ordinates. Phys. Rev. 1958, 110, 1–13. [Google Scholar] [CrossRef]
  51. Kinning, D.J.; Thomas, E.L. Hard-sphere interactions between spherical domains in diblock copolymers. Macromolecules 1984, 17, 1712–1718. [Google Scholar] [CrossRef]
  52. Wolfram Research, Inc. Mathematica; Wolfram Research, Inc.: Champaign, IL, USA, 2016. [Google Scholar]
  53. Kalogeras, I.M.; Vassilikou-Dova, A.; Christakis, I.; Pietkiewicz, D.; Brostow, W. Thermophysical properties and molecular relaxations in cured epoxy resin + PEO blends: Observations on factors controlling miscibility. Macromol. Chem. Phys. 2006, 207, 879–892. [Google Scholar] [CrossRef]
  54. Lee, L.-H. Wettability and conformation of reactive polysiloxanes. J. Colloid Interface Sci. 1968, 27, 751–760. [Google Scholar] [CrossRef]
  55. Kickelbick, G. The search of a homogeneously dispersed material-the art of handling the organic polymer/metal oxide interface. J. Sol-Gel Sci. Technol. 2008, 46, 281–290. [Google Scholar] [CrossRef]
  56. Helmy, R.; Fadeev, A.Y. Self-Assembled Monolayers Supported on TiO2: Comparison of C18H37SiX3 (X = H, Cl, OCH3), C18H37Si(CH3)2Cl, and C18H37PO(OH)2. Langmuir 2002, 18, 8924–8928. [Google Scholar] [CrossRef]
  57. Sing, K.S.W.; Everett, D.H.; Haul, R.A.W.; Moscou, L.; Pierotti, R.A.; Rouquerol, J.; Siemieniewska, T. Reporting physisorption data for gas/solid systems with special reference to the determination of surface area and porosity (Recommendations 1984). Pure Appl. Chem. 1985, 57, 603–619. [Google Scholar] [CrossRef]
  58. Feichtenschlager, B.; Lomoschitz, C.J.; Kickelbick, G. Tuning the Self-Assembled Monolayer Formation on Nanoparticle Surfaces showing different Curvature: Comparison of Spherical Silica Particles with Plane-Crystal-Shaped Zirconia Particles. J. Colloid Interface Sci. 2011, 360, 15–25. [Google Scholar] [CrossRef] [Green Version]
  59. Riegel, B.; Kiefer, W.; Hofacker, S.; Schottner, G. FT-Raman Spectroscopic Investigations on the Organic Crosslinking in Hybrid Polymers. Part II: Reactions of Epoxy Silanes. J. Sol-Gel Sci. Technol. 2002, 24, 139–145. [Google Scholar] [CrossRef]
  60. Kamibayashi, M.; Ogura, H.; Otsubo, Y. Shear-thickening flow of nanoparticle suspensions flocculated by polymer bridging. J. Colloid Interface Sci. 2008, 321, 294–301. [Google Scholar] [CrossRef]
  61. Szekeres, M.; Kamalin, O.; Schoonheydt, R.A.; Wostyn, K.; Clays, K.; Persoons, A.; Dekany, I. Ordering and optical properties of monolayers and multilayers of silica spheres deposited by the Langmuir-Blodgett method. J. Mater. Chem. 2002, 12, 3268–3274. [Google Scholar] [CrossRef]
  62. Mackay, M.E.; Tuteja, A.; Duxbury, P.M.; Hawker, C.J.; Van Horn, B.; Guan, Z.; Chen, G.; Krishnan, R.S. General strategies for nanoparticle dispersion. Science 2006, 311, 1740–1743. [Google Scholar] [CrossRef]
Figure 1. Surface-functionalization of the ZrO2 and SiO2 nanoparticles. For details see supplementary materials.
Surfaces 03 00044 g001
Figure 2. Potential interactions between surface-functionalized nanoparticles and epoxy resin in nanocomposites: (a) reactions between hydroxy-groups located at the nanoparticle surfaces with epoxides of the resin mixture, (b) epoxide groups from the nanoparticle surface are attacked by the hardener molecules, (c) hydrogen-bond formation between epoxy resin and ethylene oxide moieties on particle surface.
Surfaces 03 00044 g002
Figure 3. Pictures of nanocomposite plates containing (each 5 wt%) unmodified larger silica and zirconia nanoparticles (a) blank epoxy resin, (b) unmodified ZrO2, (c) DEG-PPA@ZrO2, (d) larger SiO2 unmodified, (e) larger Gly-TMeOs@SiO2. Images (ac) were reproduced with permission of John Wiley & Sons Ltd. (Hoboken, NJ, USA) from a previous publication for reasons of comparison [24].
Surfaces 03 00044 g003
Figure 4. Representative TEM-images of ultramicrotome-cuts (100–300 nm thickness) of 5 wt% ZrO2 nanoparticle in epoxy resins. (a) ZrO2 unmodified, (b) 5% DEG-PPA@ZrO2, (c) 5% Diol-PPA@ZrO2, (d) 5% Ep-PPA@ZrO2. Images (a,b) were reproduced with permission of John Wiley & Sons Ltd. from a previous publication for reasons of comparison [24].
Surfaces 03 00044 g004
Figure 5. Representative TEM-images of ultramicrotome-cuts (100–300 nm thickness) of 5 wt% larger SiO2 nanoparticle in epoxy resins. (a) 5% larger SiO2 unmodified, (b) 5% DEG-TMeOs@SiO2, (c) 5% Diol-TMeOs@SiO2, (d) 5% Gly-TMeOs@SiO2. Image (b) was reproduced with permission of John Wiley & Sons Ltd. from a previous publication for reasons of comparison [24].
Surfaces 03 00044 g005
Figure 6. SAXS scattering curves, exemplarily shown for 5 wt% inorganic nanofiller content of epoxy resin nanocomposites containing (a) small SiO2, (b) large SiO2, and (c) ZrO2.
Surfaces 03 00044 g006aSurfaces 03 00044 g006b
Figure 7. Hard sphere volume fraction of ZrO2 nanoparticles with different surface modifications and incorporated into the epoxy resin matrix with different percentages.
Surfaces 03 00044 g007
Figure 8. Hard sphere volume fraction of small SiO2 nanoparticles with different surface modifications and incorporated into the epoxy resin matrix with different percentages.
Surfaces 03 00044 g008
Figure 9. Hard sphere volume fraction of large SiO2 nanoparticles with different surface modifications and incorporated into the epoxy resin matrix with different percentages.
Surfaces 03 00044 g009
Table 1. List of the studied surface modifications.
Coupling Agent StructureCoupling Agent NameAbbreviation
Surfaces 03 00044 i0011-(3-diethylene glycol monomethyl ether) propoxy phosphonic acidDEG-PPA
Surfaces 03 00044 i002oxiran-2-ylmethyl phosphonic acidEp-PPA
Surfaces 03 00044 i003(3-(2,3-dihydroxypropoxy)propyl) phosphonic acidDiol-PPA
Surfaces 03 00044 i0041-(3-diethylene glycol monomethyl ether) propoxy trimethoxysilaneDEG-TMeOs
Surfaces 03 00044 i0053-glycidoxy propyl trimethoxysilaneGly-TMeOs
Surfaces 03 00044 i006 *(3-(2,3-dihydroxypropoxy)propyl) trimethoxysilaneDiol-TMeOs
* not used as a free coupling agent, formed via post-hydrolysis of surface attached GlyTMeOs.
Table 2. Surface coverage of the nanoparticle substrates, grafting densities determined from TGA/nitrogen sorption experiments.
Coupling AgentSubstrateMass Loss TGA
200–800 °C [wt%]
Grafting Density
[molecules/nm2]
DEG-PPAZrO29.5%/16.7%3.1
Ep-PPAZrO211.8%/9.4%8.8
Diol-PPAZrO2 10.5%/10.0%3.4
DEG-TMeOssmall SiO2/large SiO216.6%/11.0%0.7/2.2
Gly-TMeOssmall SiO2/large SiO216.6%/9.6%1.0/1.8
Diol-TMeOssmall SiO2/large SiO216.7%/9.4%0.9/1.5
Table 3. Hard sphere volume fraction values η for different percentages of surface modified SiO2 and ZrO2 nanoparticles in epoxy resin matrix.
Hard Sphere Volume Fraction η from SAXS
Particle TypeFiller wt%UnmodifiedDEG-PPAEP-PPADiol-PPA
small ZrO230.0450.0010.0970.073
50.0090.0010.0900.076
100.0080.0200.0900.049
Filler wt%UnmodifiedDEG-TMeOsGly-TMeOsDiol-TMeOs
small SiO230.1320.1450.0600.025
50.1310.1430.0280.032
100.1210.1440.0360.042
large SiO230.1740.1600.1480.099
50.2230.1480.1210.090
100.1560.1880.0790.110
Publisher’s Note: MDPI stays neutral with regard to jurisdictional claims in published maps and institutional affiliations.

