Electro-Oxidation of CO Saturated in 0.1 M HClO4 on Basal and Stepped Pt Single-Crystal Electrodes at Room Temperature Accompanied by Surface Reconstruction


Abstract
:1. Introduction
2. Materials and Methods
3. Results and Discussion
3.1. CVs on Pt Single-Crystal Surfaces in CO-Saturated HClO4
3.2. Potential Stepping on Pt(111) in CO-Saturated HClO4
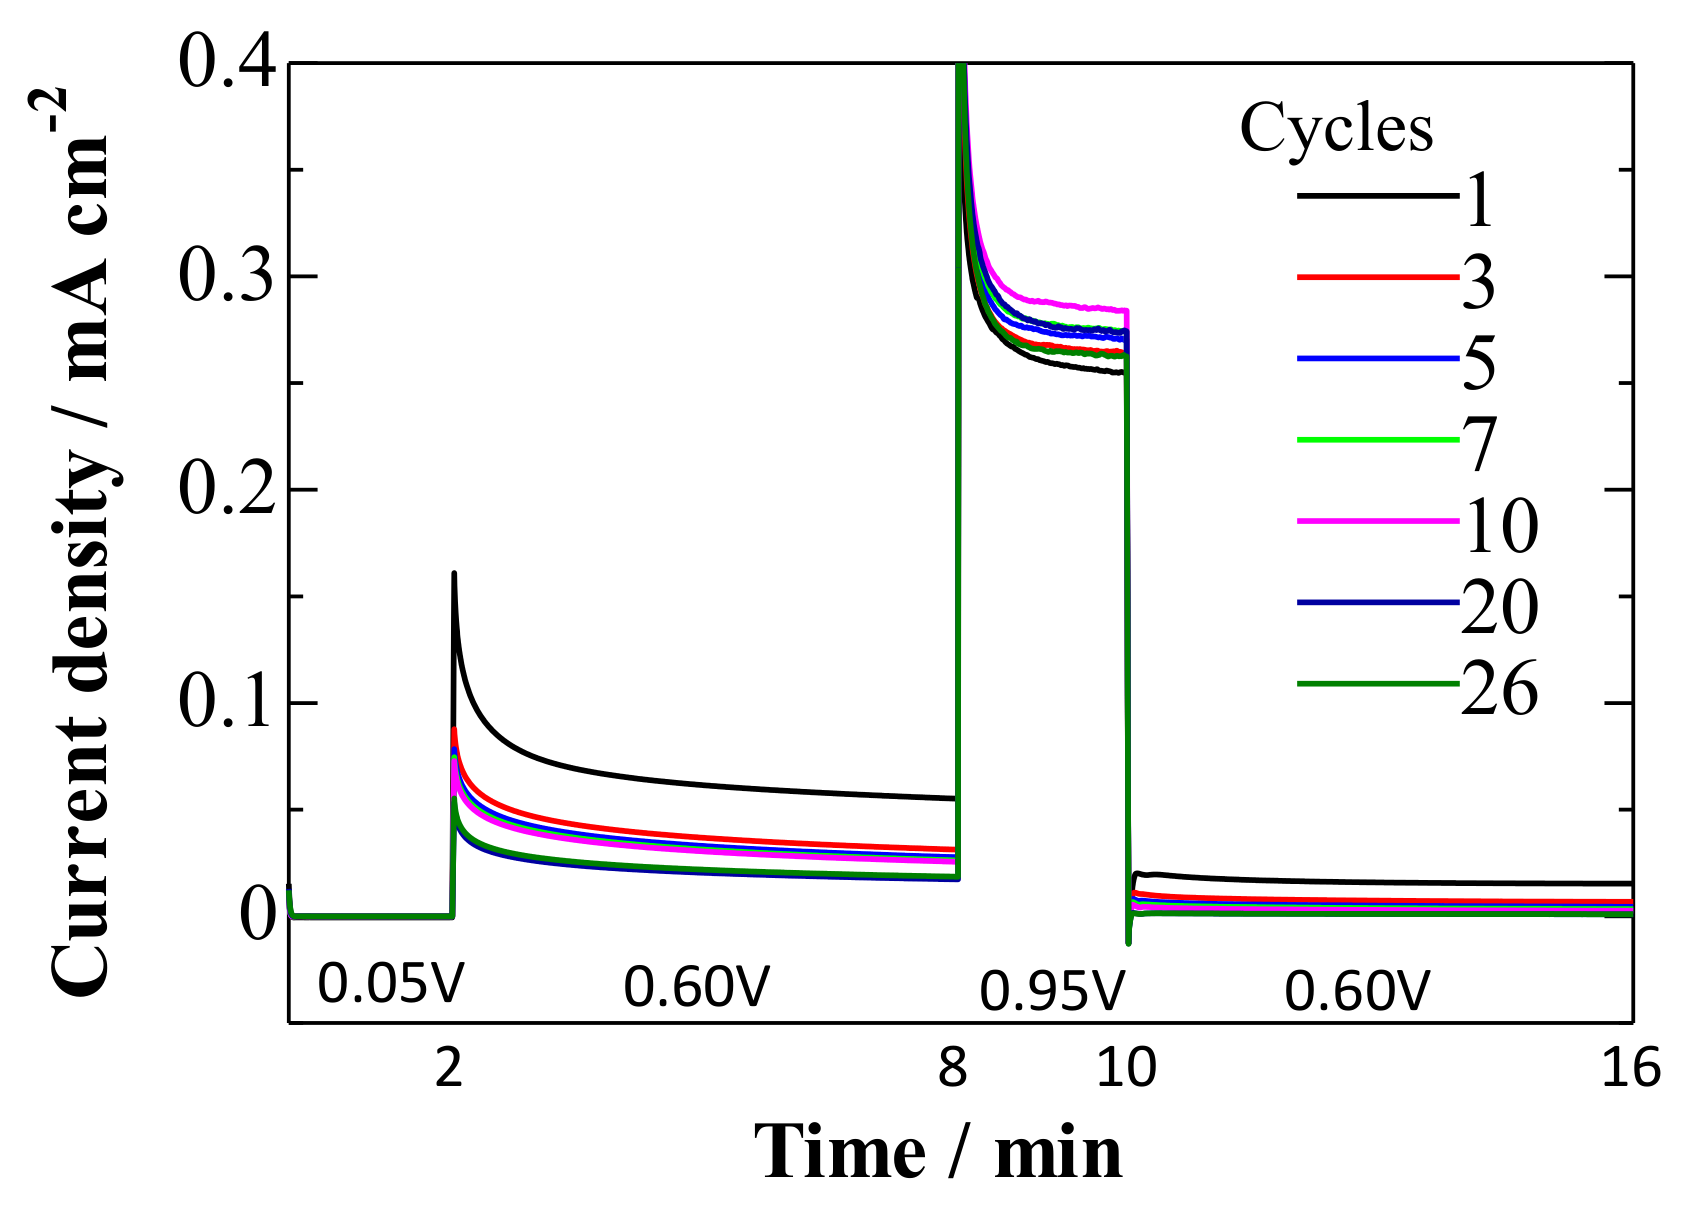
- At 0.95 V, the surface was continuously deactivated by the simultaneous formation of surface oxides (Figure 5, Equations (1) and (2)). Pt adatoms or Pt clusters with low CNs were preferentially oxidized. Those oxidized species were immobile on the surface.
- The current density at 0.60 V, after being treated at 0.95 V, became much smaller (Figure 5) along with the formation of a stable CO adlayer on the terraces (Figure 6). Pt(CO)42+ (Equation (4)) or Pt(CO)2 (Equation (5)) species were also formed after the potential step by the reduction of the (single or several atomic) Pt oxides. We believe that, at least partially, Pt(CO)42+ remained on the surface at 0.60 V after the potential step from 0.95 V, because Pt oxides were not completely reduced to metal Pt at 0.60 V after going through 0.95 V, as seen in the CVs obtained in pure HClO4 (Figure 2, Figure 3 and Figure 4). Because the reactivity did not change very much at 0.60 V, the surface morphology did not change either. Therefore, the planar and electronically charged Pt(CO)42+ species, inactive towards the bulk CO electro-oxidation, might be immobile on the Pt surface.
- At 0.05 V, all Pt(CO)42+ species became Pt(CO)2. The current density at 0.60 V after treatment at 0.05 V became larger than that after treatment at 0.95 V (Figure 5), because of the formation of Pt(0)(CO)2 from Pt(II)(CO)42+; metallic Pt species can be active towards bulk CO electro-oxidation. The reaction rate, on the other hand, was continuously lowered at 0.60 V. This is because of the deposition of mobile Pt(CO)2 at the energetically favorable adjacent site on the surface, thus lowering its CN and eventually its reaction activity.
- Repeating the treatments at 0.05 and 0.95 V gradually decreased the reaction rate of the bulk CO electro-oxidation in the lower potential region (Figure 5). The potential cycling between 0.07 and 0.95 V much enhanced the deactivation process on Pt electrodes (Figure 2, Figure 3 and Figure 4) compared with the potential-step treatment (Figure 5), possibly because of the continuous morphological change during the potential cycling.
4. Conclusions
Supplementary Materials
Author Contributions
Funding
Acknowledgments
Conflicts of Interest
References
- Markovic, N.M.; Ross, P.N. Surface science studies of model fuel cell electrocatalysts. Surf. Sci. Rep. 2002, 45, 117–229. [Google Scholar] [CrossRef]
- Koper, M.T.M.; Lai, S.C.S.; Herrero, E. Mechanisms of the Oxidation of Carbon Monoxide and Small Organic Molecules at Metal Electrodes. In Fuel Cell Catalysis; John Wiley & Sons, Inc.: Hoboken, NJ, USA, 2008; pp. 159–207. [Google Scholar]
- Korzeniewski, C.; Climent, V.; Feliu, J.M. Electrochemistry at Platinum Single Crystal Electrodes. In Electrochemistry: A Series of Advances; Bard, A.J., Zoski, C., Eds.; CRC Press: Boca Raton, FL, USA, 2012; Volume 24, pp. 75–169. [Google Scholar]
- Li, Q.-X.; Huo, S.-J.; Ma, M.; Cai, W.-B.; Osawa, M. Ubiquitous Strategy for Probing ATR Surface-Enhanced Infrared Absorption at Platinum Group Metal−Electrolyte Interfaces. J. Phys. Chem. B 2005, 109, 7900–7906. [Google Scholar] [CrossRef]
- Atkins, P.W. Physical Chemistry, 6th ed.; Oxford University Press: Oxford, UK, 1998. [Google Scholar]
- Lopez-Cudero, A.; Cuesta, A.; Gutierrez, C. Potential dependence of the saturation CO coverage of Pt electrodes: The origin of the pre-peak in CO-stripping voltammograms. Part 2: Pt(100). J. Electroanal. Chem. 2006, 586, 204–216. [Google Scholar] [CrossRef]
- Lopez-Cudero, A.; Cuesta, A.; Gutierrez, C. Potential dependence of the saturation CO coverage of Pt electrodes: The origin of the pre-peak in CO-stripping voltammograms. Part 1: Pt(111). J. Electroanal. Chem. 2005, 579, 1–12. [Google Scholar] [CrossRef]
- Lebedeva, N.P.; Koper, M.T.M.; Herrero, E.; Feliu, J.M.; van Santen, R.A. Cooxidation on stepped Pt[n(111)×(111)] electrodes. J. Electroanal. Chem. 2000, 487, 37–44. [Google Scholar] [CrossRef]
- Lebedeva, N.P.; Koper, M.T.M.; Feliu, J.M.; van Santen, R.A. Role of Crystalline Defects in Electrocatalysis: Mechanism and Kinetics of CO Adlayer Oxidation on Stepped Platinum Electrodes. J. Phys. Chem. B 2002, 106, 12938–12947. [Google Scholar] [CrossRef]
- Lebedeva, N.P.; Rodes, A.; Feliu, J.M.; Koper, M.T.M.; van Santen, R.A. Role of Crystalline Defects in Electrocatalysis: CO Adsorption and Oxidation on Stepped Platinum Electrodes as Studied by in situ Infrared Spectroscopy. J. Phys. Chem. B 2002, 106, 9863–9872. [Google Scholar] [CrossRef]
- Chen, Q.-S.; Berna, A.; Climent, V.; Sun, S.-G.; Feliu, J.M. Specific reactivity of step sites towards CO adsorption and oxidation on platinum single crystals vicinal to Pt(111). Phys. Chem. Chem. Phys. 2010, 12, 11407. [Google Scholar] [CrossRef] [PubMed]
- Farias, M.J.S.; Camera, G.A.; Feliu, J.M. Understanding the CO Preoxidation and the Intrinsic Catalytic Activity of Step Sites in Stepped Pt Surfaces in Acidic Medium. J. Phys. Chem. C 2015, 119, 20272–20282. [Google Scholar] [CrossRef]
- Mayrhofer, K.J.J.; Blizanac, B.B.; Arenz, M.; Stamenkovic, V.R.; Ross, P.N.; Markovic, N.M. The Impact of Geometric and Surface Electronic Properties of Pt-Catalysts on the Particle Size Effect in Electrocatalysis. J. Phys. Chem. B 2005, 109, 14433–14440. [Google Scholar] [CrossRef]
- Marković, N.M.; Grgur, B.N.; Lucas, C.A.; Ross, P.N. Electrooxidation of CO and H2/CO Mixtures on Pt(111) in Acid Solutions. J. Phys. Chem. B 1999, 103, 487–495. [Google Scholar] [CrossRef]
- Inukai, J.; Tryk, D.A.; Abe, T.; Wakisaka, M.; Uchida, H.; Watanabe, M. Direct STM Elucidation of the Effects of Atomic-Level Structure on Pt(111) Electrodes for Dissolved CO Oxidation. J. Am. Chem. Soc. 2013, 135, 1476–1490. [Google Scholar] [CrossRef]
- Strmcnik, D.S.; Tripkovic, D.V.; van der Vliet, D.; Chang, K.C.; Komanicky, V.; You, H.; Karapetrov, G.; Greeley, J.; Stamenkovic, V.R.; Markovic, N.M. Unique Activity of Platinum Adislands in the CO Electrooxidation Reaction. J. Am. Chem. Soc. 2008, 130, 15332–15339. [Google Scholar] [CrossRef] [PubMed]
- Somorjai, G.; Li, Y. Introduction to Surface Chemistry and Catalysis, 2nd ed.; John Wiley & Sons: Hoboken, NJ, USA, 2010. [Google Scholar]
- Batista, E.A.; Iwasita, T.; Viestich, W. Mechanism of Stationary Bulk CO Oxidation on Pt(111) Electrodes. J. Phys. Chem. B 2004, 108, 14216–14222. [Google Scholar] [CrossRef]
- Rednev, A.V.; Wandlowski, T. An influence of pretreatment conditions on surface structure and reactivity of Pt(100) towards CO oxidation reaction. Russ. J. Electrochem. 2012, 72, 259–270. [Google Scholar] [CrossRef]
- Itaya, K. In situ scanning tunneling microscopy in electrolyte solutions. Prog. Surf. Sci. 1998, 58, 121–247. [Google Scholar] [CrossRef]
- Wakisaka, M.; Ohkanda, T.; Yoneyama, T.; Uchida, H.; Watanabe, M. Structures of a CO adlayer on a Pt(100) electrode in HClO4 solution studied by in situ STM. Chem. Commun. 2005, 2710–2712. [Google Scholar] [CrossRef]
- Wakisaka, M.; Asizawa, S.; Yoneyama, T.; Uchida, H.; Watanabe, M. In Situ STM Observation of the CO Adlayer on a Pt(110) Electrode in 0.1 M HClO4 Solution. Langmuir 2010, 26, 9191–9194. [Google Scholar] [CrossRef]
- Furuya, N.; Koide, S. Hydrogen adsorption on platinum single-crystal surfaces. Surf. Sci. 1989, 220, 18–28. [Google Scholar] [CrossRef]
- Huerta, F.; Mollaron, E.; Quijada, C.; Vezquez, J.L.; Perez, J.M.; Aldaz, A. The adsorption of methylamine on Pt single crystal surfaces. J. Electroanal. Chem. 1999, 467, 105–111. [Google Scholar] [CrossRef]
- Dederichs, F.; Friedrich, K.A.; Daum, W. Sum-Frequency Vibrational Spectroscopy of CO Adsorption on Pt(111) and Pt(110) Electrode Surfaces in Perchloric Acid Solution: Effects of Thin-Layer Electrolytes in Spectroelectrochemistry. J. Phys. Chem. B 2000, 104, 6626–6632. [Google Scholar] [CrossRef]
- Wakisaka, M.; Morishima, S.; Hyuga, Y.; Uchida, H.; Watanabe, M. Electrochemical behavior of Pt–Co(111), (100) and (110) alloy single-crystal electrodes in 0.1 M HClO4 and 0.05 M H2SO4 solution as a function of Co content. Electrochem. Commun. 2012, 18, 55–57. [Google Scholar] [CrossRef]
- Sashikata, K.; Sugata, T.; Sugimasa, M.; Itaya, K. In Situ Scanning Tunneling Microscopy Observation of a Porphyrin Adlayer on an Iodine-Modified Pt(100) Electrode. Langmuir 1998, 14, 2896–2902. [Google Scholar] [CrossRef]
- Kibler, L.A.; Cuesta, A.; Kleinert, M.; Kolb, D.M. In-situ STM characterisation of the surface morphology of platinum single crystal electrodes as a function of their preparation. J. Electroanal. Chem. 2000, 484, 73–82. [Google Scholar] [CrossRef]
- Arenz, M.; Mayrhofer, K.J.J.; Stamenkovic, V.; Blizanac, B.B.; Tomoyuki, T.; Ross, P.N.; Markovic, N.M. The Effect of the Particle Size on the Kinetics of CO Electrooxidation on High Surface Area Pt Catalysts. J. Am. Chem. Soc. 2005, 127, 6819–6829. [Google Scholar]
- Giz, M.J.; Batista, E.A.; Vielstich, W.; Iwasita, T. A topographic view of the Pt(111) surface at the electrochemical interface in the presence of carbon monoxide. Electrochem. Commun. 2007, 9, 1083–1085. [Google Scholar] [CrossRef]


| Pt(111)-Oriented | Pt(110)-Oriented | Pt(100)-Oriented | |||||
|---|---|---|---|---|---|---|---|
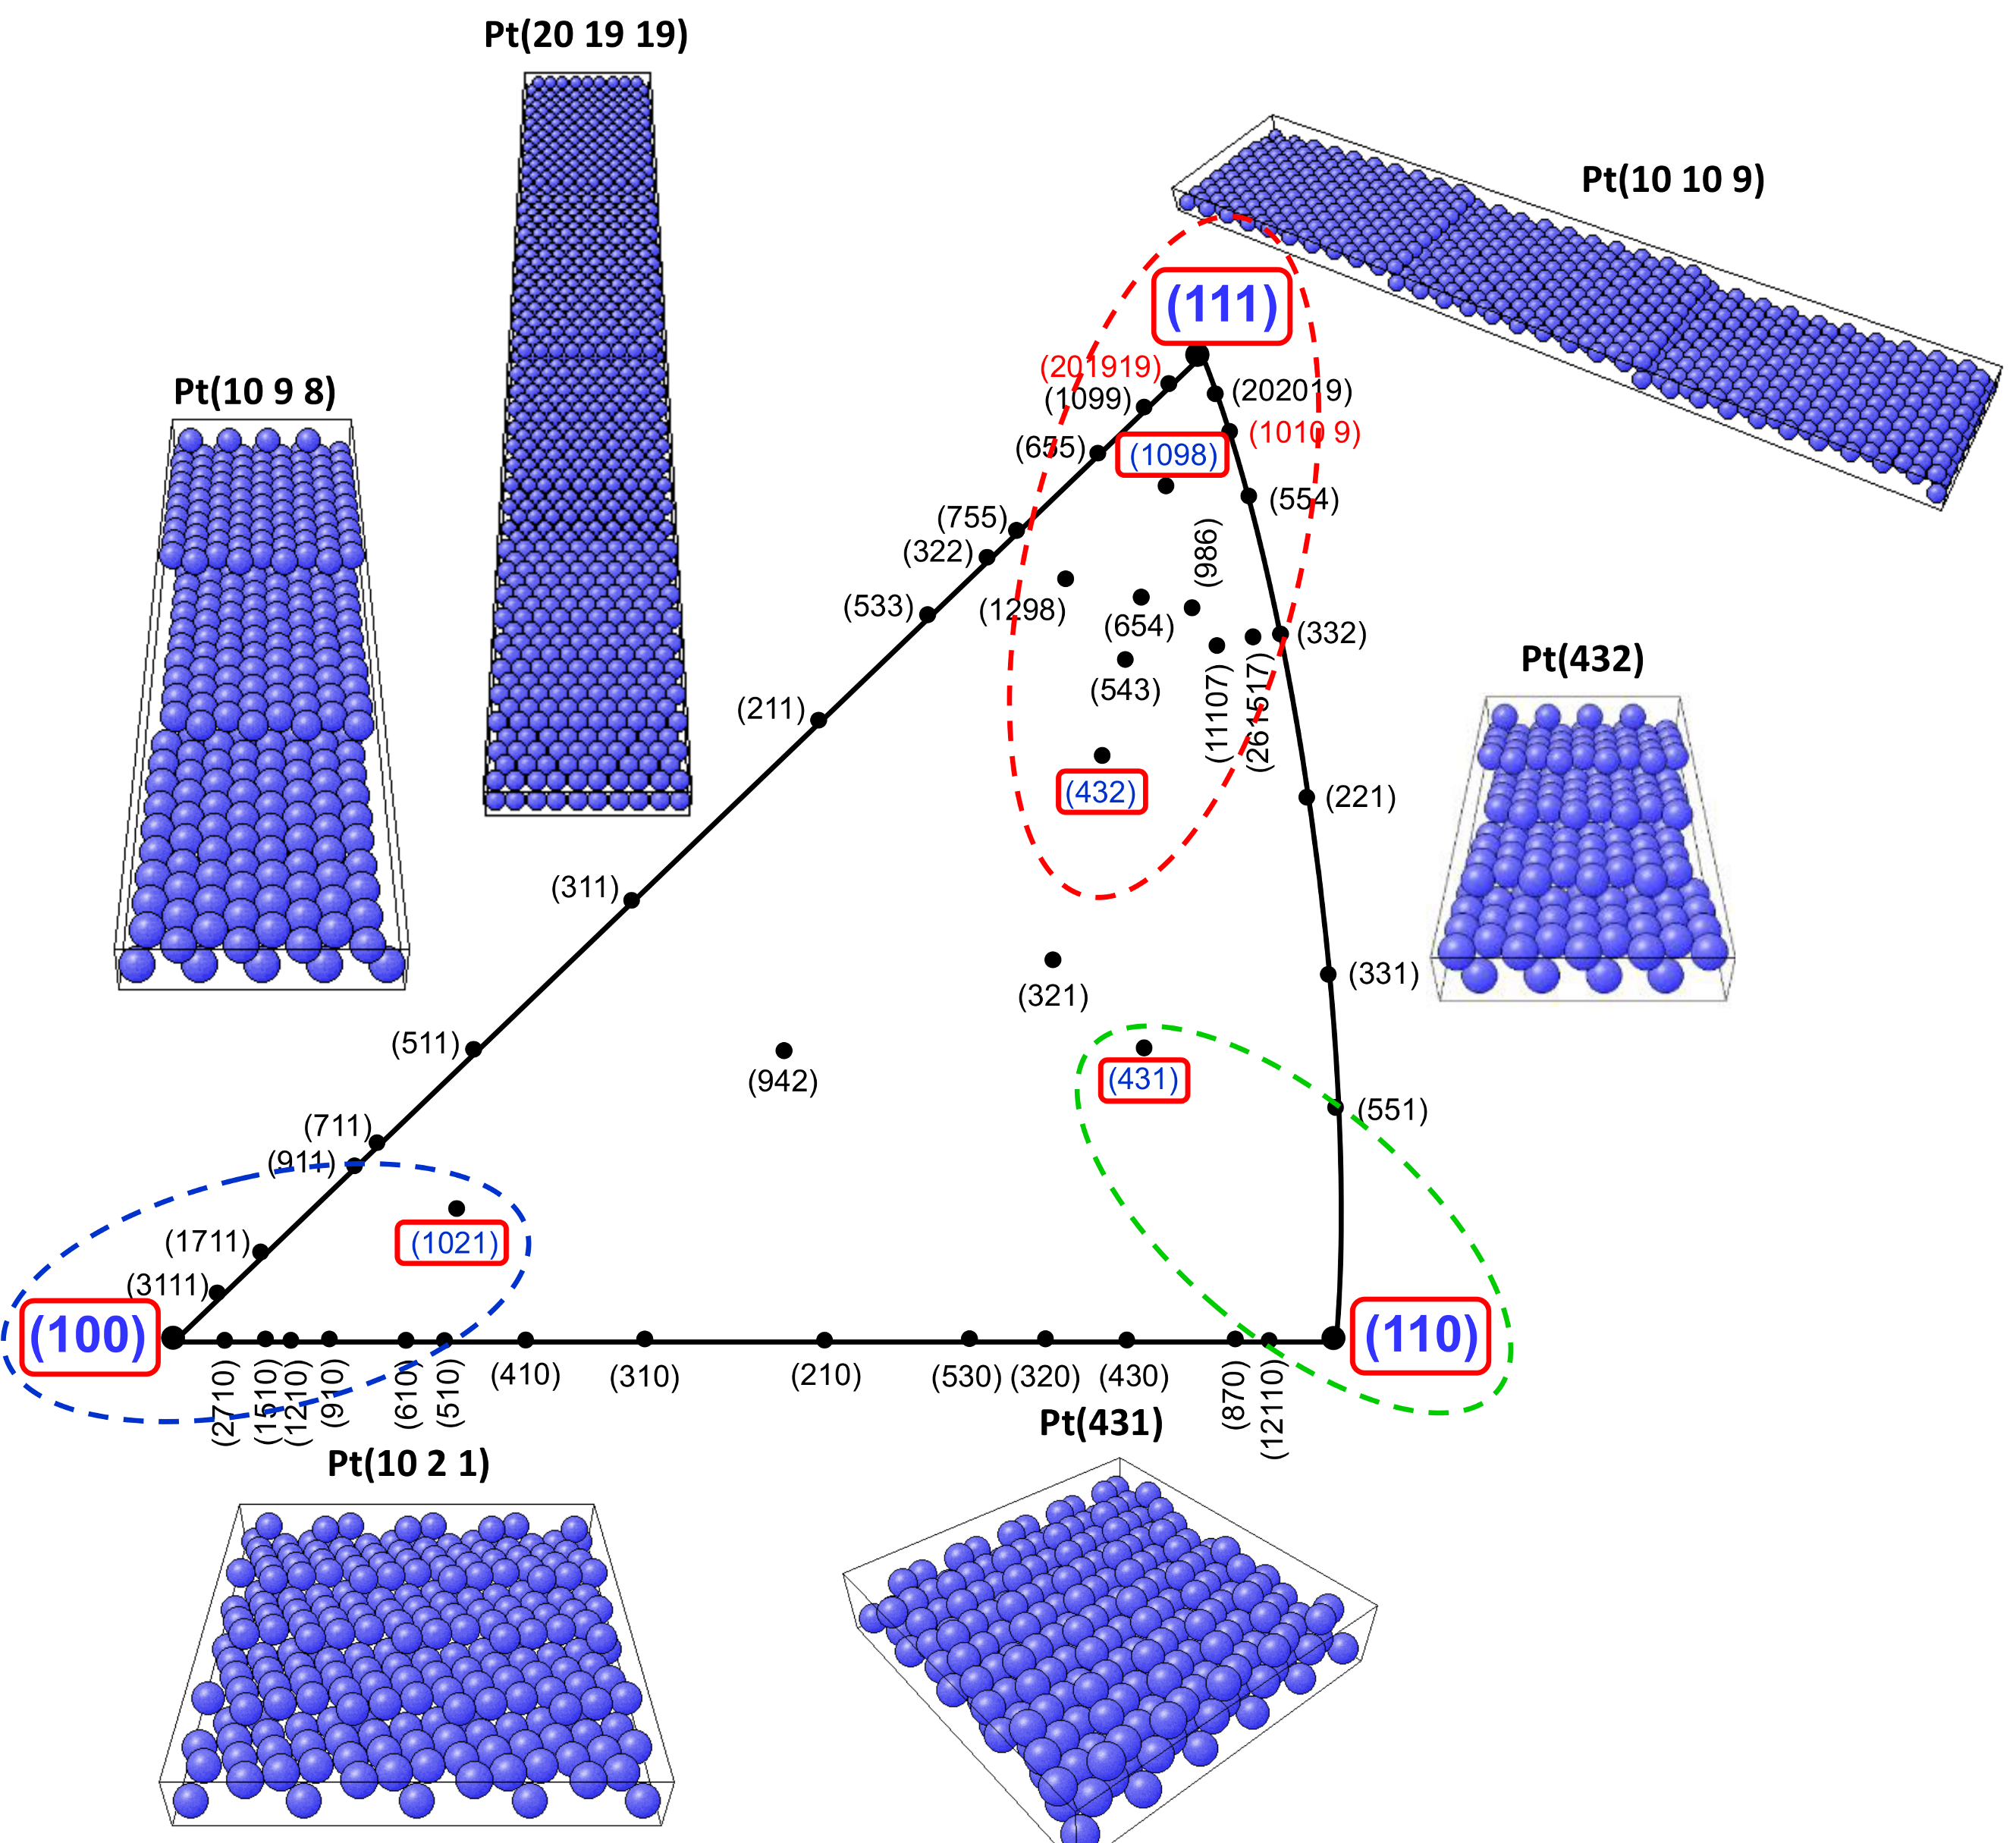
| Pt(111) | Pt(10 9 8) | Pt(432) | Pt(110) | Pt(431) | Pt(100) | Pt(10 2 1) | |
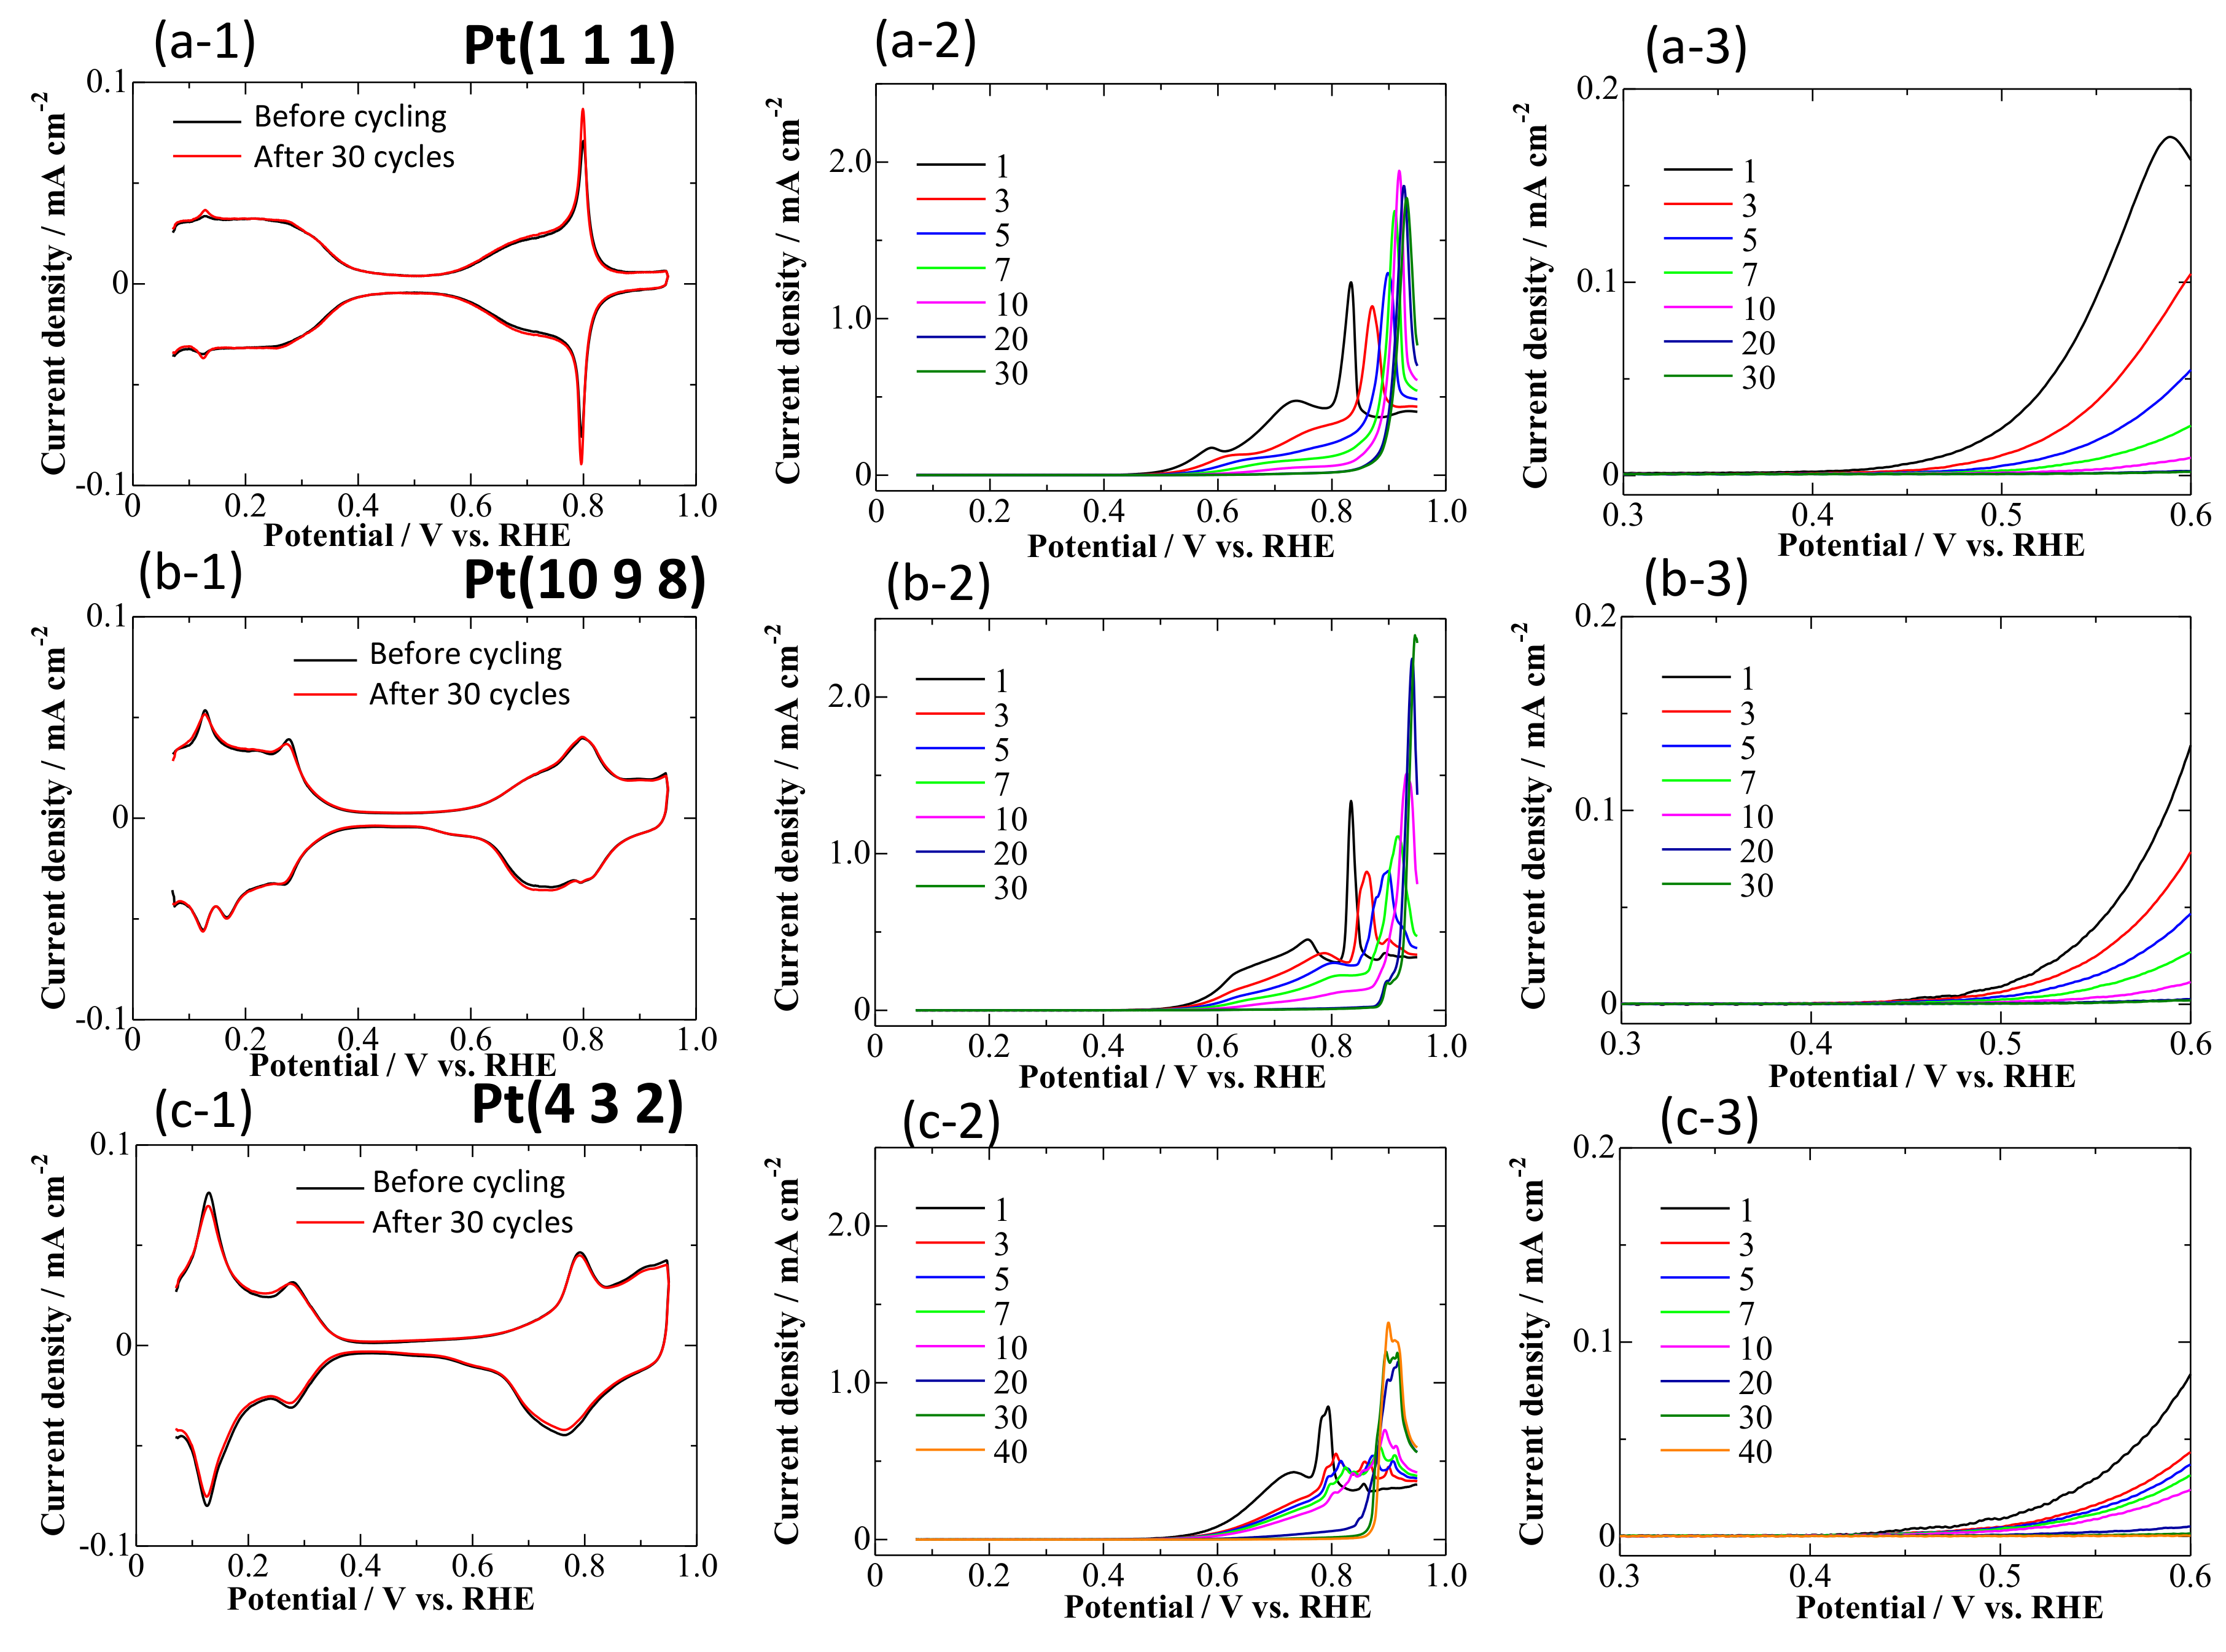
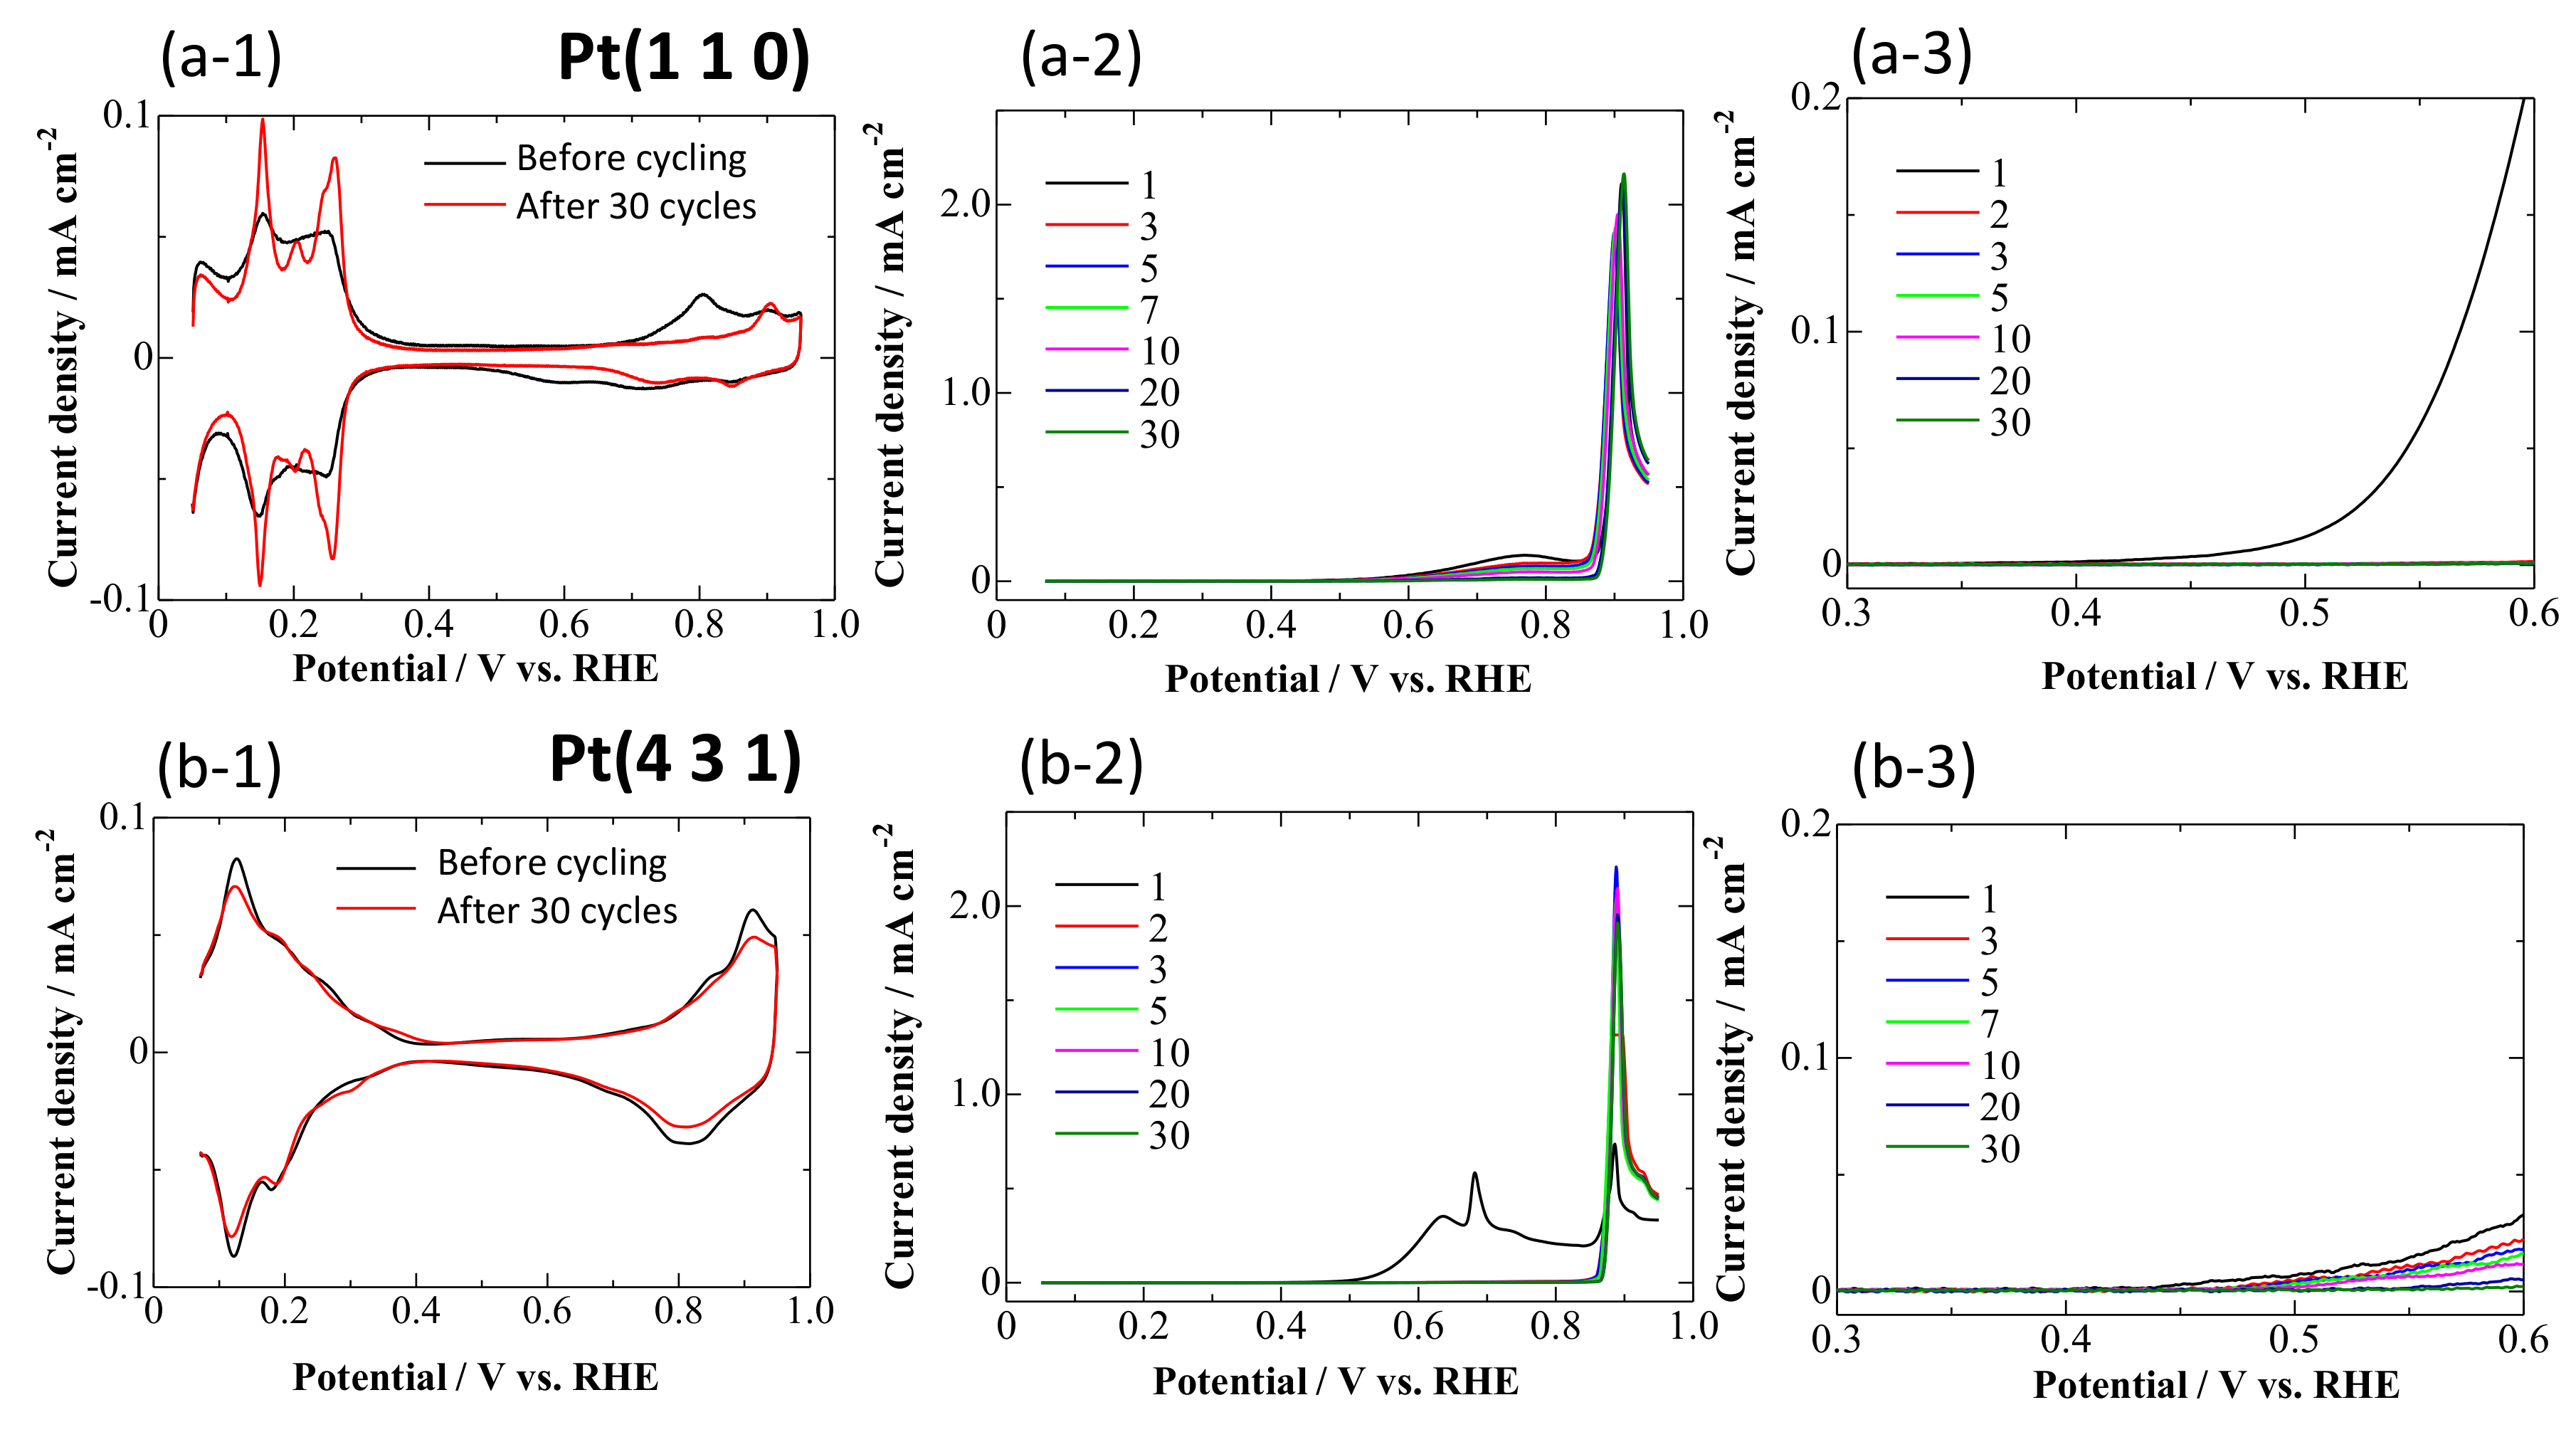
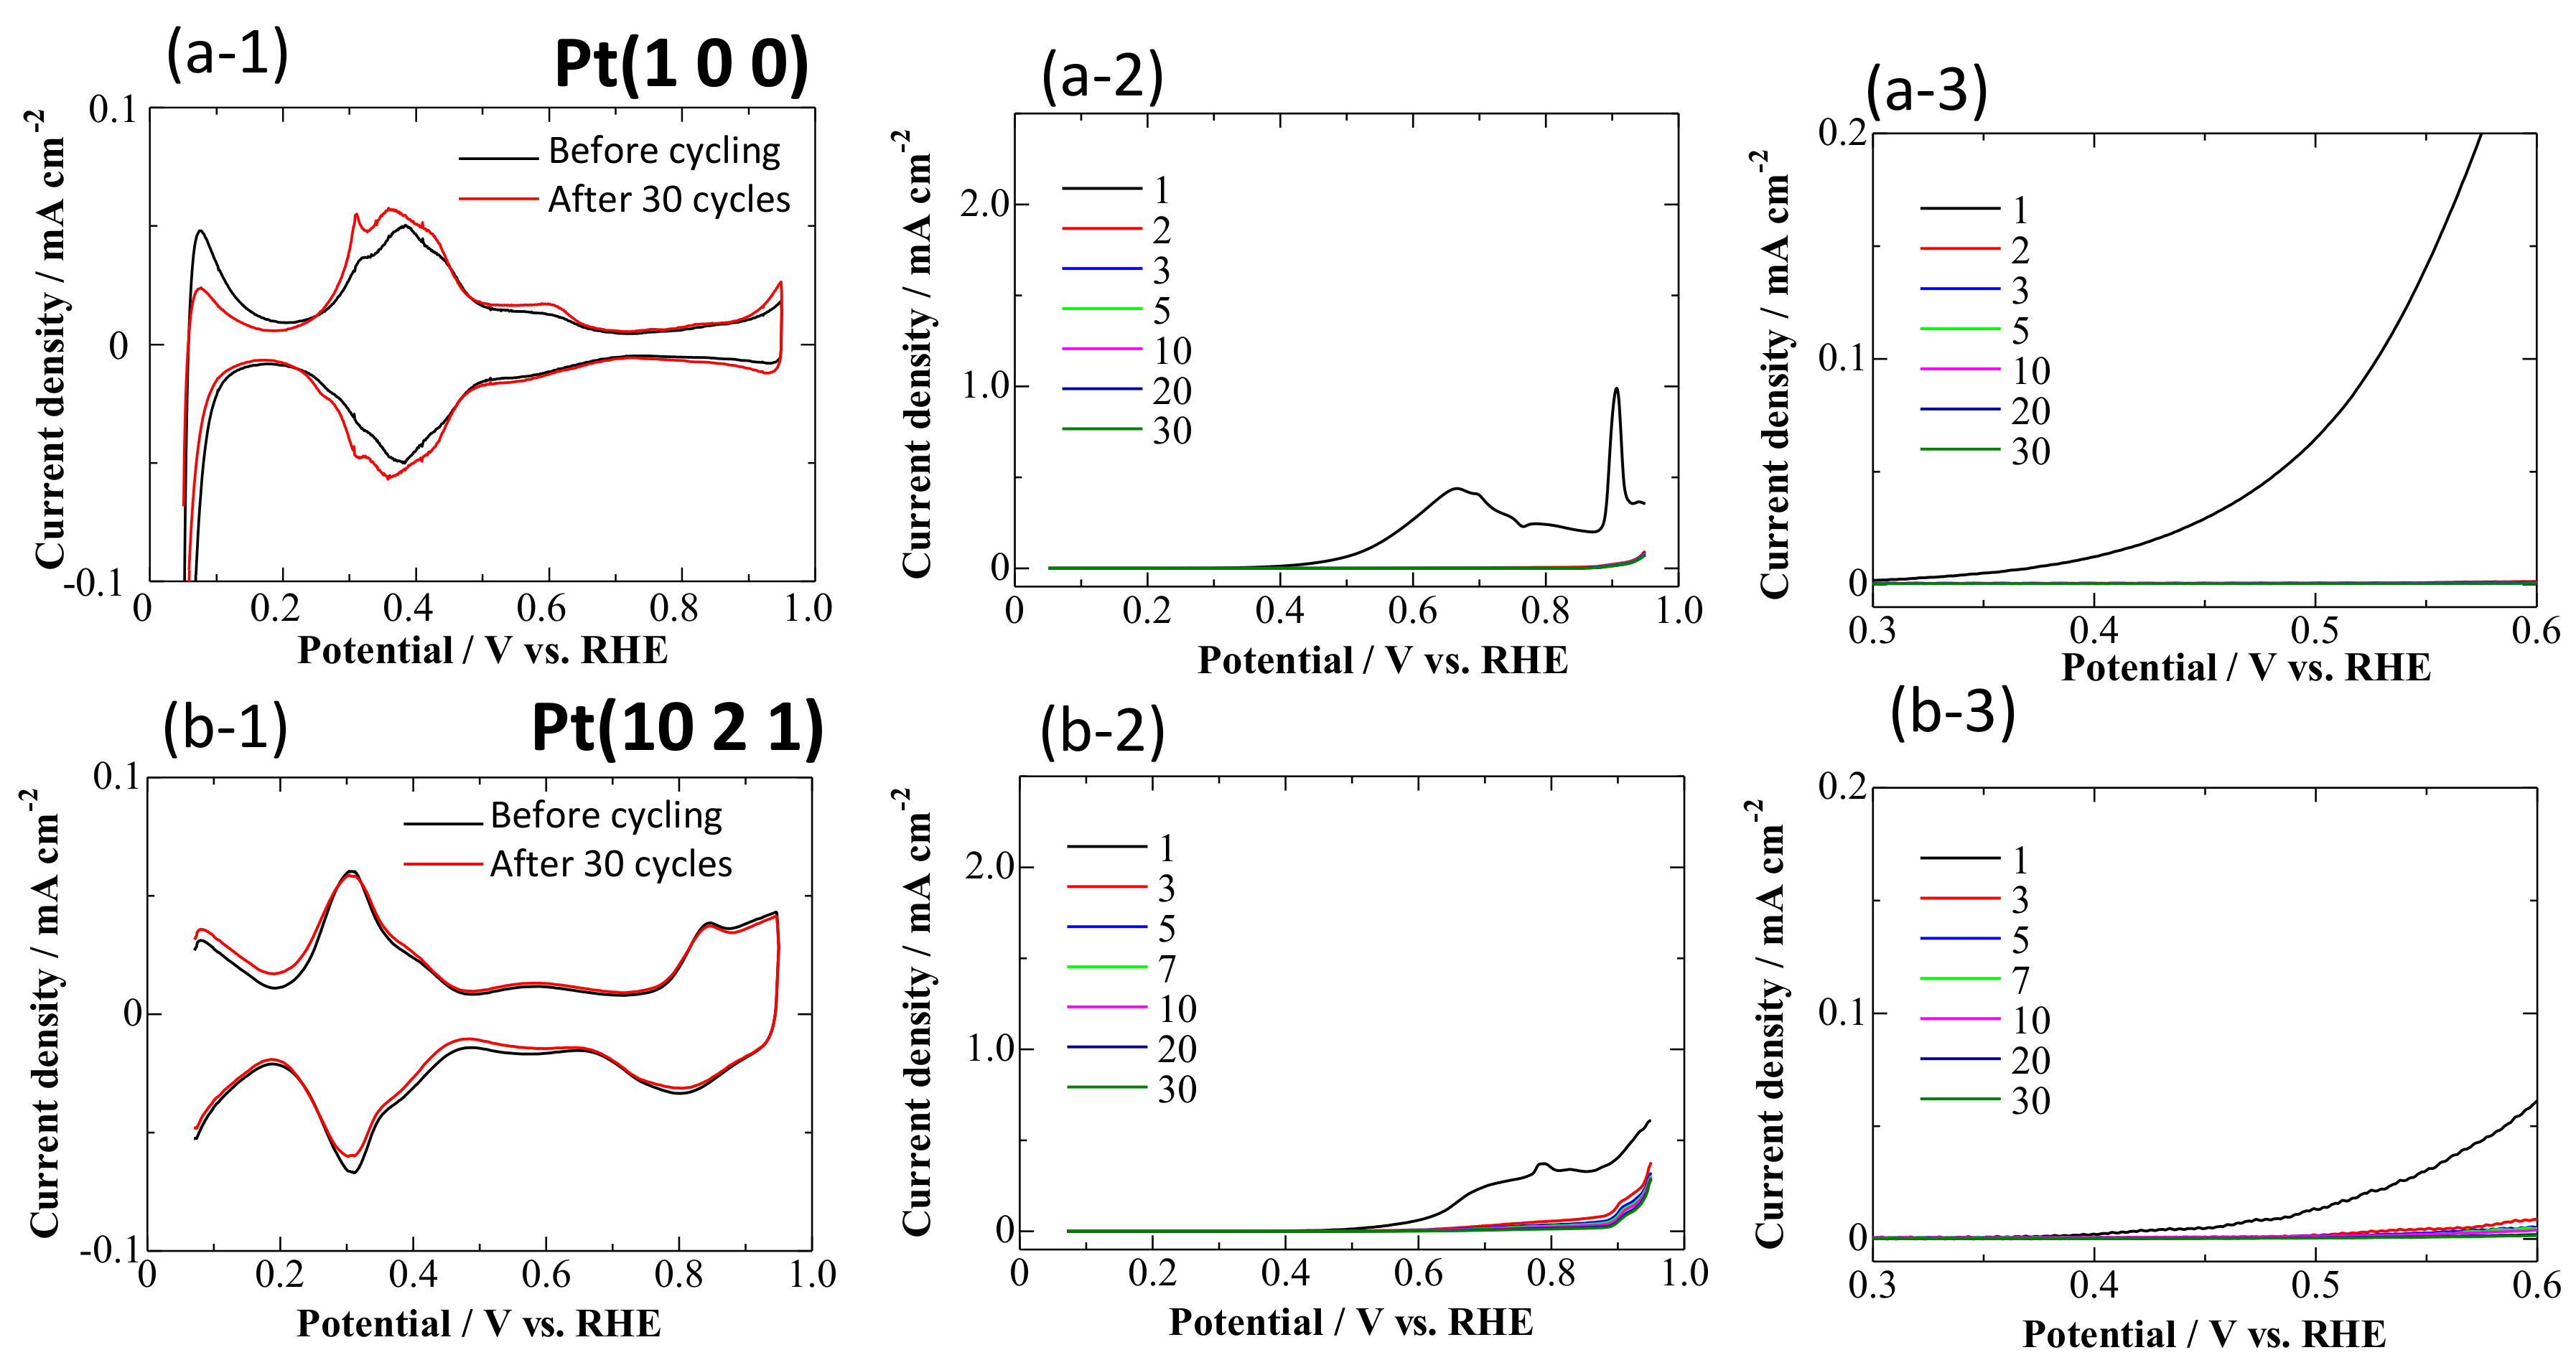
| Onset potential/V vs. RHE | 0.37 | 0.43 | 0.42 | 0.35 | 0.40 | 0.29 | 0.35 |
© 2019 by the authors. Licensee MDPI, Basel, Switzerland. This article is an open access article distributed under the terms and conditions of the Creative Commons Attribution (CC BY) license (http://creativecommons.org/licenses/by/4.0/).
Share and Cite
Abe, K.; Uchida, H.; Inukai, J. Electro-Oxidation of CO Saturated in 0.1 M HClO4 on Basal and Stepped Pt Single-Crystal Electrodes at Room Temperature Accompanied by Surface Reconstruction. Surfaces 2019, 2, 315-325. https://doi.org/10.3390/surfaces2020023
Abe K, Uchida H, Inukai J. Electro-Oxidation of CO Saturated in 0.1 M HClO4 on Basal and Stepped Pt Single-Crystal Electrodes at Room Temperature Accompanied by Surface Reconstruction. Surfaces. 2019; 2(2):315-325. https://doi.org/10.3390/surfaces2020023
Chicago/Turabian StyleAbe, Kiyotaka, Hiroyuki Uchida, and Junji Inukai. 2019. "Electro-Oxidation of CO Saturated in 0.1 M HClO4 on Basal and Stepped Pt Single-Crystal Electrodes at Room Temperature Accompanied by Surface Reconstruction" Surfaces 2, no. 2: 315-325. https://doi.org/10.3390/surfaces2020023