Probing the Surface of Noble Metals Electrochemically by Underpotential Deposition of Transition Metals


Abstract
:
1. Introduction
2. Generalities about upd
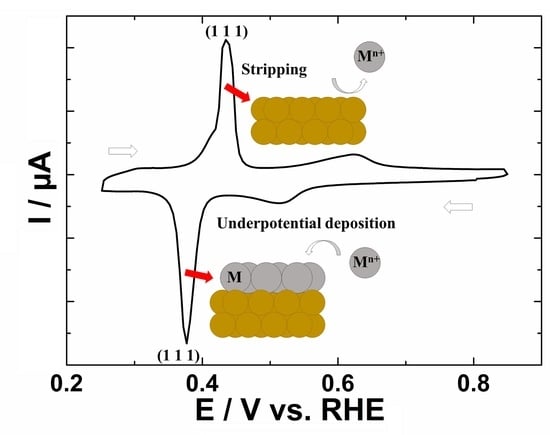
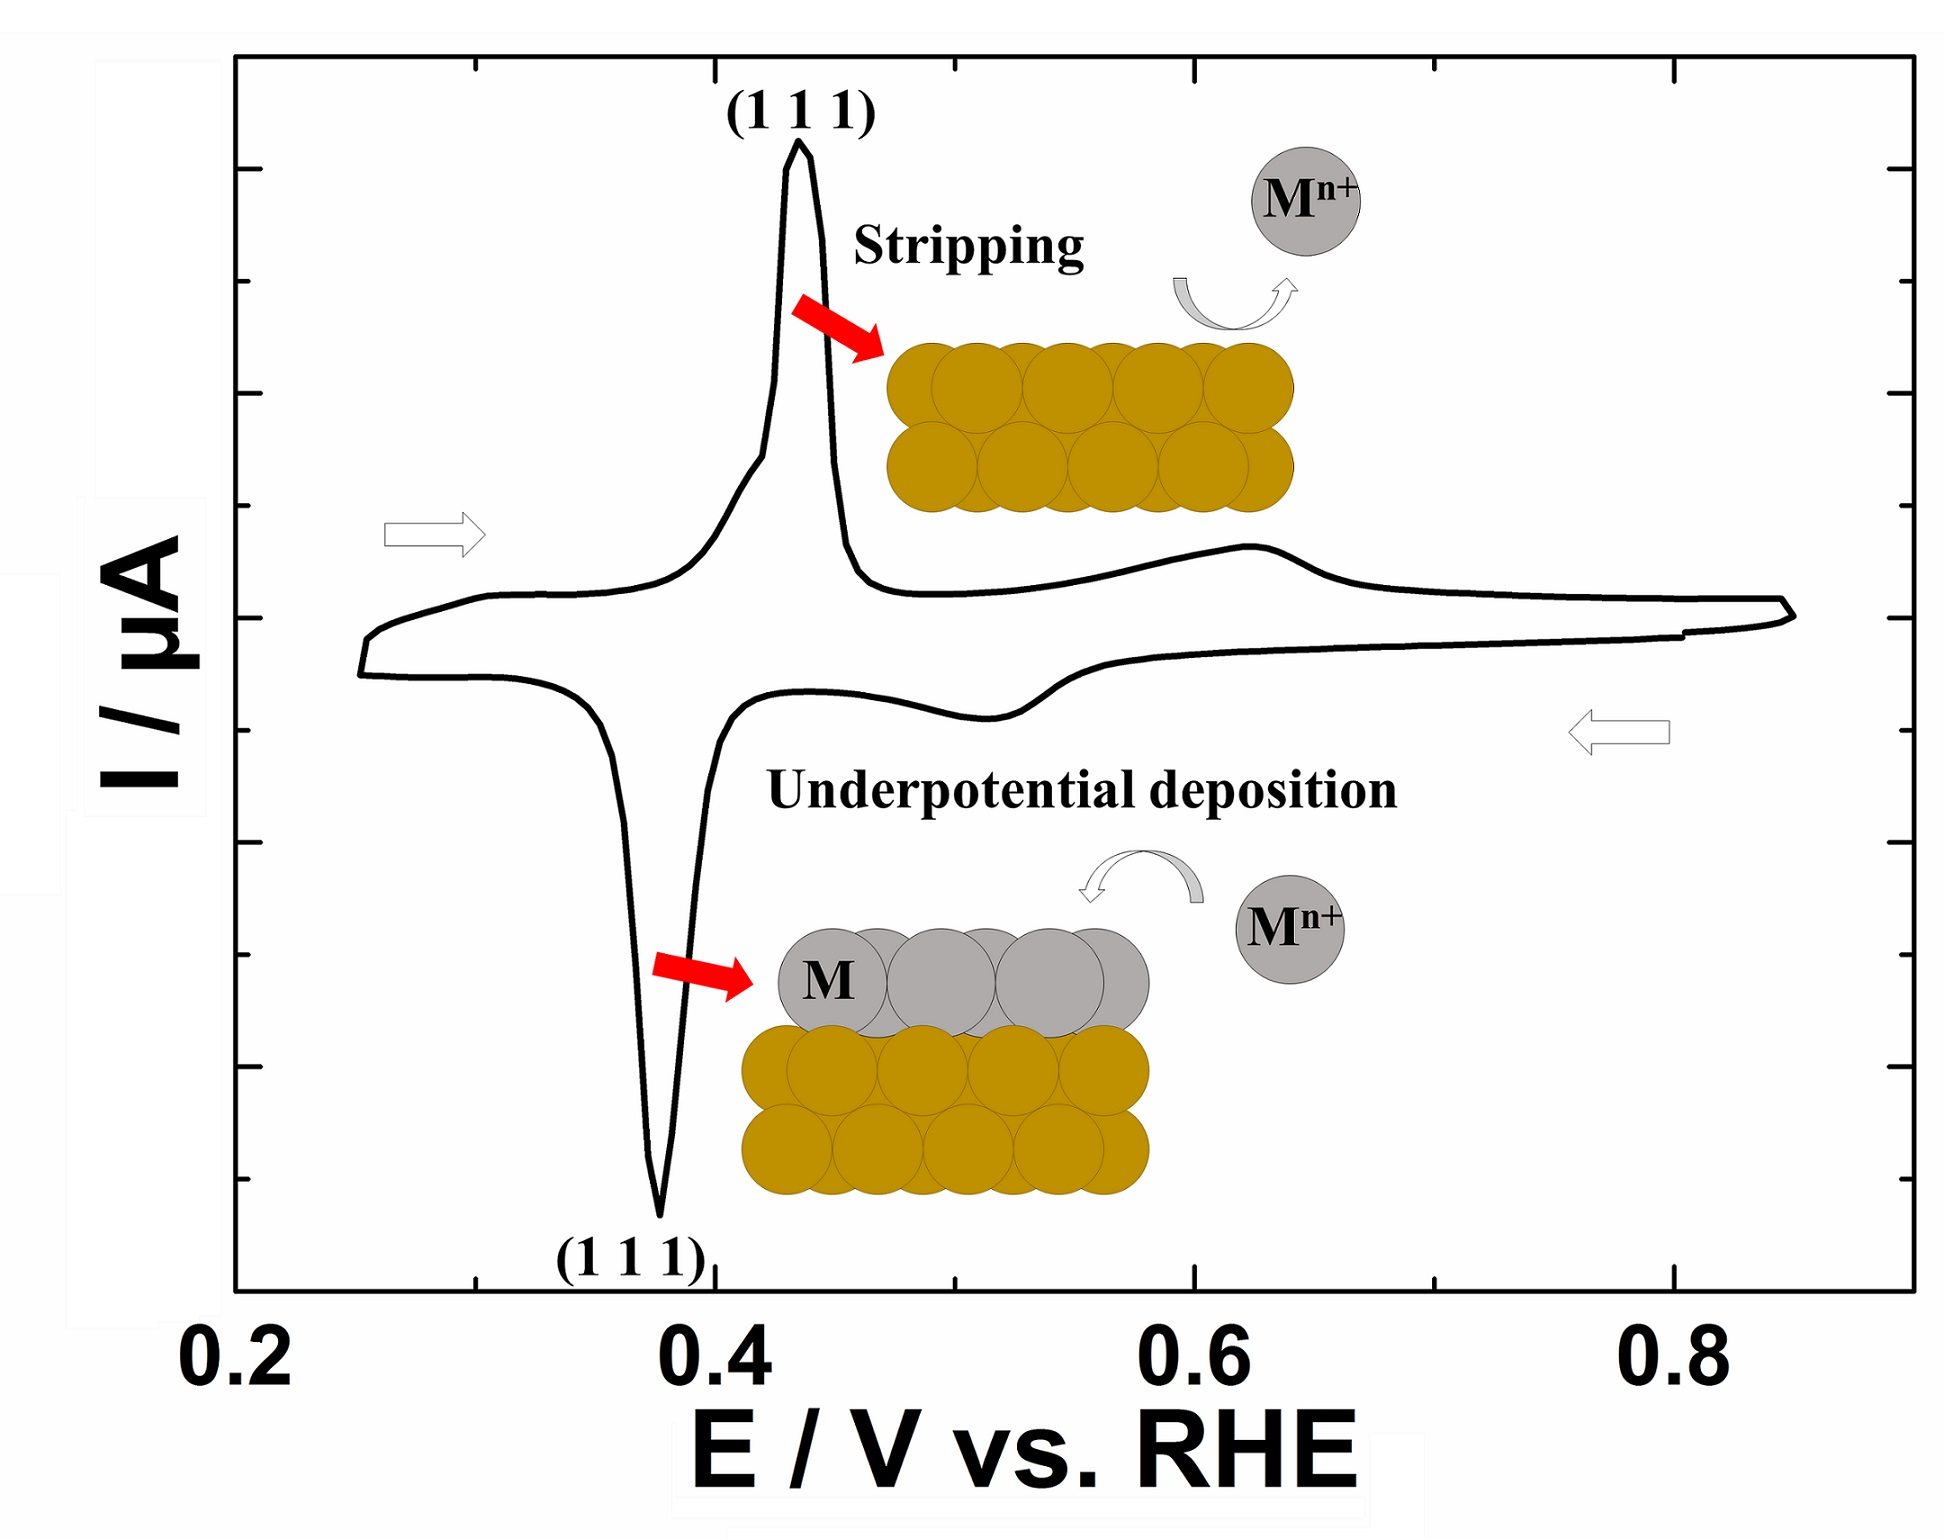
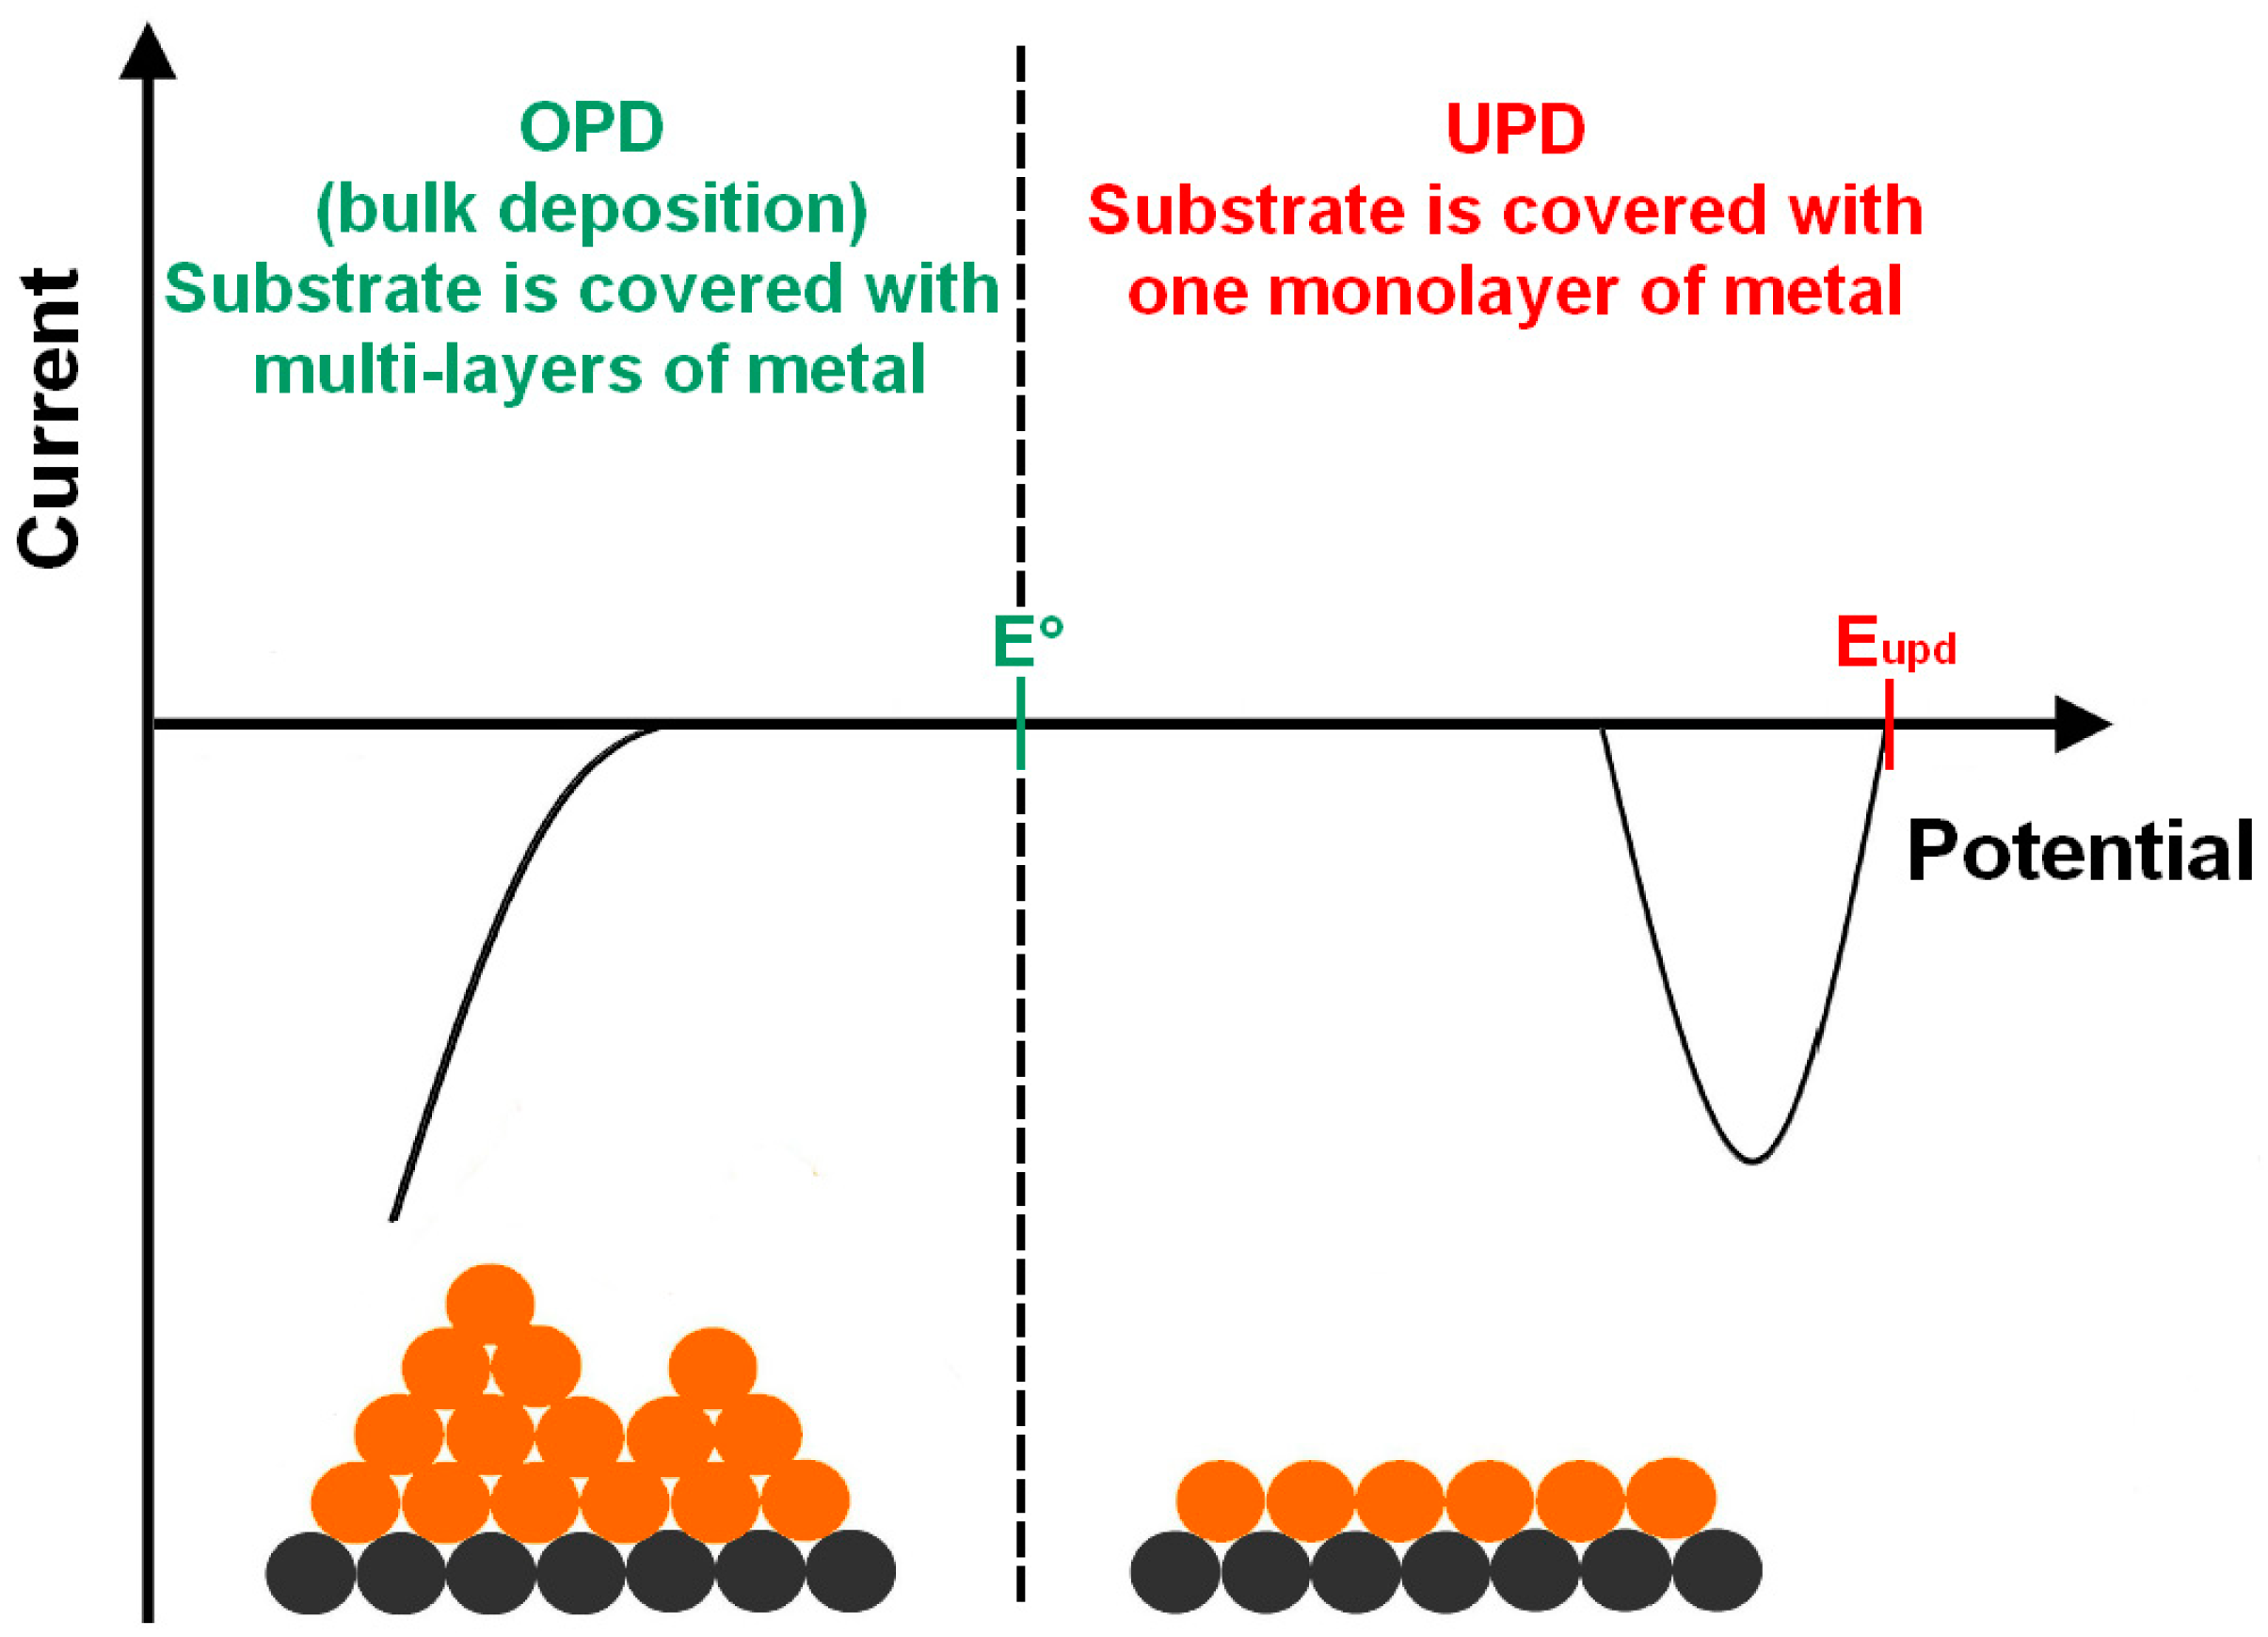
2.1. Principles and Thermodynamics of the upd Process
2.2. A Method of Characterization: Cyclic Voltammetry
2.3. The upd Metals
3. The Mupd on Noble Metals: Au, Pt, and Pd
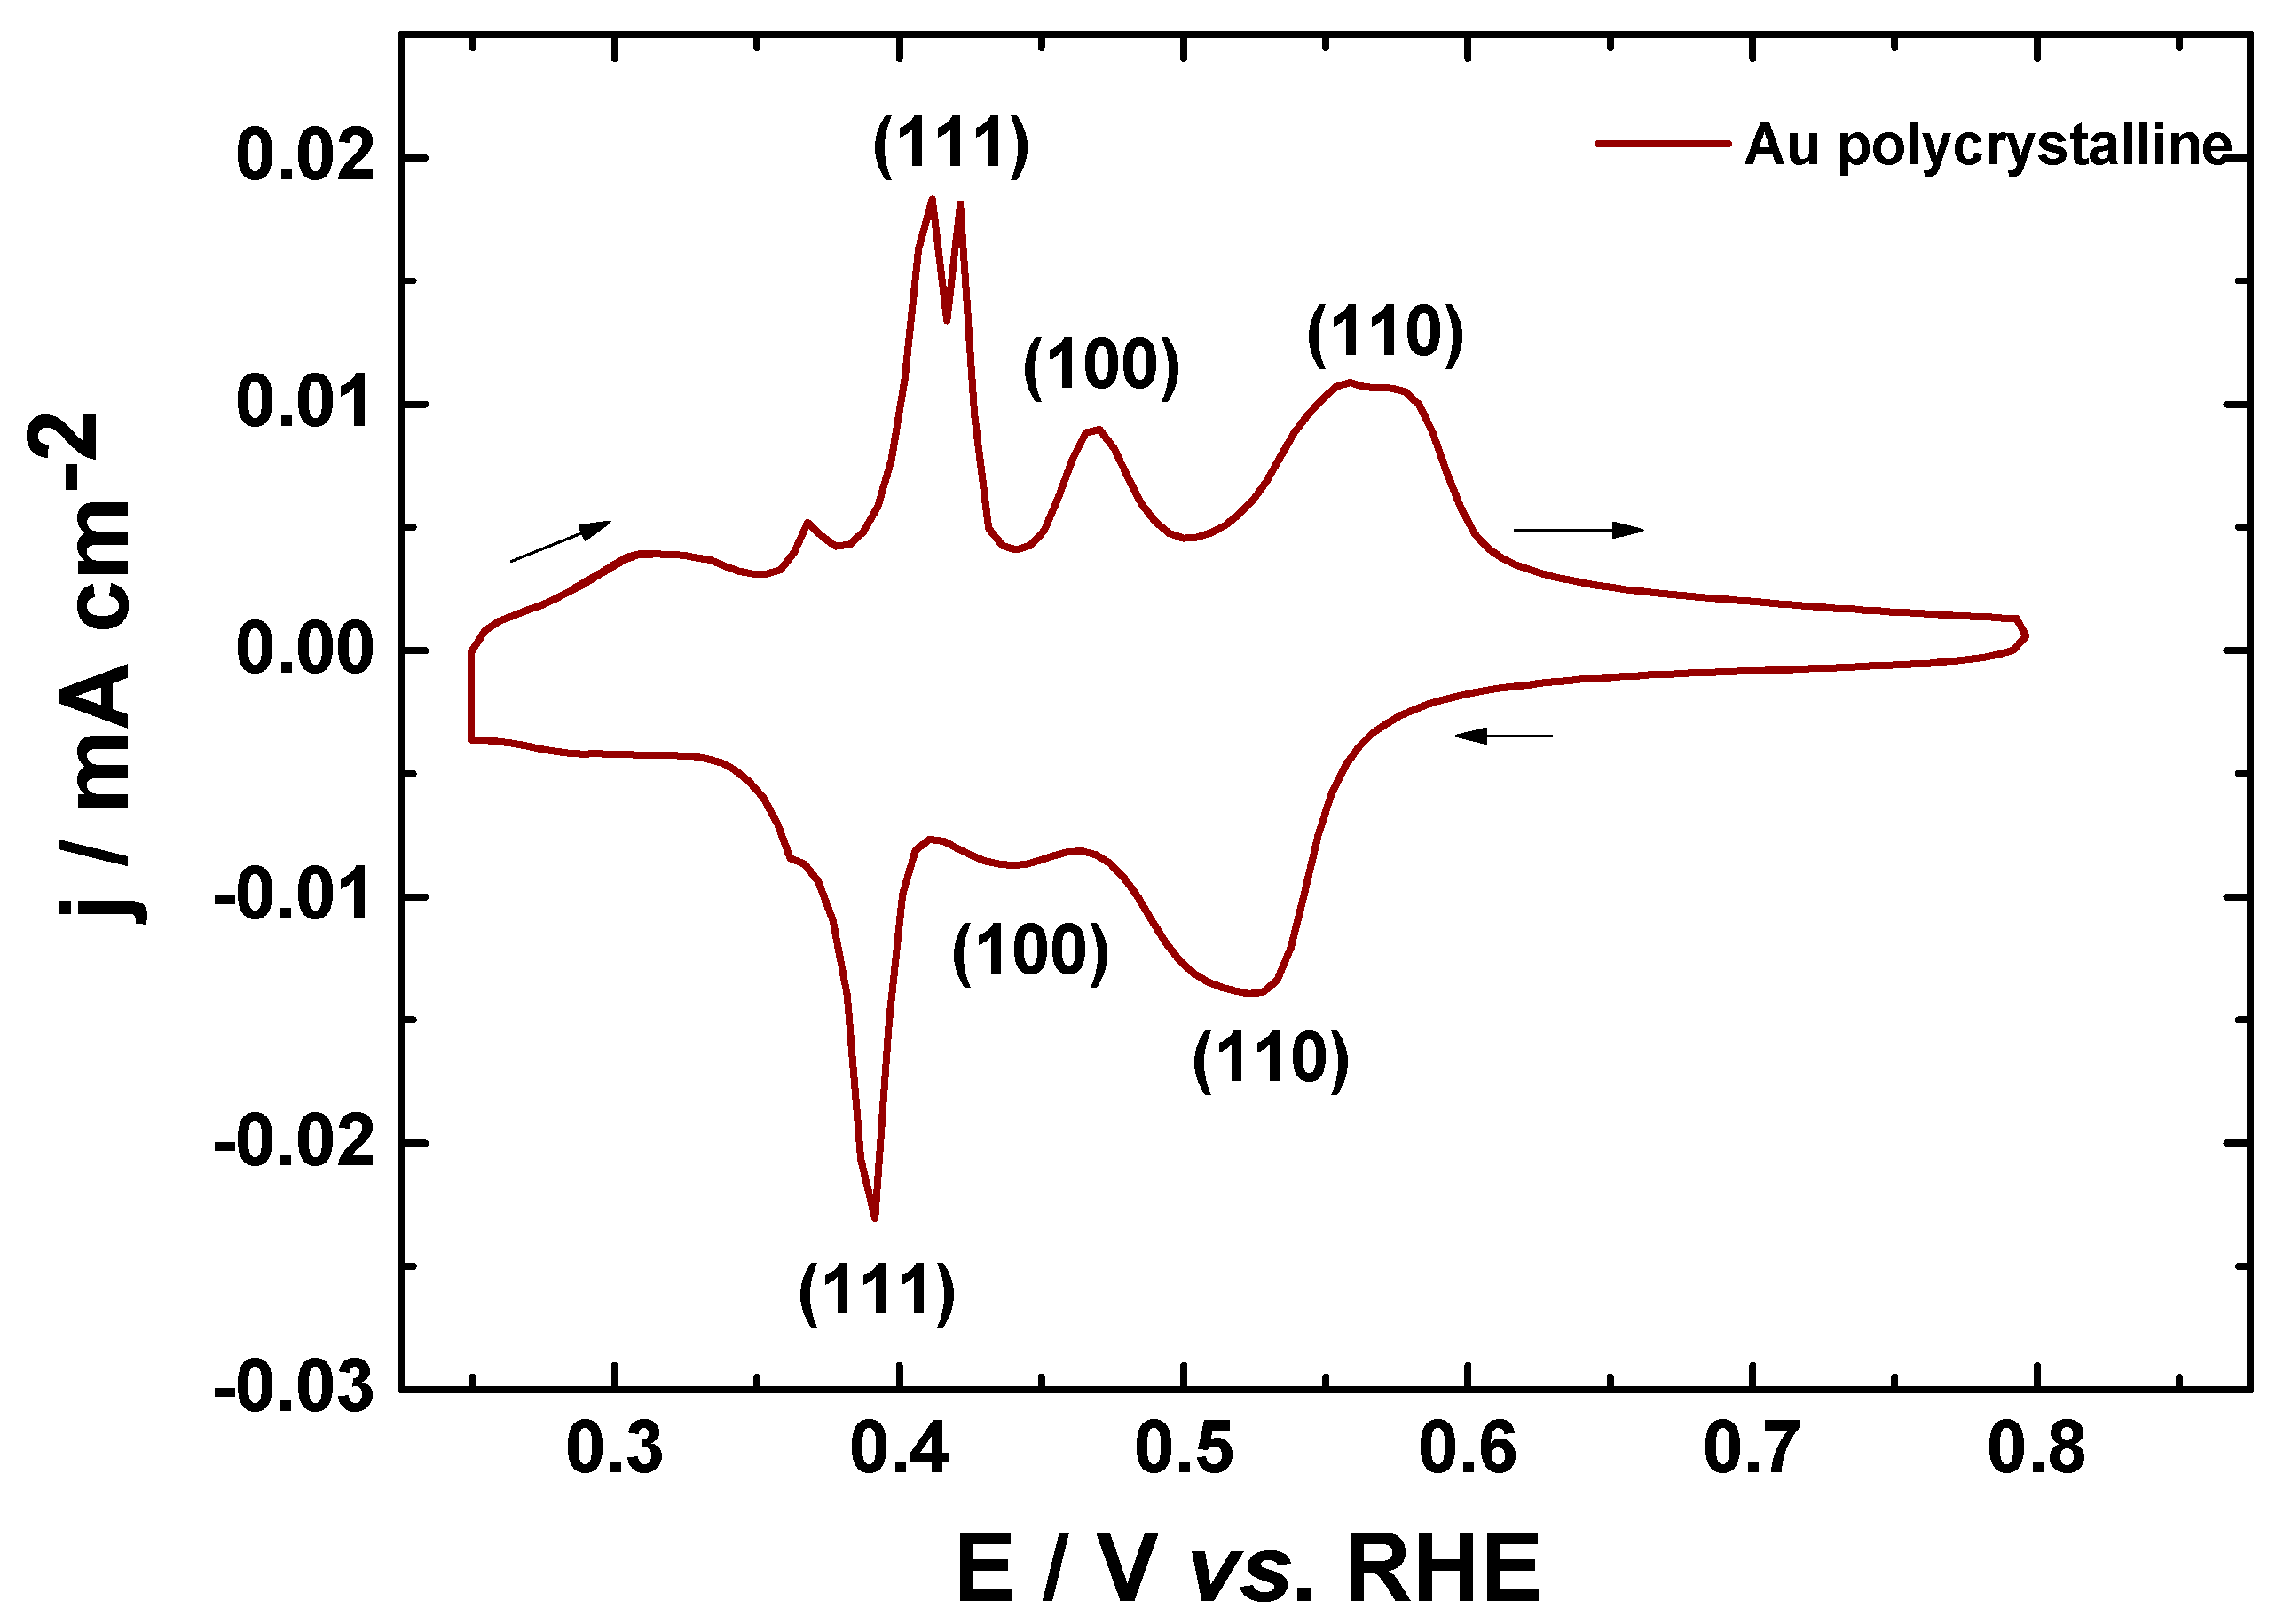
3.1. The Case of Au
3.1.1. Cu on Au
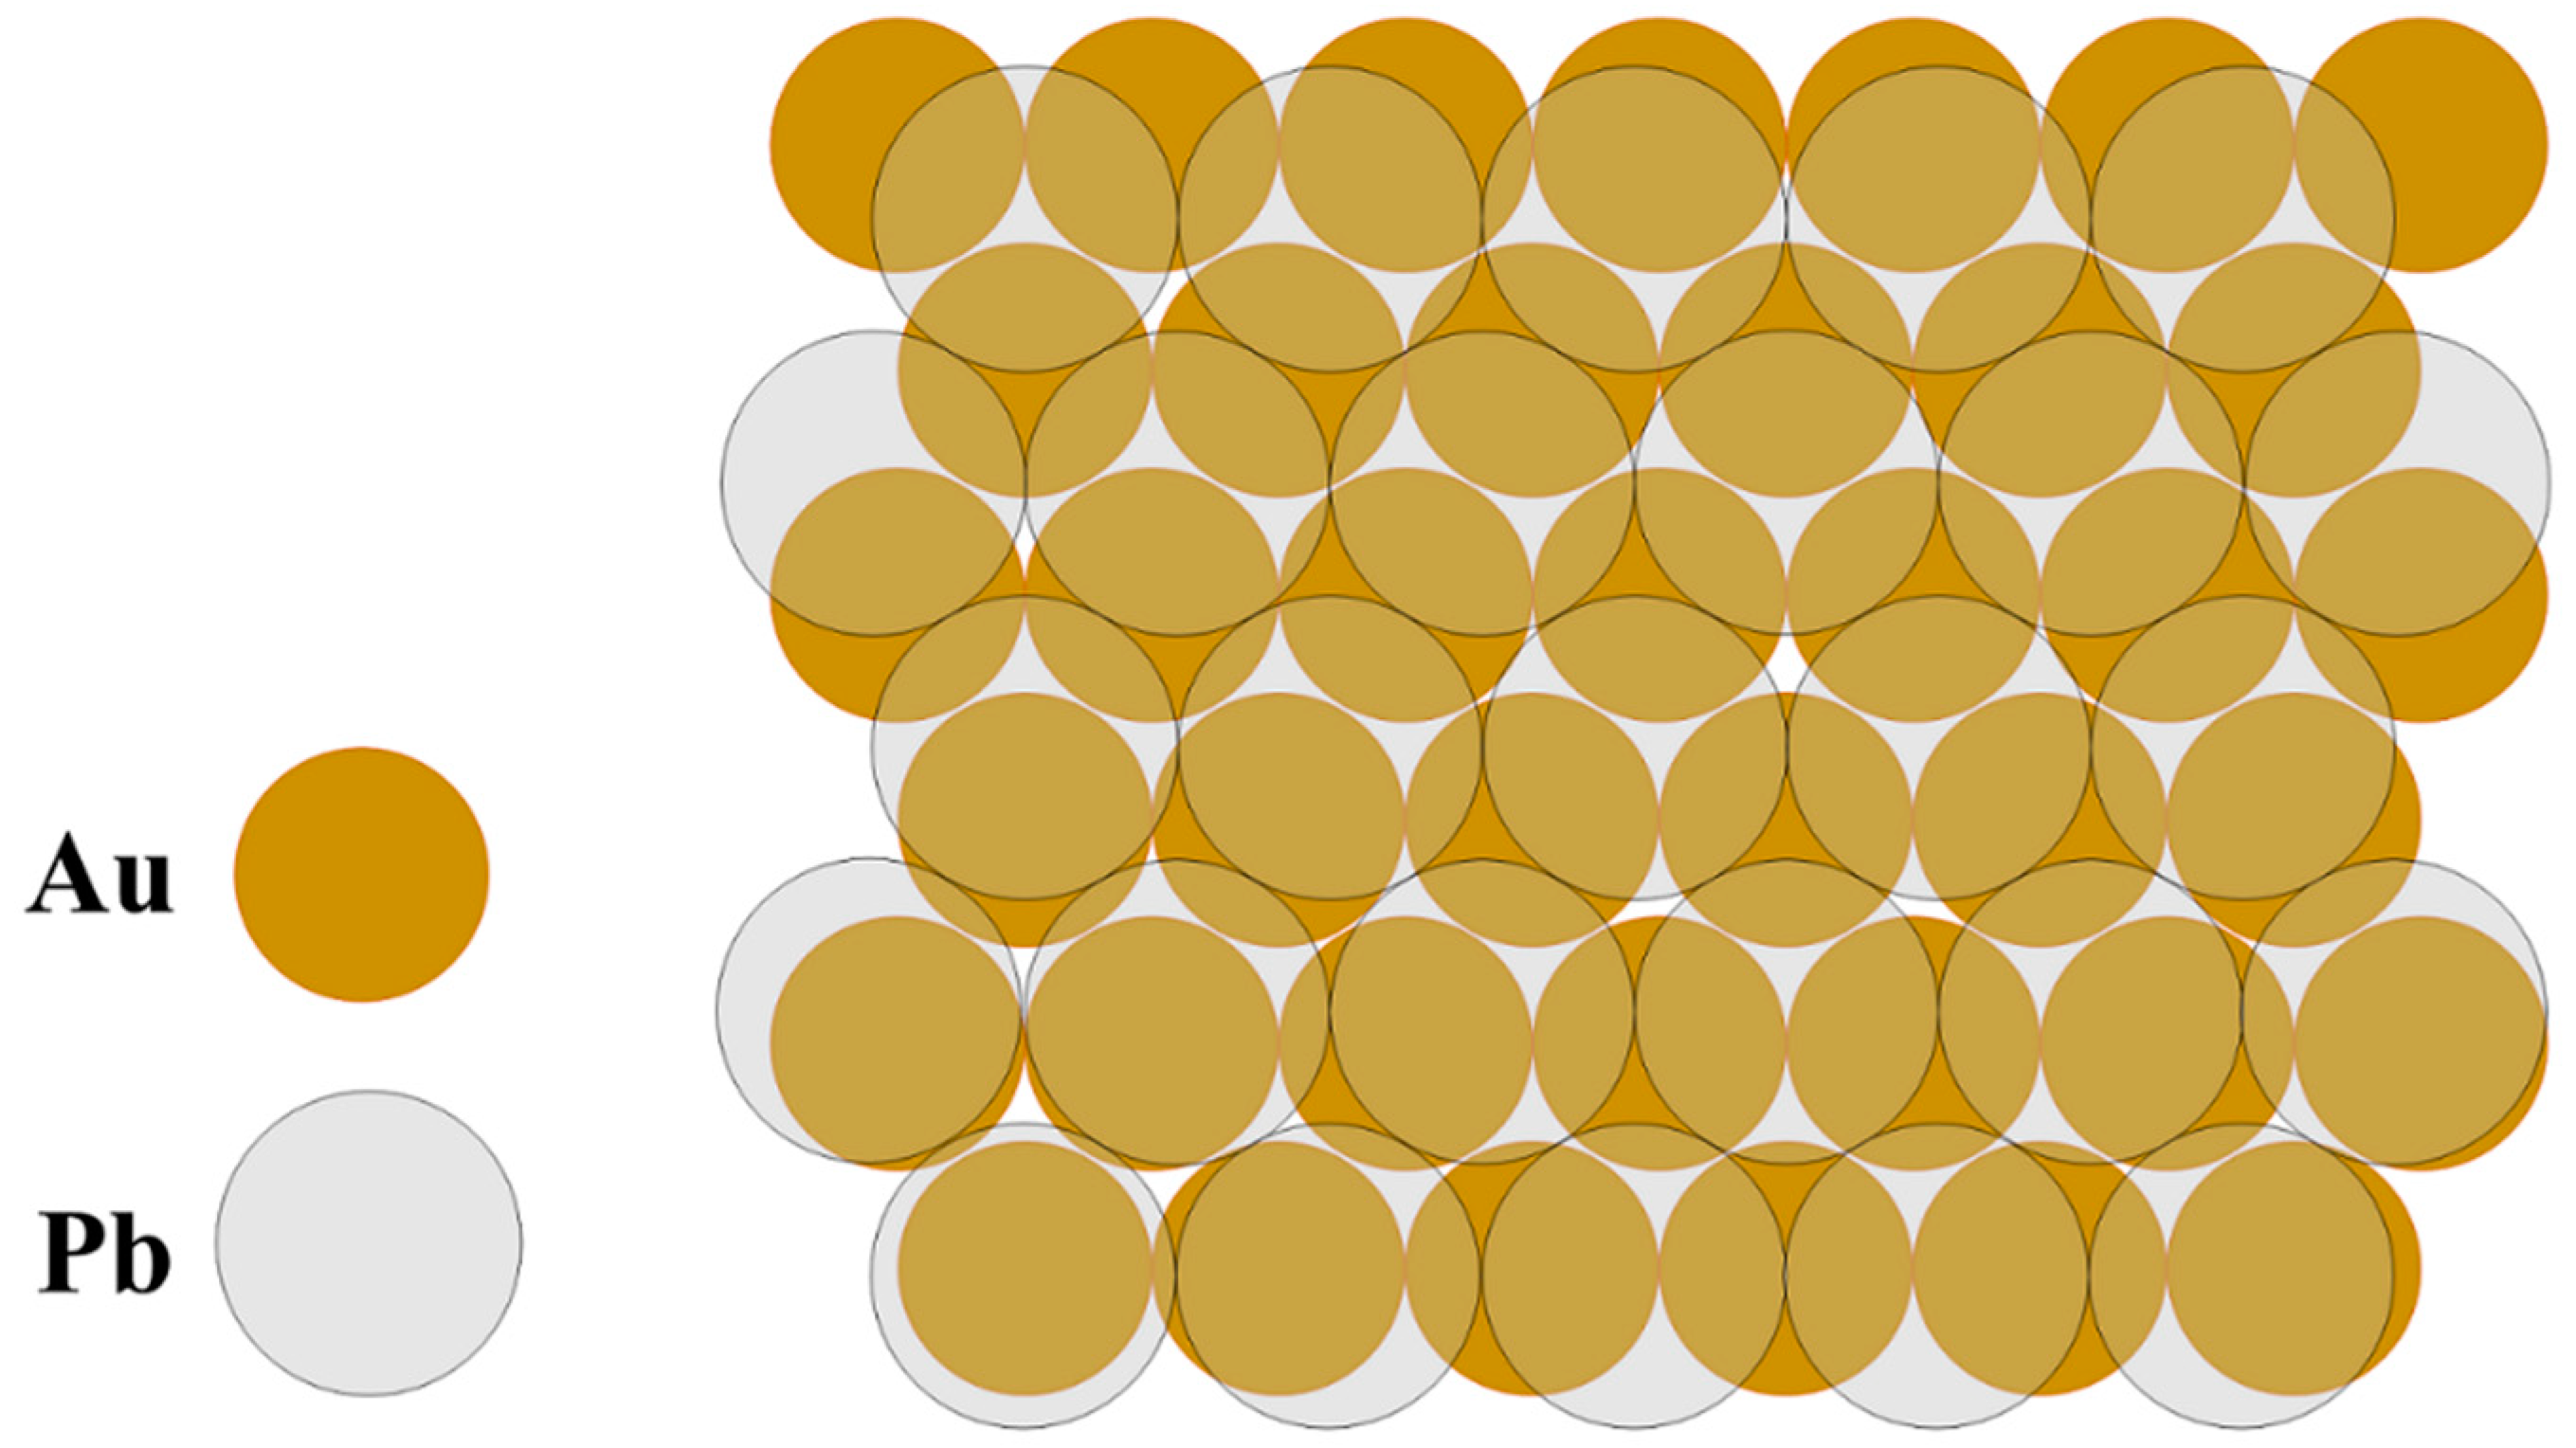
3.1.2. Pb on Au
3.1.3. Probing Gold Nanoparticles Surface by upd
3.2. Case of Pt
3.2.1. Hupd on Pt
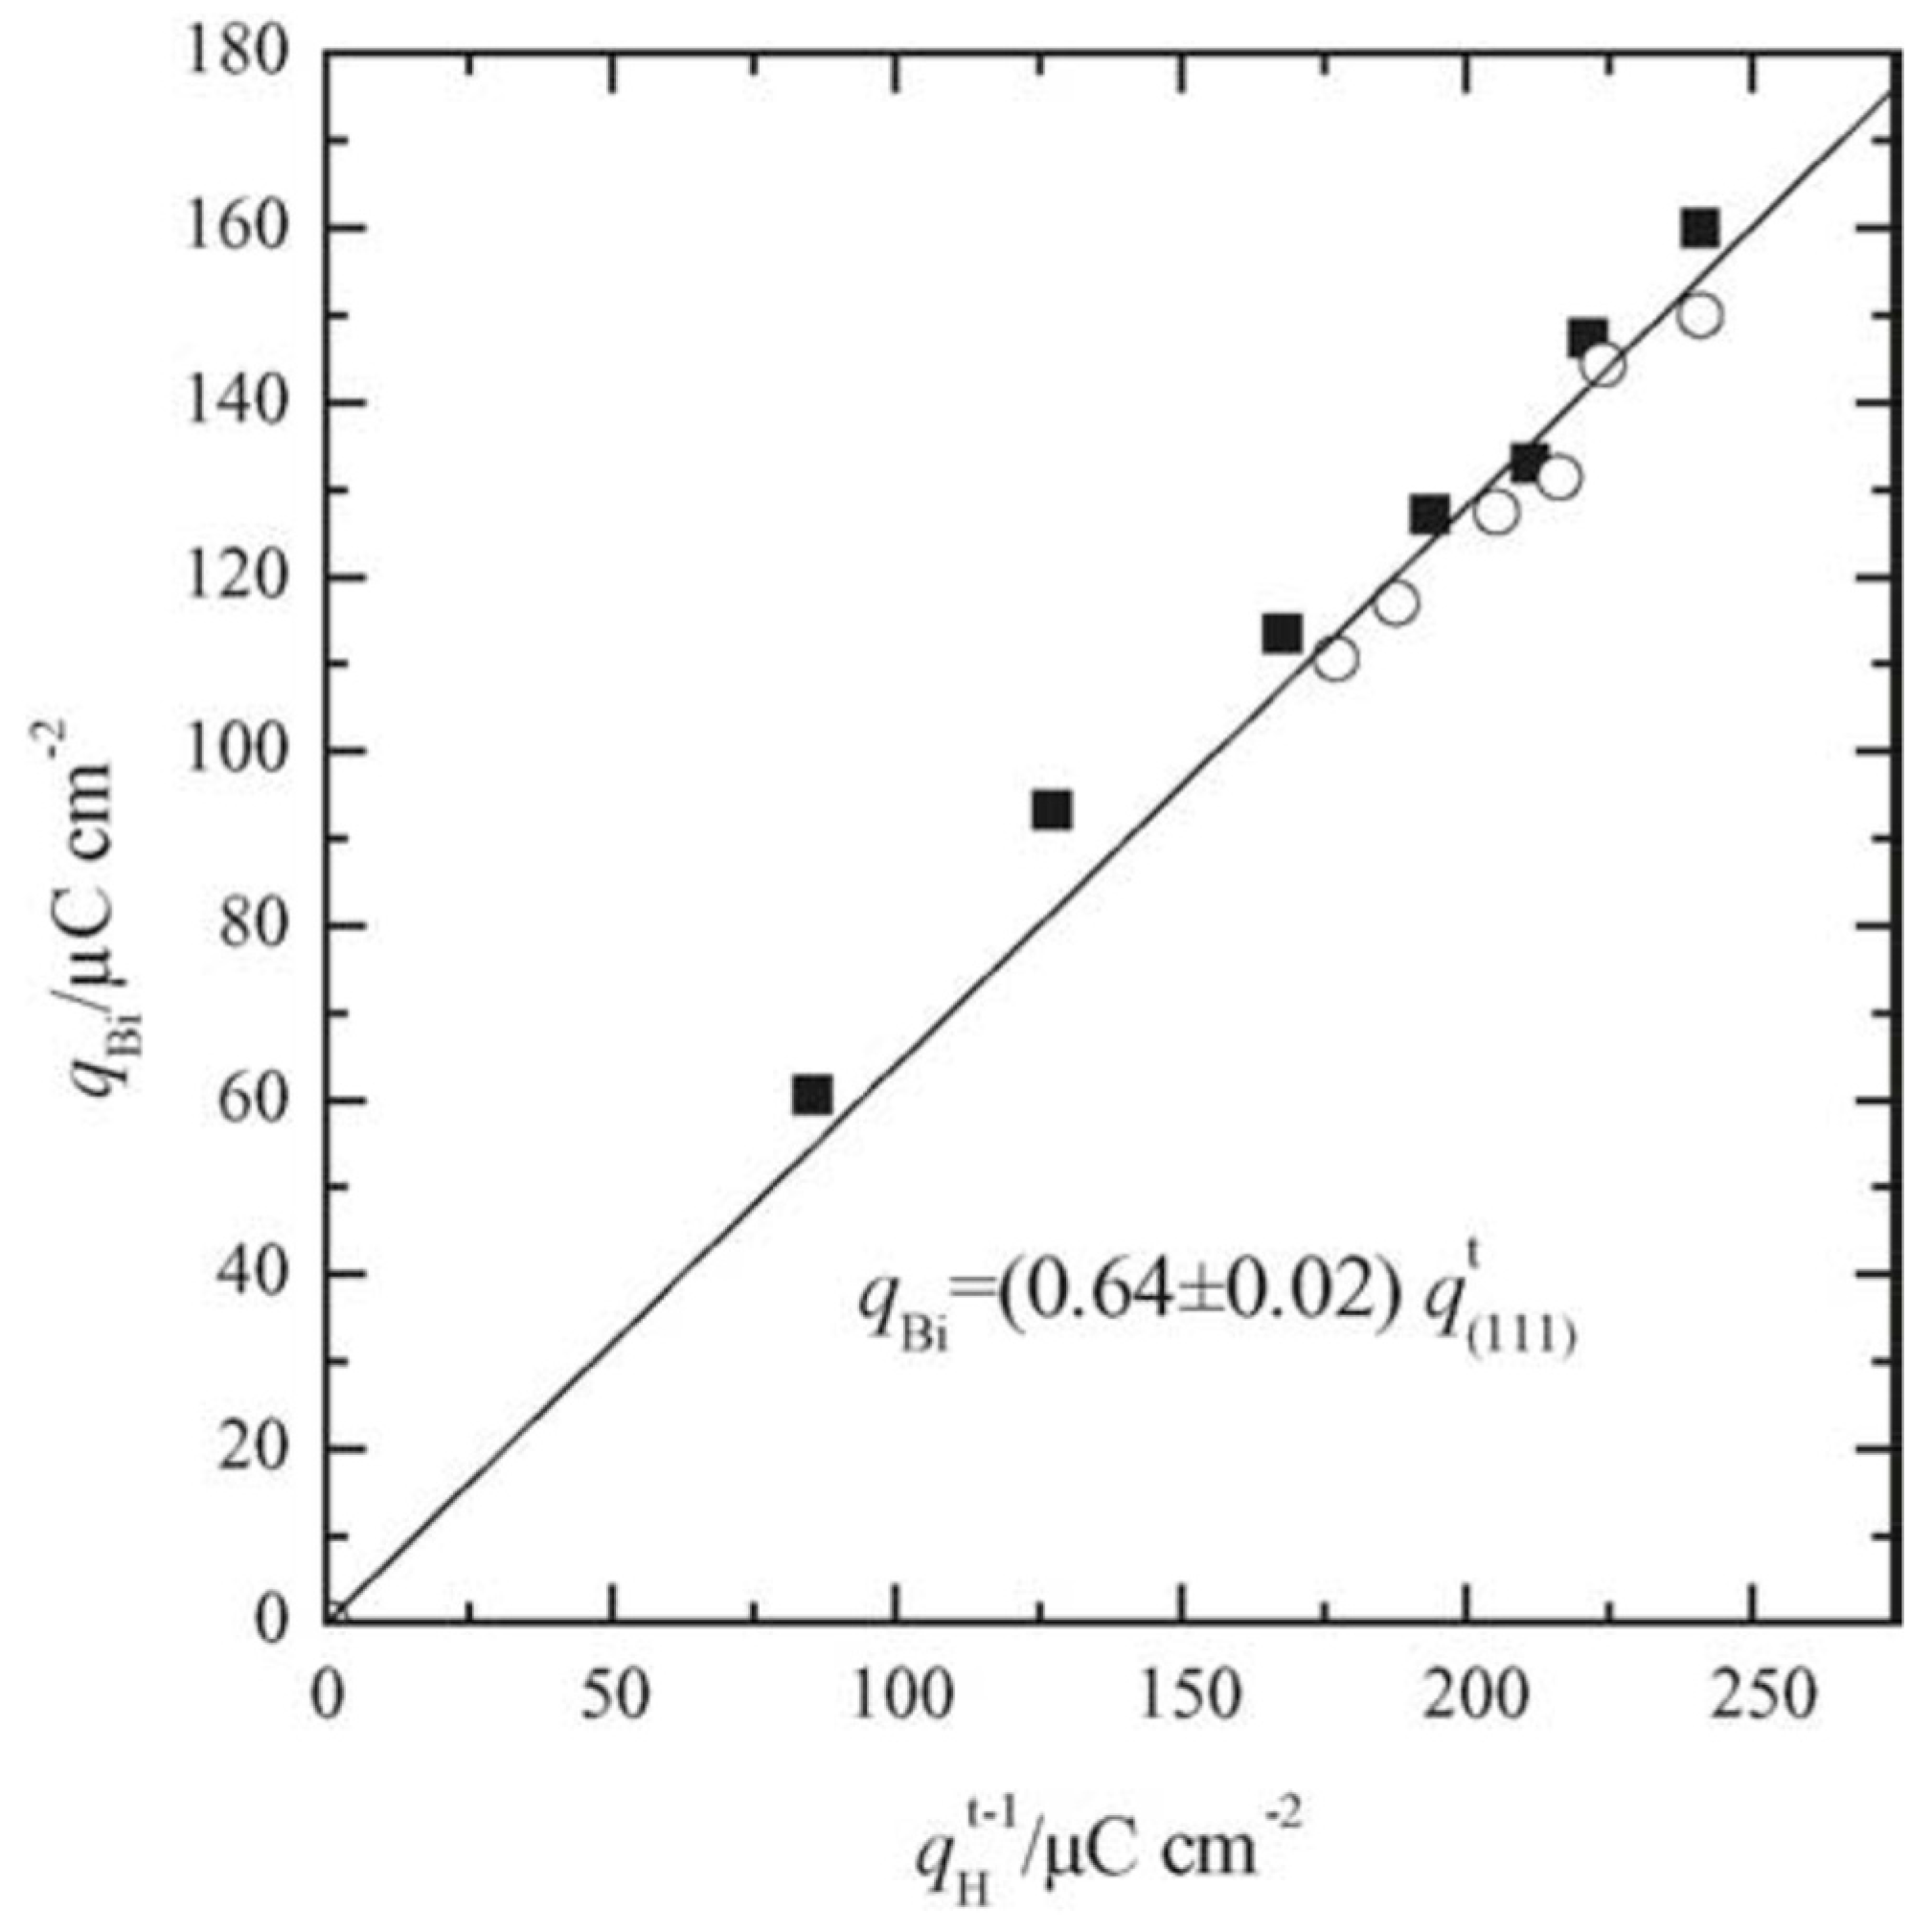
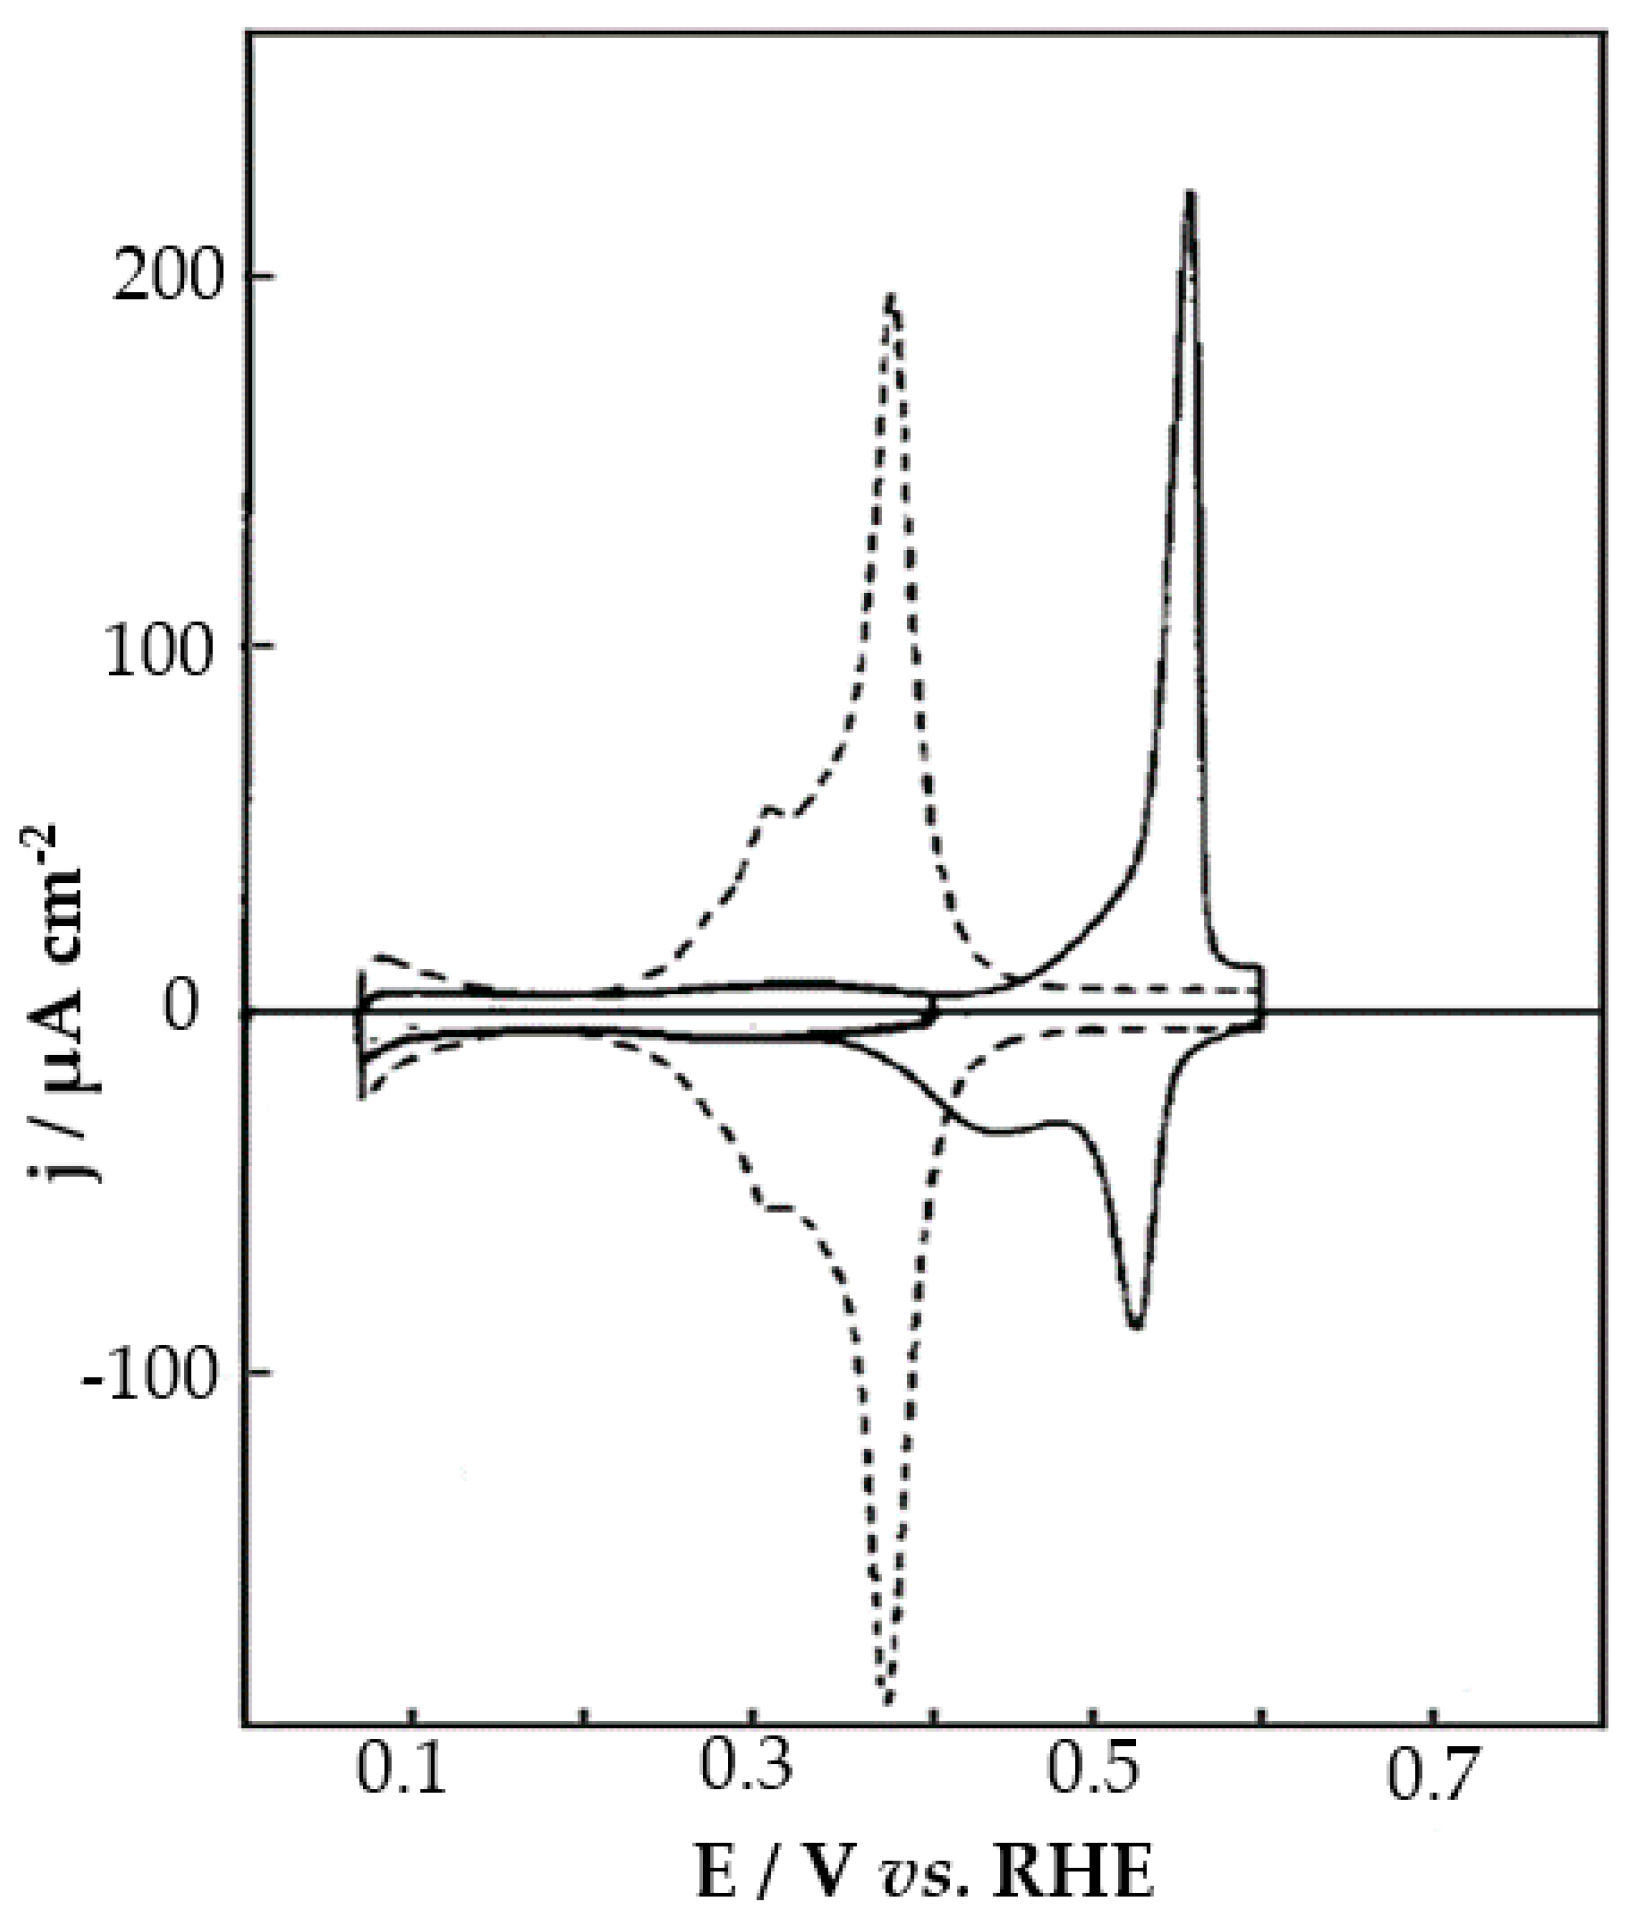
3.2.2. Bi on Pt: A Probe for (1 1 1) Planes
3.2.3. Ge on Pt: A Probe for (1 0 0) Planes
3.2.4. Cu on Pt: A Tool to Characterize Bimetallic Surfaces
3.2.5. Probing the Surface of Pt Nanoparticles
3.3. Case of Pd
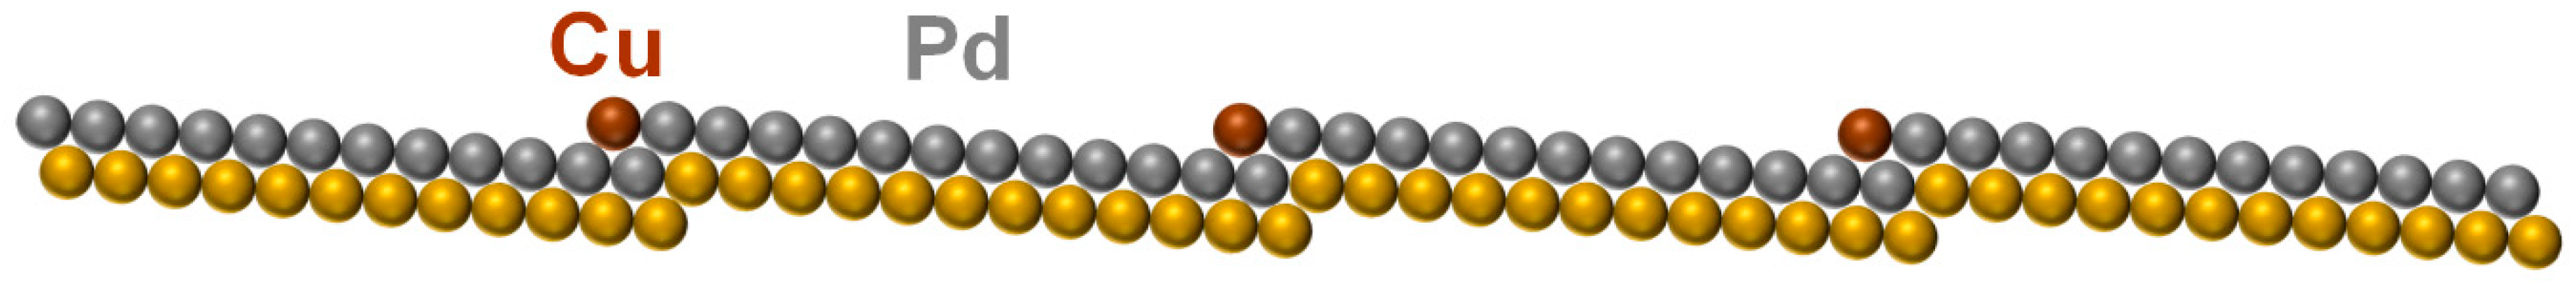
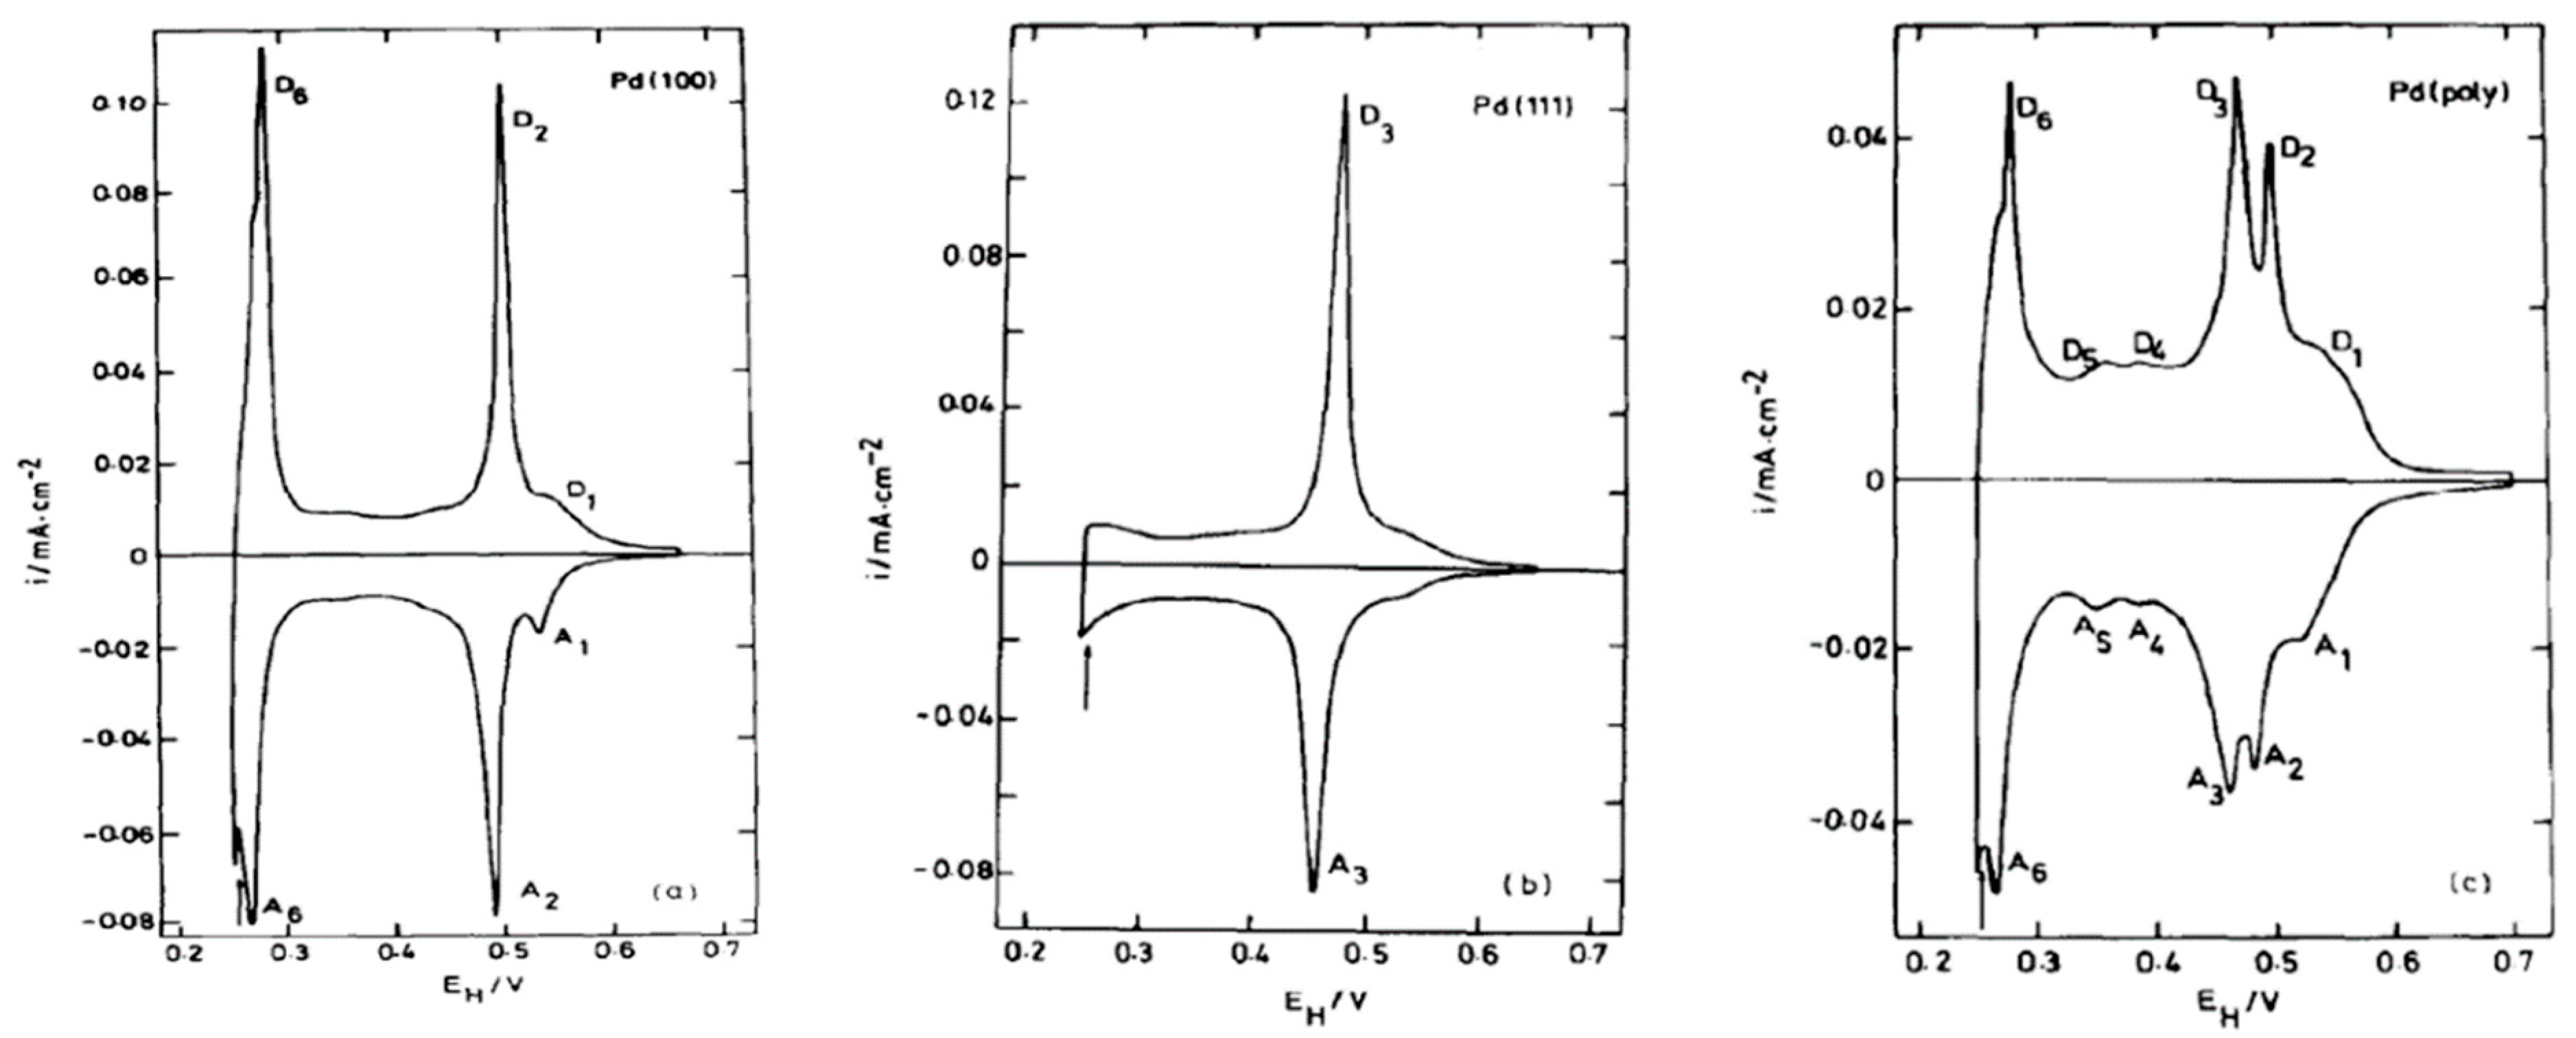
Cu on Pd
4. Conclusions
Author Contributions
Funding
Conflicts of Interest
References
- Scortichnini, C.L.; Reilley, C.N. Surface characterization of Pt electrodes using underpotential deposition of H and Cu: Part I. Pt(100). J. Electroanal. Chem. 1982, 139, 233–245. [Google Scholar] [CrossRef]
- Bockris, J.M.; Nagy, Z.; Damjanovic, A. On the deposition and dissolution of zinc in alkaline solutions. J. Electrochem. Soc. 1972, 119, 285–295. [Google Scholar] [CrossRef]
- Kolb, D.; Przasnyski, M.; Gerischer, H. Underpotential deposition of metals and work function differences. J. Electroanal. Chem. 1974, 54, 25–38. [Google Scholar] [CrossRef]
- Kirowa-Eisner, E.; Bonfil, Y.; Tzur, D.; Gileadi, E. Thermodynamics and kinetics of UPD of lead on polycrystalline silver and gold. J. Electroanal. Chem. 2003, 552, 171–183. [Google Scholar] [CrossRef]
- Szabó, S. Underpotential deposition of metals on foreign metal substrates. Int. Rev. Phys. Chem. 1991, 10, 207–248. [Google Scholar] [CrossRef]
- Swathirajan, S.; Bruckenstein, S. Thermodynamics and kinetics of underpotential deposition of metal monolayers on polycrystalline substrates. Electrochim. Acta 1983, 28, 865–877. [Google Scholar] [CrossRef]
- Leiva, E. Recent developments in the theory of metal upd. Electrochim. Acta 1996, 41, 2185–2206. [Google Scholar] [CrossRef]
- Rojas, M.I.; Dassie, S.A.; Leiva, E.P.M. Theoretical-study about the adsorption of lead on (111), (100), (110) monocrystalline surfaces of gold. Z. Phys. Chem. 1994, 185, 33–50. [Google Scholar] [CrossRef]
- Kolb, D.M.; Schneider, J. Surface reconstruction in electrochemistry: Au(100-(5 × 20), Au(111)-(1 × 23) and Au(110)-(1 × 2). Electrochim. Acta 1986, 31, 929–936. [Google Scholar] [CrossRef]
- Oviedo, O.A.; Reinaudi, L.; García, S.G.; Leiva, E.P.M. Experimental techniques and structure of the underpotential deposition phase. In Underpotential Deposition; Scholz, F., Ed.; Springer: Cham, Switzerland, 2016; pp. 17–89. [Google Scholar]
- Szabó, S.; Bakos, I.; Nagy, F.; Mallát, T. Study of the underpotential deposition of copper onto polycrystalline palladium surfaces. J. Electroanal. Chem. 1989, 263, 137–146. [Google Scholar] [CrossRef]
- Engelsmann, K.; Lorenz, W.J.; Schmidt, E. Underpotential deposition of lead on polycrystalline and single-crystal gold surfaces: Part I. Thermodynamics. J. Electroanal. Chem. 1980, 114, 1–10. [Google Scholar] [CrossRef]
- Garcia, S.; Salinas, D.; Mayer, C.; Schmidt, E.; Staikov, G.; Lorenz, W.J. Ag UPD on Au(100) and Au(111). Electrochim. Acta 1998, 43, 3007–3019. [Google Scholar] [CrossRef]
- Rooryck, V.; Reniers, F.; Buess-Herman, C.; Attard, G.A.; Yang, X. The silver UPD on gold(111) revisited. J. Electroanal. Chem. 2000, 482, 93–101. [Google Scholar] [CrossRef]
- Hachiya, T.; Honbo, H.; Itaya, K. Detailed underpotential deposition of copper on gold(111) in aqueous-solutions. J. Electroanal. Chem. 1991, 315, 275–291. [Google Scholar] [CrossRef]
- Uchida, H.; Hiei, M.; Watanabe, M. Electrochemical quartz crystal microbalance study of copper adatoms on Au(111) electrodes in solutions of perchloric and sulfuric acid. J. Electroanal. Chem. 1998, 452, 97–106. [Google Scholar] [CrossRef]
- Herrero, E.; Glazier, S.; Buller, L.J.; Abruña, H.D. X-ray and electrochemical studies of Cu upd on single crystal electrodes in the presence of bromide: Comparison between Au(111) and Pt(111) electrodes. J. Electroanal. Chem. 1999, 461, 121–130. [Google Scholar] [CrossRef]
- Nakamura, M.; Endo, O.; Ohta, T.; Ito, M.; Yoda, Y. Surface X-ray diffraction study of Cu UPD on Au (1 1 1) electrode in 0.5 M H2SO4 solution: The coadsorption structure of UPD copper, hydration water molecule and bisulfate anion on Au (1 1 1). Surf. Sci. 2002, 514, 227–233. [Google Scholar] [CrossRef]
- Kuzume, A.; Herrero, E.; Feliu, J.M.; Nichols, R.J.; Schiffrin, D.J. Copper underpotential deposition at high index single crystal surfaces of Au. J. Electroanal. Chem. 2004, 570, 157–161. [Google Scholar] [CrossRef]
- Danilov, A.I.; Molodkina, E.B.; Rudnev, A.V.; Polukarov, Y.M.; Feliu, J.M. Kinetics of copper deposition on Pt(111) and Au(111) electrodes in solutions of different acidities. Electrochim. Acta 2005, 50, 5032–5043. [Google Scholar] [CrossRef]
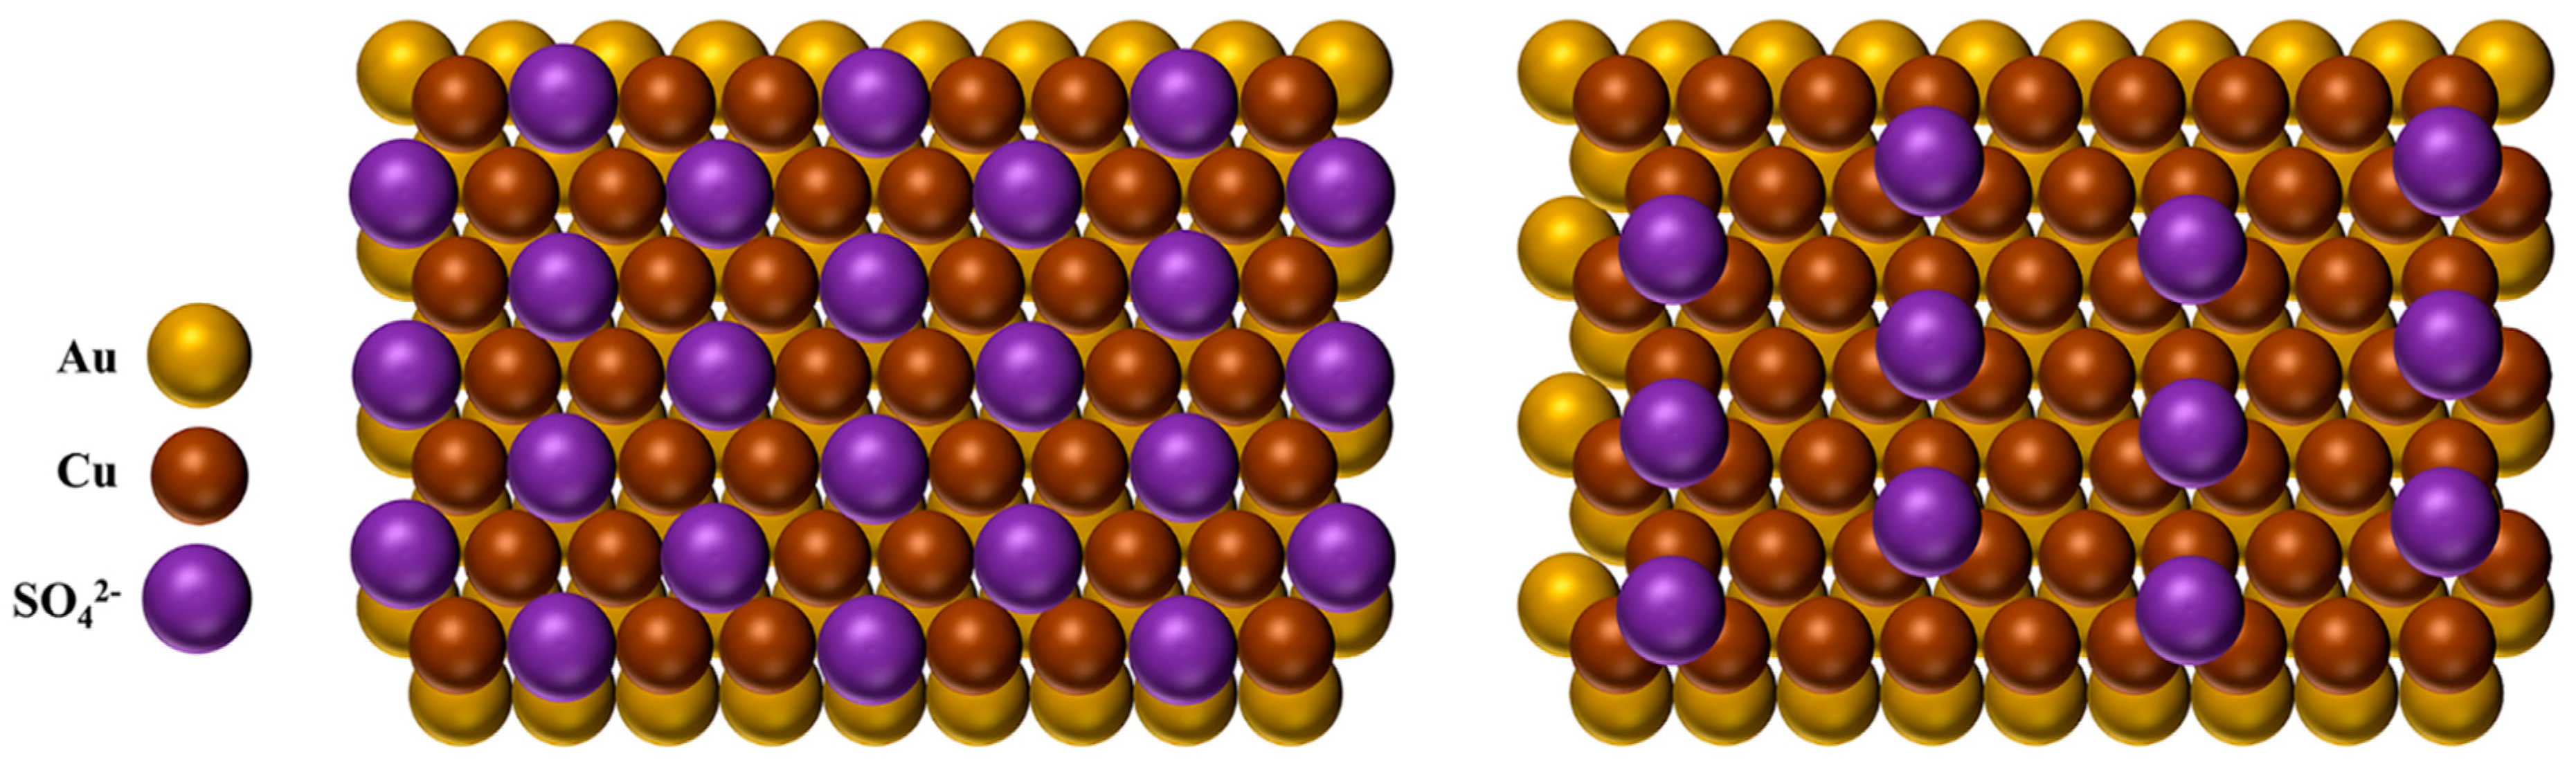
- Madry, B.; Wandelt, K.; Nowicki, M. Deposition of copper and sulfate on Au(111): New insights. Appl. Surf. Sci. 2016, 388, 678–683. [Google Scholar] [CrossRef]
- Madry, B.; Wandelt, K.; Nowicki, M. Sulfate structures on copper deposits on Au(111): In situ STM investigations. Electrochim. Acta 2016, 217, 249–261. [Google Scholar] [CrossRef]
- Sebastián, P.; Gómez, E.; Climent, V.; Feliu, J.M. Copper underpotential deposition at gold surfaces in contact with a deep eutectic solvent: New insights. Electrochem. Commun. 2017, 78, 51–55. [Google Scholar] [CrossRef]
- Yang, M.Z.; Zhang, H.X.; Deng, Q.B. Understanding the copper underpotential deposition process at strained gold surface. Electrochem. Commun. 2017, 82, 125–128. [Google Scholar] [CrossRef]
- Dursun, Z.; Ben Aoun, S.; Taniguchi, I. Electrocatalytic oxidation of D-glucose using a Cd ad-atom-modified Au(111) electrode in alkaline solution. Turk. J. Chem. 2008, 32, 423–430. [Google Scholar]
- Adžić, R.; Yeager, E.; Cahan, B.D. Optical and electrochemical studies of underpotential deposition of lead on gold evaporated and single-crystal electrodes. J. Electrochem. Soc. 1974, 121, 474–484. [Google Scholar] [CrossRef]
- Hamelin, A.; Lipkowski, J. Underpotential deposition of lead on gold single-crystal faces: Part 2. General discussion. J. Electroanal. Chem. 1984, 171, 317–330. [Google Scholar] [CrossRef]
- Hamelin, A. Underpotential deposition of lead on single-crystal faces of gold: Part 1. The influence of crystallographic orientation of the substrate. J. Electroanal. Chem. 1984, 165, 167–180. [Google Scholar] [CrossRef]
- Samant, M.G.; Toney, M.F.; Borges, G.L.; Blum, L.; Melroy, O.R. Grazing incidence x-ray diffraction of lead monolayers at a silver (111) and gold (111) electrode/electrolyte interface. J. Phys. Chem. 1988, 92, 220–225. [Google Scholar] [CrossRef]
- Feliu, J.; Fernandez-Vega, A.; Orts, J.; Aldaz, A. The behaviour of lead and bismuth adatoms on well-defined platinum surfaces. J. Chim. Phys. 1991, 88, 1493–1518. [Google Scholar] [CrossRef]
- Wang, J.X.; Adzic, R.R.; Ocko, B.M. X-ray scattering study of Tl adlayers on the Au(111) electrode in alkaline solutions: Metal monolayer, OH- coadsorption, and oxide formation. J. Phys. Chem. 1994, 98, 7182–7190. [Google Scholar] [CrossRef]
- Wheeler, D.R.; Wang, J.X.; Adžić, R.R. The effects of anions on the underpotential deposition of Tl on Pt(111): A voltammetric study. J. Electroanal. Chem. 1995, 387, 115–119. [Google Scholar] [CrossRef]
- Batchelor-McAuley, C.; Wildgoose, G.G.; Compton, R.G. The contrasting behaviour of polycrystalline bulk gold and gold nanoparticle modified electrodes towards the underpotential deposition of thallium. New J. Chem. 2008, 32, 941–946. [Google Scholar] [CrossRef]
- Rodriguez, P.; García-Aráez, N.; Herrero, E.; Feliu, J.M. New insight on the behavior of the irreversible adsorption and underpotential deposition of thallium on platinum (111) and vicinal surfaces in acid electrolytes. Electrochim. Acta 2015, 151, 319–325. [Google Scholar] [CrossRef] [Green Version]
- Bonfil, Y.; Brand, M.; Kirowa-Eisner, E. Characteristics of subtractive anodic stripping voltammetry of lead, cadmium and thallium at silver-gold alloy electrodes. Electroanalysis 2003, 15, 1369–1376. [Google Scholar] [CrossRef]
- Brust, M.; Ramirez, S.A.; Gordillo, G.J. Site-specific modification of gold nanoparticles by underpotential deposition of cadmium atoms. ChemElectroChem 2018, 5, 1586–1590. [Google Scholar] [CrossRef]
- Abaci, S.; Zhang, L.; Shannon, C. The influence of counter anions on the underpotential deposition of mercury(II) on Au(111): Temperature-dependent studies. J. Electroanal. Chem. 2004, 571, 169–176. [Google Scholar] [CrossRef]
- Rodes, A.; Herrero, E.; Feliu, J.M.; Aldaz, A. Structure sensitivity of irreversibly adsorbed tin on gold single-crystal electrodes in acid media. J. Chem. Soc. Faraday Trans. 1996, 92, 3769–3776. [Google Scholar] [CrossRef]
- Meier, L.A.; Salinas, D.R.; Feliu, J.M.; García, S.G. Spontaneous deposition of Sn on Au(1 1 1). An in situ STM study. Electrochem. Commun. 2008, 10, 1583–1586. [Google Scholar] [CrossRef]
- Szabo, S. Investigations of copper, silver and bismuth deposition on palladium in perchloric acid media. J. Electroanal. Chem. 1977, 77, 193–203. [Google Scholar] [CrossRef]
- Adžić, R.; Jovančićević, V.; Podlavicky, M. Optical and electrochemical study of underpotential deposition of bismuth on gold electrode. Electrochim. Acta 1980, 25, 1143–1146. [Google Scholar] [CrossRef]
- Ganon, J.P.; Clavilier, J. Electrical resistance measurement in electrochemical adsorption experiments of lead and bismuth on thin films of gold. II. Surf. Sci. 1984, 147, 583–598. [Google Scholar] [CrossRef]
- Ganon, J.P.; Clavilier, J. Electrochemical adsorption of lead and bismuth at gold single crystal surfaces with vicinal (111) orientations. I. Surf. Sci. 1984, 145, 487–518. [Google Scholar] [CrossRef]
- Clavilier, J.; Feliu, J.; Aldaz, A. An irreversible structure sensitive adsorption step in bismuth underpotential deposition at platinum electrodes. J. Electroanal. Chem. 1988, 243, 419–433. [Google Scholar] [CrossRef]
- Thiel, K.-O.; Hintze, M.; Vollmer, A.; Donner, C. Bismuth UPD on the modified Au (1 1 1) electrode. J. Electroanal. Chem. 2010, 638, 143–150. [Google Scholar] [CrossRef]
- Gómez, R.; Llorca, M.; Feliu, J.; Aldaz, A. The behaviour of germanium adatoms irreversibly adsorbed on platinum single crystals. J. Electroanal. Chem. 1992, 340, 349–355. [Google Scholar] [CrossRef]
- Rodriguez, P.; Herrero, E.; Solla-Gullon, J.; Vidal-Iglesias, F.J.; Aldaz, A.; Feliu, J.M. Specific surface reactions for identification of platinum surface domains - Surface characterization and electrocatalytic tests. Electrochim. Acta 2005, 50, 4308–4317. [Google Scholar] [CrossRef]
- Rodríguez, P.; Herrero, E.; Solla-Gullón, J.; Vidal-Iglesias, F.; Aldaz, A.; Feliu, J. Electrochemical characterization of irreversibly adsorbed germanium on platinum stepped surfaces vicinal to Pt (1 0 0). Electrochim. Acta 2005, 50, 3111–3121. [Google Scholar] [CrossRef]
- Gooyoung, J.; Choong Kyun, R. Two electrochemical processes for the deposition of Sb on Au(100) and Au(111): Irreversible adsorption and underpotential deposition. J. Electroanal. Chem. 1997, 436, 277–280. [Google Scholar] [CrossRef]
- Chen, Y.; Wang, L.S.; Pradel, A.; Ribes, M.; Record, M.C. A voltammetric study of the underpotential deposition of cobalt and antimony on gold. J. Electroanal. Chem. 2014, 724, 55–61. [Google Scholar] [CrossRef]
- Chen, Y.; Wang, L.S.; Pradel, A.; Merlen, A.; Ribes, M.; Record, M.C. Underpotential deposition of selenium and antimony on gold. J. Solid State Electrochem. 2015, 19, 2399–2411. [Google Scholar] [CrossRef]
- Vaskevich, A.; Sinapi, F.; Mekhalif, Z.; Delhalle, J.; Rubinstein, I. Underpotential deposition of nickel on {111}-textured gold electrodes in dimethyl sulfoxide. J. Electrochem. Soc. 2005, 152, C744–C750. [Google Scholar] [CrossRef]
- Hebie, S.; Napporn, T.W.; Kokoh, K.B. Beneficial promotion of underpotentially deposited lead adatoms on gold nanorods toward glucose electrooxidation. Electrocatalysis 2017, 8, 67–73. [Google Scholar] [CrossRef]
- Alvarez-Rizatti, M.; Jüttner, K. Electrocatalysis of oxygen reduction by UPD of lead on gold single-crystal surfaces. J. Electroanal. Chem. 1983, 144, 351–363. [Google Scholar] [CrossRef]
- Parpot, P.; Kokoh, K.B.; Beden, B.; Belgsir, E.M.; Leger, J.M.; Lamy, C. Selective electrocatalytic oxidation of sucrose on smooth and upd-lead modified platinum-electrodes in alkaline-medium. Stud. Surf. Sci. Catal. 1993, 78, 439–445. [Google Scholar]
- Kokoh, K.; Léger, J.-M.; Beden, B.; Lamy, C. “On line” chromatographic analysis of the products resulting from the electrocatalytic oxidation of d-glucose on Pt, Au and adatoms modified Pt electrodes—Part I. Acid and neutral media. Electrochim. Acta 1992, 37, 1333–1342. [Google Scholar] [CrossRef]
- Chen, H.M.; Xing, Z.L.; Zhu, S.Q.; Zhang, L.L.; Chang, Q.W.; Huang, J.L.; Cai, W.B.; Kang, N.; Zhong, C.J.; Shao, M.H. Palladium modified gold nanoparticles as electrocatalysts for ethanol electrooxidation. J. Power Sources 2016, 321, 264–269. [Google Scholar] [CrossRef]
- Vélez, P.; Cuesta, A.; Leiva, E.P.M.; Macagno, V.A. The underpotential deposition that should not be: Cu(1 × 1) on Au(111). Electrochem. Commun. 2012, 25, 54–57. [Google Scholar] [CrossRef]
- Möller, F.; Magnussen, O.M.; Behm, R.J. CuCl adlayer formation and Cl induced surface alloying: An in situ STM study on Cu underpotential deposition on Au(110) electrode surfaces. Electrochim. Acta 1995, 40, 1259–1265. [Google Scholar] [CrossRef]
- Holzle, M.H.; Zwing, V.; Kolb, D.M. The influence of steps on the deposition of Cu onto Au(111). Electrochim. Acta 1995, 40, 1237–1247. [Google Scholar] [CrossRef]
- Hasegawa, Y.; Avouris, P. Manipulation of the reconstruction of the Au(111) surface with the STM. Science 1992, 258, 1763–1765. [Google Scholar] [CrossRef] [PubMed]
- Nichols, R.J.; Kolb, D.M.; Behm, R.J. STM observations of the initial stages of copper deposition on gold single-crystal electrodes. J. Electroanal. Chem. 1991, 313, 109–119. [Google Scholar] [CrossRef]
- Magnussen, O.M.; Hotlos, J.; Nichols, R.J.; Kolb, D.M.; Behm, R.J. Atomic structure of Cu adlayers on Au(100) and Au(111) electrodes observed by in situ scanning tunneling microscopy. Phys. Rev. Lett. 1990, 64, 2929–2932. [Google Scholar] [CrossRef]
- Kongstein, O.E.; Bertocci, U.; Stafford, G.R. In situ stress measurements during copper electrodeposition on (111)-textured Au. J. Electrochem. Soc. 2005, 152, C116–C123. [Google Scholar] [CrossRef]
- Hagenström, H.; Schneeweiss, M.A.; Kolb, D.M. Copper underpotential deposition on ethanethiol-modified Au(111) electrodes: Kinetic effects. Electrochim. Acta 1999, 45, 1141–1145. [Google Scholar] [CrossRef]
- Deng, Q.; Smetanin, M.; Weissmüller, J. Mechanical modulation of reaction rates in electrocatalysis. J. Catal. 2014, 309, 351–361. [Google Scholar] [CrossRef] [Green Version]
- Akhade, S.A.; McCrum, I.T.; Janik, M.J. The impact of specifically adsorbed ions on the copper-catalyzed electroreduction of CO2. J. Electrochem. Soc. 2016, 163, F477–F484. [Google Scholar] [CrossRef]
- Mrozek, P.; Sung, Y.-E.; Han, M.; Gamboa-Aldeco, M.; Wieckowski, A.; Chen, C.-H.; Gewirth, A.A. Coadsorption of sulfate anions and silver adatoms on the Au (111) single crystal electrode. Ex situ and in situ comparison. Electrochim. Acta 1995, 40, 17–28. [Google Scholar] [CrossRef]
- Rouya, E.; Cattarin, S.; Reed, M.L.; Kelly, R.G.; Zangari, G. Electrochemical characterization of the surface area of nanoporous gold films. J. Electrochem. Soc. 2012, 159, K97–K102. [Google Scholar] [CrossRef]
- Hernandez, F.; Baltruschat, H. Hydrogen evolution and CuUPD at stepped gold single crystals modified with Pd. J. Solid State Electrochem. 2007, 11, 877–885. [Google Scholar] [CrossRef]
- Hamelin, A.; Katayama, A.; Picq, G.; Vennereau, P. Surface characterization by underpotential deposition—Lead on gold surfaces. J. Electroanal. Chem. 1980, 113, 293–300. [Google Scholar] [CrossRef]
- Hamelin, A.; Katayama, A. Lead underpotential deposition on gold single-crystal surfaces—The (100) face and its vicinal faces. J. Electroanal. Chem. 1981, 117, 221–232. [Google Scholar] [CrossRef]
- Hamelin, A. Lead adsorption on gold single-crystal stepped surfaces. J. Electroanal. Chem. 1979, 101, 285–290. [Google Scholar] [CrossRef]
- Hebie, S.; Cornu, L.; Napporn, T.W.; Rousseau, J.; Kokoh, B.K. Insight on the surface structure effect of free gold nanorods on glucose electrooxidation. J. Phys. Chem. C 2013, 117, 9872–9880. [Google Scholar] [CrossRef]
- Hernandez, J.; Solla-Gullon, J.; Herrero, E. Gold nanoparticles synthesized in a water-in-oil microemulsion: Electrochemical characterization and effect of the surface structure on the oxygen reduction reaction. J. Electroanal. Chem. 2004, 574, 185–196. [Google Scholar] [CrossRef]
- Yu, L.; Akolkar, R. Lead underpotential deposition for the surface characterization of silver ad-atom modified gold electrocatalysts for glucose oxidation. J. Electroanal. Chem. 2017, 792, 61–65. [Google Scholar] [CrossRef]
- Hernandez, J.; Solla-Gullon, J.; Herrero, E.; Feliu, J.M.; Aldaz, A. In situ surface characterization and oxygen reduction reaction on shape-controlled gold nanoparticles. J. Nanosci. Nanotechnol. 2009, 9, 2256–2273. [Google Scholar] [CrossRef]
- Hebie, S.; Kokoh, K.B.; Servat, K.; Napporn, T.W. Shape-dependent electrocatalytic activity of free gold nanoparticles toward glucose oxidation. Gold Bull. 2013, 46, 311–318. [Google Scholar] [CrossRef] [Green Version]
- Hebie, S.; Napporn, T.W.; Morais, C.; Kokoh, K.B. Size-dependent electrocatalytic activity of free gold nanoparticles for the glucose oxidation reaction. ChemPhysChem 2016, 17, 1454–1462. [Google Scholar] [CrossRef] [PubMed]
- Niu, W.X.; Zheng, S.L.; Wang, D.W.; Liu, X.Q.; Li, H.J.; Han, S.A.; Chen, J.; Tang, Z.Y.; Xu, G.B. Selective synthesis of single-crystalline rhombic dodecahedral, octahedral, and cubic gold nanocrystals. J. Am. Chem. Soc. 2009, 131, 697–703. [Google Scholar] [CrossRef] [PubMed]
- Jeyabharathi, C.; Zander, M.; Scholz, F. Underpotential deposition of lead on quasi-spherical and faceted gold nanoparticles. J. Electroanal. Chem. 2018, 819, 159–162. [Google Scholar] [CrossRef]
- Schultze, J.; Dickertmann, D. Potentiodynamic desorption spectra of metallic monolayers of Cu, Bi, Pb, Tl, and Sb adsorbed at (111), (100), and (110) planes of gold electrodes. Surf. Sci. 1976, 54, 489–505. [Google Scholar] [CrossRef]
- Lu, F.; Zhang, Y.; Liu, S.Z.; Lu, D.Y.; Su, D.; Liu, M.Z.; Zhang, Y.G.; Liu, P.; Wang, J.X.; Adzic, R.R.; et al. Surface proton transfer promotes four-electron oxygen reduction on gold nanocrystal surfaces in alkaline solution. J. Am. Chem. Soc. 2017, 139, 7310–7317. [Google Scholar] [CrossRef]
- Zhang, Y.; Lu, F.; Liu, S.; Lu, D.; Su, D.; Liu, M.; Zhang, Y.; Liu, P.; Wang, J.X.; Adzic, R.R. Oxygen reduction on gold nanocrystal surfaces in alkaline electrolyte: Evidence for surface proton transfer effects. ECS Trans. 2018, 85, 93–110. [Google Scholar] [CrossRef]
- Conway, B.; Angerstein-Kozlowska, H.; Sharp, W.; Criddle, E. Ultrapurification of water for electrochemical and surface chemical work by catalytic pyrodistillation. Anal. Chem. 1973, 45, 1331–1336. [Google Scholar] [CrossRef]
- Zolfaghari, A.; Chayer, M.; Jerkiewicz, G. Energetics of the underpotential deposition of hydrogen on platinum electrodes I. Absence of coadsorbed species. J. Electrochem. Soc. 1997, 144, 3034–3041. [Google Scholar] [CrossRef]
- Clavilier, J.; Orts, J.M.; Gómez, R.; Feliu, J.M.; Aldaz, A. Comparison of electrosorption at activated polycrystalline and Pt(531) kinked platinum electrodes: Surface voltammetry and charge displacement on potentiostatic CO adsorption. J. Electroanal. Chem. 1996, 404, 281–289. [Google Scholar] [CrossRef]
- Chen, Q.-S.; Solla-Gullón, J.; Sun, S.-G.; Feliu, J.M. The potential of zero total charge of Pt nanoparticles and polycrystalline electrodes with different surface structure: The role of anion adsorption in fundamental electrocatalysis. Electrochim. Acta 2010, 55, 7982–7994. [Google Scholar] [CrossRef]
- Maillard, F.; Savinova, E.R.; Stimming, U. CO monolayer oxidation on Pt nanoparticles: Further insights into the particle size effects. J. Electroanal. Chem. 2007, 599, 221–232. [Google Scholar] [CrossRef]
- Green, C.L.; Kucernak, A. Determination of the platinum and ruthenium surface areas in platinum−ruthenium alloy electrocatalysts by underpotential deposition of copper. I. Unsupported catalysts. J. Phys. Chem. B 2002, 106, 1036–1047. [Google Scholar] [CrossRef]
- Herrero, E.; Climent, V.C.; Feliu, J.M. On the different adsorption behavior of bismuth, sulfur, selenium and tellurium on a Pt (775) stepped surface. Electrochem. Commun. 2000, 2, 636–640. [Google Scholar] [CrossRef]
- Molodkina, E.; Danilov, A.; Feliu, J.M. Cu UPD at Pt (100) and stepped faces Pt (610), Pt (410) of platinum single crystal electrodes. Russ. J. Electrochem. 2016, 52, 890–900. [Google Scholar] [CrossRef]
- Markovic, N.; Ross, P. Effect of anions on the underpotential deposition of copper on platinum (111) and platinum (100) surfaces. Langmuir 1993, 9, 580–590. [Google Scholar] [CrossRef]
- Fiçicioǧlu, F.; Kadirgan, F. Characterization of a Pt+ Pd alloy electrode by underpotential deposition of copper. J. Electroanal. Chem. 1993, 346, 187–196. [Google Scholar] [CrossRef]
- Solla-Gullón, J.; Vidal-Iglesias, F.; Herrero, E.; Feliu, J.; Aldaz, A. CO monolayer oxidation on semi-spherical and preferentially oriented (1 0 0) and (1 1 1) platinum nanoparticles. Electrochem. Commun. 2006, 8, 189–194. [Google Scholar] [CrossRef]
- Solla-Gullón, J.; Rodríguez, P.; Herrero, E.; Aldaz, A.; Feliu, J.M. Surface characterization of platinum electrodes. Phys. Chem. Chem. Phys. 2008, 10, 1359–1373. [Google Scholar] [CrossRef]
- Coutanceau, C.; Urchaga, P.; Baranton, S. Diffusion of adsorbed CO on platinum (100) and (111) oriented nanosurfaces. Electrochem. Commun. 2012, 22, 109–112. [Google Scholar] [CrossRef]
- Solla-Gullón, J.; Vidal-Iglesias, F.; Rodriguez, P.; Herrero, E.; Feliu, J.; Clavilier, J.; Aldaz, A. In situ surface characterization of preferentially oriented platinum nanoparticles by using electrochemical structure sensitive adsorption reactions. J. Phys. Chem. B 2004, 108, 13573–13575. [Google Scholar] [CrossRef]
- Chierchie, T.; Mayer, C.; Lorenz, W. Structural changes of surface oxide layers on palladium. J. Electroanal. Chem. 1982, 135, 211–220. [Google Scholar] [CrossRef]
- Chierchie, T.; Mayer, C. Voltammetric study of the underpotential deposition of copper on polycrystalline and single crystal palladium surfaces. Electrochim. Acta 1988, 33, 341–345. [Google Scholar] [CrossRef]


© 2019 by the authors. Licensee MDPI, Basel, Switzerland. This article is an open access article distributed under the terms and conditions of the Creative Commons Attribution (CC BY) license (http://creativecommons.org/licenses/by/4.0/).
Share and Cite
Mayet, N.; Servat, K.; Kokoh, K.B.; Napporn, T.W. Probing the Surface of Noble Metals Electrochemically by Underpotential Deposition of Transition Metals. Surfaces 2019, 2, 257-276. https://doi.org/10.3390/surfaces2020020
Mayet N, Servat K, Kokoh KB, Napporn TW. Probing the Surface of Noble Metals Electrochemically by Underpotential Deposition of Transition Metals. Surfaces. 2019; 2(2):257-276. https://doi.org/10.3390/surfaces2020020
Chicago/Turabian StyleMayet, Nolwenn, Karine Servat, K. Boniface Kokoh, and Teko W. Napporn. 2019. "Probing the Surface of Noble Metals Electrochemically by Underpotential Deposition of Transition Metals" Surfaces 2, no. 2: 257-276. https://doi.org/10.3390/surfaces2020020