Article

An Electrochemical Route for Hot Alkaline Blackening of Steel: A Nitrite Free Approach

Institute of Electrochemistry, Ulm University, Albert-Einstein-Allee 47, 89081 Ulm, Germany
*
Author to whom correspondence should be addressed.
Surfaces 2019, 2(2), 216-228; https://doi.org/10.3390/surfaces2020017
Submission received: 23 February 2019 / Revised: 23 March 2019 / Accepted: 26 March 2019 / Published: 29 March 2019
(This article belongs to the Special Issue Electrochemical Surface Science: Basics and Applications)

Abstract

:
Blackening belongs to the predominant technological processes in preserving steel surfaces from corrosion by generating a protective magnetite overlayer. In place of the commonly used dipping-procedure into nitrite-containing blackening baths at boiling temperatures that are far above 100 °C, here we describe a more environmentally friendly electrochemical route that operates at temperatures, even below 100 °C. After an investigation of the electrochemical behavior of steel samples in alkaline solutions at various temperatures, the customarily required bath temperature of more than 130 °C could be significantly lowered to about 80 °C by applying a DC voltage that leads to an electrode potential of 0.5−0.6 V vs. Pt. Thus, it was possible to eliminate the use of hazardous sodium nitrite economically and in an optimum way. Electrochemical quantification of the corrosion behavior of steel surfaces that were in contact with 0.1 M KCl solution was carried out by linear sweep voltammetry and by Tafel slope analysis. When comparing these data, even the corrosion rates of conventional blackened surfaces are of the same magnitude as a blank steel surface. This proves that magnetite overlayers represent rather poor protective layers in the absence of additional sealing. Moreover, cyclic voltammetry (CV), atomic force microscopy (AFM), scanning electron microscopy (SEM) and auger electron spectroscopy (AES) characterized the electrochemically blackened steel surfaces.

Graphical Abstract

1. Introduction

The technology of blackening is of utmost importance for surface finishing and the refinement of various types of steel. Chemical oxidation of an iron surface forms a tenebrous decorative passivation layer, which, in particular, can inhibit corrosion processes [1]. The resulting black-bluish coloration represents a convenient quality feature for steel components in a wide area of applications. The traditional hot alkaline blackening process for steel parts, in the following simply called blackening, involves five consecutive steps [2,3,4]: (1) degreasing and the removal of oils, (2) first water flushing, (3) actual blackening, where the specimens are immersed into a boiling sodium hydroxide solution that contains sodium nitrite as oxidizing agent and some other additives, (4) second water flushing for the removal of blackening bath components, and (5) surface treatment of the blackened steel by a water-resistant sealant. As a result, the blackening process leads to the oxidation of the surface iron atoms by forming black iron oxide (magnetite Fe3O4) [5,6,7]. In a similar manner to the well-known iron phosphating process [8], corrosion protection by blackening is not just achieved by simple deposition of an additional layer, but by a chemical transformation of the substrate’s surface itself, resulting in a so-called conversion coating [2,9]. The blackened surfaces are usually sealed by a waterproof layer (e.g., oil, etc.) to retard the initial stages of corrosion at defects and pores that are formed during the chemical oxidation process [5,6].
The formation of the magnetite surface layer is generally thought to involve the following two steps [6,10,11]: First, iron surface atoms are oxidized to iron(II) hydroxide (Fe(OH)2, see Equation (1)) by nitrite (NO2–), which acts as oxidizing reagent. Fe(OH)2 is then further oxidized to magnetite (Equation (2)) via the Schikorr reaction [12,13], causing the black surface burning [3,5,6,14].
Fesurf + 2 OH(aq) → Fe(OH)2,surf + 2 e
3Fe(OH)2,surf → Fe3O4,surf + H2(g) + 2 H2O(l)
Although the Schikorr reaction is spontaneous, i.e., thermodynamically favored, even at room temperature, the formation of magnetite is usually kinetically hindered at temperatures below 100 °C [4].
The simplicity and robustness of the blackening procedure is highly esteemed in many industrial sectors. However, hazardous and toxic sodium nitrite and the high energy costs represent major drawbacks. Hence, the development of a more environmentally friendly and efficient process would be highly desirable and promising for several branches. Attempts to form magnetite layers through an electrochemical reaction have been reported earlier for steel in hot (70−98 °C) ammonium nitrate solution [14,15]. However, this solution is, also considered to be unsafe. Alternatively, a hydrothermal synthesis of magnetite has been proposed [3,4,16], requiring an autoclave and likewise relatively high temperatures (100−250 °C), in comparison to the conventional process.
It is obvious to alternatively study the electrochemical route for the Schikorr-reaction (Equation (3)), which means that electrochemical blackening might be feasible without the use of harmful oxidants [5,6,17,18,19,20]:
3 Fe(OH)2,surf → Fe3O4,surf + 2 H2O(l) + 2 H+(aq) + 2 e
The anodic oxidation of steel has been known since the 1960s, where solutions of boiling 14.3 M sodium hydroxide and high current densities (50−100 mA·cm−2) are used to fabricate a loose and porous magnetite layer [18,19,21].
In this article, we demonstrate that blackening can easily be electrochemically achieved for steel samples that were immersed into concentrated sodium hydroxide solution under potentiostatic control at temperatures that are much lower than those used in the hitherto existing commercial process. The surface passivation layer that is generated in the absence of a chemical oxidizing agent under mild conditions by this new electrochemical reaction shows decorative properties comparable to the ones that are achieved with the standard technology of the costly and harmful chemical process. The quality and selected properties of the electrochemically blackened surfaces were further investigated while using atomic force microscopy (AFM), scanning electron microscopy (SEM), auger electron spectroscopy (AES), and electrochemical methods.

2. Materials and Methods

2.1. Materials

The steel discs of the standard S235JRG2C+C (geometric area: 2.83 cm2) were grinded before each measurement with 320 SiC abrasive paper (Buehler, ITW Test & Measurement GmbH, Esslingen, Germany), sequentially polished with 9 and 3 µm diamond suspension, 0.05 µm Al2O3 suspension, and finally successively rinsed with isopropanol (VWR, analytical grade) and water. Ultrapure water that was obtained from a water purification system (Arium 611 UV; TOC ≤ 3 ppb, Sartorius AG, Göttingen, Germany) was used as solvent in all experiments. Sodium hydroxide (NaOH, VWR, 99%), blackening salt (DWE Brünofix GmbH, Rednitzhembach, Germany and CSP—Chemische Spezialprodukte Olaf Günther, Markkleeberg, Germany), and potassium chloride (KCl, suprapur®, Merck KGaA, Darmstadt, Germany) were used without further purification.

2.2. Blackening

Both the conventional chemical and the electrochemical blackening were performed in the same measurement cell, which could be used in a three-electrode setup. 30 g of blackening salt or sodium hydroxide was dissolved in 30 mL water and then heated in an iron crucible to the desired temperature between room temperature and 120 °C. A platinum counter electrode, a platinum quasi-reference electrode, and the steel sample were immersed into the solution. Following this process, the samples were rinsed with ultrapure water and then dried in a nitrogen stream. A potentiostat (Fritz-Haber-Institut, Berlin, Germany) was used for electrochemical blackening and for recording cyclic voltammograms.
Immersion into a boiling solution (130 °C) of blackening salt dissolved in water (concentration 1 kg·L−1) for 12 min chemically blackened steel samples. For electrochemical blackening, the steel samples were immersed into the electrolyte (blackening salt or sodium hydroxide solution) for 12 min, using the following experimental conditions:
  • Blackening solution at 80 °C: E = 0.5 V vs. Pt
  • Blackening solution at 100 °C: E = 0 V vs. Pt
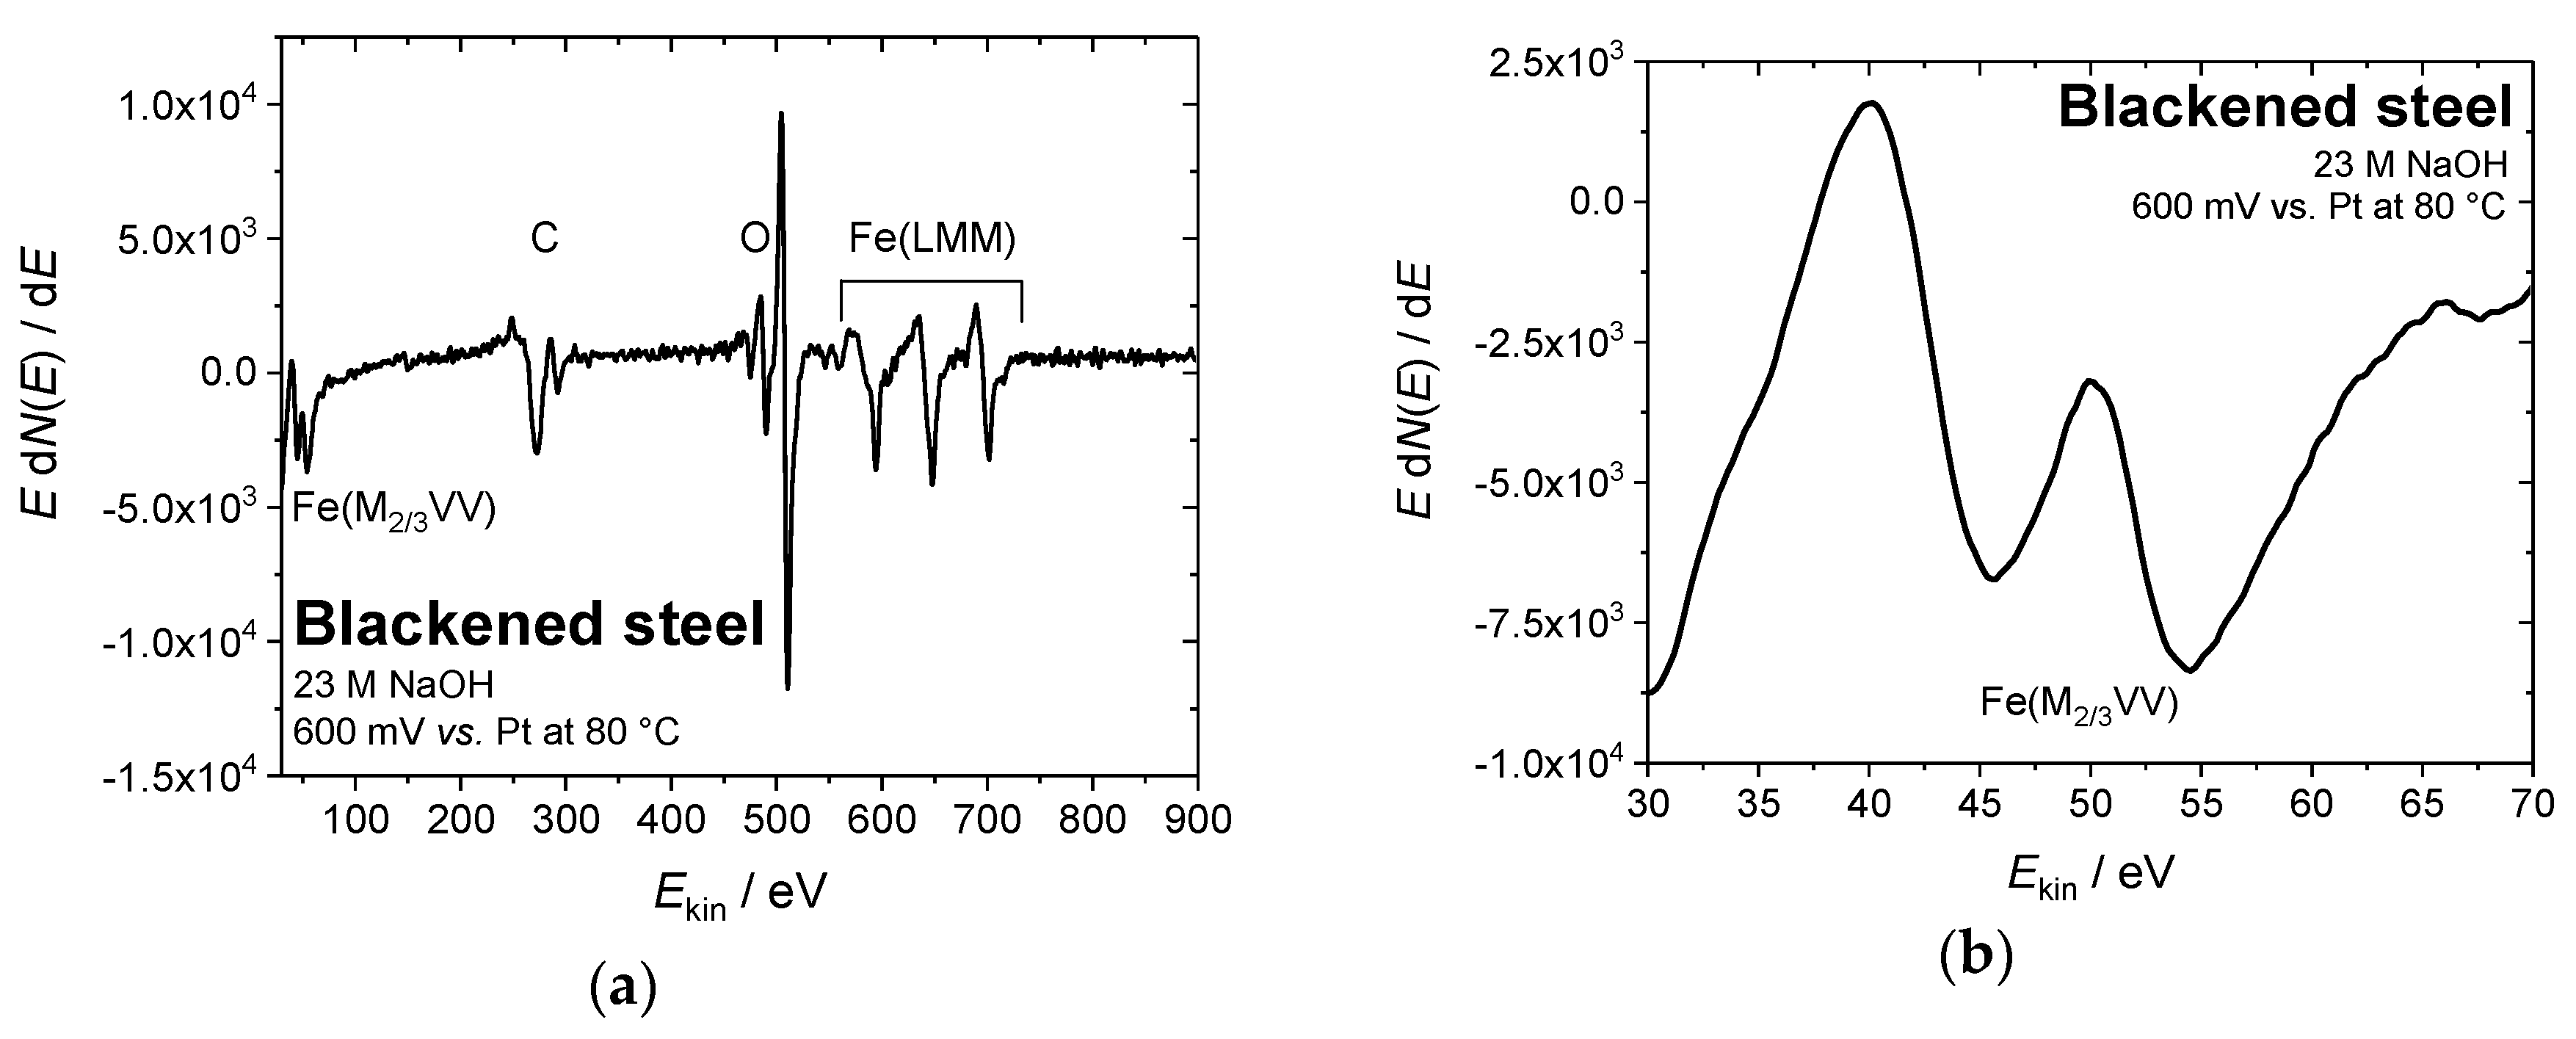
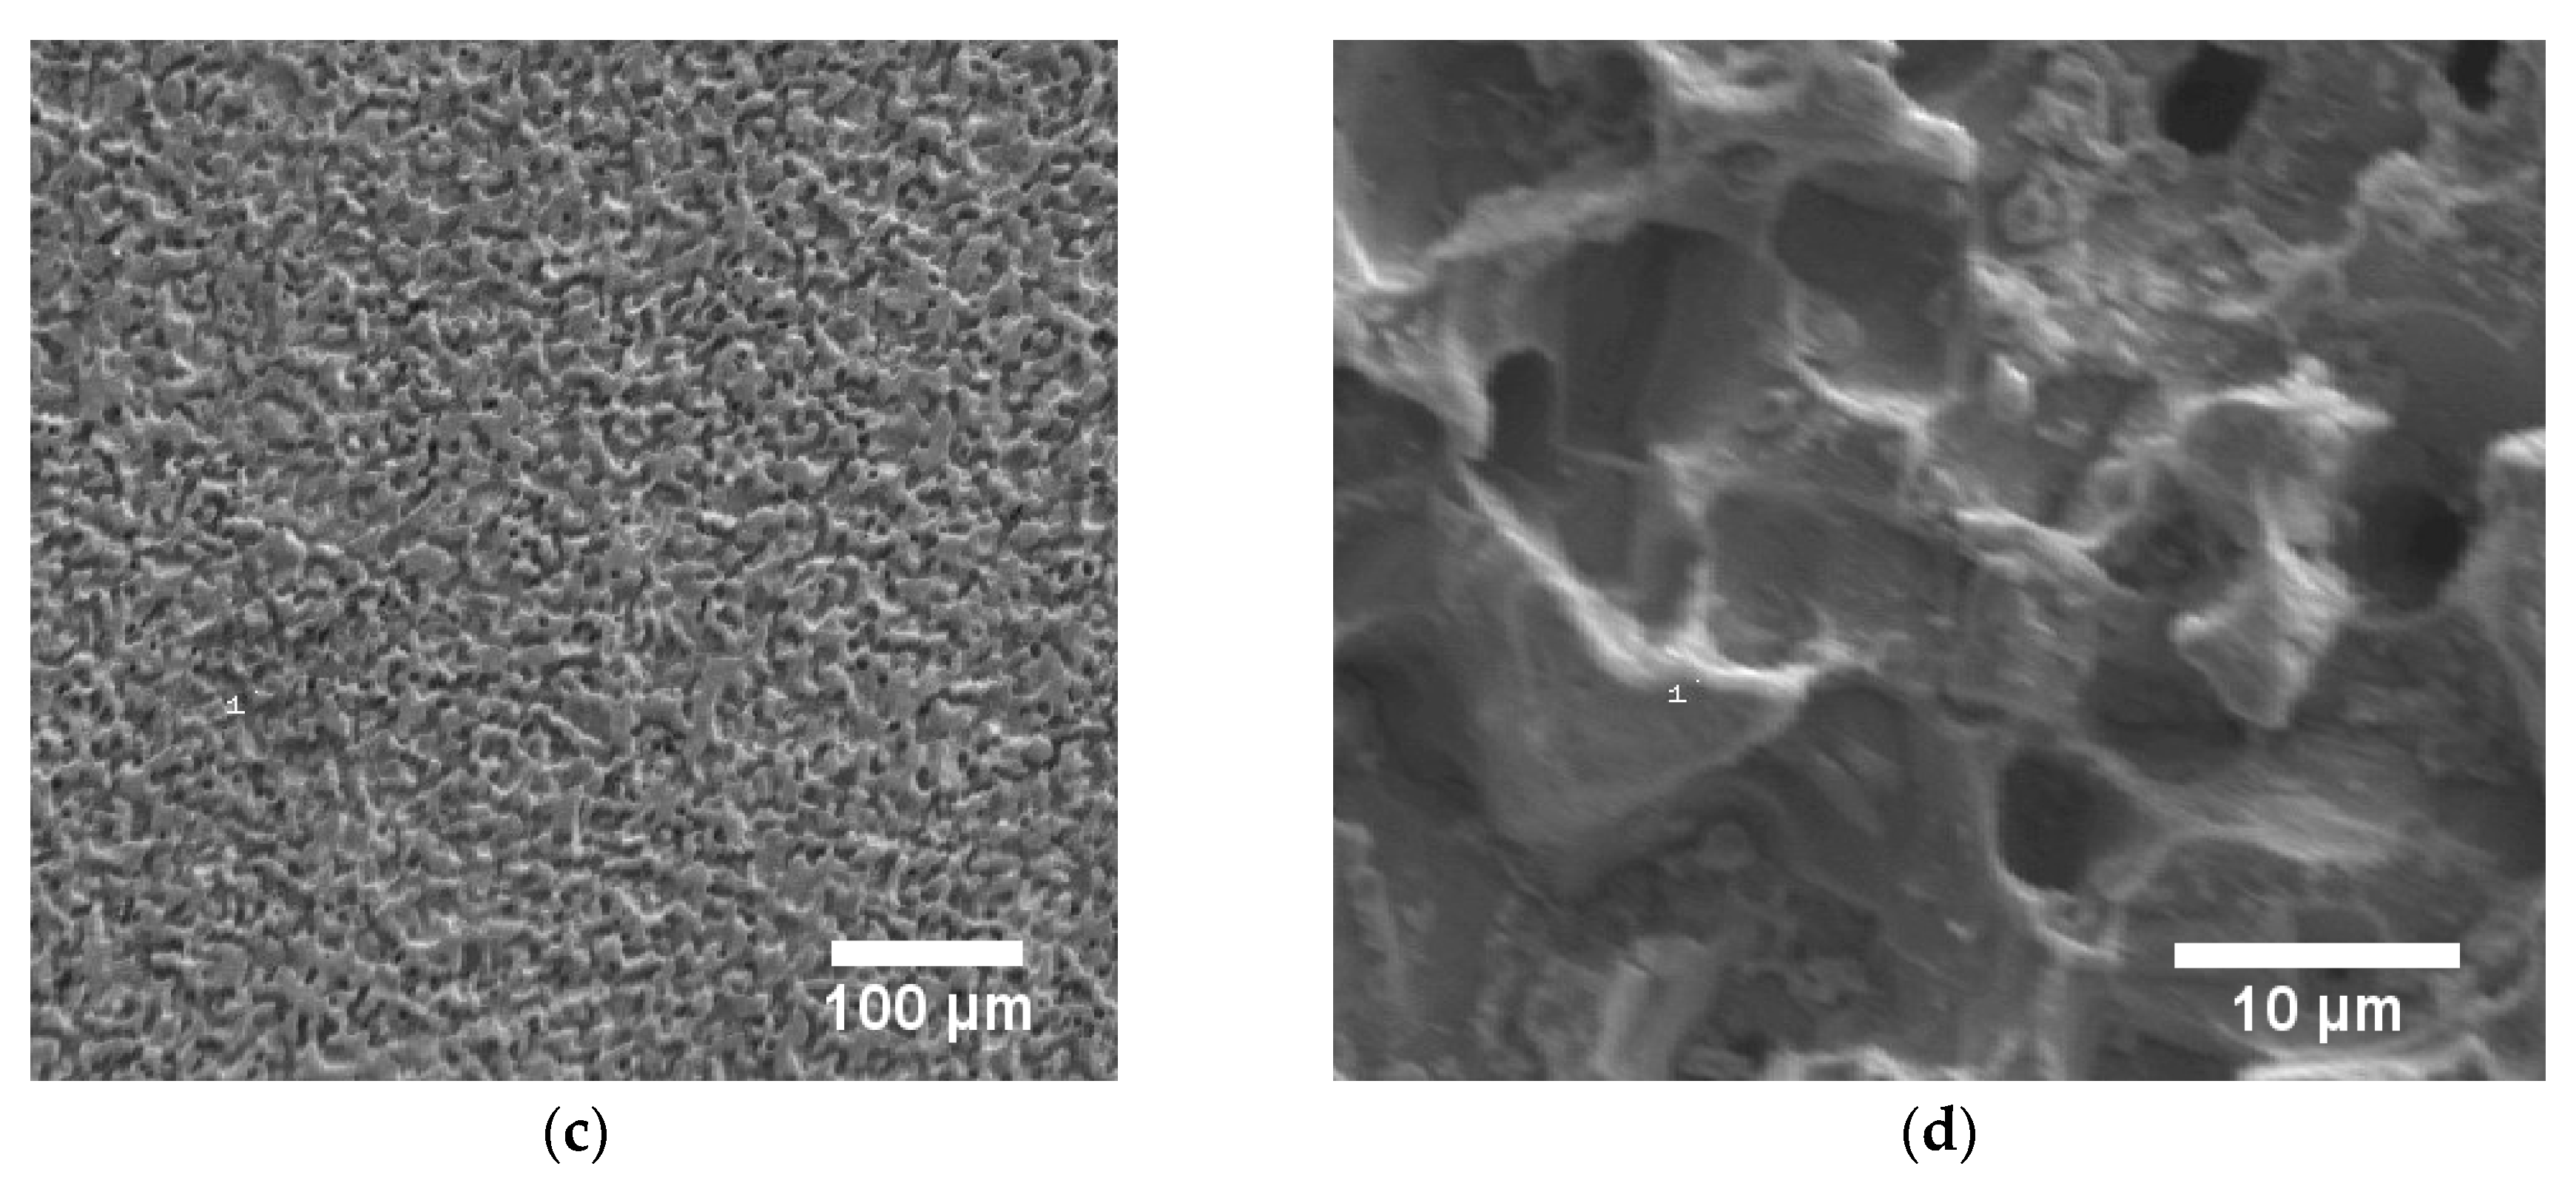
  • 23 M NaOH at 80 °C: E = 0.6 V vs. Pt
  • 23 M NaOH at 100 °C: E = 0.1 V vs. Pt
  • 23 M NaOH at 120 °C: E = 0.1 V vs. Pt
At temperatures that were higher than 120 °C, the electrolyte started boiling, in which electrochemical measurements were no longer practicable. Therefore, the maximum temperature for electrochemical measurements was set to 120 °C. It should be noted that the formation of magnetite at temperatures below 80 °C by using more positive potentials (E > 0.6 V vs. Pt) was not successful.

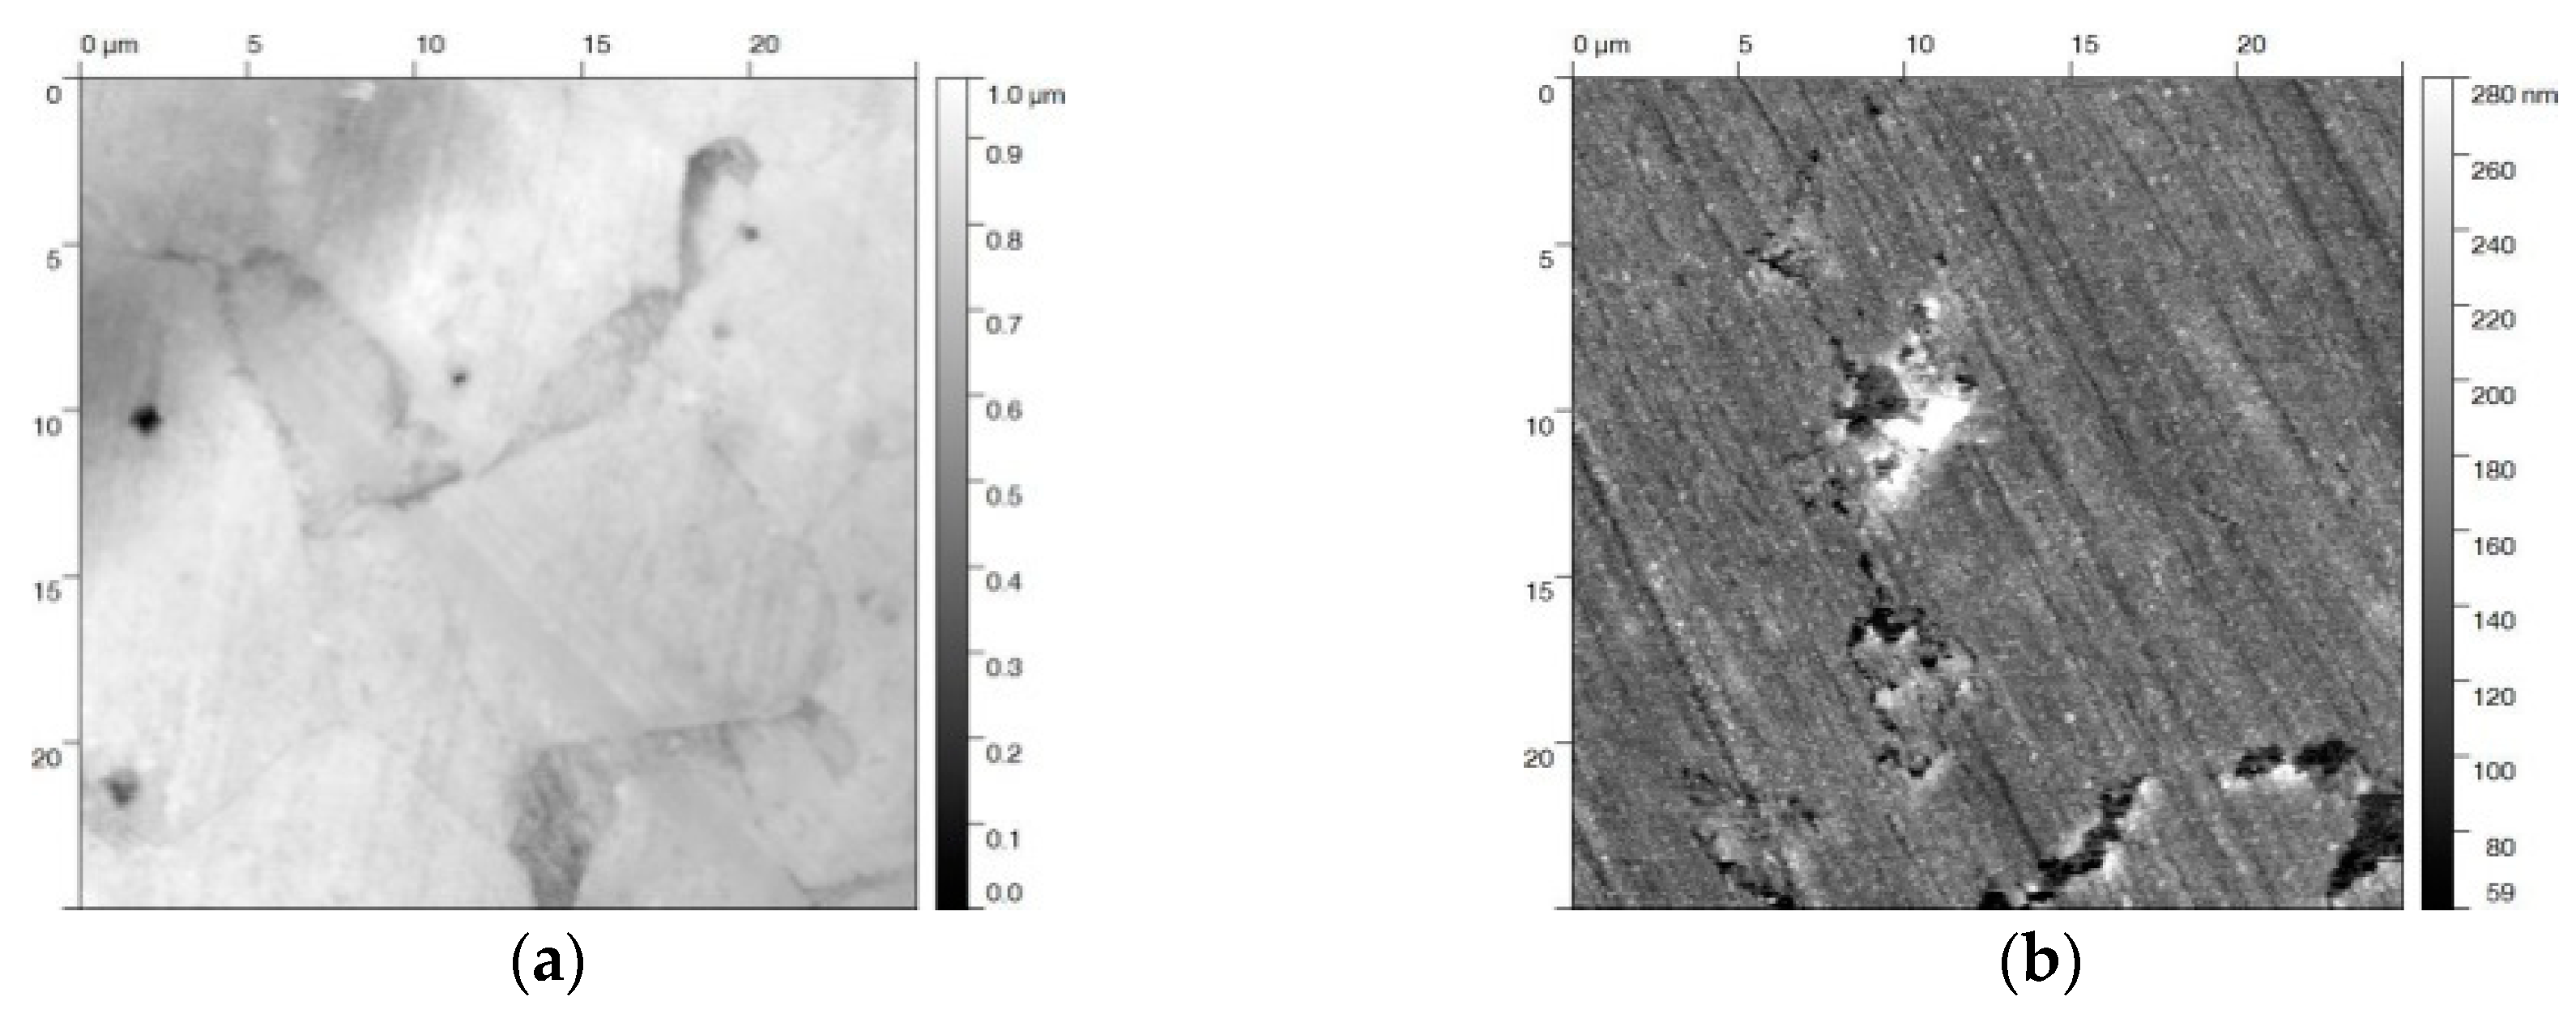
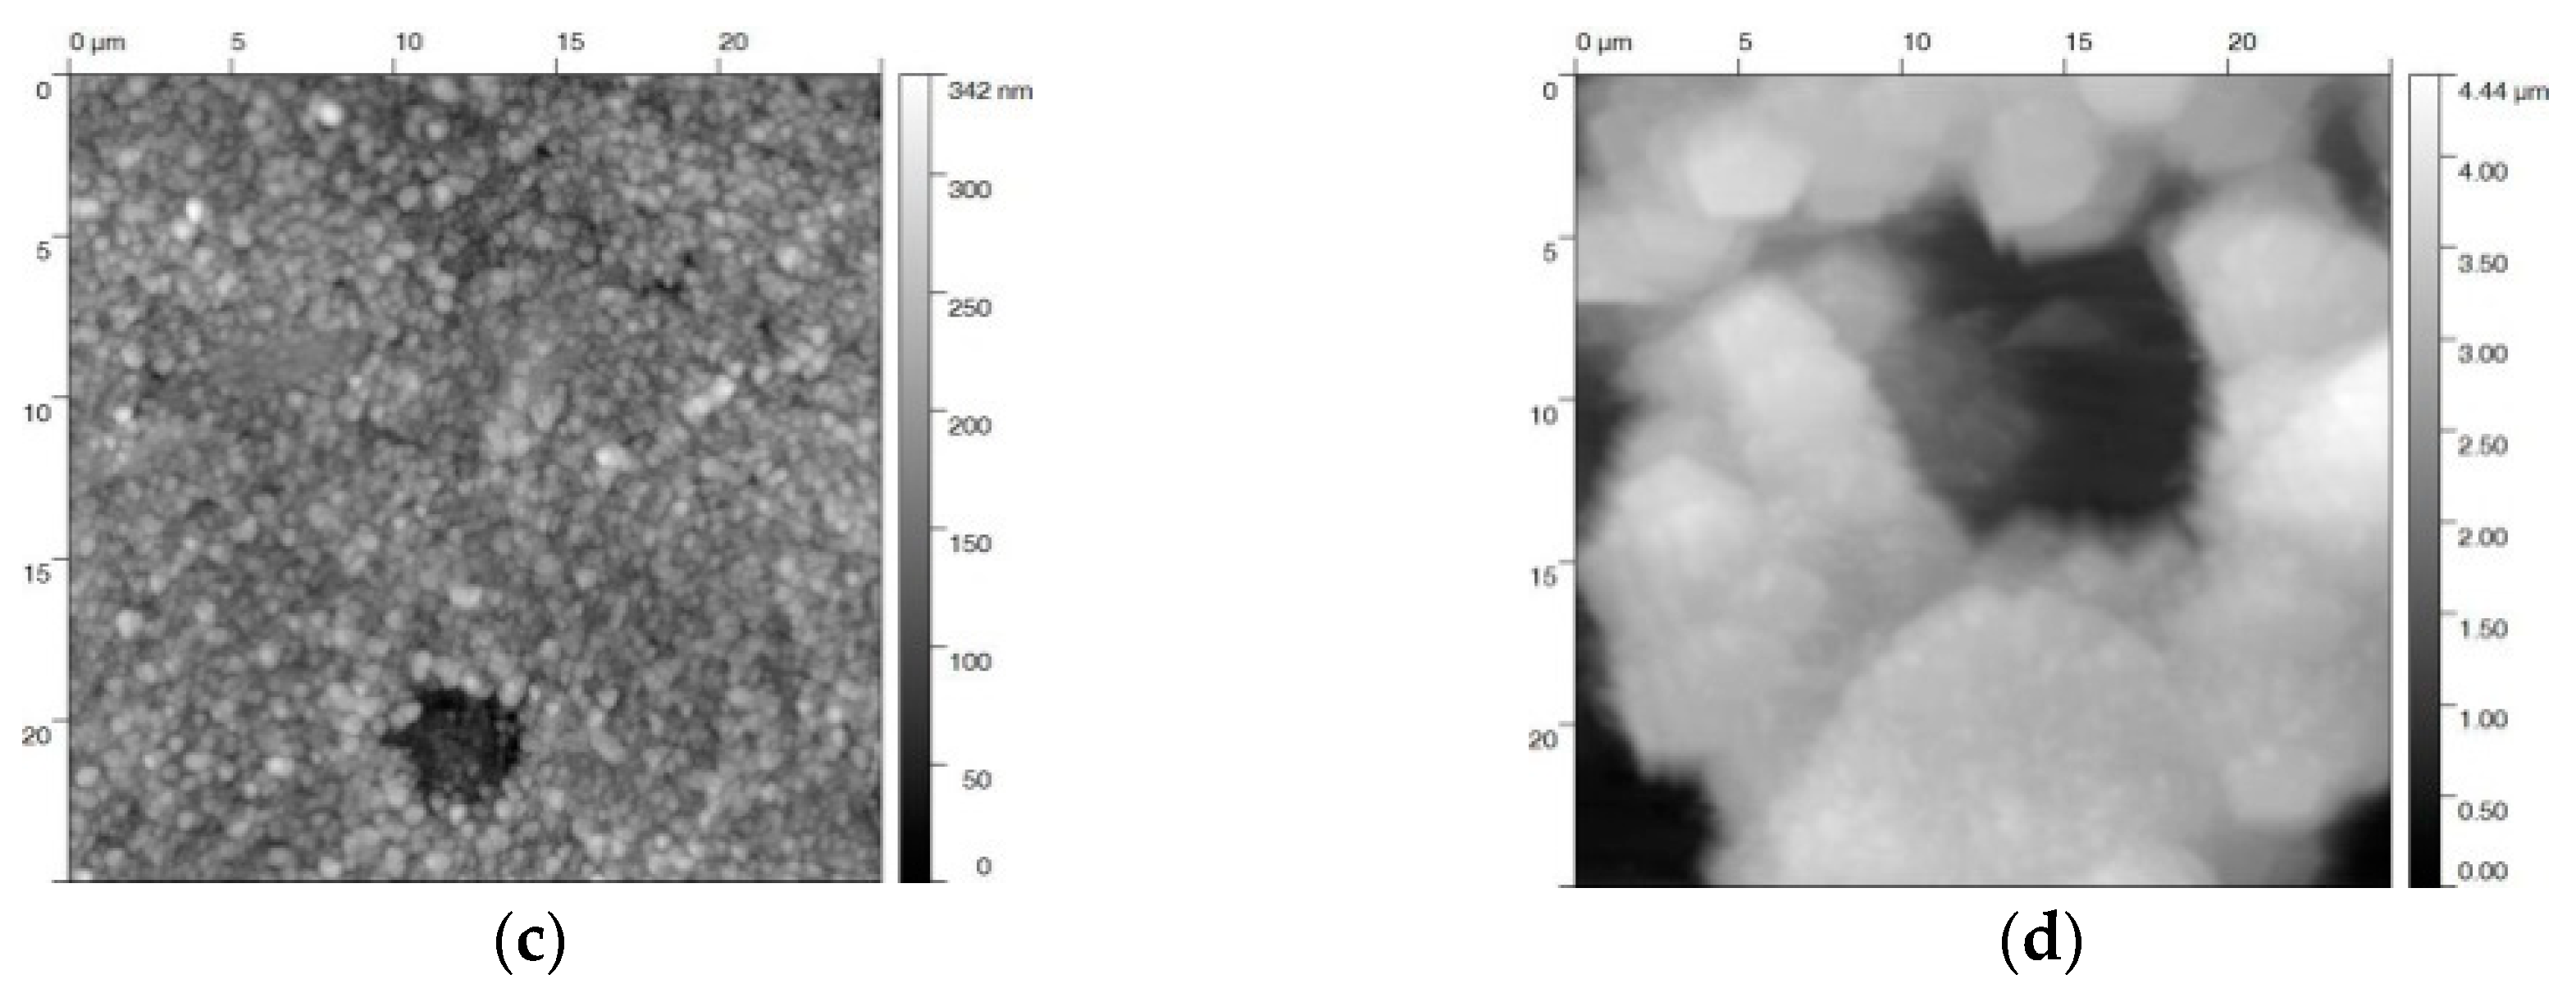
2.3. Characterization of the Blackened Samples

Atomic force microscopy (Nanosurf FlexAFM, Nanosurf AG, Liestal, Switzerland) in tapping mode using Tap190 GD-G cantilevers (Budgetsensors, Innovative Solutions Bulgaria Ltd., Sofia, Bulgaria), scanning electron microscopy, and Auger-electron spectroscopy (Phi 660, Physical Electronics, Chanhassen, MN, USA) characterized the blackened surfaces.
The electrochemical characterization and quantification of the corrosion behavior was studied with a conventional three electrode setup, consisting of a working, a reference, and a platinum counter electrode. All of the potentials were recorded against an Ag/AgCl reference electrode (Schott, cKCl = 3 mol·L−1). The working electrode was contacted with the electrolyte by a hanging meniscus configuration, resulting in a geometrical surface area of 0.785 cm2. The electrolyte was a 0.1 M KCl solution, which was purged with N2 for at least 1 h before each measurement. Electrochemical characterization of blackened samples was done by cyclic voltammetry between −1.5 V to −0.2 V vs. Ag/AgCl at a scan rate of 20 mV·s−1. The corrosion protection was quantified by linear voltammetry in a potential range between −0.1 and 0.1 V vs. EOC at a scan rate of 1 mV·s−1. EOC is the open circuit potential after 1 h immersion of the sample into the electrolyte. The corrosion potential Ecorr, Tafel slope coefficient βc, βa, and corrosion current density jcorr (as indicators of the quality of the corrosion protection) were obtained from the measured potential–current curve by Tafel slope analysis and fitting to the Wagner–Traud equation. The polarization resistance (RP) was obtained from the slope of the polarization curve at EOC or by calculation while using the Stern–Geary equation.

3. Results and Discussion

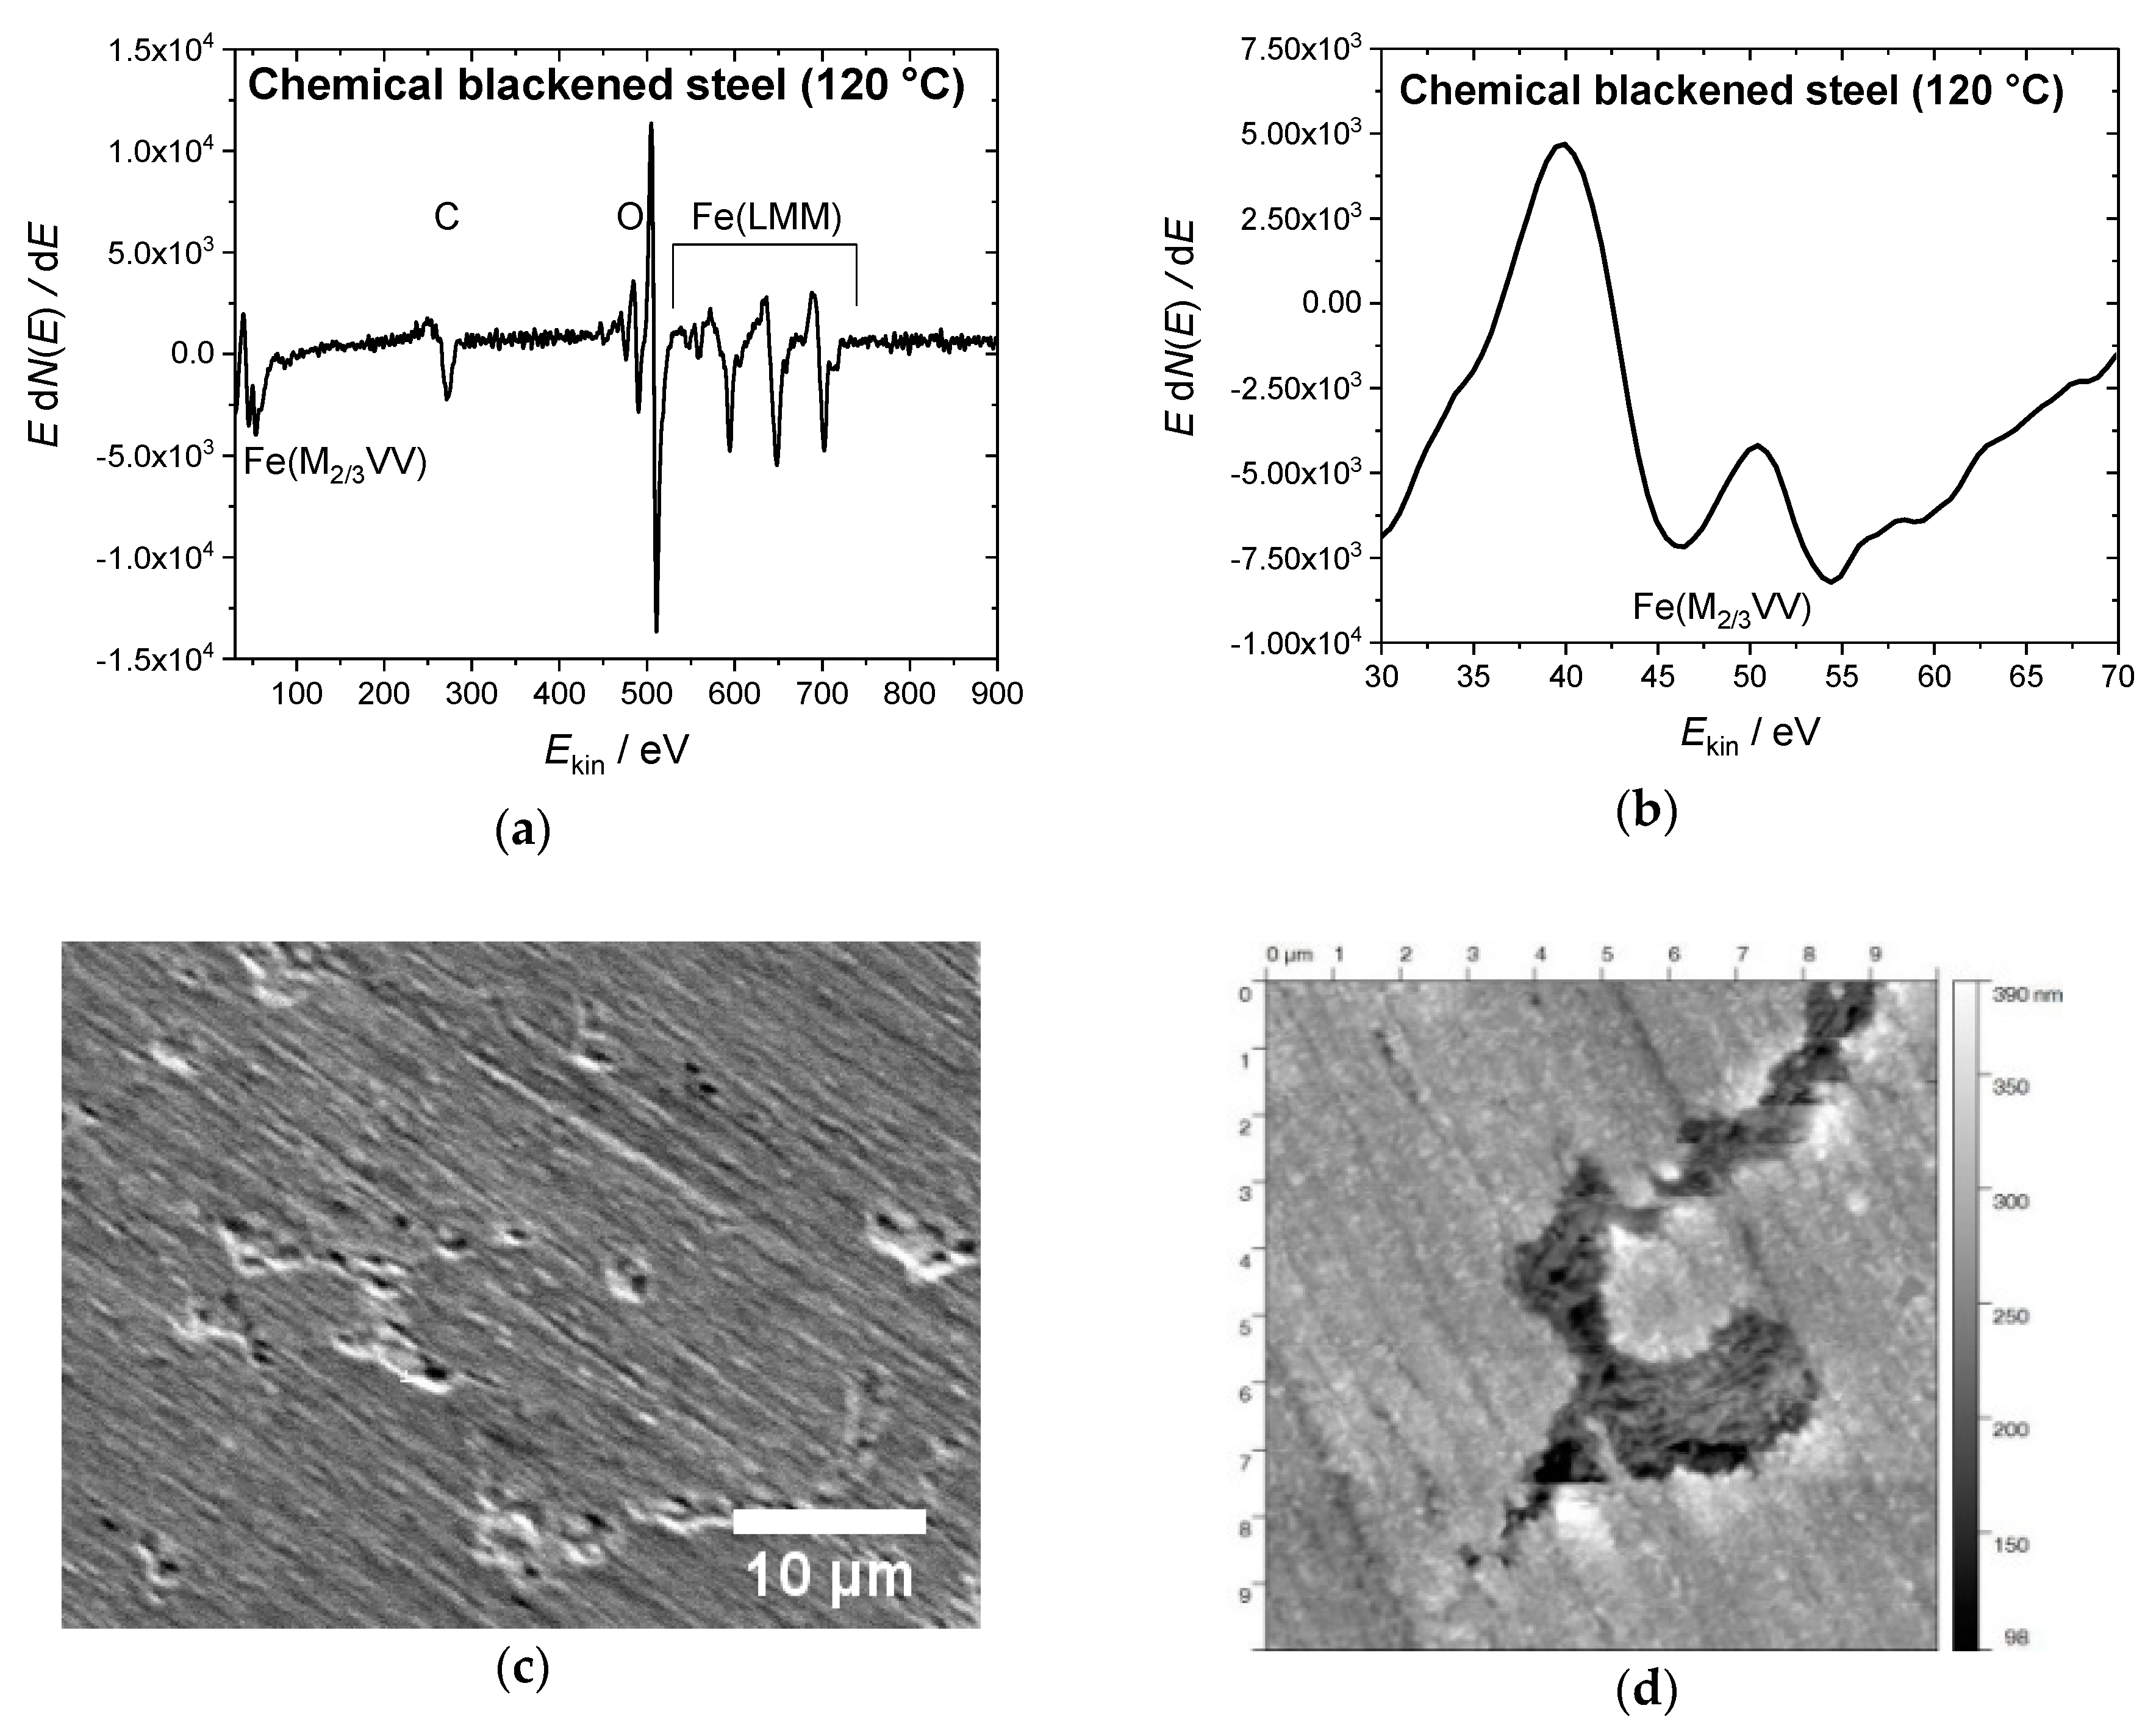
3.1. Chemical Blackening

The steel samples were prepared according to the recipe that is described in DIN 50938 in order to compare the electrochemical and the chemical hot alkaline blackening procedures [22]. The polished steel slices were immersed into a boiling solution of blackening salt dissolved in water (concentration 1 kg·L−1) at 130 °C for 12 min, yielding a uniform black-blackened surface. Auger electron spectroscopy identified the iron oxide species (see Figure 1a). The resulting oxide species were determined by the intensity ratio of the fine structure of the Fe(M2/3VV) signals at 46 and 54 eV [23]. The relevant intensity ratio of approx. 8 to 10 matches that of Fe3O4 (Figure 1b). The magnetite surface appears relatively smooth (profile roughness parameter Ra = 12 ± 1 nm) (see the SEM and AFM images in Figure 1b,c). Besides some cracks, surface defects that have been formed during the blackening process are visible in these images.

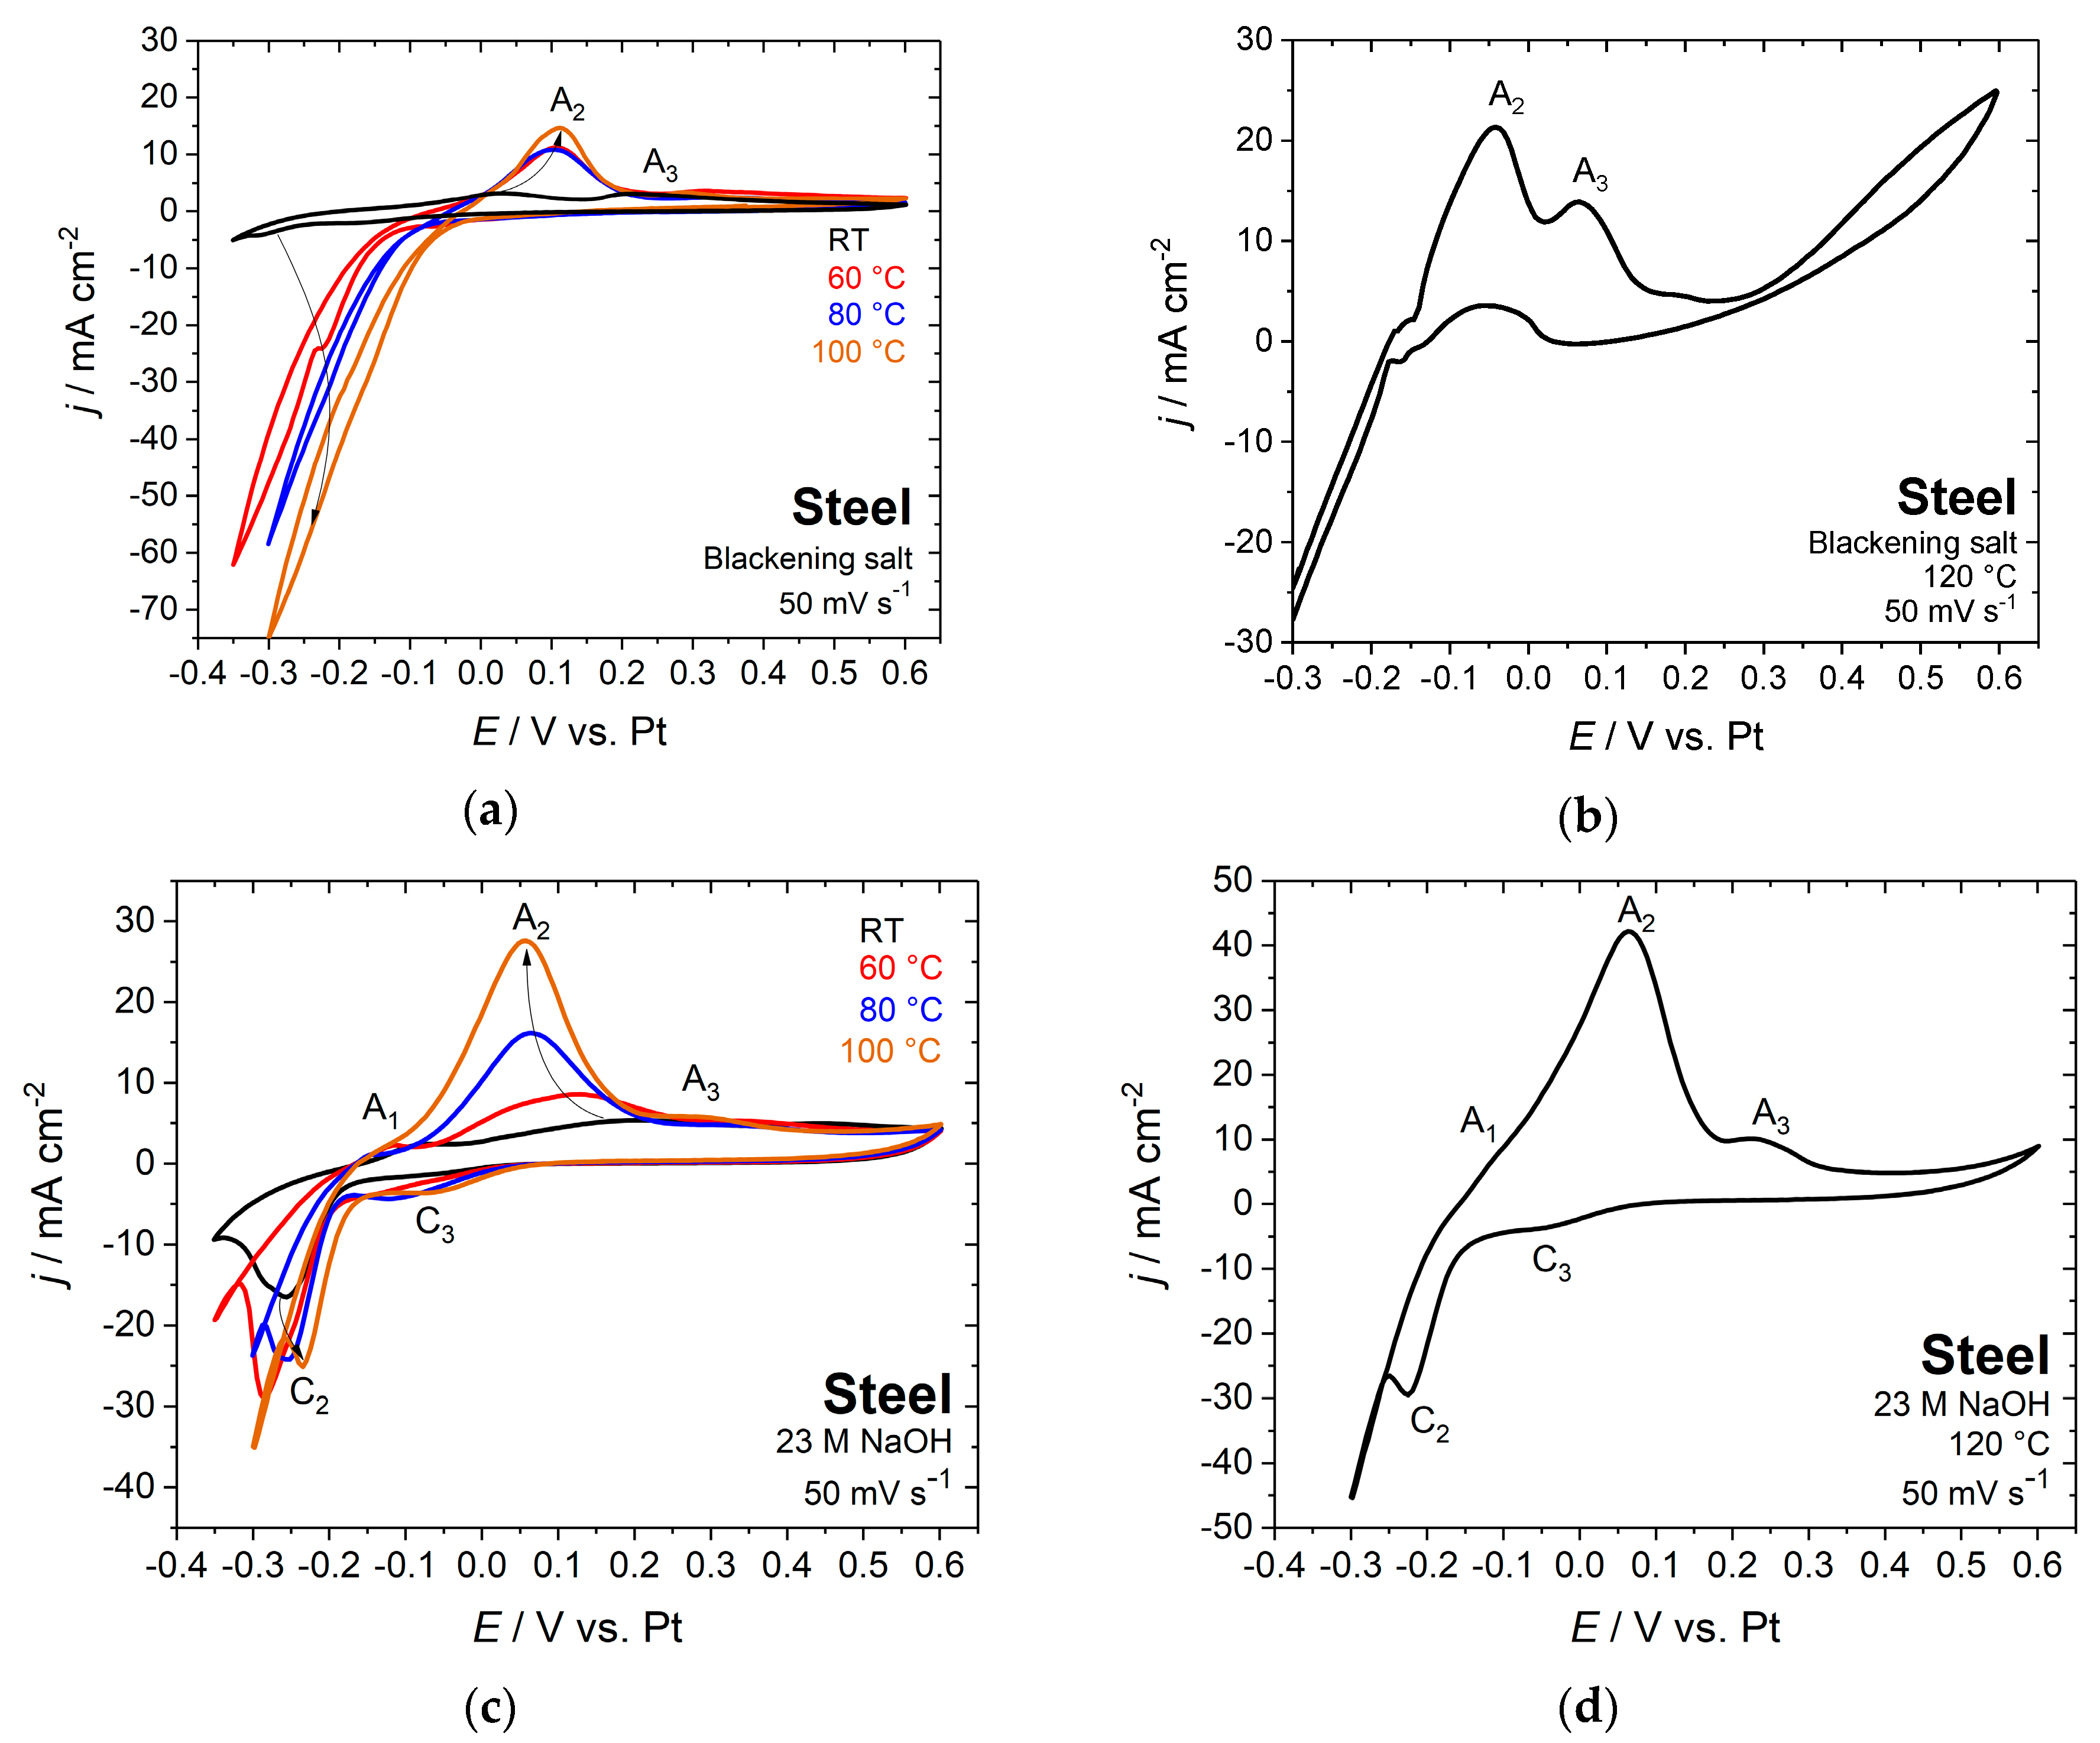
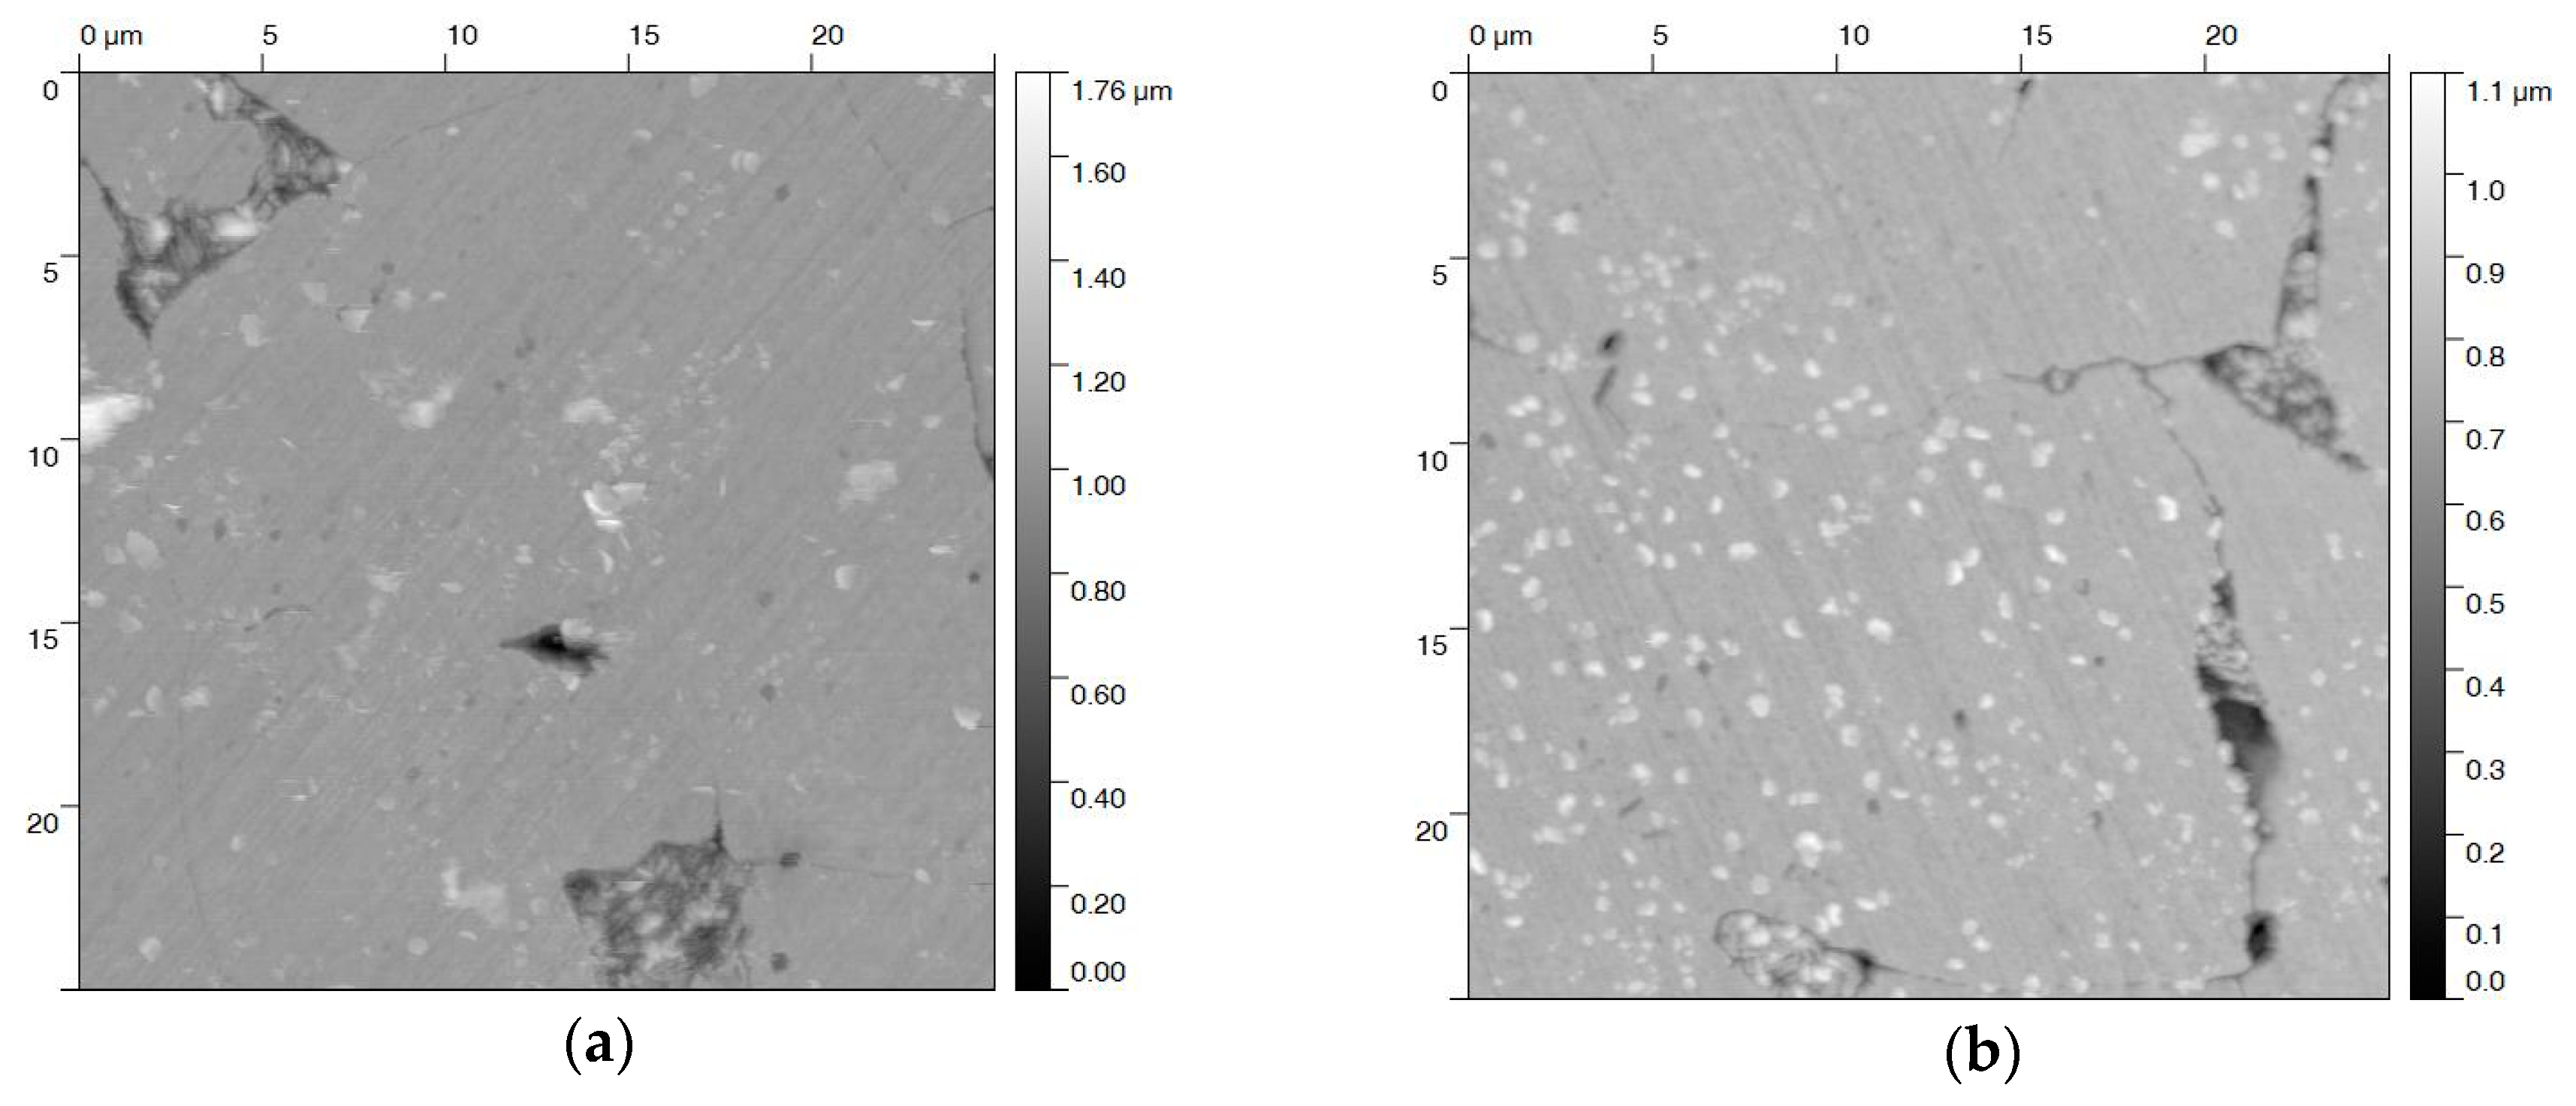
3.2. Electrochemical Blackening

Besides conventional chemical blackening at variable temperature, the steel samples were electrochemically blackened both in a nitrite containing blackening solution and in sodium hydroxide solution that is free of nitrite. To determine the optimum temperature and the DC voltage for electrochemical blackening, the electrochemical behavior of steel samples was studied at different temperatures between room temperature and 120 °C in blackening salt and 23 M sodium hydroxide solution by cyclic voltammetry (Figure 2). The study of steel electrodes that are in contact with sodium hydroxide solution was also performed until the boiling temperature of 120 °C.
According to the Pourbaix diagram of iron [17,24] and the well-known electrochemical behavior of iron in alkaline solution [11,25,26,27,28,29,30], the anodic peak A1 at −0.08 V vs. Pt for steel in 23 M NaOH (Figure 2c,d) was identified as the oxidation of Fe to Fe(II) [28,29,30]. This is in agreement with the reaction that is given in Equation (1). The peak A2 at around 0.1 V vs. Pt in blackening salt solution and in the range of 0.06 to 0.16 V vs. Pt in sodium hydroxide corresponds to the oxidation of iron hydroxide to magnetite that is in correspondence to the Schikorr reaction (Equation (3)) [11,27,28,29]. Magnetite is finally oxidized to iron(III) oxide at peak A3 [11,27]. Furthermore, the two cathodic peaks of C2 and C3 are observed for nitrite-free solutions (Figure 2c,d). They correspond to the related oxidation peaks A2 and A3 [29]. Measurements that were obtained with blackening salt solution (Figure 2a,b) only exhibit the anodic peaks A2, A3, and the hydrogen evolution regime. It is noteworthy that the current and charge densities for sodium hydroxide solution are approximately twice as large as those that were measured with blackening salt.
A black coloring of the surface already appeared after the first voltammetric cycle in boiling blackening solution, while at room temperature, even after one hour, no visible changes in color have been observed. Only a few signs of corrosion at grain boundaries were monitored in the AFM topography image (Figure 3). This can be explained by the slow kinetics of the Schikorr reaction, as already mentioned above. The blackening of the surface becomes evident after increasing the temperature to 80 °C. For this reason, the temperature range between 80 and 120 °C was examined in detail, both with sodium hydroxide and blackening salt solution as electrolytes.
The open circuit potential (EOC) that was established for steel in blackening salt solution after 12 min is −0.05 V vs. Pt, which is located around the onset of peak A2 (Figure 2b). For this reason, the potential was set to 0 V vs. Pt for the electrochemical treatment with blackening solution at 100 °C. Applying a potential of 0.1 V vs. Pt in 23 M NaOH solution at 100–120 °C (Figure 2c), which almost corresponds to peak A2, yields a uniform black magnetite layer after 12 min. With the same potential at 80 °C in blackening salt and 23 M NaOH solution, insufficient blackening is obtained due to the slow kinetics of the Schikorr reaction. It is obvious that the electrode potential and temperature are the main parameters that control the quality of electrochemical blackening. Within the same process time of 12 min, a more positive electrode potential of 0.5 V vs. Pt with blackening salt and 0.6 V vs. Pt with sodium hydroxide solution leads to the formation of a compact Fe3O4 overlayer, which Auger electron spectroscopy subsequently characterized (Figure 5).
The potentials and the resulting current densities that were measured after 12 min (jfinal) for the two electrolytes at temperatures of 80, 100, and 130 °C (boiling temperature of blackening salt solution) are summarized in Table 1.
Electrochemical blackening at temperatures below 80 °C by using more positive potentials was not successful. Apparently, ferrate(VI) ions (FeO42−) are formed at higher potentials, resulting in a purple colored electrolyte [28,31,32]. UV-VIS spectroscopy (Figure 4) could confirm the electrochemical formation of the ferrate(VI) ion, showing a band with an absorption maximum at 505 nm (green color, complementary of purple) [32,33,34].
In order to confirm the chemical composition of the iron oxide overlayers that were formed by electrochemical blackening, the steel samples were examined by Auger electron spectroscopy. Figure 5 shows (exemplarily for all samples under study) the Auger electron spectrum of steel blackened in NaOH at 80 °C and 0.6 V vs. Pt. The intensity ratios for the Fe(M2/3VV) signals at 46 and 54 eV (Figure 5b) are similar to those that were obtained for the samples with classical chemical treatment (Figure 1a,b). We conclude that the formed black oxide layer is indeed magnetite (Fe3O4), which is in agreement with the findings in literature [23].
In addition to the Auger electron spectroscopy measurements, we also took SEM images, showing sponge-like structures on the surfaces (Figure 5c,d). This indicates corrosive attack and surface roughening by NaOH during the electrochemical blackening process. The electrochemical origin of this corrosion process is a parallel reaction that is competitive with the one sketched in Equation (2). At high pH values, iron(II)hydroxide reacts with excess hydroxide to soluble HFeO2 (Equation (4) [17,26].
Fe(OH)2,surf + OH(aq) → HFeO2(aq) + H2O
AFM topography images of the blackened samples after different treatments were recorded in order to quantify the surface roughness (Figure 6). Only minor changes could be observed for blackening salt solution at 80 and 130 °C (Figure 6a,b). This is in agreement with a relatively small roughness factor of 12–15 nm (Table 1). In contrast, steel samples that were blackened in a solution of sodium hydroxide at 80 °C, and even more at 120 °C, yield a rougher (Ra = 30—60 nm) and more damaged surface (Figure 6c,d). These surface defects are triggered by the corrosive effect of the sodium hydroxide solution and the high anodic current densities [31]. As expected, the higher the anodic current density, the larger the roughness of the blackened surface. We would like to point out that, by applying a potential in both blackening solutions at 100 °C and 23 M NaOH, the roughness is at least increased by a factor of two. This increase of roughening at higher temperature is possibly caused by the enhanced formation of Fe(OH)2 (Figure 2) and the corrosive attack of NaOH (Equation (4)), in competition with the Schikorr reaction.

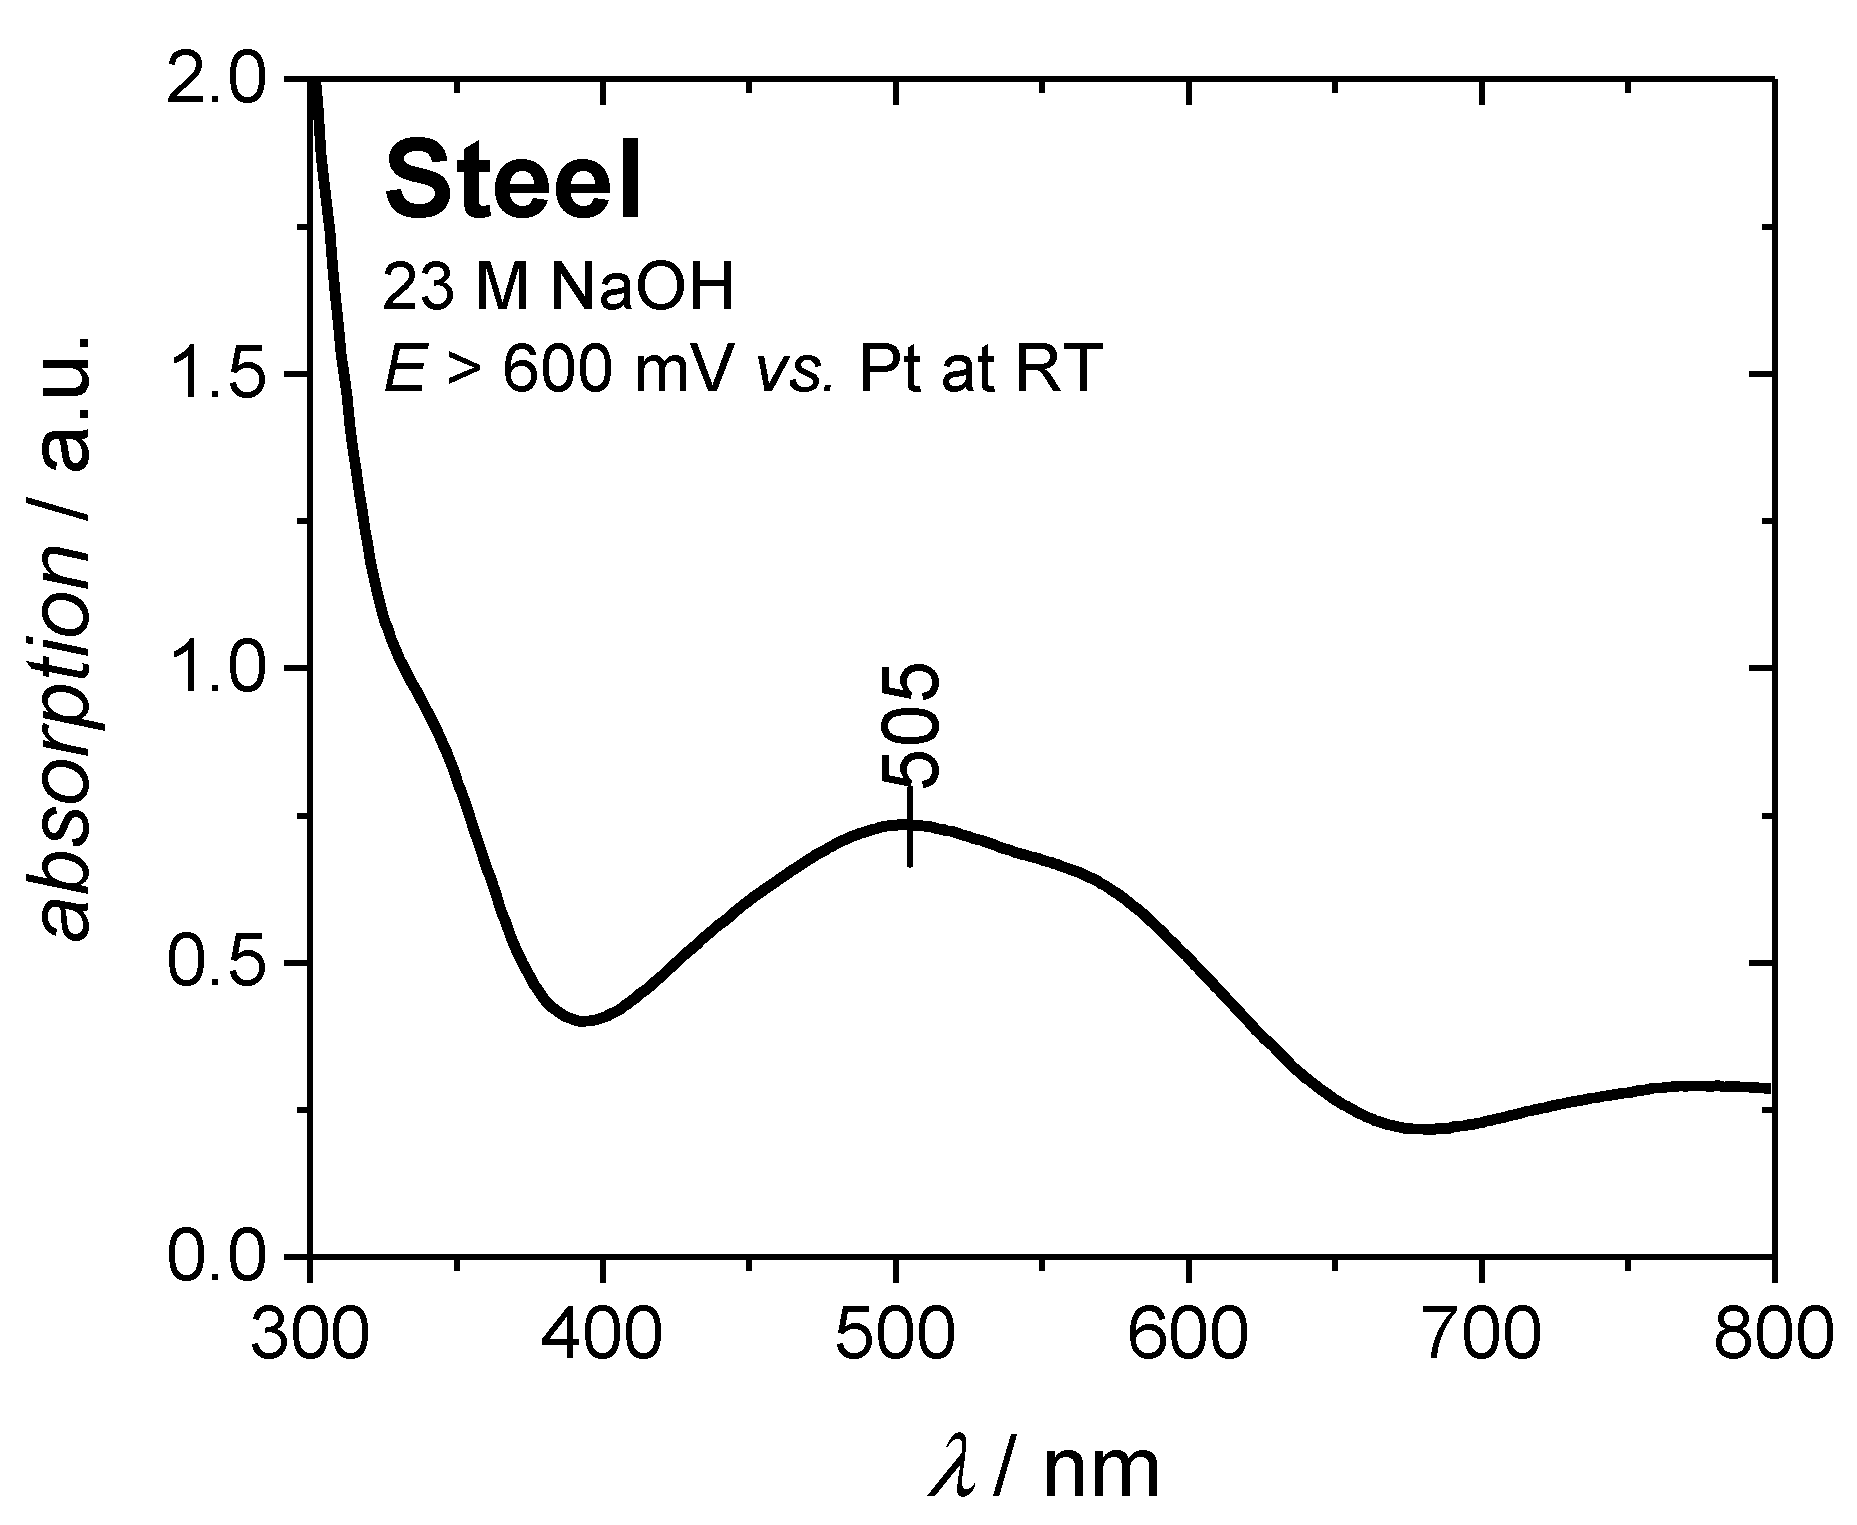
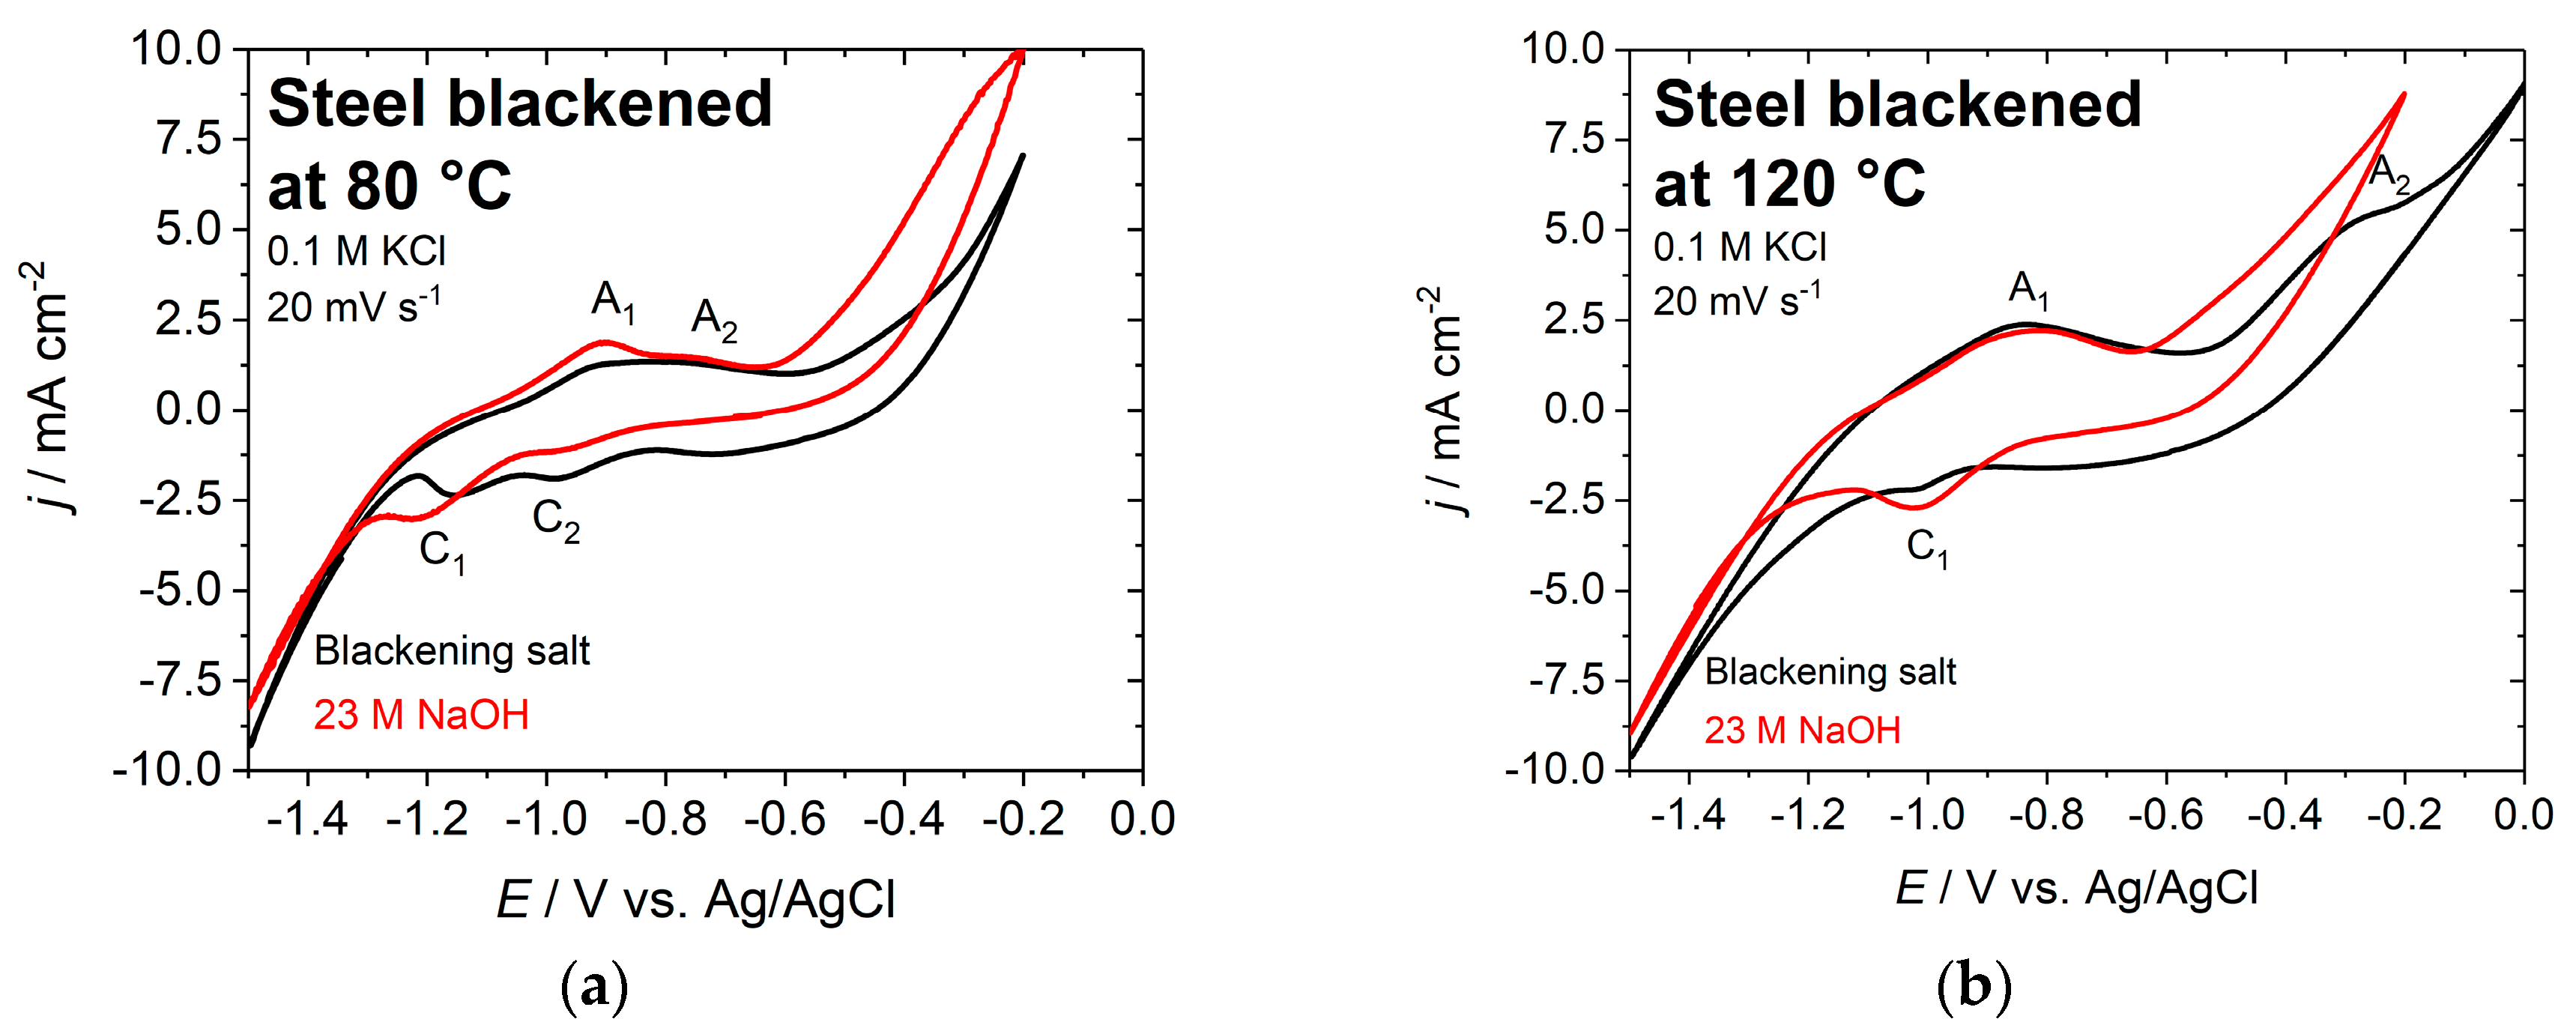
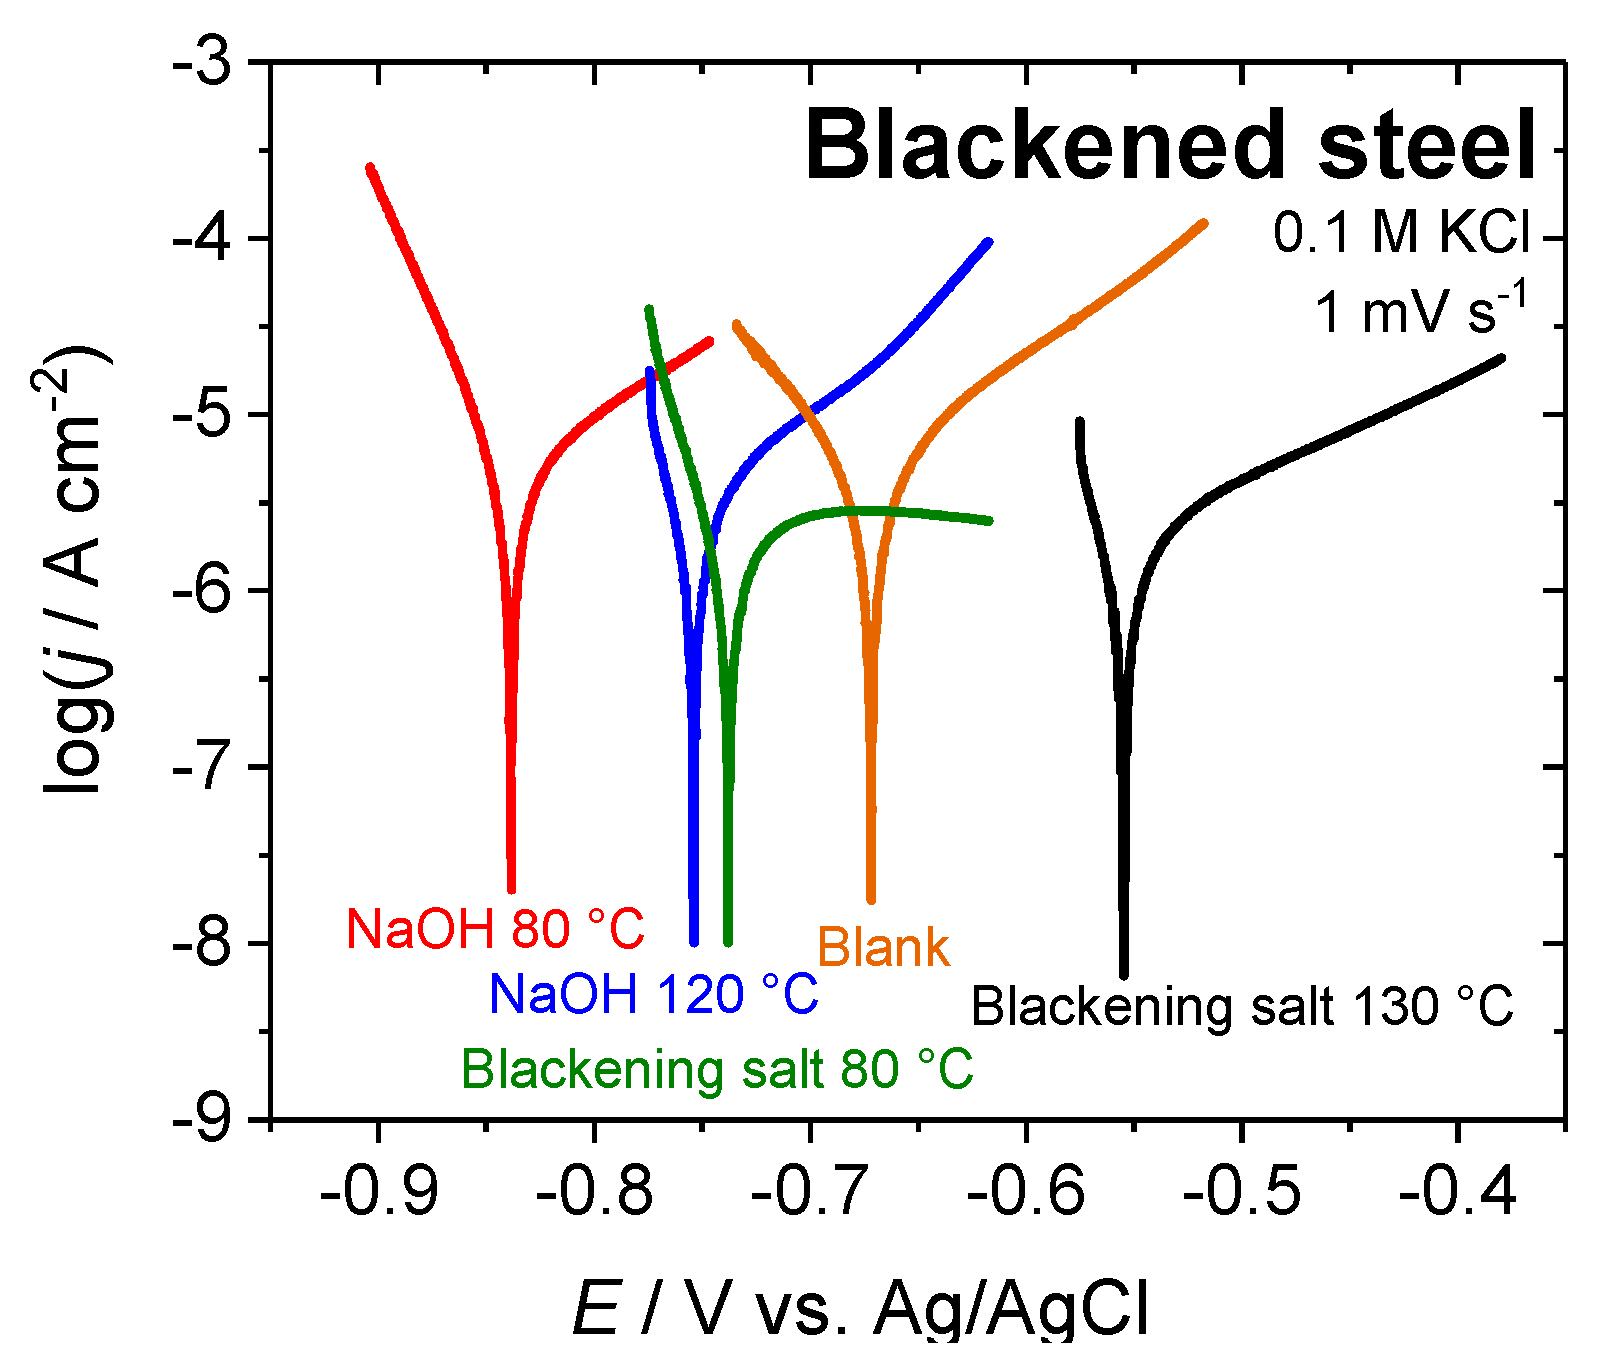
3.3. Electrochemical Characterization

The electrochemical behavior of the blackened samples was studied by cyclic voltammetry in the potential range between −1.5 and −0.2 V vs. Ag/AgCl, with 0.1 M potassium chloride solution at a sweep rate of 20 mV·s−1 (see Figure 7). In the case of the chemically blackened sample, the positive potential limit was expanded to 0 V vs. Ag/AgCl to study an additional anodic current peak at −0.27 V vs. Ag/AgCl. Subsequently, a Tafel slope analysis was performed for the voltammetric data.
The cyclic voltammograms for the various steel samples that were blackened at different temperatures are all very similar in the potential range between −1.5 and −0.6 V vs. Ag/AgCl (Figure 7). The surfaces that were blackened in NaOH start oxidizing to Fe(III) at −0.6 V vs. Ag/AgCl, while this reaction requires higher potentials for samples that were treated in the blackening salt solution. This can be explained by a more defect-free and smoother steel surface, which is apparent from the images that were obtained by AFM.
The corrosion potentials (Ecorr), corrosion current densities (jcorr), and Tafel slope coefficients (βc and βa) for the various blackened samples (listed in Table 2) were obtained by Tafel slope analysis from the polarization curves that are shown in Figure 8. In order to determine the quality of the blackened surfaces and their corrosion behavior (qualitative salt spray test may give similar trends), the corrosion rates (kcorr) were calculated while using the Faraday laws. The polarization resistances (RP) were obtained by calculation using the Stern–Geary equation [35].
R p = β a | β c | 2.303 ( β a + | β c | )     j c o r r
A comparison of the corrosion potentials shows that the electrochemically-blackened samples appear to be less noble than the classically blackened or untreated steel samples. Nevertheless, the corrosion current densities and rates are similar to the classically blackened samples and about 70% lower than for an untreated steel sample. The samples that were treated with sodium hydroxide solution at 80 °C have an approximately 40% lower corrosion current when compared to the blank sample. The polarization resistance supports this trend, illustrating an improvement of the corrosion resistance of the samples that were oxidized in blackening salt solution by a factor of approx. two as compared to a blank surface, while the improvement of electrochemical oxidized samples in 23 M NaOH is about 10–40%.
The rough and porous structure of the magnetite layer possibly caused the less noble behavior and lower corrosion protection of the electrochemical-blackened samples (Figure 6c,d). In this case, chloride ions could pass the oxide layer and attack the metal, forming a local cell beneath the oxide, which reduces the corrosion potential.
Supporting this, the form of the Tafel plots in Figure 8 and the values of the anodic Tafel slope coefficients (βa) of steel samples chemically and electrochemically blackened in blackening salt solution indicate protection of the surface by passivation due to the formed magnetite layer. In contrast, the anodic Tafel slope coefficients (βa) of steel samples that were electrochemically blackened in 23 M NaOH seem to be similar to an untreated sample. This behavior suggests that, although the corrosion rate decreased by a reduction of the active surface area, the porous structure of the magnetite layer does not result in a surface protection by passivation. The data in Table 2 indicates that the chemically and electrochemically formed magnetite overlayers represent rather poor protective layers in the absence of additional sealing. Since the blackened surfaces are usually sealed, the rougher surface may increase the adhesion strength of the sealant, providing even better corrosion resistance.

4. Conclusions

The electrochemical behavior of steel in blackening salt solution and the concentrated sodium hydroxide solution was investigated between room temperature and 120 °C by cyclic voltammetry. It is shown that the blackening of steel can be electrochemically achieved by applying a potential in the range of 0 to 0.6 V vs. Pt at temperatures between 80 and 120 °C. A further decrease of the bath temperature to room temperature and a simultaneous increase of potential did not yield the desired result due to the formation of Fe(VI) ions and the slow kinetics of the Schikorr reaction. Auger electron spectroscopy confirmed the formation of magnetite on the surface during blackening. AFM studies revealed surface roughening for the given reaction conditions. Electrochemical studies for blackened steel in 0.1 M KCl that is based on cyclic voltammetry and corrosion measurements revealed a similar electrochemical behavior and an equivalent corrosion protection for the following experimental conditions:
  • 23 M NaOH, 0.6 V vs. Pt and 80 °C,
  • 23 M NaOH, 0.1 V vs. Pt and 120 °C, and
  • blackening solution, 0.5 V vs. Pt and 80 °C.
Very similar surface properties are achieved in an efficient electrochemical blackening process at lower temperature when compared to classical chemical blackening at 130 °C with hazardous sodium nitrite. The combination of electrochemical blackening and surface sealing may help to develop an inexpensive, environmentally-friendly, and adequate method to obtain the aspired corrosion protection of steel surfaces, together with a unique appearance.

Author Contributions

Conceptualization, M.E., S.Z. and L.A.K.; Data curation, C.K.; Formal analysis, M.E., S.Z. and C.K.; Funding acquisition, T.J.; Investigation, C.K.; Methodology, A.F.; Resources, T.J.; Supervision, A.F., L.A.K. and T.J.; Validation, A.F.; Writing—original draft, M.E. and S.Z.; Writing—review & editing, L.A.K. and T.J.

Acknowledgments

The authors thankfully acknowledge Kneissler Brüniertechnik GmbH for supporting this research study.

Conflicts of Interest

The authors declare no conflict of interest.

References

  1. Kuśmierczak, S.; Makovský, M. Problems of Blackening of Steel Parts in Technical Practice. MATEC Web Conf. 2018, 244, 01012. [Google Scholar] [CrossRef]
  2. Farrell, R.W. Blackening of Ferrous Metals. Met. Finish. 2007, 105, 390–396. [Google Scholar] [CrossRef]
  3. Machmudah, S.; Zulhijah, R.; Wahyudiono; Setyawan, H.; Kanda, H.; Goto, M. Magnetite Thin Film on Mild Steel Formed by Hydrothermal Electrolysis for Corrosion Prevention. Chem. Eng. J. 2015, 268, 76–85. [Google Scholar] [CrossRef]
  4. Fattah-alhosseini, A.; Yazdani Khan, H.; Heidarpour, A. Comparison of Anti-Corrosive Properties between Hot Alkaline Nitrate Blackening and Hydrothermal Blackening Routes. J. Alloy. Compd. 2016, 676, 474–480. [Google Scholar] [CrossRef]
  5. Hurd, R.M.; Hackerman, N. Kinetic Studies on Formation of Black-Oxide Coatings on Mild Steel in Alkaline Nitrite Solutions. J. Electrochem. Soc. 1957, 104, 482. [Google Scholar] [CrossRef]
  6. Robertson, J. The Mechanism of High Temperature Aqueous Corrosion of Stainless Steels. Corros. Sci. 1991, 32, 443–465. [Google Scholar] [CrossRef]
  7. Reghuraj, A.R.; Saju, K.K. Black Oxide Conversion Coating on Metals: A Review of Coating Techniques and Adaptation for SAE 420A Surgical Grade Stainless Steel. In Materials Today: Proceedings; Elsevier: Amsterdam, The Netherlands, 2017; Volume 4, pp. 9534–9541. [Google Scholar]
  8. Sankara Narayanan, T.S.N. Phosphate Conversion Coatings—A Metal Pretreatment Process. Corros. Rev. 1994, 12, 201–238. [Google Scholar] [CrossRef]
  9. Onofre-Bustamente, E.; Domínguez-Crespo, M.A.; Genescá-Llongueras, J.; Rodríguez-Gómez, F.J. Characteristics of Blueing as an Alternative Chemical Conversion Treatment on Carbon Steel. Surf. Coat. Technol. 2007, 201, 4666–4676. [Google Scholar] [CrossRef]
  10. Chao, C.Y. A Point Defect Model for Anodic Passive Films. J. Electrochem. Soc. 1981, 128, 1187. [Google Scholar] [CrossRef]
  11. Daub, K.; Zhang, X.; Wang, L.; Qin, Z.; Noël, J.J.; Wren, J.C. Oxide Growth and Conversion on Carbon Steel as a Function of Temperature over 25 and 80°C under Ambient Pressure. Electrochim. Acta 2011, 56, 6661–6672. [Google Scholar] [CrossRef]
  12. Deiss, E.; Schikorr, G. Über Das Ferrohydroxyd (Eisen-2-Hydroxyd). Zeitschrift für Anorganische und Allgemeine Chemie 1928, 172, 32–42. [Google Scholar] [CrossRef]
  13. Schikorr, G. Über Eisen(II)-Hydroxyd Und Ein Ferromagnetisches Eisen(III)-Hydroxyd. Zeitschrift für Anorganische und Allgemeine Chemie 1933, 212, 33–39. [Google Scholar] [CrossRef]
  14. Vershok, D.B.; Misurkin, P.I.; Timofeeva, V.A.; Solov’eva, A.B.; Kuznetsov, Y.I.; Timashev, S.F. On the Formation of Magnetite Coatings on Low-Carbon Steel in Ammonium Nitrate Solution. Prot. Met. 2008, 44, 721–728. [Google Scholar] [CrossRef]
  15. Kuznetsov, Y.I.; Vershok, D.B.; Timashev, S.F.; Solov’eva, A.B.; Misurkin, P.I.; Timofeeva, V.A.; Lakeev, S.G. Features of Formation of Magnetite Coatings on Low-Carbon Steel in Hot Nitrate Solutions. Russ. J. Electrochem. 2010, 46, 1155–1166. [Google Scholar] [CrossRef]
  16. Zhu, H.; Cao, F.; Zuo, D.; Zhu, L.; Jin, D.; Yao, K. A New Hydrothermal Blackening Technology for Fe3O4 Coatings of Carbon Steel. Appl. Surf. Sci. 2008, 254, 5905–5909. [Google Scholar] [CrossRef]
  17. Beverskog, B.; Puigdomenech, I. Revised Pourbaix Diagrams for Iron at 25–300 °C. Corros. Sci. 1996, 38, 2121–2135. [Google Scholar] [CrossRef]
  18. Fattah-Alhosseini, A.; Khan, H.Y. Anodic Oxidation of Carbon Steel at High Current Densities and Investigation of Its Corrosion Behavior. Metall. Mater. Trans. B Process Metall. Mater. Process. Sci. 2017, 48, 1659–1666. [Google Scholar] [CrossRef]
  19. Burleigh, T.D.; Schmuki, P.; Virtanen, S. Properties of the Nanoporous Anodic Oxide Electrochemically Grown on Steel in Hot 50% NaOH. J. Electrochem. Soc. 2009, 156, C45. [Google Scholar] [CrossRef]
  20. Burleigh, T.D.; Dotson, T.C.; Dotson, K.T.; Gabay, S.J.; Sloan, T.B.; Ferrell, S.G. Anodizing Steel in KOH and NaOH Solutions. J. Electrochem. Soc. 2007, 154, C579. [Google Scholar] [CrossRef]
  21. Fedot’ev, N.P.; Grilikhes, S.Y. Anodizing Cooper, Magnesium, Zinc, Cadmium, Steel and Silver. Electroplat. Met. Finish. 1960, 13, 413–417. [Google Scholar]
  22. Deutsches Institut für Normung e.V. Brünieren von Bauteilen Aus Eisenwerkstoffen—Anforderungen Und Prüfverfahren; Beuth Verlag GmbH: Berlin, Germany, 2016. [Google Scholar]
  23. Müsig, H.-J.; Arabczyk, W. The Interaction of Oxygen with the Iron (111) Surface, Mainly Studied by AES. Krist. Tech. 1980, 15, 1091–1099. [Google Scholar] [CrossRef]
  24. Misawa, T. The Thermodynamic Consideration for Fe-H2O System at 25 °C. Corros. Sci. 1973, 13, 659–676. [Google Scholar] [CrossRef]
  25. Dünnwald, J.; Otto, A. Ramanspektroskopie an Oxidschichten Auf Reineisen Im Elektrolyten. Fresenius’ Zeitschrift für Analytische Chemie 1984, 319, 738–742. [Google Scholar] [CrossRef]
  26. Schrebler Guzmán, R.S.; Vilche, J.R.; Arvía, A.J. The Potentiodynamic Behaviour of Iron in Alkaline Solutions. Electrochim. Acta 1979, 24, 395–403. [Google Scholar] [CrossRef]
  27. Xu, W.; Daub, K.; Zhang, X.; Noel, J.J.; Shoesmith, D.W.; Wren, J.C. Oxide Formation and Conversion on Carbon Steel in Mildly Basic Solutions. Electrochim. Acta 2009, 54, 5727–5738. [Google Scholar] [CrossRef]
  28. Cekerevac, M.; Nikolic-Bujanovic, L.; Simicic, M. Investigation of Electrochemical Synthesis of Ferrate, Part I: Electrochemical Behavior of Iron and Its Several Alloys in Concentrated Alkaline Solutions. Hem. Ind. 2009, 63, 387–395. [Google Scholar] [CrossRef]
  29. Mácová, Z.; Bouzek, K. The Influence of Electrolyte Composition on Electrochemical Ferrate(VI) Synthesis. Part III: Anodic Dissolution Kinetics of a White Cast Iron Anode Rich in Iron Carbide. J. Appl. Electrochem. 2012, 42, 615–626. [Google Scholar] [CrossRef]
  30. Nieuwoudt, M.K.; Comins, J.D.; Cukrowski, I. The Growth of the Passive Film on Iron in 0.05 M NaOH Studied in Situ by Raman Microspectroscopy and Electrochemical Polarization. Part II: In Situ Raman Spectra of the Passive Film Surface during Growth by Electrochemical Polarization. J. Raman Spectrosc. 2011, 42, 1353–1365. [Google Scholar] [CrossRef]
  31. Beck, F.; Kaus, R.; Oberst, M. Transpassive Dissolution of Iron to Ferrate(VI) in Concentrated Alkali Hydroxide Solutions. Electrochim. Acta 1985, 30, 173–183. [Google Scholar] [CrossRef]
  32. Schmidbaur, H. The History and the Current Revival of the Oxo Chemistry of Iron in Its Highest Oxidation States: Fe VI-Fe VIII. Zeitschrift für Anorganische und Allgemeine Chemie 2018, 644, 536–559. [Google Scholar] [CrossRef]
  33. Perfiliev, Y.D.; Benko, E.M.; Pankratov, D.A.; Sharma, V.K.; Dedushenko, S.K. Formation of Iron(VI) in Ozonalysis of Iron(III) in Alkaline Solution. Inorg. Chim. Acta 2007, 360, 2789–2791. [Google Scholar] [CrossRef]
  34. Rush, J.D.; Bielski, B.H.J. Pulse Radiolysis Studies of Alkaline Iron(III) and Iron(VI) Solutions. Observation of Transient Iron Complexes with Intermediate Oxidation States. J. Am. Chem. Soc. 1986, 108, 523–525. [Google Scholar] [CrossRef] [PubMed]
  35. Perez, N. Electrochemistry and Corrosion Science; Springer International Publishing: Cham, Switzerland, 2016. [Google Scholar]
Figure 1. (a) Auger electron spectrum of a steel sample blackened at 120 °C in hot alkaline nitrite solution, showing (b) the Fe(M2/3VV) signals at 46 and 54 eV with the intensity ratio of 7:10 for magnetite on the surface. (c) Scanning electron microscopy (SEM) image of the same sample (10 kV, 2000 magnification) with some defects in the blackened surface; (d) The atomic force microscopy (AFM) topography image shows a 10 × 10 µm2 area of the steel sample, scaling-up a surface defect similar seen in the SEM image.
Surfaces 02 00017 g001
Figure 2. Cyclic voltammograms of steel in blackening salt solution (a) at various temperatures between room temperature and 100 °C, (b) at 120°C and (c) in 23 M sodium hydroxide solution at various temperatures between room temperature and 100 °C, and (d) at 120 °C; scan rate 50 mV s−1.
Surfaces 02 00017 g002
Figure 3. AFM topography images (25 × 25 µm2) of a steel slice cycled in (a) 23 M NaOH and (b) blackening salt solution. No significant differences in the surface topography appear. Some corrosion at grain boundaries and the presence of corrosion products resemble each other.
Surfaces 02 00017 g003
Figure 4. UV-VIS spectrum of 23 M NaOH after electrochemical blackening at potentials E > 0.6 V vs. Pt. The absorption maximum at approx. 500 nm indicates the formation and presence of ferrate(VI) ions.
Surfaces 02 00017 g004
Figure 5. (a) Auger electron spectrum of steel blackened in NaOH at 80 °C and 0.6 V vs. Pt. (b) The intensity ratio of the peaks at 46 and 54 eV indicates the formation of a magnetite overlayer (Fe3O4), (c,d) SEM images of a steel sample blackened in NaOH at 80 °C and 0.6 V vs. Pt, indicating a corrosive attack during the blackening process (10 kV, (c) 100x, and (d) 2000x magnification).
Surfaces 02 00017 g005aSurfaces 02 00017 g005b
Figure 6. AFM images of steel samples electrochemically blackened in (a) blackening salt solution at 80 °C and (b) 130 °C, and (c) in NaOH at 80 °C, and (d) 120 °C. The images show a 25 × 25 µm2 area of the individual samples.
Surfaces 02 00017 g006aSurfaces 02 00017 g006b
Figure 7. Cyclic voltammogram of blackened steel discs in 0.1 M KCl solution at (a) 80 °C and (b) 120 °C; black curve: blackening salt; red curve: NaOH; scan rate 20 mV s−1.
Surfaces 02 00017 g007
Figure 8. Potentiodynamic polarization curves for pristine and blackened steel surfaces in in 0.1 M KCl; scan rate 1 mV s−1. Electrochemical blackening was performed both in 23 M NaOH and blackening salt solution.
Surfaces 02 00017 g008
Table 1. Reaction conditions for electrochemical blackening of steel in blackening salt solution and in 23 M NaOH between 80 and 130 °C, temperature T, electrode potential E, and final current density jfinal. The profile roughness as obtained from AFM imaging is given in the last column. The use of 23 M NaOH solution at temperatures over 100 °C increases the surface roughness by a factor of 5, in comparison to the chemical hot alkaline blackening.
ElectrolyteT/°CE/V vs. Ptjfinal/mA cm−2Ra/nm
Blackening salt solution 1 kg·L−1800.51.015 ± 4
10000.638 ± 6
130−0.05 (EOC)(0)12 ± 1
NaOH (23 M)800.60.430 ± 11
1000.11.059 ± 7
1200.119.561 ± 11
Table 2. Corrosion potential (Ecorr), corrosion current (jcorr), Tafel slope coefficient (|βc| and βa), polarization resistance (RP) and corrosion rate (kcorr) of steel samples blackened under different conditions. Blank steel samples were used as reference.
SampleEcorr/V vs. Ag/AgCljcorr/µA cm−2|βc|/V dec−1βa/V dec−1RP/kΩ cm−2kcorr/mm a−1
Blank−0.677.10.070.122.70.082
Blackening salt solution 80 °C−0.741.20.040.216.60.014
Blackening salt solution 130 °C−0.572.00.030.185.60.023
NaOH 80 °C−0.844.40.040.123.00.051
NaOH 120 °C−0.752.80.030.123.70.033

