
COVID-19 and Tourism: Analyzing the Effects of COVID-19 Statistics and Media Coverage on Attitudes toward Tourism


Abstract
:1. Introduction
2. Literature Review
2.1. Tourism Impacts and Resident Support for Tourism Development
2.2. Traveler Attitudes toward Tourism
2.3. Sentiment Analysis as a Measure of People’s Attitudes
2.4. The Effects of COVID-19 on Attitudes towards Tourism
3. Methods
4. Results
5. Discussion
Author Contributions
Funding
Institutional Review Board Statement
Informed Consent Statement
Data Availability Statement
Conflicts of Interest
References
- Sands, P.; Turabi, A.E.; Saynisch, P.A.; Dzau, V.J. Assessment of economic vulnerability to infectious disease crises. Lancet 2016, 388, 2443–2448. [Google Scholar] [CrossRef]
- Chen, M.-H.; Jang, S.-C.; Kim, W.G. The impact of the SARS outbreak on Taiwanese hotel stock performance: An event-study approach. Hosp. Manag. 2007, 26, 200–212. [Google Scholar] [CrossRef] [PubMed]
- Haque, T.H.; Haque, M.O. The swine flu and its impacts on tourism in Brunei. J. Hosp. Tour. Manag. 2018, 36, 92–101. [Google Scholar] [CrossRef]
- Pine, R.; McKercher, B. The impact of SARS on Hong Kong’s tourism industry. Int. J. Contemp. Hosp. Manag. 2004, 16, 139–143. [Google Scholar] [CrossRef]
- Law, R. A perspective of SARS and education in hospitality and tourism. J. Teach. Travel Tour. 2005, 5, 53–59. [Google Scholar] [CrossRef]
- Škare, M.; Riberio Soriano, D.; Porada-Rochoń, M. Impact of COVID-19 on the travel and tourism industry. Technol. Forecast. Soc. Chang. 2021, 163, 120469. [Google Scholar] [CrossRef]
- Aronica, M.; Pizzuto, P.; Sciortino, C. COVID-19 And Tourism: What Can We Learn From The Past? World Econ. 2021. [Google Scholar] [CrossRef] [PubMed]
- United Nations World Tourism Organization. International Tourism and COVID-19. 2021. Available online: https://www.unwto.org/international-tourism-and-covid-19 (accessed on 17 November 2021).
- Boone, L. Tackling the fallout from COVID-19. In Economics in the Time of COVID-19; Baldwin, R., di Mauro, B.W., Eds.; CEPR Press: London, UK, 2020; pp. 37–44. [Google Scholar]
- Ludvigson, S.C. Consumer confidence and consumer spending. J. Econ. Perspect. 2004, 18, 29–50. [Google Scholar] [CrossRef] [Green Version]
- Godovykh, M.; Tasci, A.D. The influence of post-visit emotions on destination loyalty. Tour. Rev. 2020, 76, 277–288. [Google Scholar] [CrossRef]
- Hsu, C.H.; Huang, S. An extension of the theory of planned behavior model for tourists. J. Hosp. Tour. Res. 2012, 36, 390–417. [Google Scholar] [CrossRef]
- Ajzen, I. The theory of planned behavior. Organ. Behav. Hum. Decis. Process. 1991, 50, 179–211. [Google Scholar] [CrossRef]
- McGuirk, M. Performing social media analytics with Brandwatch for Classrooms: A platform review. J. Mark. Anal. 2021, 9, 363–378. [Google Scholar] [CrossRef]
- Neri, F.; Aliprandi, C.; Capeci, F.; Cuadros, M.; By, T. Sentiment analysis on social media. In Proceedings of the 2012 IEEE/ACM International Conference on Advances in Social Networks Analysis and Mining, Istanbul, Turkey, 26–29 August 2012. [Google Scholar] [CrossRef]
- Yue, L.; Chen, W.; Li, X.; Zuo, W.; Yin, M. A survey of sentiment analysis in social media. Knowl. Inf. Syst. 2019, 60, 617–663. [Google Scholar] [CrossRef]
- Li, H.; Hu, M.; Li, G. Forecasting tourism demand with multisource big data. Ann. Tour. Res. 2020, 83, 102912. [Google Scholar] [CrossRef]
- Mehraliyev, F.; Chan, I.C.C.; Kirilenko, A.P. Sentiment analysis in hospitality and tourism: A thematic and methodological review. Int. J. Contemp. Hosp. Manag. 2021. [Google Scholar] [CrossRef]
- Önder, I.; Gunter, U.; Scharl, A. Forecasting tourist arrivals with the help of web sentiment: A mixed-frequency modeling approach for big data. Tour. Anal. 2019, 24, 437–452. [Google Scholar] [CrossRef]
- Johnson, J.D.; Snepenger, D.J.; Akis, S. Residents’ perceptions of tourism development. Ann. Tour. Res. 1994, 21, 629–642. [Google Scholar] [CrossRef]
- Seetanah, B. Assessing the dynamic economic impact of tourism for island economies. Ann. Tour. Res. 2011, 38, 291–308. [Google Scholar] [CrossRef]
- Godovykh, M.; Ridderstaat, J. Health outcomes of tourism development: A longitudinal study of the impact of tourism arrivals on residents’ health. J. Destin. Mark. Manag. 2020, 17, 100462. [Google Scholar] [CrossRef]
- Godovykh, M.; Ridderstaat, J.; Fyall, A. The well-being impacts of tourism: Long-term and short-term effects of tourism development on residents’ happiness. Tour. Econ. 2021. [Google Scholar] [CrossRef]
- Hadinejad, A.; Moyle, B.D.; Scott, N.; Kralj, A.; Nunkoo, R. Residents’ attitudes to tourism: A review. Tour. Rev. 2019, 74, 150–165. [Google Scholar] [CrossRef]
- Scott, D.; Hall, C.M.; Gössling, S. Global tourism vulnerability to climate change. Ann. Tour. Res. 2019, 77, 49–61. [Google Scholar] [CrossRef]
- Yang, L. Ethnic tourism and cultural representation. Ann. Tour. Res. 2011, 38, 561–585. [Google Scholar] [CrossRef]
- Liang, Z.-X.; Bao, J.-G. Tourism gentrification in Shenzhen, China: Causes and socio-spatial consequences. Tour. Geogr. 2015, 17, 461–481. [Google Scholar] [CrossRef]
- Gursoy, D.; Rutherford, D.G. Host attitudes towards tourism: An improved structural model. Ann. Tour. Res. 2004, 31, 495–516. [Google Scholar] [CrossRef]
- Easterling, D.S. The residents’ perspective in tourism research: A review and synthesis. J. Travel Tour. Mark. 2004, 17, 45–62. [Google Scholar] [CrossRef]
- McKercher, B.; Wang, D.; Park, E. Social impacts as a function of place change. Ann. Tour. Res. 2015, 50, 52–66. [Google Scholar] [CrossRef] [Green Version]
- Andereck, K.; Pachmeyer, A.; Zhao, S. Resident Attitudes towards Tourism—The State of Knowledge. Available online: https://scholarworks.umass.edu/cgi/viewcontent.cgi?article=1714&context=ttra (accessed on 17 November 2021).
- Crompton, J.L. Motivations for pleasure vacations. Ann. Tour. Res. 1979, 4, 184–194. [Google Scholar] [CrossRef]
- Moscardo, G.; Dann, G.; McKercher, B. Do tourists travel for the discovery of “self” or search for the “other”? Tour. Recreat. Res. 2014, 39, 81–106. [Google Scholar] [CrossRef]
- Tasci, A.D.A.; Ko, Y.J. Travel needs revisited. J. Vacat. Mark. 2017, 23, 20–36. [Google Scholar] [CrossRef]
- Godovykh, M.; Pizam, A.; Bahja, F. Antecedents and outcomes of health risk perceptions in tourism, following the COVID-19 pandemic. Tour. Rev. 2021, 76, 737–748. [Google Scholar] [CrossRef]
- Mitchell, V.W. Understanding consumers’ behaviour: Can perceived risk theory help? Manag. Decis. 1992, 30, 26–31. [Google Scholar] [CrossRef]
- Hwang, J.; Choe, J.Y. Exploring perceived risk in building successful drone food delivery services. Int. J. Contemp. Hosp. Manag. 2019, 31, 3249–3269. [Google Scholar] [CrossRef]
- Sánchez-Cañizares, S.M.; Cabeza-Ramírez, L.J.; Muñoz-Fernández, G.; Fuentes-García, F.J. Impact of the perceived risk from COVID-19 on intention to travel. Curr. Issues Tour. 2021, 24, 970–984. [Google Scholar] [CrossRef]
- Liu, B. Sentiment Analysis: Mining Opinions, Sentiments, and Emotions; Cambridge University Press: Cambridge, UK, 2015. [Google Scholar]
- Hasegawa, S.; Suzuki, T.; Yagahara, A.; Kanda, R.; Aono, T.; Yajima, K.; Ogasawara, K. Changing emotions about Fukushima related to the Fukushima nuclear power station accident–how rumors determined people’s attitudes: Social media sentiment analysis. J. Med. Internet Res. 2020, 22, e18662. [Google Scholar] [CrossRef]
- Liu, S.; Liu, J. Public attitudes towards COVID-19 vaccines on English-language Twitter: A sentiment analysis. Vaccine 2021, 39, 5499–5505. [Google Scholar] [CrossRef] [PubMed]
- Nemes, L.; Kiss, A. Social media sentiment analysis based on COVID-19. J. Inf. Telecommun. 2020, 5, 1–15. [Google Scholar] [CrossRef]
- Barua, S.; Nath, S.D. The impact of COVID-19 on air pollution: Evidence from global data. J. Clean. Prod. 2021, 298, 1–10. [Google Scholar] [CrossRef] [PubMed]
- Dube, K.; Nhamo, G.; Chikodzi, D. COVID-19 cripples global restaurant and hospitality industry. Curr. Issues Tour. 2021, 24, 1487–1490. [Google Scholar] [CrossRef]
- Qiu, R.T.R.; Park, J.; Li, S.; Song, H. Social costs of tourism during the COVID-19 pandemic. Ann. Tour. Res. 2020, 84, 102994. [Google Scholar] [CrossRef]
- Farzanegan, M.R.; Gholipour, H.F.; Feizi, M.; Nunkoo, R.; Andargoli, A.E. International tourism and outbreak of coronavirus (COVID-19): A cross-country analysis. J. Travel Res. 2020, 60, 687–692. [Google Scholar] [CrossRef]
- Kamata, H. Tourist destination residents’ attitudes towards tourism during and after the COVID-19 pandemic. Curr. Issues Tour. 2021, 1–16. [Google Scholar] [CrossRef]
- Joo, D.; Xu, W.; Lee, J.; Lee, C.-K.; Woosman, K.M. Residents’ perceived risk, emotional solidarity, and support for tourism amidst the COVID-19 pandemic. J. Destin. Mark. Manag. 2021, 19, 100553. [Google Scholar] [CrossRef]
- Landry, C.E.; Bergstrom, J.; Salazar, J.; Turner, D. How has the COVID-29 pandemic affected outdoor recreation in the U.S.? A revealed preference approach. Appl. Econ. Policy 2021, 43, 443–457. [Google Scholar]
- CDC. COVID Data Tracker. 2021. Available online: https://covid.cdc.gov/covid-data-tracker/#datatracker-home (accessed on 17 November 2021).
- Buckman, S.R.; Shapiro, A.H.; Sudhof, M.; Wilson, D.J. News sentiment in the time of COVID-19. FRBSF Econ. Lett. 2020, 8, 1–5. [Google Scholar]
- Shapiro, A.H.; Sudhof, M.; Wilson, D.J. Measuring news sentiment. J. Econom. 2020. [Google Scholar] [CrossRef]
- Stavrakantonakis, I.; Gagiu, A.E.; Kasper, H.; Toma, I.; Thalhammer, A. An approach for evaluation of social media monitoring tools. Common. Value Manag. 2012, 52, 52–64. [Google Scholar]
- Wooldridge, J.M. Econometric Analysis of Cross Section and Panel Data; MIT Press: Cambridge, MA, USA, 2010. [Google Scholar]
- Lavraskas, P.J. Encyclopedia of Survey Research Methods; Sage Publications: Thousand Oaks, CA, USA, 2008. [Google Scholar]
- Hodrick, R.J.; Prescott, E.C. Postwar US business cycles: An empirical investigation. J. Money Credit. Bank. 1997, 29, 1–16. [Google Scholar] [CrossRef]
- Meng, T. Clusters in the Spread of the COVID-19 Pandemic: Evidence From the G20 Countries. Front. Public Health 2021, 8, 948. [Google Scholar] [CrossRef]
- Dickey, D.A.; Fuller, W.A. Distribution of the estimators for autoregressive time series with a unit root. J. Am. Stat. Assoc. 1979, 74, 427–431. [Google Scholar]
- Kwiatkowski, D.; Phillips, P.C.; Schmidt, P.; Shin, Y. Testing the null hypothesis of stationarity against the alternative of a unit root. J. Econom. 1992, 54, 159–178. [Google Scholar] [CrossRef]
- Granger, C.W. Some recent development in a concept of causality. J. Econom. 1988, 39, 199–211. [Google Scholar] [CrossRef]
- Cahyanto, I.; Wiblishauser, M.; Pennington-Gray, L.; Schroeder, A. The dynamics of travel avoidance: The case of Ebola in the US. Tour. Manag. Perspect. 2016, 20, 195–203. [Google Scholar] [CrossRef] [PubMed]
- Brown, C.B. Tourism, crime and risk perception: An examination of broadcast media′s framing of negative Aruban sentiment in the Natalee Holloway case and its impact on tourism demand. Tour. Manag. Perspect. 2015, 16, 266–277. [Google Scholar] [CrossRef]
- Murdock, M.R.; Rajagopal, P. The sting of social: How emphasizing social consequences in warning messages influences perceptions of risk. J. Mark. 2017, 81, 83–98. [Google Scholar] [CrossRef]
- Dryhurst, S.; Schneider, C.R.; Kerr, J.; Freeman, A.L.; Recchia, G.; Van Der Bles, A.M.; Spiegelhalter, D.; van der Linden, S. Risk perceptions of COVID-19 around the world. J. Risk Res. 2020, 23, 994–1006. [Google Scholar] [CrossRef]
- Paek, H.J.; Hove, T. Risk perceptions and risk characteristics. In Oxford Research Encyclopedia of Communication; Oxford University Press: Oxford, UK, 2017; pp. 1–16. [Google Scholar]
- Le, T.H.; Arcodia, C. Risk perceptions on cruise ships among young people: Concepts, approaches and directions. Int. J. Hosp. Manag. 2018, 69, 102–112. [Google Scholar] [CrossRef]
- Sohn, H.K.; Lee, T.J.; Yoon, Y.S. Relationship between perceived risk, evaluation, satisfaction, and behavioral intention: A case of local-festival visitors. J. Travel Tour. Mark. 2016, 33, 28–45. [Google Scholar] [CrossRef]
- Ajzen, I. From intentions to actions: A theory of planned behavior. In Action Control; Springer: Berlin, UK, 1985; pp. 11–39. [Google Scholar]
- Choi, K.-H.; Kim, I. Co-movement between tourist arrivals of inbound tourism markets in South Korea: Applying the dynamic cupola method using secondary time series data. Sustainability 2021, 13, 1283. [Google Scholar] [CrossRef]
- Sigala, M. Tourism and COVID-19: Impacts and implications for advancing and resetting industry and research. J. Bus. Res. 2020, 117, 312–321. [Google Scholar] [CrossRef]
- Chatfield, C. The Analysis of Time Series: Theory and Practice; Springer: Berlin/Heidelberg, Germany, 2001. [Google Scholar]
- Huh, C.; Vogt, C.A. Changes in residents’ attitudes toward tourism over time: A cohort analytical approach. J. Travel Res. 2008, 46, 446–455. [Google Scholar] [CrossRef]
- Nunkoo, R.; Gursoy, D. Residents’ support for tourism: An identity perspective. Ann. Tour. Res. 2012, 39, 243–268. [Google Scholar] [CrossRef]
- Novelli, M.; Burgess, L.G.; Jones, A.; Ritchie, B.W. “No Ebola…still doomed”: The Ebola-induced tourism crisis. Ann. Tour. Res. 2018, 70, 76–87. [Google Scholar] [CrossRef] [PubMed]


| Variable | Obs. | Mean | Std. Dev. | Min | Max |
|---|---|---|---|---|---|
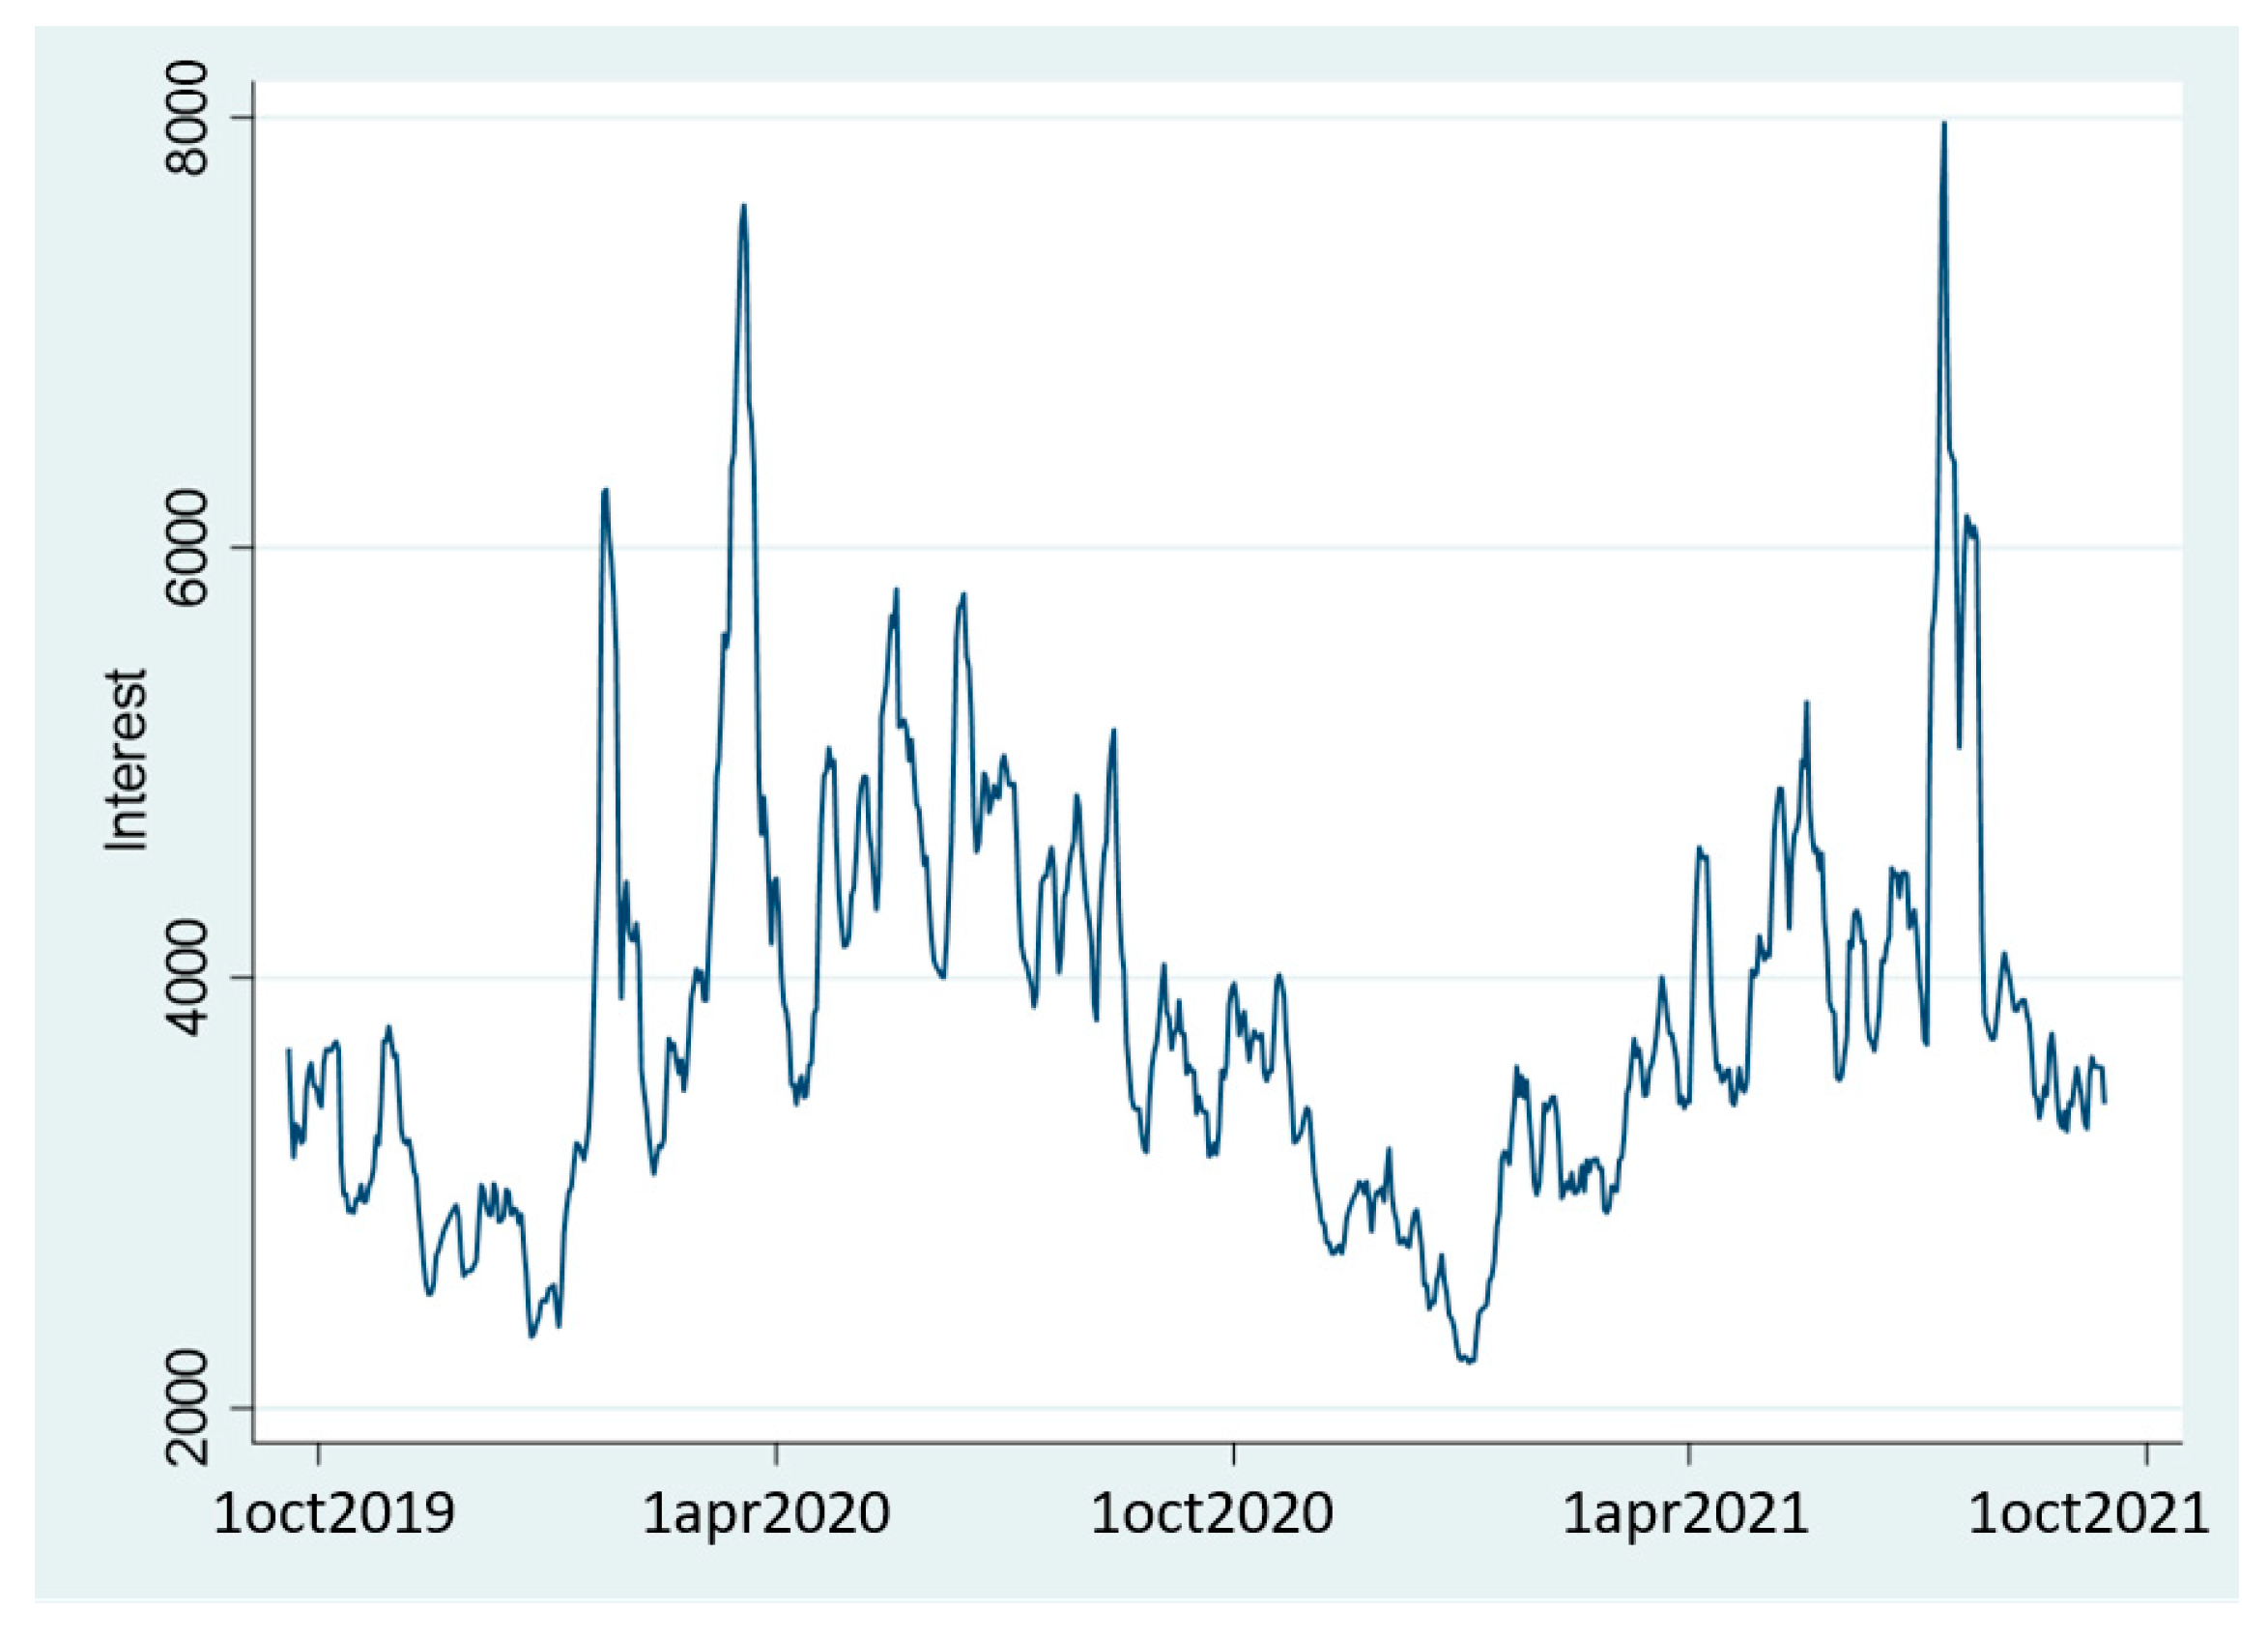
| Interest | 727 | 3822.343 | 946.5366 | 2209 | 7975 |
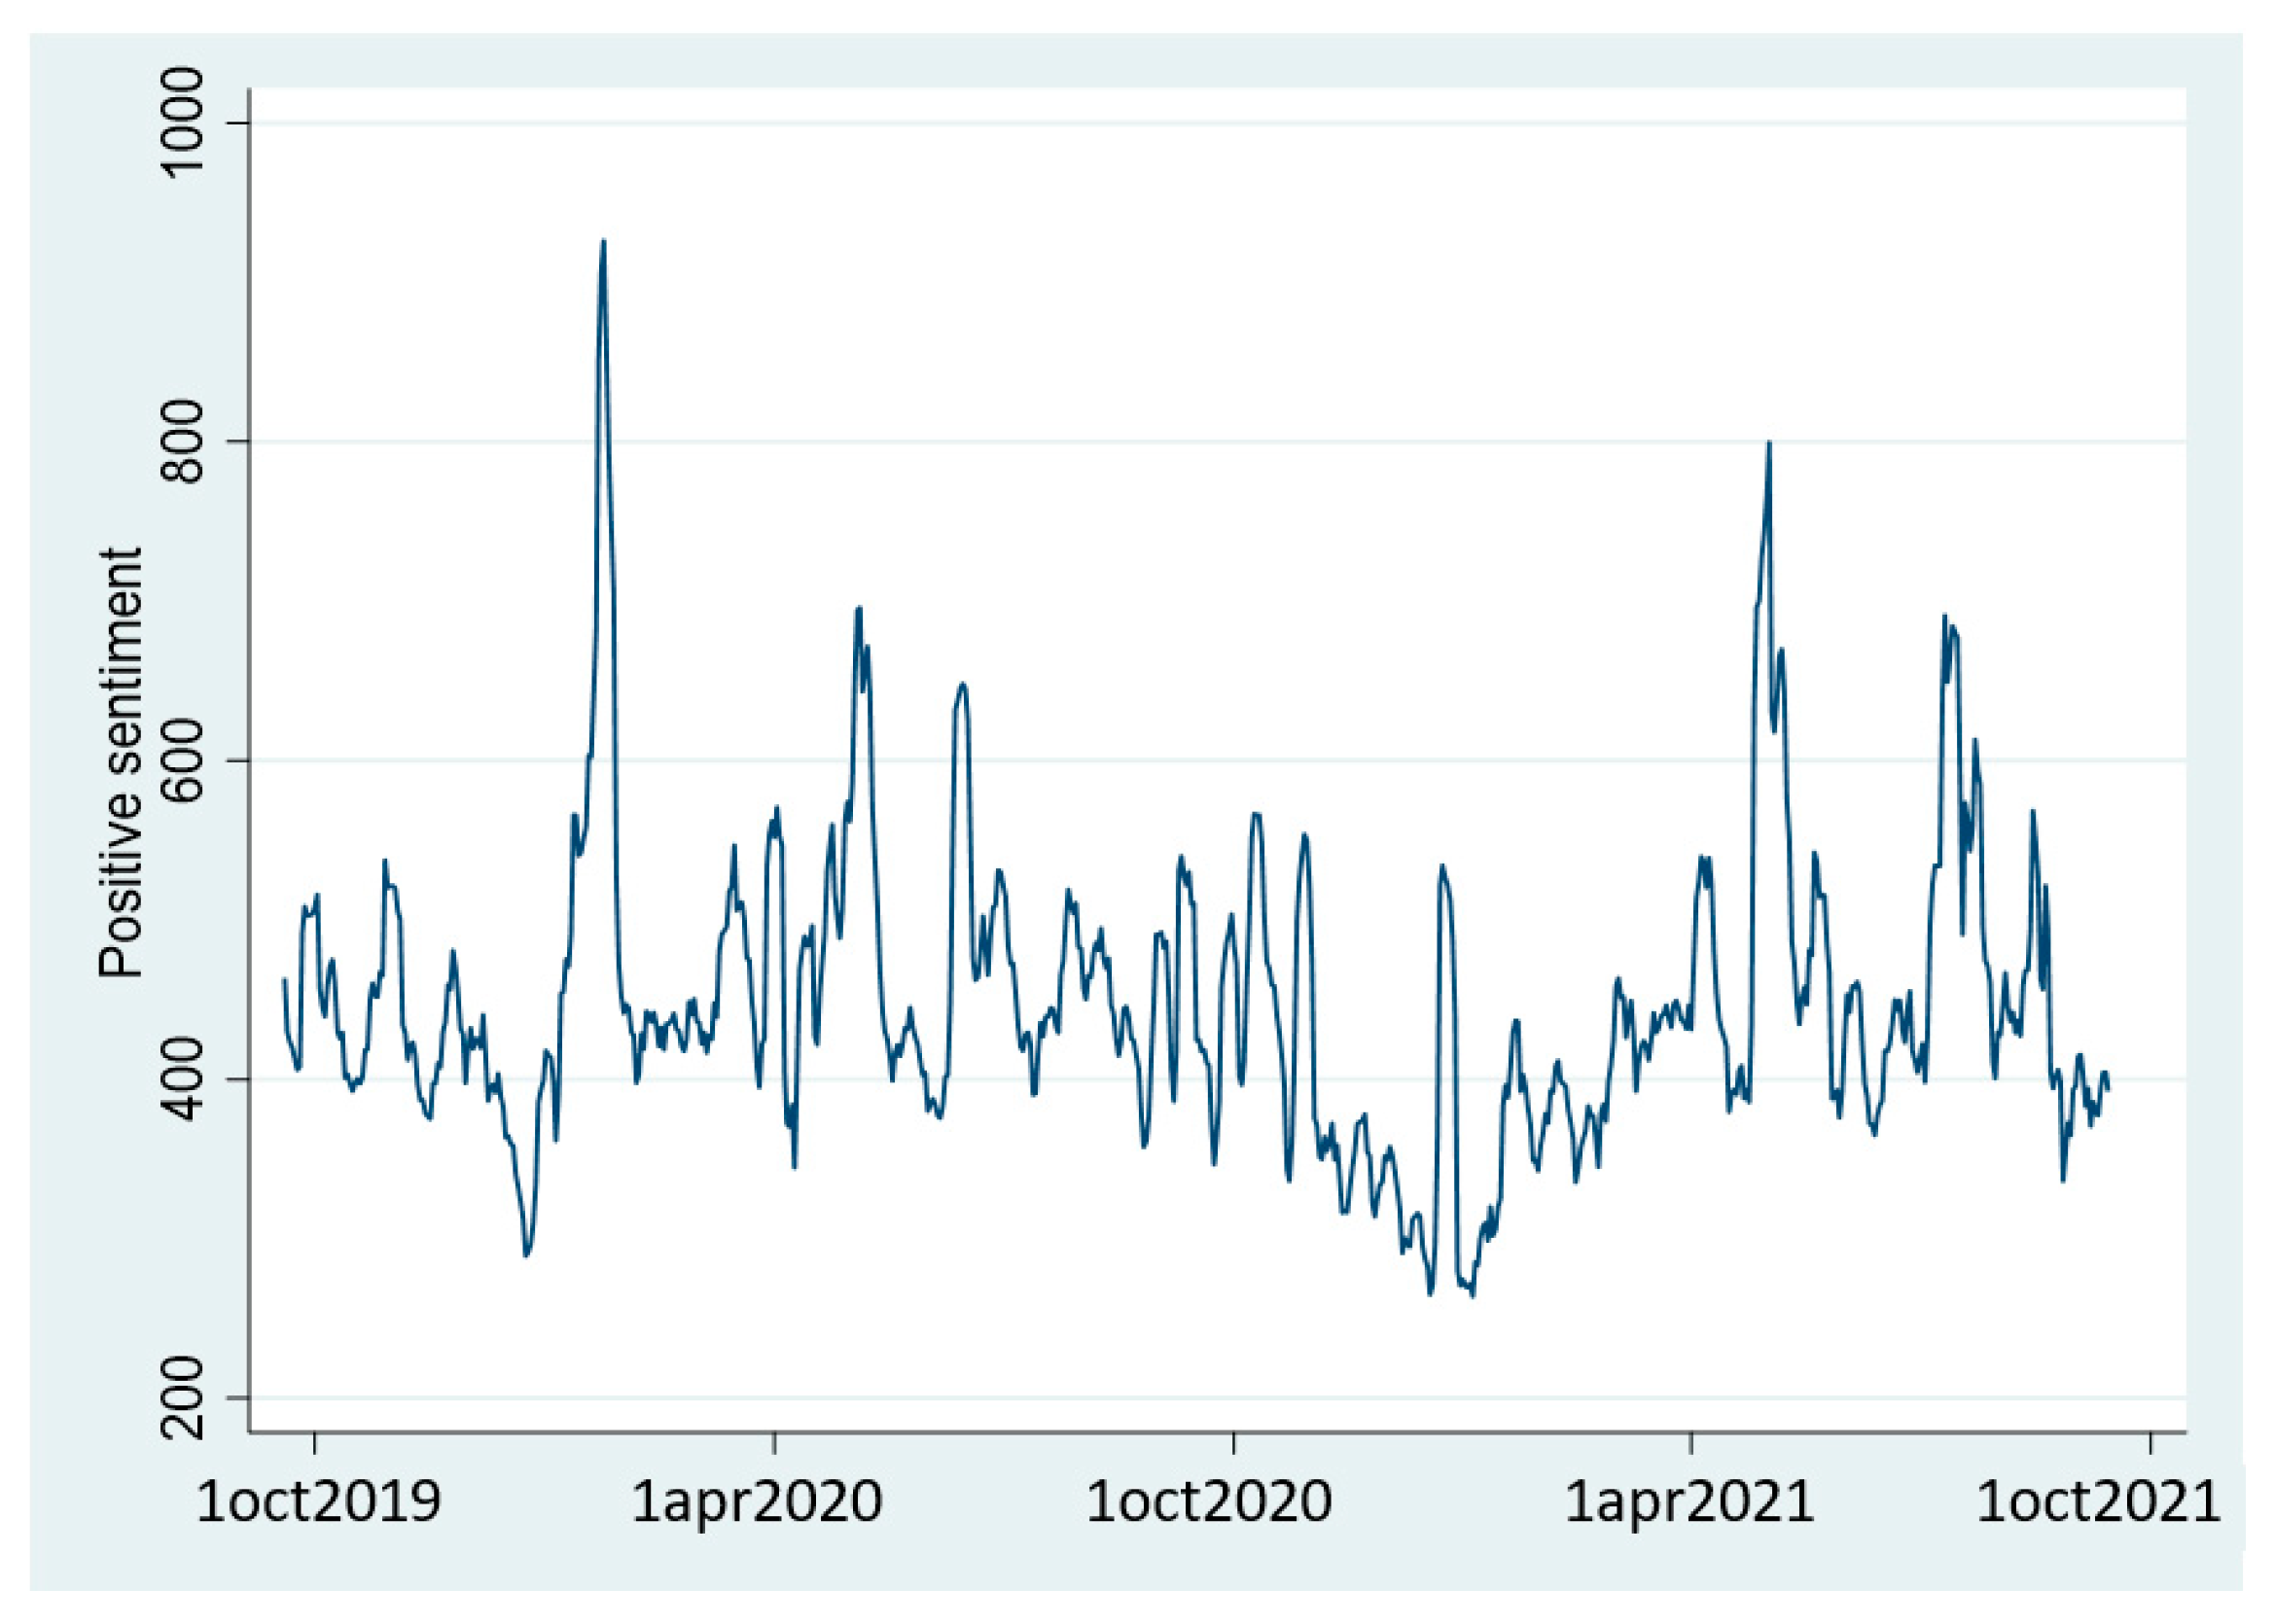
| Positive sentiment | 727 | 0.1201 | 0.0219502 | 0.0673491 | 0.2105171 |
| Negative sentiment | 727 | 0.2159 | 0.0475 | 0.1224687 | 0.4772551 |
| COVID-19 cases | 727 | 56,498.32 | 62,309.94 | 0 | 254,014.3 |
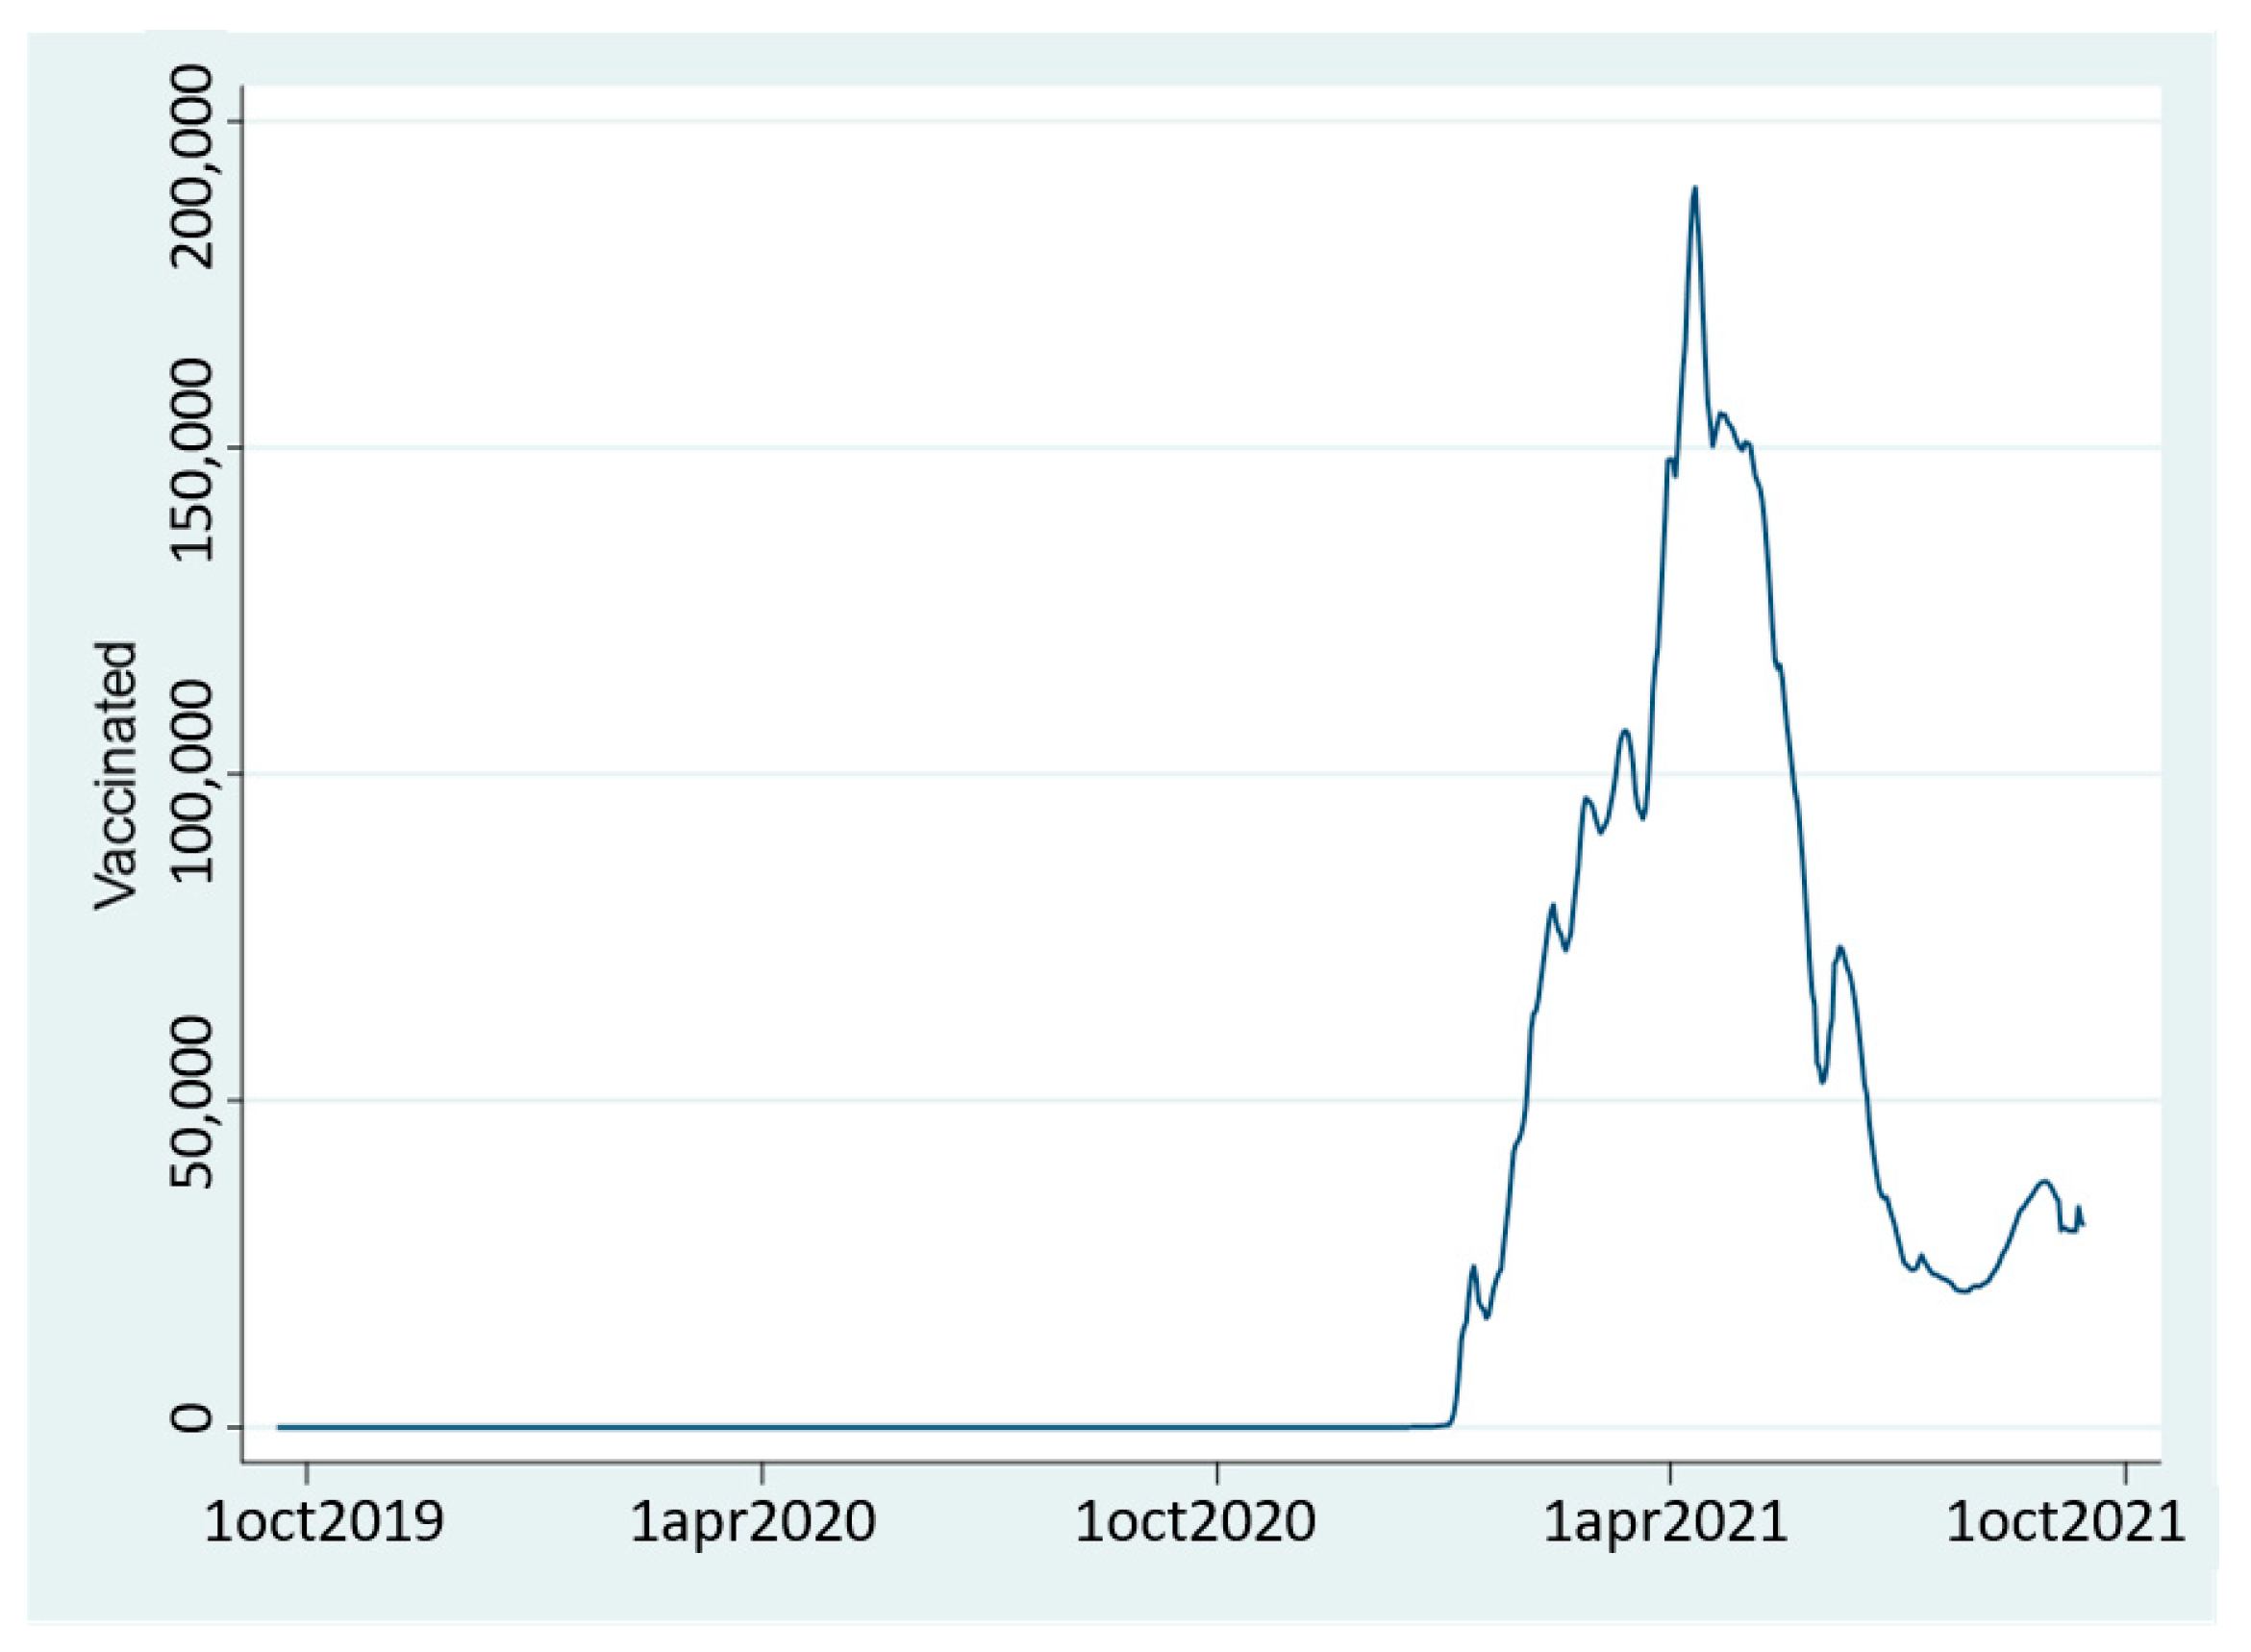
| Vaccinations | 727 | 246,955.5 | 442,117.6 | 0 | 1,898,309 |
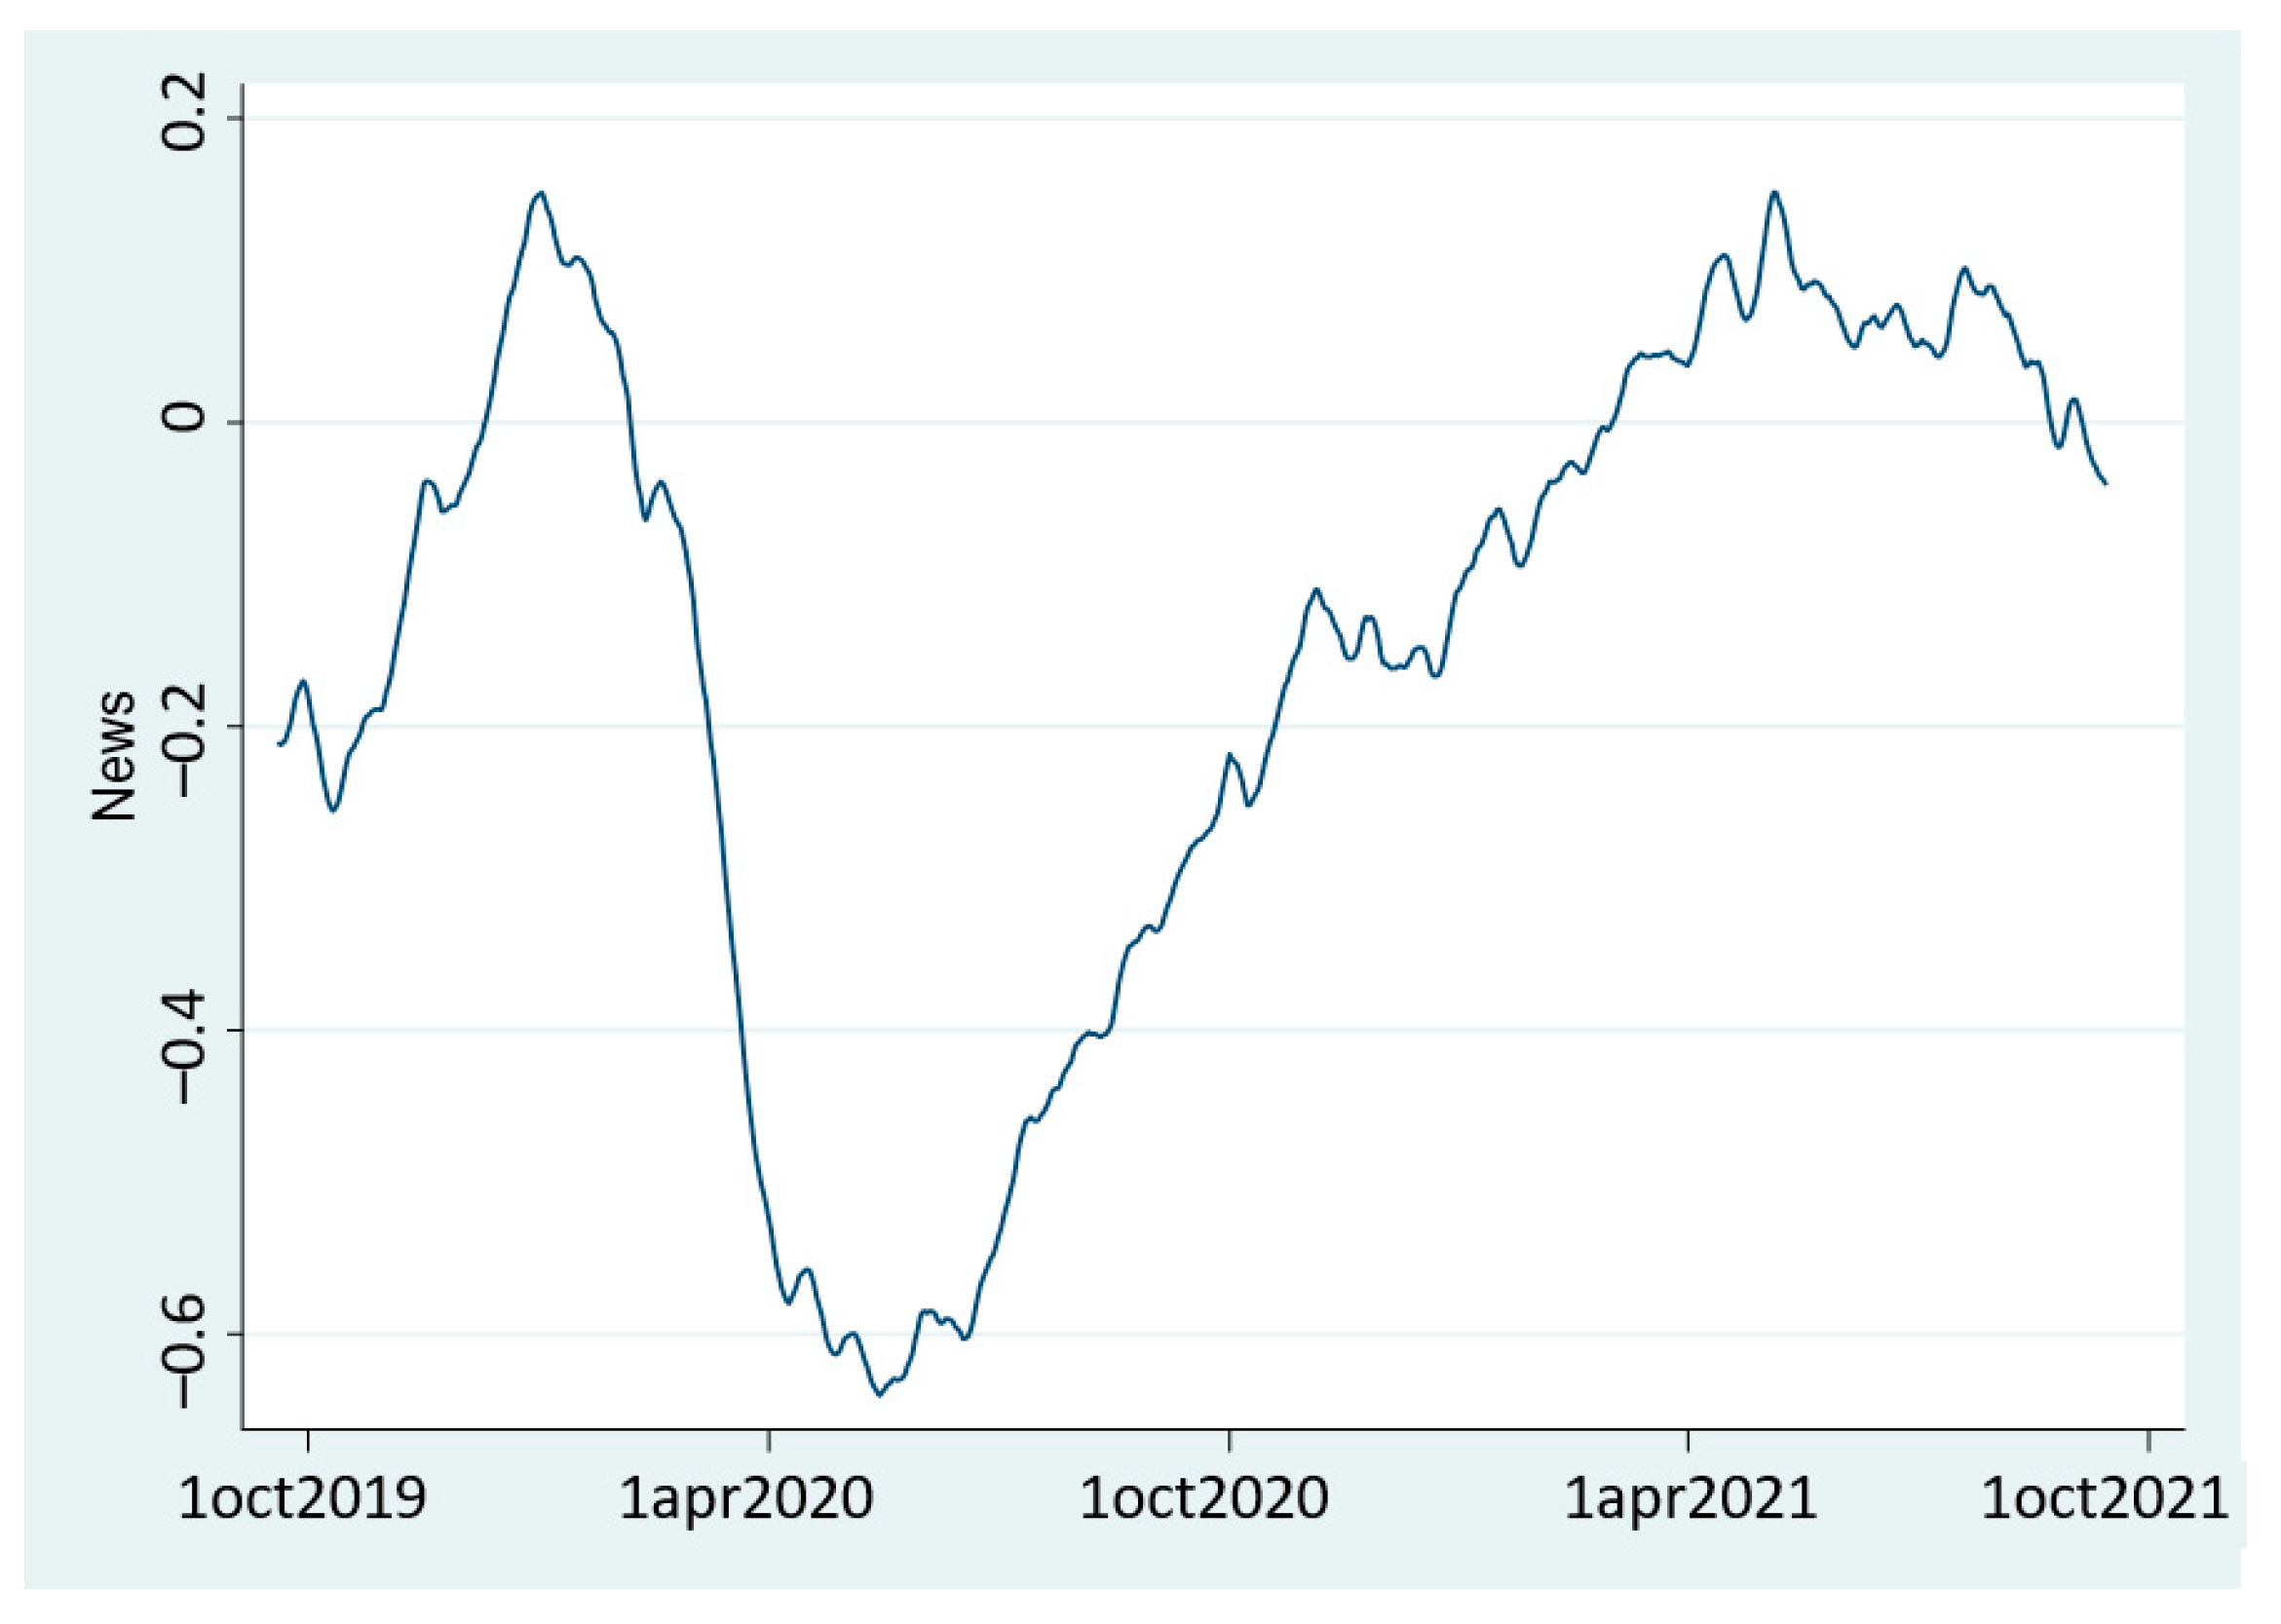
| News | 727 | −0.155122 | 0.2299361 | −0.6402459 | 0.1515863 |
| ADF | KPSS | Integration | |||
|---|---|---|---|---|---|
| Level | First Difference | Level | First Difference | ||
| Interest | −56.264 *** | −14.338 *** | 1.09 *** | 0.793 *** | I(0) or I(1) |
| Positive sentiment | −34.259 *** | −17.664 *** | 1.28 *** | 0.774 *** | I(0) or I(1) |
| Negative sentiment | −14.852 *** | −16.474 *** | 1.74 *** | 1.33 *** | I(0) or I(1) |
| COVID-19 cases | −11.432 *** | −21.501 *** | 1.47 *** | 1.56 *** | I(0) or I(1) |
| Vaccinations | −93.217 *** | −34.295 *** | 1.05 *** | 1.17 *** | I(0) or I(1) |
| News sentiment | −26.010 *** | −34.759 *** | 1.8 *** | 0.889 *** | I(0) or I(1) |
| ADF | KPSS | Integration | |||
|---|---|---|---|---|---|
| Level | First Difference | Level | First Difference | ||
| Interest | −6.504 *** | −15.347 *** | 0.200 *** | 0.017 | I(0) |
| Positive sentiment | −7.882 *** | −17.885 *** | 0.140 * | 0.008 | I(0) |
| Negative sentiment | −7.487 *** | −17.686 *** | 0.229 *** | 0.009 | I(0) |
| COVID-19 cases | −2.763 *** | −13.468 *** | 0.920 *** | 0.280 *** | I(0) or I(1) |
| Vaccinations | −3.178 *** | −8.319 *** | 1.230 *** | 0.898 *** | I(0) or I(1) |
| News sentiment | −4.806 *** | −8.108 *** | 1.290 *** | 0.177 ** | I(0) or I(1) |
| Lags | Chi2 | Prob > Chi2 | |
|---|---|---|---|
| COVID-19 cases → Interest | 4 | 6.656 | 0.084 * |
| Vaccinations → Interest | 4 | 1.410 | 0.703 |
| News sentiment → Interest | 4 | 6.967 | 0.073 * |
| COVID-19 cases → Positive sentiment | 4 | 13.426 | 0.004 *** |
| Vaccinations → Positive sentiment | 4 | 42.2 | 0.000 *** |
| News sentiment → Positive sentiment | 4 | 31.124 | 0.000 *** |
| COVID-19 cases → Negative sentiment | 4 | 24.484 | 0.000 * |
| Vaccinations → Negative sentiment | 4 | 6.471 | 0.091 * |
| News sentiment → Negative sentiment | 4 | 14.703 | 0.002 *** |
| Lags | Chi2 | Prob > Chi2 | |
|---|---|---|---|
| COVID-19 cases → Interest | 2 | 5.294 | 0.071 * |
| Vaccinations → Interest | 2 | 0.487 | 0.784 |
| News sentiment → Interest | 2 | 1.922 | 0.383 |
| COVID-19 cases → Positive sentiment | 2 | 5.042 | 0.080 * |
| Vaccinations → Positive sentiment | 2 | 7.901 | 0.019 ** |
| News sentiment → Positive sentiment | 2 | 5.256 | 0.072 * |
| COVID-19 cases → Negative sentiment | 2 | 17.744 | 0.418 |
| Vaccinations → Negative sentiment | 2 | 4.56 | 0.102 |
| News sentiment → Negative sentiment | 2 | 0.749 | 0.688 |
| Interest | Positive Sentiment | Negative Sentiment | ||||
|---|---|---|---|---|---|---|
| Trend R2 = 0.456; F = 202.46 | Cycles R2 = 0.020; F = 4.97 | Trend R2 = 0.695; F = 550.87 | Cycles R2 = 0.012; F = 2.89 | Trend R2 = 0.667; F = 482.85 | Cycles R2 = 0.027; F = 6.77 | |
| COVID-19 cases | −0.4159 *** | −0.1790 *** | −0.0910 *** | −0.0298 | 0.6568 *** | 0.2025 *** |
| Vaccinations | 1.1099 *** | −0.0521 | −0.8393 *** | 0.0902 ** | −0.0682 | 0.0338 |
| News sentiment | −1.2594 *** | −0.1265 * | 1.0704 *** | 0.0375 | −0.4051 *** | 0.0787 |
Publisher’s Note: MDPI stays neutral with regard to jurisdictional claims in published maps and institutional affiliations. |
© 2021 by the authors. Licensee MDPI, Basel, Switzerland. This article is an open access article distributed under the terms and conditions of the Creative Commons Attribution (CC BY) license (https://creativecommons.org/licenses/by/4.0/).
Share and Cite
Godovykh, M.; Ridderstaat, J.; Baker, C.; Fyall, A. COVID-19 and Tourism: Analyzing the Effects of COVID-19 Statistics and Media Coverage on Attitudes toward Tourism. Forecasting 2021, 3, 870-883. https://doi.org/10.3390/forecast3040053
Godovykh M, Ridderstaat J, Baker C, Fyall A. COVID-19 and Tourism: Analyzing the Effects of COVID-19 Statistics and Media Coverage on Attitudes toward Tourism. Forecasting. 2021; 3(4):870-883. https://doi.org/10.3390/forecast3040053
Chicago/Turabian StyleGodovykh, Maksim, Jorge Ridderstaat, Carissa Baker, and Alan Fyall. 2021. "COVID-19 and Tourism: Analyzing the Effects of COVID-19 Statistics and Media Coverage on Attitudes toward Tourism" Forecasting 3, no. 4: 870-883. https://doi.org/10.3390/forecast3040053