
UV-Spectrophotometric Determination of the Active Pharmaceutical Ingredients Meloxicam and Nimesulide in Cleaning Validation Samples with Sodium Carbonate


Abstract
:1. Introduction
2. Materials and Methods
2.1. Reagents and Equipment
2.2. Preparation of the 10% Solution of Sodium Carbonate
2.3. Preparation of the 50 mg/L Stock Solution of Nimesulide
2.4. Preparation of Working Solutions of Nimesulide
2.5. Preparation of Sample Solutions of Nimesulide from Tablets
2.6. Preparation of Swab Extracts of Nimesulide from Working Solution
2.7. Preparation of Swab Extracts of Nimesulide from Tablets
2.8. Preparation of the 50 mg/L Stock Solution of Meloxicam
2.9. Preparation of Working Solutions of Meloxicam
2.10. Preparation of Sample Solutions of Meloxicam from Tablets
2.11. Preparation of Swab Extracts of Meloxicam from Working Solution
2.12. Preparation of Swab Extracts of Meloxicam from Tablets
2.13. General Procedure for the Determination of Nimesulide
2.14. General Procedure for the Determination of Meloxicam
3. Results
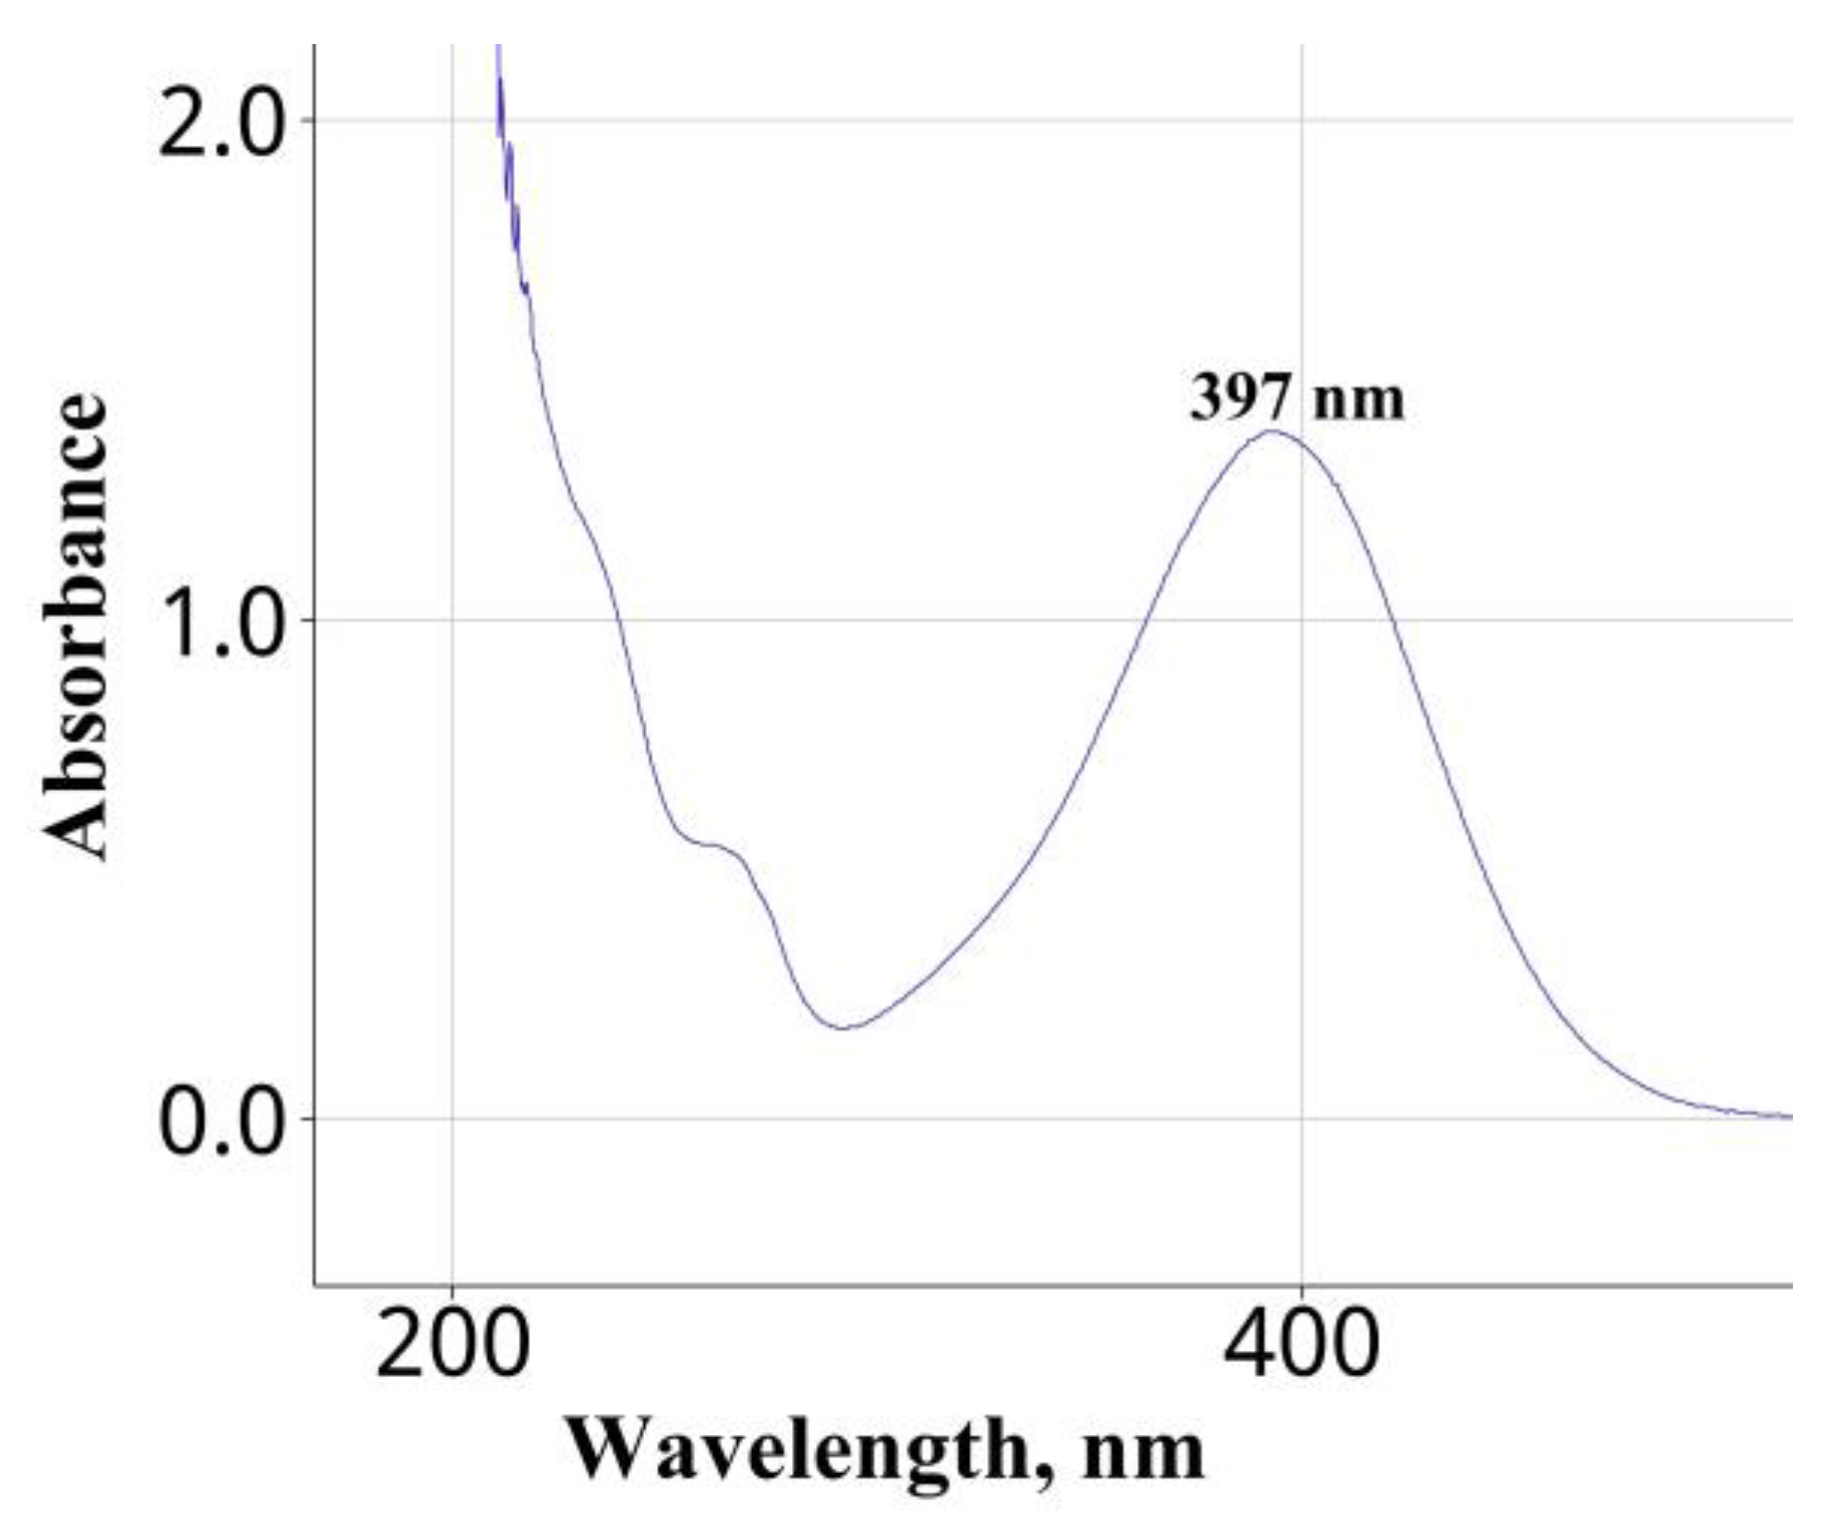
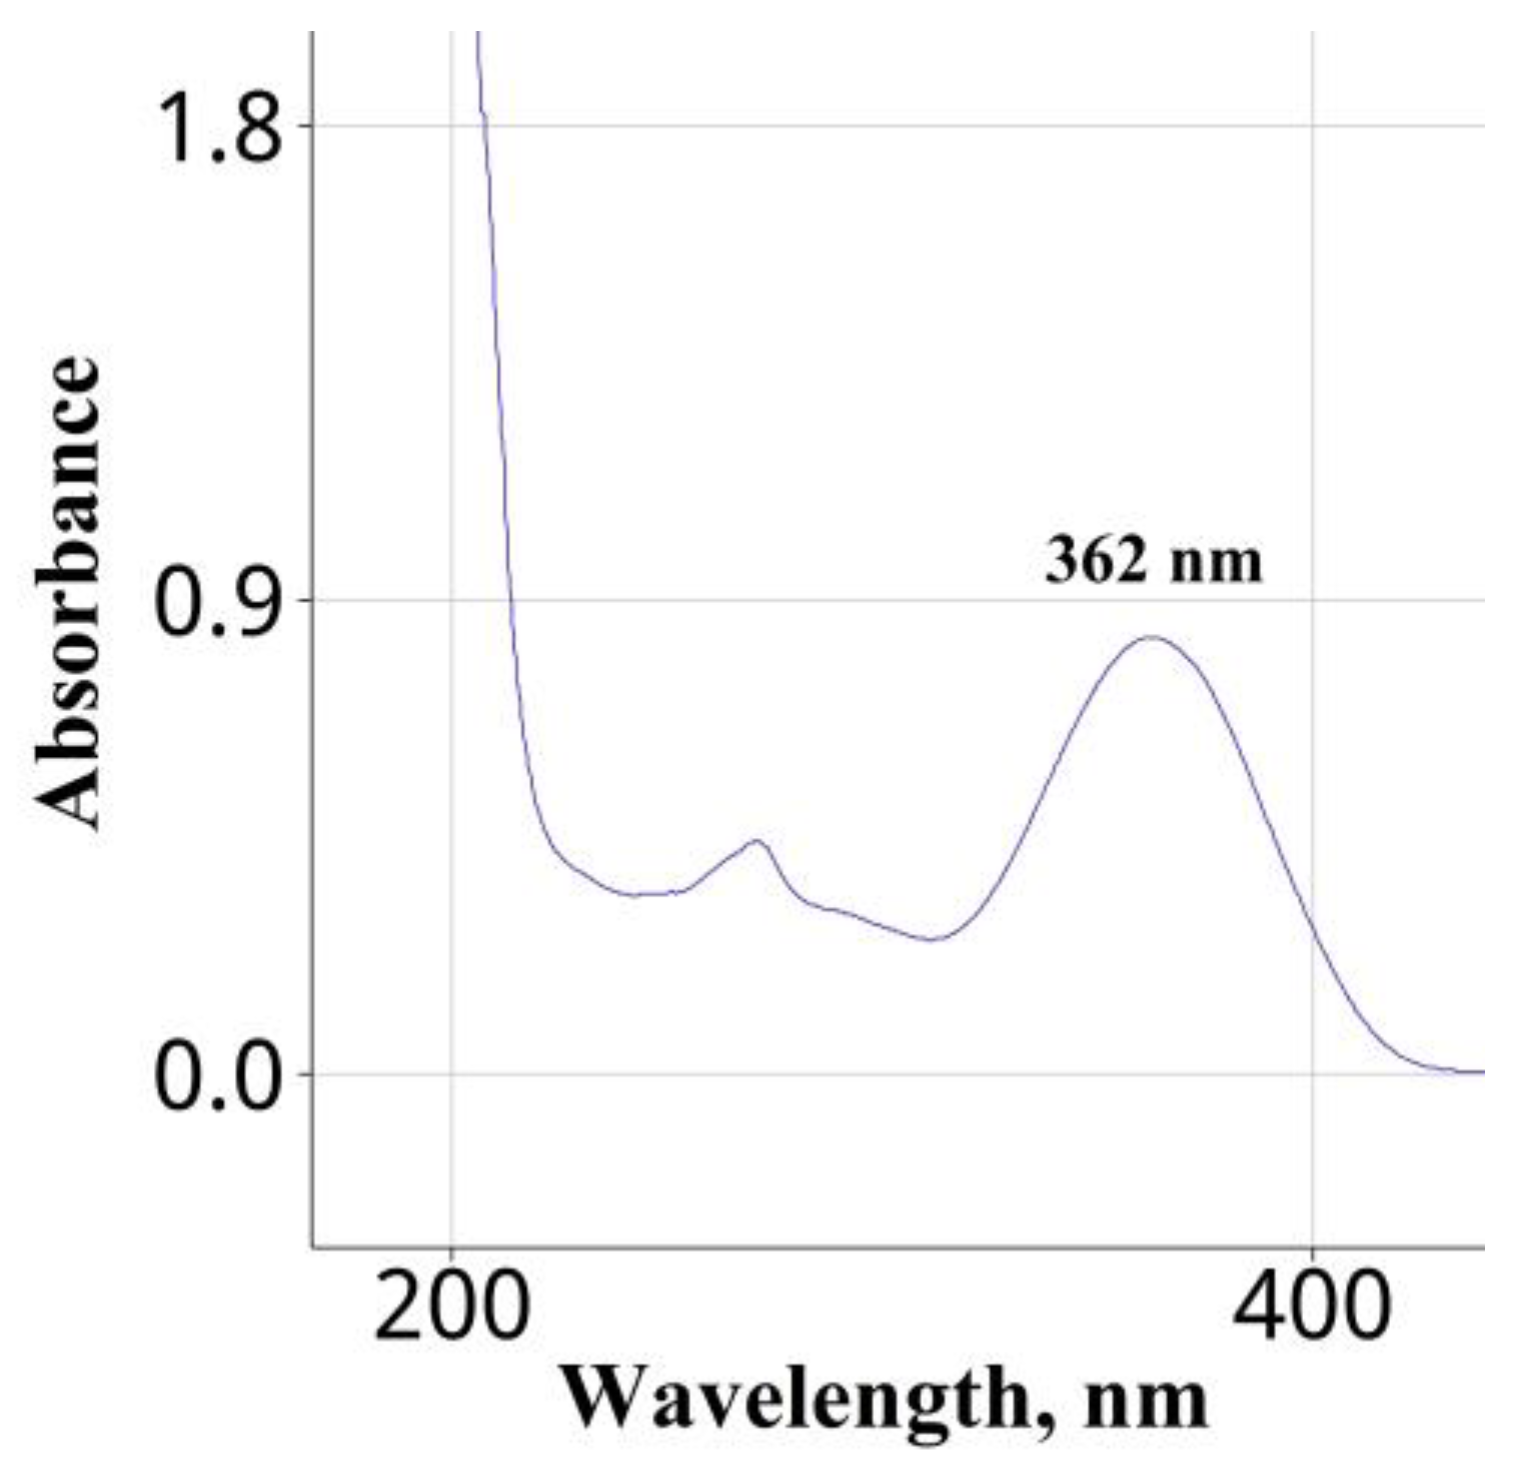
3.1. Selection of the Wavelength
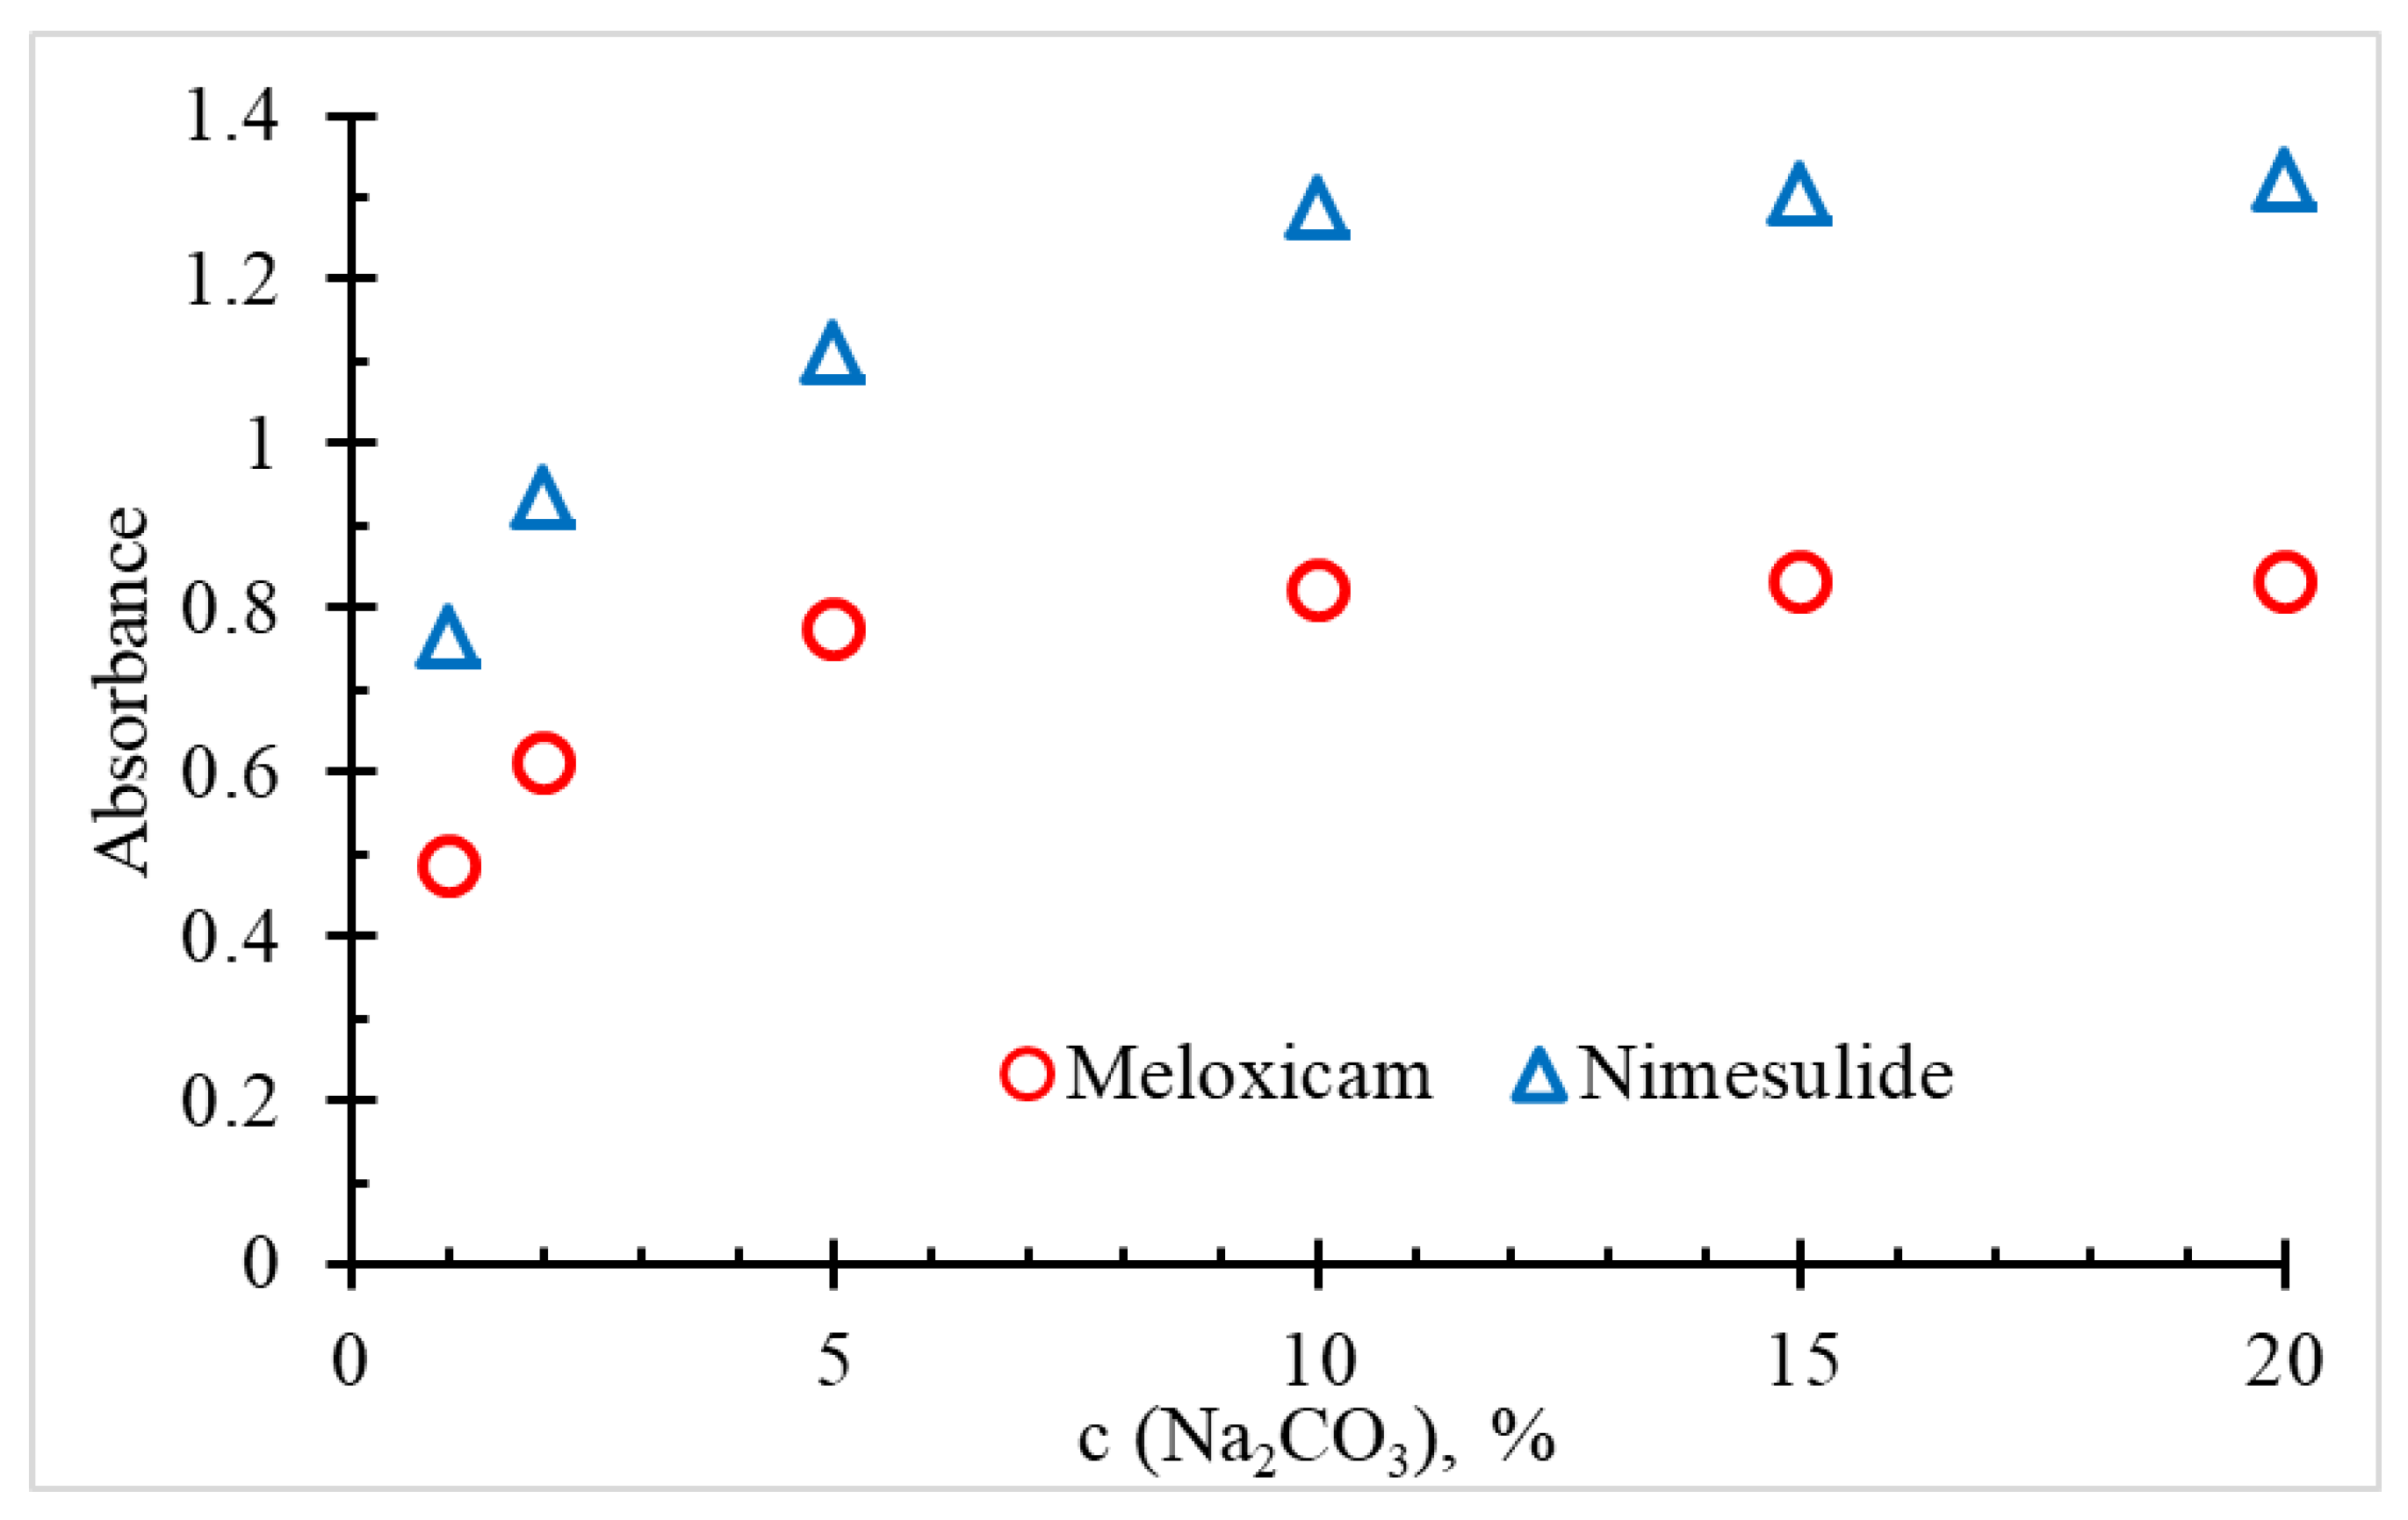
3.2. Selection of Sodium Carbonate Solution Concentration
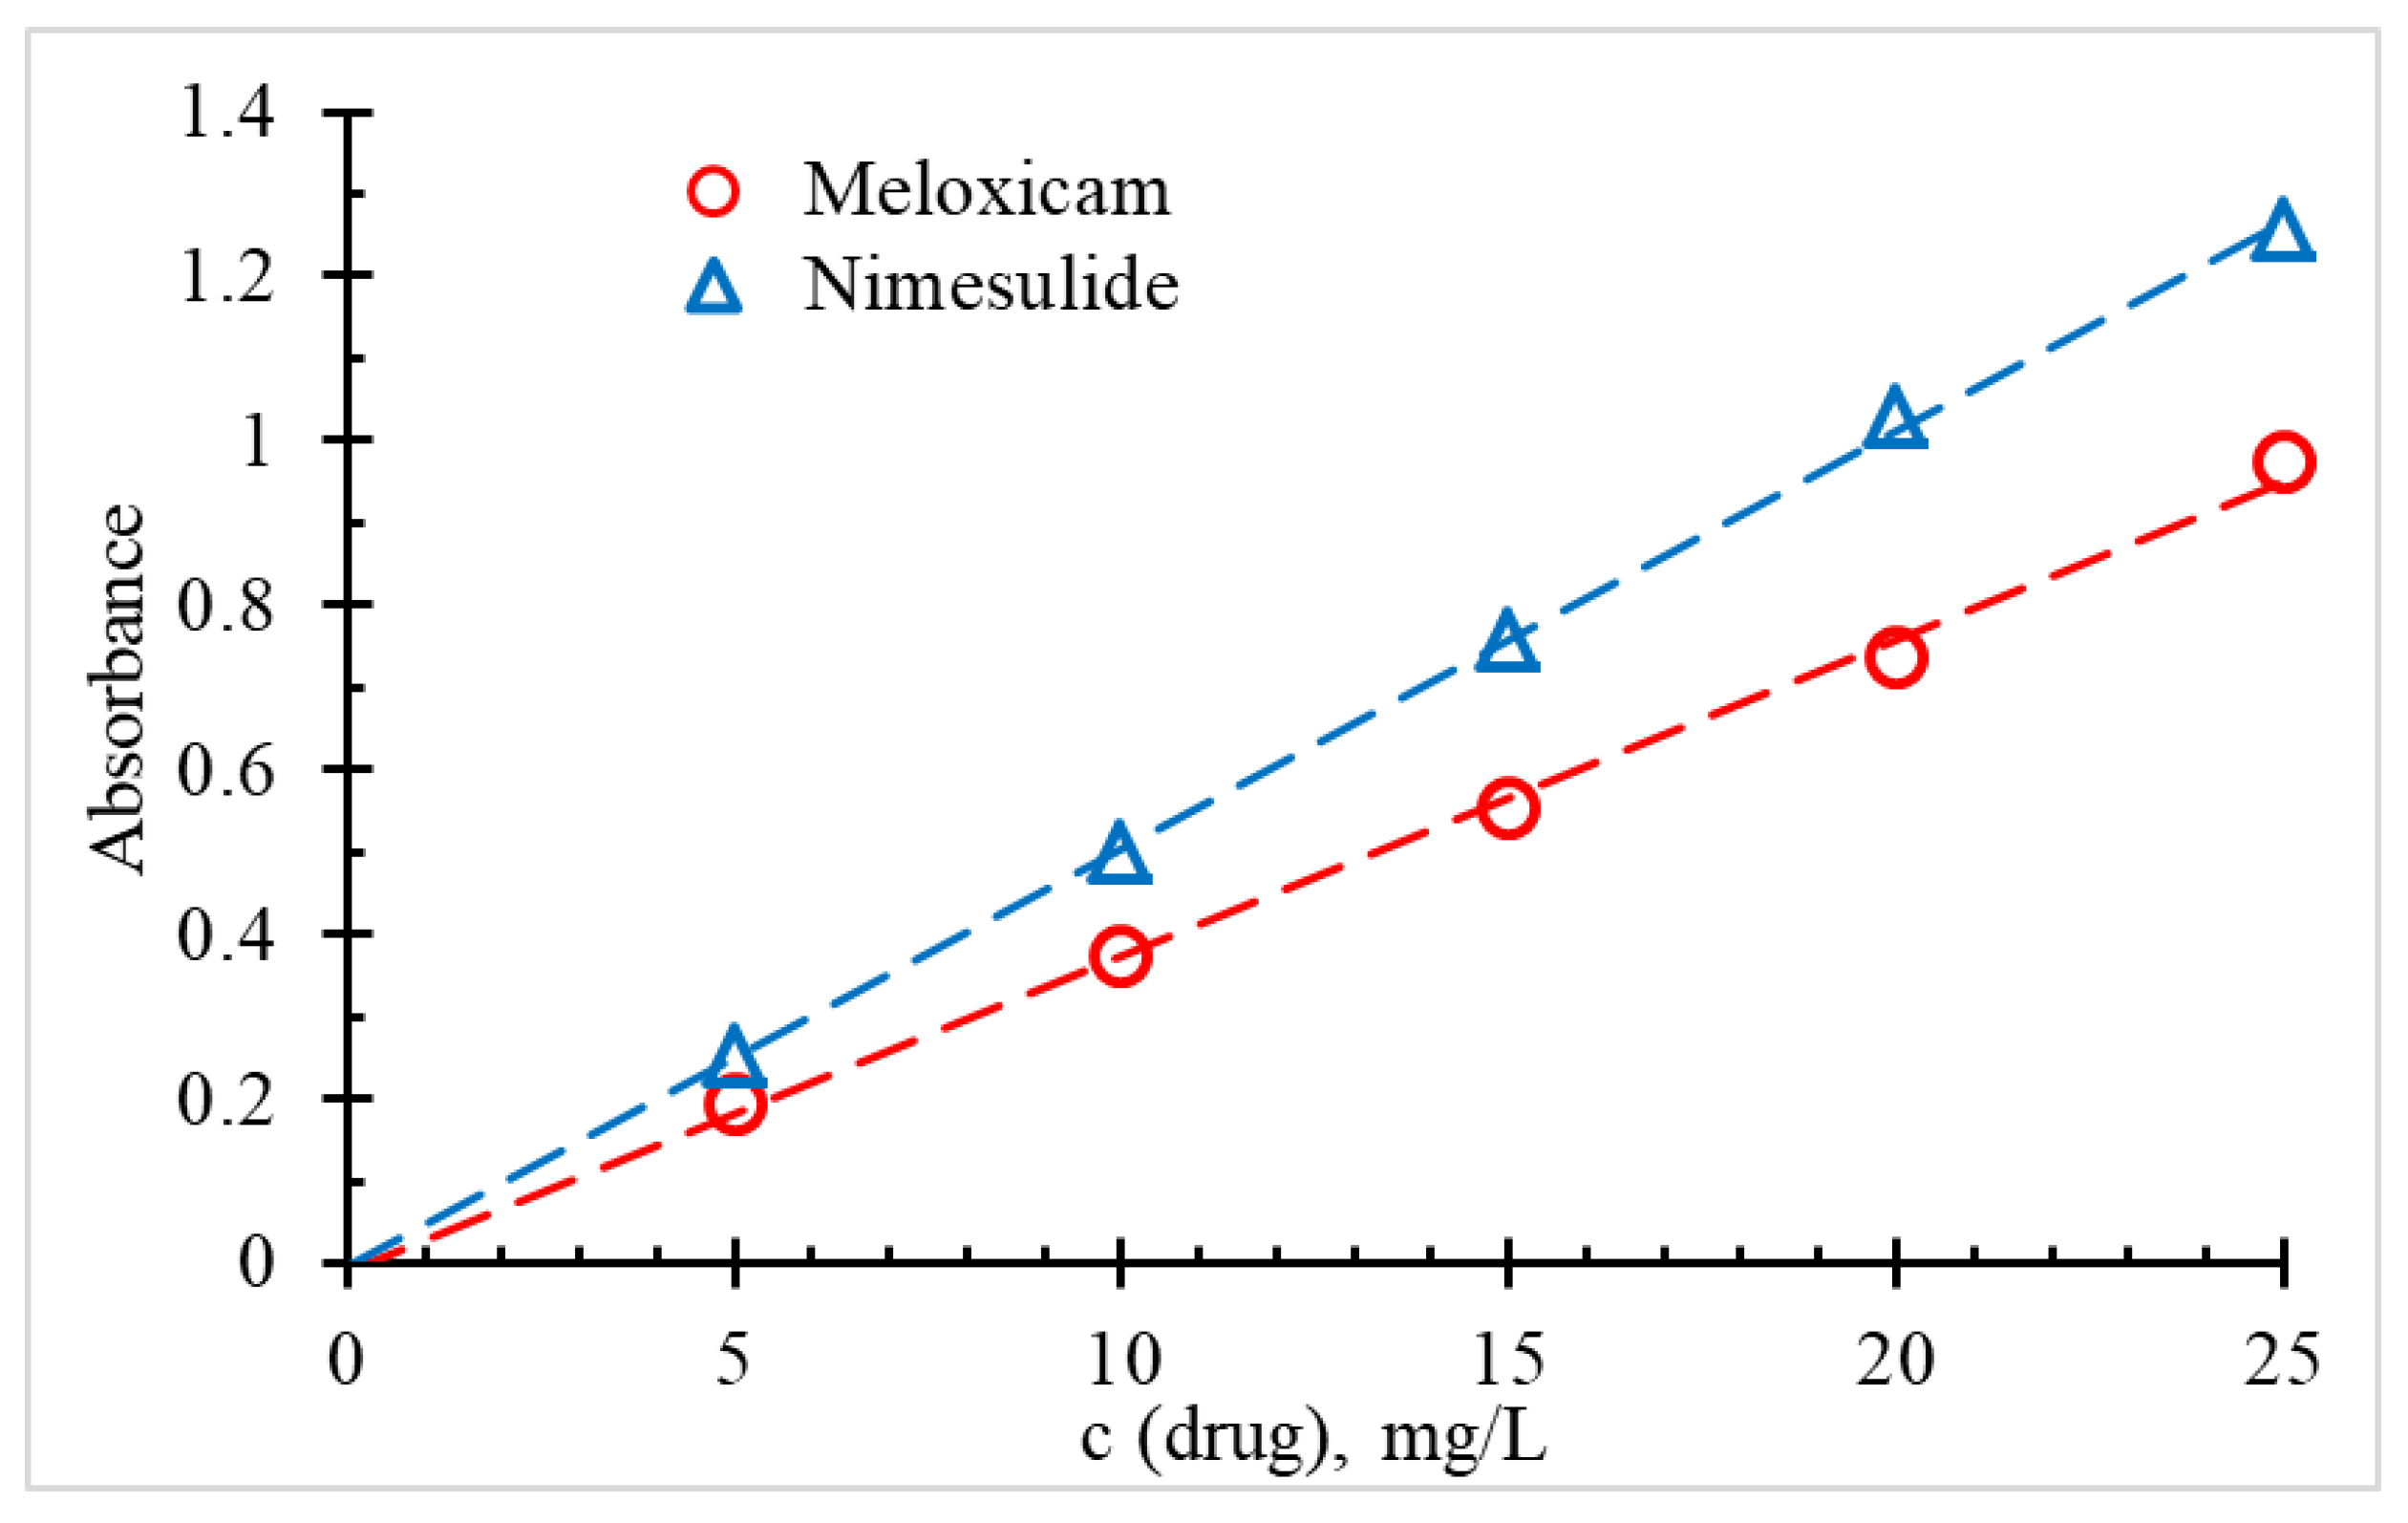
3.3. Construction of the Calibration Graph
3.4. Analytical Performance
3.5. Linearity
3.6. Limit of Detection and Limit of Quantification
3.7. Selectivity with Respect to Common Excipients
3.8. Accuracy
3.9. Intra-Day Precision
3.10. Inter-Day Precision
3.11. Accuracy for the Determination of Model Swab Extract Solutions
3.12. Precision for the Determination of Model Swab Extract Solutions
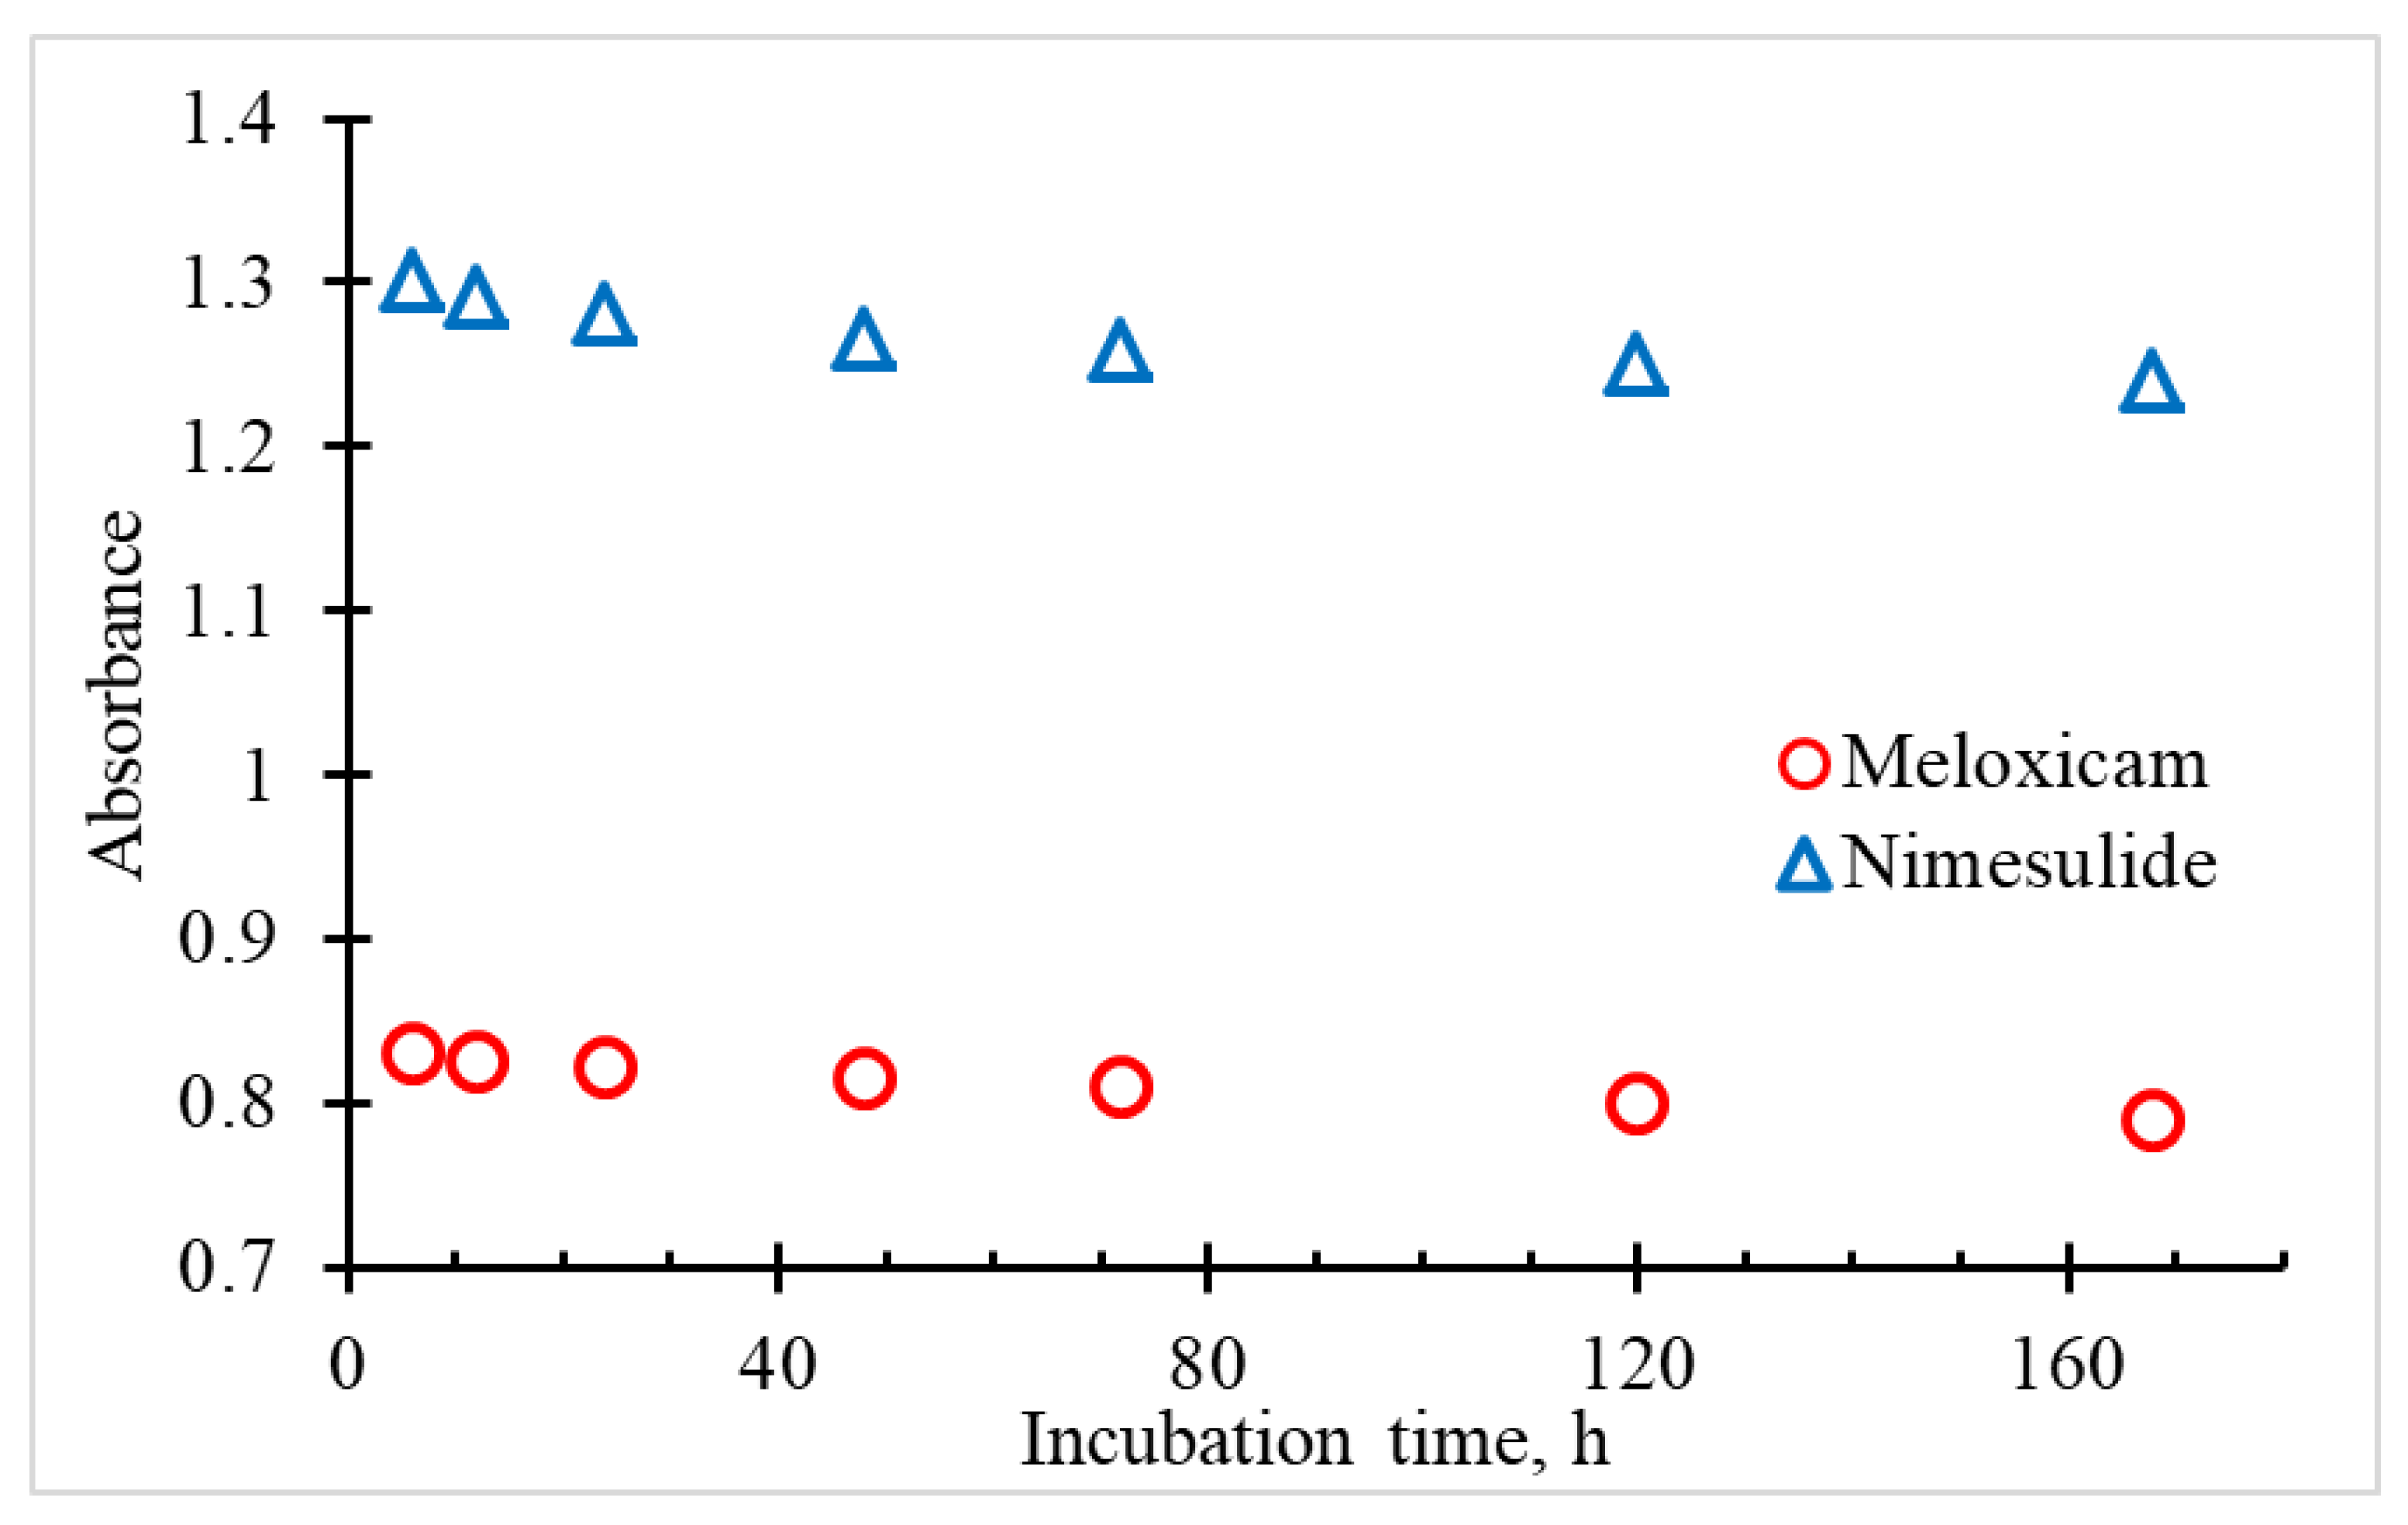
3.13. Stability of Nimesulide and Meloxicam in the Sodium Carbonate Solutions
4. Discussion
5. Conclusions
Funding
Institutional Review Board Statement
Informed Consent Statement
Data Availability Statement
Conflicts of Interest
References
- Noble, S.; Balfour, J.A. Meloxicam. Drugs 1996, 51, 424–430. [Google Scholar] [CrossRef] [PubMed]
- Fleischmann, R.; Iqbal, I.; Slobodin, G. Meloxicam. Expert Opin. Pharmacother. 2002, 3, 1501–1512. [Google Scholar] [CrossRef]
- Davis, R.; Brogden, R.N. Nimesulide. Drugs 1994, 48, 431–454. [Google Scholar] [CrossRef] [PubMed]
- Ward, A.; Brogden, R.N. Nimesulide. Drugs 1988, 36, 732–753. [Google Scholar] [CrossRef]
- Salade, D.A.; Arote, K.S.; Patil, P.H.; Patil, P.S.; Pawar, A.R. A Review on Pharmaceutical Cleaning Validation. Asian J. Pharm. Anal. 2022, 12, 197–202. [Google Scholar] [CrossRef]
- Sarwar, A.; McSweeney, C.; Smith, M.; Timmermans, J.; Moore, E. Investigation of an alternative approach for real-time cleaning verification in the pharmaceutical industry. Analyst 2020, 145, 7429–7436. [Google Scholar] [CrossRef]
- Starek, M.; Krzek, J. A review of analytical techniques for determination of oxicams, nimesulide and nabumetone. Talanta 2009, 77, 925–942. [Google Scholar] [CrossRef]
- Mahale, N.B.; Badhan, P.J.; Nikam, K.R.; Chaudhari, S.R. Comparative in vitro evaluation of commercial Nimesulide tablets. Int. J. Pharm. Sci. Res. 2011, 2, 2610–2612. [Google Scholar] [CrossRef]
- da Fonseca, L.B.; Labastie, M.; de Sousa, V.P.; Volpato, N.M. Development and validation of a discriminative dissolution test for nimesulide suspensions. AAPS PharmSciTech 2009, 10, 1145–1152. [Google Scholar] [CrossRef]
- Singh, S.; Sharda, N.; Mahajan, L. Spectrophotometric determination of pKa of nimesulide. Int. J. Pharm. 1999, 176, 261–264. [Google Scholar] [CrossRef]
- Nagaraja, P.; Yathirajan, H.S.; Arunkumar, H.R.; Vasantha, R.A. Novel coupling reagents for the sensitive spectrophotometric determination of nimesulide in pharmaceutical preparations. J. Pharm. Biomed. Anal. 2002, 29, 277–282. [Google Scholar] [CrossRef] [PubMed]
- Altinöz, S.; Dursun, Ö.Ö. Determination of nimesulide in pharmaceutical dosage forms by second order derivative UV spectrophotometry. J. Pharm. Biomed. Anal. 2000, 22, 175–182. [Google Scholar] [CrossRef] [PubMed]
- Florea, M.; Monciu, C.M.; Andritoiu, M.L.; Bacanu, L.G. Spectrophotometric determination of nimesulide through ion-pair complex formation with hexadecyltrimethylammonium bromide. Farmacia 2008, 56, 639–646. [Google Scholar]
- Saber, A.L.; El-Sayed, G.O. Extractive spectrophotometric determination of anti-inflammatory drug nimesulide in pharmaceutical formulations and human plasma. J. Food Drug Anal. 2011, 19, 429–436. [Google Scholar] [CrossRef]
- Lakshmi, C.S.; Reddy, M.N. Spectrophotometric estimation of nimesulide and its formulations. Microchim. Acta 1999, 132, 1–6. [Google Scholar] [CrossRef]
- Perju, A.C.; Mândrescu, M.; Spac, A.F.; Dorneanu, V. Nimesulide spectrophotometric determination in the visible region. Rev. Med.-Chir. Soc. Med. Nat. Iasi 2007, 111, 535–539. [Google Scholar]
- Kamalapurkar, O.S.; Harikrishna, Y. UV spectrophotometric estimation of nimesulide. East. Pharm. 1997, 40, 145–146. [Google Scholar]
- Chen, X. Determination of nimesulide in suppositories by UV spectrometry. Zhongguo Xiandai Yingyong Yaoxue 2007, 24, 151–153. [Google Scholar]
- Chandran, S.; Saggar, S.; Priya, K.P.; Saha, R.N. New ultraviolet spectrophotometric method for the estimation of nimesulide. Drug Dev. Ind. Pharamacy 2000, 26, 229–234. [Google Scholar] [CrossRef]
- Upadhyay, K.; Asthana, A.; Tiwari, N.; Mathew, S.B. Determination of nimesulide in pharmaceutical and biological samples by a spectrophotometric method assisted with the partial least square method. Res. Chem. Intermed. 2013, 39, 3553–3563. [Google Scholar] [CrossRef]
- Pino, K.F.D.; Oliveira, L.N.; Silva, M.J.; Caon-Filho, O.; Dadamos, T.R.L. Spectrophotometric Determination of Nimesulide, Tribulus terrestris, and Amoxicillin in an Alkaline Medium, in Clinical and Commercial Samples. J. Appl. Spectrosc. 2019, 85, 1151–1157. [Google Scholar] [CrossRef]
- Chowdary, K.R.; Kumar, K.G.; Rao, G.D. New spectrophotometric methods for the determination of nimesulide. Indian J. Pharm. Sci. 1999, 61, 86–89. [Google Scholar]
- Bhatti, M.K.; Hayat, M.M.; Nasir, R.; Ashraf, M.; Hussain, B.; Ahmad, I. Development and validation of spectrophotometric method for the determination of nimesulide in bulk and tablet dosage forms by biuret reagent method. J. Chem. Soc. Pak. 2012, 34, 713–716. [Google Scholar]
- El-henawy, M.M.E.; Ragab, G.H.; Amin, A.E.S.; Sultan, A.F. Spectrophotometric determination of nimesulide in pure and in pharmaceutical formulations using ion-associate complex formation. Asian J. Pharm. Anal. Med. Chem. 2014, 2, 240–248. [Google Scholar]
- Nagaraja, P.; Arun Kumar, H.R.; Vasantha, R.A.; Yathirajan, H.S. Spectrophotometric determination of nimesulide by oxidative coupling with N-bromosuccinimide and promethazine hydrochloride. Oxid. Commun. 2003, 26, 116–120. [Google Scholar]
- Mamatha, N.; Radhika, K.; Kumar, S.A.S. Sensitive and validated UV spectrophotometric methods for the estimation of nimesulide in pharmaceutical and bulk formulations. World J. Pharm. Res. 2014, 3, 4241–4247. [Google Scholar]
- Reddy, M.N.; Reddy, K.S.; Shankar, D.G.; Sreedhar, K. Spectrophotometric determination of nimesulide. Indian J. Pharm. Sci. 1998, 60, 172–173. [Google Scholar]
- Patil, S.V. Electroanalytical and UV- spectroscopic study for analysis of nimesulide in pharmaceutical samples. Int. J. Chem. Stud. 2022, 10, 7–12. [Google Scholar]
- Shakkor, S.J. Spectrophotometric Determination of Reduced Nimesulide using 8-Hydroxyquinolinol Reagent in Pharmaceutical Preparations. Kirkuk Univ. J.-Sci. Stud. 2015, 10, 143–157. [Google Scholar] [CrossRef]
- Soni, M.K.; Sharma, K. An Eco-friendly spectrophotometric analysis of poorly water-soluble drug (Nimesulide) using the mixed hydrotropic concept. Asian J. Pharm. Health Sci. 2020, 9, 2181–2184. [Google Scholar]
- Shrivastava, D.; Dwivedi, S. Estimation of nimesulide using mixed solvency approach. Int. J. Pharm. Life Sci. 2020, 11, 6629–6634. [Google Scholar]
- Murthy, T.K.; Reddy, M.N.; Reddy, M.D.; Sankar, D.G. Spectrophotometric determination of flutamide, nimesulide and meloxicam. Asian J. Chem. 2001, 13, 915–918. [Google Scholar]
- García, M.S.; Sánchez-Pedreño, C.; Albero, M.I.; Martí, J. Spectrophotometric methods for determining meloxicam in pharmaceuticals using batch and flow-injection procedures. Eur. J. Pharm. Sci. 2000, 9, 311–316. [Google Scholar] [CrossRef]
- Oliveira, É.D.F.S.; Azevedo, R.D.C.P.; Bonfilio, R.; Oliveira, D.B.D.; Ribeiro, G.P.; Araújo, M.B.D. Dissolution test optimization for meloxicam in the tablet pharmaceutical form. Braz. J. Pharm. Sci. 2009, 45, 67–73. [Google Scholar] [CrossRef]
- Mandrescu, M.; Spac, A.F.; Dorneanu, V. Spectrophotometric determination of meloxicam. Rev. Chim. 2009, 60, 160–163. [Google Scholar]
- Hassan, E.M. Spectrophotometric and fluorimetric methods for the determination of meloxicam in dosage forms. J. Pharm. Biomed. Anal. 2002, 27, 771–777. [Google Scholar] [CrossRef] [PubMed]
- Al-Momani, I.F. Indirect flow-injection spectrophotometric determination of meloxicam, tenoxicam and piroxicam in pharmaceutical formulations. Anal. Sci. 2006, 22, 1611–1614. [Google Scholar] [CrossRef]
- Alam, M.N.; Rahman, N.; Azmi, S.N.H. Optimized and validated spectrophotometric method for the determination of uranium (VI) via complexation with meloxicam. J. Hazard. Mater. 2008, 155, 261–268. [Google Scholar] [CrossRef]
- Saha, R.K. Spectrophotometric micro determination of silver (I) using meloxicam as a new analytical reagent. Orient. J. Chem. 2016, 32, 499–507. [Google Scholar] [CrossRef]
- Taha, E.A.; Salama, N.N.; Abdel Fattah, L.S. Stability-indicating methods for determination of meloxicam and tenoxicam in the presence of their degradation products. Spectrosc. Lett. 2002, 35, 501–516. [Google Scholar] [CrossRef]
- Dhandapani, B.; Eswara, M.S.; Susrutha, N.; Rama, S.; Rani, S.; Sarath, T.; Celestin, R. Spectrophotometric estimation of meloxicam in bulk and its pharmaceutical formulations. Int. J. Pharma Sci. Res. 2010, 1, 217–221. [Google Scholar]
- Gurupadayya, B.M.; Trinath, M.N.; Shilpa, K. Spectrophotometric determination of meloxicam by sodium nitroprusside and 1,10-phenanthroline reagents in bulk and its pharmaceutical formulation. Indian J. Chem. Technol. 2013, 20, 111–115. [Google Scholar]
- Reddy, M.N.; Murthy, T.K.; Rajita, K.; Shankar, D.G. New spectrophotometric methods for the determination of meloxicam. Indian J. Pharm. Sci. 2001, 63, 245–247. [Google Scholar]
- Joseph-Charles, J.; Bertucat, M. Determination of meloxicam in tablet formulations by ultraviolet spectrophotometry and high-performance liquid chromatography. Anal. Lett. 1999, 32, 2051–2059. [Google Scholar] [CrossRef]
- Abed, R.I.; Hadi, H. Determination of meloxicam using direct and indirect flow injection spectrophotometry. Curr. Pharm. Anal. 2021, 17, 254–264. [Google Scholar] [CrossRef]
- Zawilla, N.H.; Mohammad, M.A.A.; Aly, S.E.M. Determination of meloxicam in bulk and pharmaceutical formulations. J. Pharm. Biomed. Anal. 2003, 32, 1135–1144. [Google Scholar] [CrossRef] [PubMed]
- Nemutlu, E.; Sedef, K.I.R. Validated determination of meloxicam in tablets by using UV spectrophotometry. Hacet. Univ. J. Fac. Pharm. 2004, 24, 13–24. [Google Scholar]
- Vasiliki, V.; Pinto, P.C.A.G.; Saraiva, M.L.M.F.S.; Lima, J.L.F.C. Sequential injection determination of meloxicam in pharmaceutical formulations with spectrophotometric detection. Can. J. Anal. Sci. Spectrosc. 2007, 52, 351–358. [Google Scholar]
- Hasan, S.H.; Othman, N.S.; Surchi, K.M. Development and Validation of a UV-Spectrophotometric Method for Determination of Meloxicam in Bulk and in Tablet Formulations. Int. J. Pharma Sci. Res. 2015, 6, 1040–1045. [Google Scholar]
- Hasan, S.H.; Othman, N.S.; Surchi, K.M. Spectrophotometric Method for Determination of Meloxicam in Pharmaceutical Formulations Using N-bromosuccinimide as an Oxidant. Int. J. Pharma Sci. Res. 2014, 5, 963–969. [Google Scholar]
- Induri, M.; Mantripragada, B.R.; Yejella, R.P.; Kunda, P.R.; Nannapaneni, D.T.; Boddu, R. Dissolution studies and quantification of meloxicam in tablet dosage form by spectrophotometry. Pak. J. Pharm. Sci. 2012, 25, 283–287. [Google Scholar]
- Elham, A. Simple Spectrophotometric Methods for the Determination of Meloxicam in Presence of Its Degradation Products. Chin. J. Pharm. Anal. 2004, 24, 390–394. [Google Scholar]
- Mahood, A.M.; Najm, N.H. Spectrophotometric Estamation of Meloxicam Using Charge Transfer Complex. In IOP Conference Series: Materials Science and Engineering, Proceedings of the the Second International Scientific Conference, Kerbala, Iraq, 15 April 2019; IOP Publishing: Bristol, UK, 2019; Volume 571, p. 012081. [Google Scholar] [CrossRef]
- Kasem, M.A.; Megahed, H.E.; Moustafa, M.E.; Ibrahim, H.A. Sensitive, Direct and Rapid Spectrophotometric Method for the Determination of Meloxicam through Ion-Associate Complex Formation. J. Basic Environ. Sci. 2014, 1, 92–101. [Google Scholar]
- Sundarapandian, M.; Venkataraman, S.; Xavierarulappa, R.; Boopathi, M.; Selvakumar, S. Spectrophotometric Determination of Meloxicam in Bulk Drug and Pharmacuetical Formulations. Asian J. Res. Chem. 2009, 2, 467–468. [Google Scholar]
- Pomykalski, A.; Hopkała, H. Comparison of classic and derivative UV spectrophotometric methods for quantification of meloxicam and mefenamic acid in pharmaceutical preparations. Acta Pol. Pharm. 2011, 68, 317–323. [Google Scholar] [PubMed]
- Taha, E.A.; Salama, N.N.; Fattah, L.E.S.A. Spectrofluorimetric and spectrophotometric stability-indicating methods for determination of some oxicams using 7-chloro-4-nitrobenz-2-oxa-1,3-diazole (NBD-Cl). Chem. Pharm. Bull. 2006, 54, 653–658. [Google Scholar] [CrossRef] [PubMed]
- Chaudhary, K.B.; Bhardwaj, K.; Verma, G.; Kumar, P. Validated Analytical Method development for the determination of Meloxicam by UV Spectroscopy in API and Pharmaceutical dosage form. Asian J. Pharm. Educ. Res. 2018, 7, 60–69. [Google Scholar]
- Baban, S.O.; Jallal, A.F. Determination of meloxicam in pharmaceutical formulation by azo-coupling reaction with sulphanilic acid using both batch and flow-injection technique. Rafidain J. Sci. 2011, 22, 121–132. [Google Scholar]
- Redasani, V.K.; Patel, C.F.; Chhajed, C.F.; Surana, S.S. Quantitative Determination of Meloxicam in bulk and in tablet by UV Spectrophotometry. Int. J. Pharm. Drug Anal. 2014, 2, 246–250. [Google Scholar]
- Abbas, R.F.; Mahdi, N.I.; Waheb, A.A.; Aliwi, A.G.; Falih, M.S. Fourth Derivative and Compensated Area under the Curve Spectrophotometric Methods Used for Analysis Meloxicam in the Local Market Tablet. Al-Mustansiriyah J. Sci. 2018, 29, 70–76. [Google Scholar] [CrossRef]
- Chaplenko, A.A.; Monogarova, O.V.; Oskolok, K.V. Spectroscopic and colorimetric determination of meloxicam, lornoxicam, tenoxicam in drugs. Int. J. Pharm. Biol. Arch. 2018, 9, 31–35. [Google Scholar]
- Kuchekar, B.S.; Late, S.G.; Shingavi, A.A.; Shinde, D.B. Spectrophotometric Estimation of Melatonin And Meloxicam Using Folin-Ciocalteu Reagent. Indian J. Pharm. Sci. 2001, 63, 321–323. [Google Scholar]
- ICH Guideline Q2(R2) on Validation of Analytical Procedures; EMA Committee for Medicinal Products for Human Use: Amsterdam, The Netherlands, 2022; Available online: https://www.ema.europa.eu/en/documents/scientific-guideline/ich-guideline-q2r2-validation-analytical-procedures-step-2b_en.pdf (accessed on 15 March 2023).
- Adrian, R. Research concerning the probabilities of the errors which happen in making observations, etc. Anal. Math. Mus. 1808, 1, 93–109. [Google Scholar]
- Ringbom, A. Über die Genauigkeit der colorimetrischen Analysenmethoden, I. Z. Für Anal. Chem. 1938, 115, 332–343. [Google Scholar] [CrossRef]
- Ayres, G.H. Evaluation of accuracy in photometric analysis. Anal. Chem. 1949, 21, 652–657. [Google Scholar] [CrossRef]
- Youmans, H.L.; Brown, V.H. Selection of optimum ranges for photometric analysis. Anal. Chem. 1976, 48, 1152–1155. [Google Scholar] [CrossRef]
- Sandell, E.B. Colorimetric Determination of Traces of Metals; Interscience Publishers: New York, NY, USA, 1944. [Google Scholar]
- Currie, L.A. Detection and quantification limits: Origins and historical overview. Anal. Chim. Acta 1999, 391, 127–134. [Google Scholar] [CrossRef]
- Shrivastava, A.; Gupta, V.B. Methods for the determination of limit of detection and limit of quantitation of the analytical methods. Chron. Young Sci. 2011, 2, 21–25. [Google Scholar] [CrossRef]
- Little, T.A. Method Validation Essentials, Limit of Blank, Limit of Detection, and Limit of Quantitation. BioPharm Int. 2015, 28, 48–51. [Google Scholar]


| Solvent | Used Reagents | Wavelength, nm | Linearity, mg/L | Accuracy, % | Precision, % | Reference |
|---|---|---|---|---|---|---|
| Methanol | None | 397 | Not specified | Not specified | Not specified | [8] |
| Water | NaOH | 397 | 5–30 | 2 | 1 | [9] |
| Water | Phosphate buffer | 393 | Not specified | Not specified | Not specified | [10] |
| Methanol | Iminodibenzyl | 600 | 0.1–7.5 | 0.2 | 0.1 | [11] |
| Methanol | 3-aminophenol | 470 | 0.4–12 | 0.3 | 0.2 | [11] |
| Ethanol | None | 262–291 Second derivative | 2–90 | 2 | 1 | [12] |
| Chloroform | None | 248–268 Second derivative | 2–50 | 3 | 1 | [12] |
| Water/chloroform | Hexadecyl-trimethyl-ammonium bromide | 404 | 6–20 | 1 | 0.7 | [13] |
| Water/chloroform | Bromocresol green | 412 | 2–18 | 5 | 0.6 | [14] |
| Water/chloroform | Bromocresol purple | 410 | 2–16 | 4 | 0.5 | [14] |
| Water/chloroform | Bromothymol blue | 407 | 2–18 | 3 | 0.5 | [14] |
| Water/chloroform | Brilliant blue G | 502 | 2–18 | 5 | 0.5 | [14] |
| Water/chloroform | Methyl orange | 482 | 2–14 | 3 | 0.7 | [14] |
| Water | p-N,N-dimethyl phenylene diamine dihydrochloride, chloramine-T | 540 | 10–50 | 0.8 | 0.6 | [15] |
| Water | p-N,N-dimethyl phenylene diamine dihydrochloride, 3-methyl-2-benzothiazolinone hydrazine hydrochloride | 600 | 12.5–75 | 1.2 | 0.4 | [15] |
| Water | HNO2, cresyl fast violet acetate | 565 | 2–12 | 2.2 | 0.2 | [15] |
| Water | p-methyl aminophenol sulphate, K2Cr2O7 | 550 | 20–120 | 0.8 | 0.5 | [15] |
| Water | Thymol | 476 | 5–40 | 2.4 | 2.2 | [16] |
| Water | NaOH | 397 | Not specified | Not specified | Not specified | [17] |
| Water | NaOH | 397 | Not specified | Not specified | Not specified | [18] |
| Water/acetonitrile | None | 300 | 10–50 | 1 | 0.4 | [19] |
| Acetonitrile | None | 300 | 10–50 | 0.4 | 0.4 | [19] |
| Methanol | Orcinol | 465 | 0.4–4 | 1.8 | 1.6 | [20] |
| Water | NaOH | 460 | 0.4–5.1 | 8 | Not specified | [21] |
| Methanol/water | Phloroglucinol, ammonium sulfamate | 400 | 4–20 | 2 | Not specified | [22] |
| Methanol/water | p-dimethylamino benzaldehyde | 415 | 4–24 | 2 | Not specified | [22] |
| Methanol | CuSO4, KNaC4H4O6, KI, NaOH | 400 | 25–200 | 0.8 | 2.1 | [23] |
| Ethanol/water | Bromocresol green | 643 | 2–14 | 0.5 | 1.2 | [24] |
| Ethanol/water | Bromocresol purple | 437 | 2–12 | 0.5 | 1.6 | [24] |
| Ethanol/water | Brilliant blue G | 554 | 2–13 | 1 | 1.3 | [24] |
| Methanol/water | N-bromosuccinimide, promethazine hydrochloride | 610 | 0.4–8 | Not specified | Not specified | [25] |
| Methanol | None | 297 | 10–50 | 2 | Not specified | [26] |
| Methanol/acetonitrile | None | 295 | 10–50 | 2 | Not specified | [26] |
| Methanol | Folin–Ciocalteu reagent | 600 | Not specified | Not specified | Not specified | [27] |
| Water | NaOH | 393 | 1.5–14 | Not specified | Not specified | [28] |
| Methanol/water | 8-hydroxy-quinolinol | 480 | 0.5–25 | 1.6 | 1.2 | [29] |
| Water | Sodium citrate, phenol | 390 | 10–40 | 3.6 | Not specified | [30] |
| Water | Sodium benzoate, phenol | 390 | 10–50 | 1.5 | Not specified | [31] |
| Water | KMnO4, Fast green FCF | 625 | Not specified | Not specified | Not specified | [32] |
| Water | Na2CO3 | 397 | 5–25 | 6.4 | 3.4 | This work |
| Solvent | Used Reagents | Wavelength, nm | Linearity, mg/L | Accuracy, % | Precision, % | Reference |
|---|---|---|---|---|---|---|
| Water | KMnO4, Fast green FCF | 625 | Not specified | Not specified | Not specified | [32] |
| Methanol | FeCl3 | 570 | 2–200 | 2.3 | Not specified | [33] |
| Water | NaOH | 362 | 0.5–20 | 1.9 | Not specified | [33] |
| Water | Phosphate buffer | 362 | Not specified | Not specified | Not specified | [34] |
| Methanol/acetonitrile | AlCl3 | 375 | 5–30 | 2.7 | 1.8 | [35] |
| Ethanol | HCl, NaOH | 340–384 Difference spectrum | 2–10 | 0.5 | 0.8 | [36] |
| Ethanol | HCl | 322–368 First derivative | 1–10 | 0.5 | 1.3 | [36] |
| HCl | 343–385 Second derivative | 1–10 | 0.5 | 0.6 | [36] | |
| Water/chloroform | Saframin T | 518 | 4–12 | 1 | 0.4 | [36] |
| Water | N-bromosuccinimide, chloranilic acid | 530 | 10–160 | 8 | 1.2 | [37] |
| Water/1,4-dioxan | UO2(NO3)2 | 398 | 5–60 | 1 | 1.5 | [38] |
| Water/ethanol | AgNO3 | 412 | 1–15 | Not specified | 1.3 | [39] |
| Methanol/water | 3-Methyl-2-benzothiazolinone-hydrazone hydrochloride, ceric ammonium sulphate | 450 | 2–20 | 1.0 | 0.5 | [40] |
| Water | NaOH | 269 | 5–30 | 0.3 | 4.2 | [41] |
| Water | FeCl3 | 476 | 50–250 | 0.5 | 2 | [41] |
| Water | Trisodium citrate | 269 | 5–30 | 2.3 | 5.7 | [41] |
| Water | Sodium nitroprusside, hydroxylamine | 363 | 4–20 | 3.8 | 1.5 | [42] |
| Methanol/water | FeCl3, 1,10-phen-anthroline | 343 | 10–50 | 1.5 | 0.9 | [42] |
| Water | FeCl3, K3[Fe(CN)6] | 770 | 0.25–2.5 | 1.2 | Not specified | [43] |
| Water | Folin–Ciocalteu reagent | 740 | 5–15 | 0.4 | Not specified | [43] |
| Water/1,4-dioxan/acetonitrile | HCl | 341 | 6–14 | 2.3 | 1.8 | [44] |
| Water | Procaine benzylpenicillin | 492 | 5–80 | Not specified | Not specified | [45] |
| Water | p-methyl aminophenol sulfate, NaIO4 | 656 | 15–225 | Not specified | Not specified | [45] |
| Methanol/water/chloroform | Methylene blue | 654 | 1–5 | 1.2 | 2.3 | [46] |
| Acetonitrile | 2,3-dichloro-5,6- dicyano-p-benzoquinone | 455 | 40–160 | 1 | 1 | [46] |
| Methanol/water | Borate buffer | 363 | 0.5–30 | 1 | 1.4 | [47] |
| Water | FeCl3, K3[Fe(CN)6] | 770 | 10–25 | 5 | Not specified | [48] |
| Methanol/water | HCl | 346 | 5–150 | 3 | 0.5 | [49] |
| Water | N-bromosuccinimide, indigo carmine | 610 | 0.2–50 | 1.5 | Not specified | [50] |
| Methanol/water | NaOH | 365 | 2–12 | 1.1 | 1.3 | [51] |
| Water | Phosphate buffer | 360 | 2–12 | 1.6 | 1.1 | [51] |
| Methanol | UO2CO3 | 406 | 10–100 | 1 | Not specified | [52] |
| Methanol | FeCl3 | 580 | 37.5–300 | 1 | Not specified | [52] |
| Ethanol | FeCl3, K3[Fe(CN)6] | 708 | 0.1–11 | 1.3 | 0.7 | [53] |
| Water | Orange G | 358 | 1–22 | 0.4 | 0.2 | [54] |
| Water | Methylene blue | 652 | 1–22 | 0.2 | 0.2 | [54] |
| Water | CuCl2 | 361 | 1–22 | 0.2 | 0.2 | [54] |
| Water/chloroform | Bromocresol green | 415 | 10–50 | 0.8 | Not specified | [55] |
| Water | NaOH | 361 | 4–14 | 1.2 | Not specified | [56] |
| Water | NaOH | 270 | 4–14 | 4.2 | Not specified | [56] |
| Water | NaOH | 215 | 4–14 | 5.5 | Not specified | [56] |
| Water | NaOH | 386 First derivative | 4–14 | 1.3 | Not specified | [56] |
| Water | NaOH | 340 First derivative | 4–14 | 1.5 | Not specified | [56] |
| Water | NaOH | 273 First derivative | 4–14 | 3.4 | Not specified | [56] |
| Water | NaOH | 257 First derivative | 4–14 | 4 | Not specified | [56] |
| Water | NaOH | 409 Second derivative | 4–14 | 1.5 | Not specified | [56] |
| Water | NaOH | 359 Second derivative | 4–14 | 1.4 | Not specified | [56] |
| Water | NaOH | 316 Second derivative | 4–14 | 3.7 | Not specified | [56] |
| Water | NaOH | 278 Second derivative | 4–14 | 2.4 | Not specified | [56] |
| Water | NaOH | 269 Second derivative | 4–14 | 1.4 | Not specified | [56] |
| Water | NaOH | 251 Second derivative | 4–14 | 2.2 | Not specified | [56] |
| Water/acetone | 7-chloro-4-nitrobenz-2-oxa-1, 3-diazole | 460 | 0.5–4 | 1.7 | 1.3 | [57] |
| Ethanol | None | 365 | 2–18 | 2.3 | 1.3 | [58] |
| Water | NaNO2, HCl, sulfanilic acid | 365 | 1–20 | 3.5 | 2.3 | [59] |
| Water | NaOH | 269 | 5–30 | 1.6 | 1.4 | [60] |
| Water | NaOH | 253–279 Area under curve | 5–30 | 1.4 | 1.2 | [60] |
| Water | NaOH | 275 First derivative | 50–300 | 1.5 | 1.6 | [60] |
| Water | NaOH | 361 Fourth derivative | 5–35 | 0.6 | 3.4 | [61] |
| Water | NaOH | 264–277, 352–378 Area under curve | 5–35 | 0.7 | 1.8 | [61] |
| Water/methanol | 7-chloro-4-nitrobenz-2-oxa-1, 3-diazole | 461 | 0.5–5 | 5 | 4 | [62] |
| Water | Folin–Ciocalteu reagent, Na2CO3 | 700 | 1.5–22.5 | 1.4 | Not specified | [63] |
| Water | Na2CO3 | 362 | 5–25 | 5.4 | 3.7 | This work |
| Parameter | Value | |
|---|---|---|
| Analyzed pharmaceutical ingredient | Nimesulide | Meloxicam |
| Wavelength of maximum absorbance (nm) | 397 | 362 |
| Slope and its confidence interval (f = 4, p = 95%) (L/mg) | 0.051 ± 0.001 | 0.038 ± 0.001 |
| Intercept and its confidence interval (f = 4, p = 95%) | –0.002 ± 0.001 | –0.01 ± 0.01 |
| R2 value | 0.999 | 0.996 |
| Linearity range (mg/L) | 5–25 | 5–25 |
| Ringbom’s optimum range (mg/L) | 4–14 | 6–18 |
| Molar attenuation coefficient and its confidence interval (f = 4, p = 95%) (m2/mol) | 6100 ± 100 | 9100 ± 300 |
| Sandell’s sensitivity coefficient and its confidence interval (f = 4, p = 95%) (μg/cm2) | 0.019 ± 0.002 | 0.026 ± 0.004 |
| Limit of detection (mg/L) | 0.8 | 1.9 |
| Limit of quantification (mg/L) | 2.5 | 5.8 |
| Tested Solutions of Nimesulide | Mean Measured Concentration of Nimesulide (mg/L) | Relative Uncertainty (%) | Tested Solutions of Meloxicam | Mean Measured Concentration of Meloxicam (mg/L) | Relative Uncertainty (%) |
|---|---|---|---|---|---|
| Working solution, 5 mg/L | 5.06 | 1.2 | Working solution, 5 mg/L | 5.04 | 0.8 |
| Working solution, 10 mg/L | 10.05 | 0.5 | Working solution, 10 mg/L | 10.04 | 0.4 |
| Working solution, 15 mg/L | 15.06 | 0.4 | Working solution, 15 mg/L | 15.07 | 0.5 |
| Working solution, 20 mg/L | 20.07 | 0.4 | Working solution, 20 mg/L | 20.05 | 0.3 |
| Working solution, 25 mg/L | 25.09 | 0.4 | Working solution, 25 mg/L | 25.11 | 0.4 |
| Sample solution from tablets, 5 mg/L | 4.96 | 0.8 | Sample solution from tablets, 5 mg/L | 4.94 | 1.2 |
| Sample solution from tablets, 10 mg/L | 9.95 | 0.5 | Sample solution from tablets, 10 mg/L | 9.93 | 0.7 |
| Sample solution from tablets, 15 mg/L | 14.93 | 0.5 | Sample solution from tablets, 15 mg/L | 14.95 | 0.3 |
| Sample solution from tablets, 20 mg/L | 19.95 | 0.3 | Sample solution from tablets, 20 mg/L | 19.93 | 0.4 |
| Sample solution from tablets, 25 mg/L | 24.92 | 0.3 | Sample solution from tablets, 25 mg/L | 24.91 | 0.4 |
| Swab extract from working solution, 5 mg/L | 4.79 | 4.2 | Swab extract from working solution, 5 mg/L | 4.85 | 3.0 |
| Swab extract from working solution, 10 mg/L | 9.81 | 1.9 | Swab extract from working solution, 10 mg/L | 9.87 | 1.3 |
| Swab extract from working solution, 15 mg/L | 14.76 | 1.6 | Swab extract from working solution, 15 mg/L | 14.84 | 1.1 |
| Swab extract from working solution, 20 mg/L | 19.69 | 1.2 | Swab extract from working solution, 20 mg/L | 19.73 | 1.2 |
| Swab extract from working solution, 25 mg/L | 24.72 | 1.1 | Swab extract from working solution, 25 mg/L | 24.77 | 1.0 |
| Swab extract from sample solution from tablets, 5 mg/L | 4.68 | 6.4 | Swab extract from sample solution from tablets, 5 mg/L | 4.73 | 5.4 |
| Swab extract from sample solution from tablets, 10 mg/L | 9.70 | 3.0 | Swab extract from sample solution from tablets, 10 mg/L | 9.76 | 2.4 |
| Swab extract from sample solution from tablets, 15 mg/L | 14.66 | 2.3 | Swab extract from sample solution from tablets, 15 mg/L | 14.69 | 2.0 |
| Swab extract from sample solution from tablets, 20 mg/L | 19.62 | 1.9 | Swab extract from sample solution from tablets, 20 mg/L | 19.65 | 1.7 |
| Swab extract from sample solution from tablets, 25 mg/L | 24.57 | 1.7 | Swab extract from sample solution from tablets, 25 mg/L | 24.66 | 1.4 |
| Tested Solutions of Nimesulide | Standard Deviation (mg/L) | Relative Standard Deviation (%) | Tested Solutions of Meloxicam | Standard Deviation (mg/L) | Relative Standard Deviation (%) |
|---|---|---|---|---|---|
| Working solution, 5 mg/L (intra-day) | 0.07 | 1.4 | Working solution, 5 mg/L (intra-day) | 0.08 | 1.6 |
| Working solution, 10 mg/L (intra-day) | 0.11 | 1.1 | Working solution, 10 mg/L (intra-day) | 0.13 | 1.3 |
| Working solution, 15 mg/L (intra-day) | 0.14 | 0.9 | Working solution, 15 mg/L (intra-day) | 0.15 | 1.0 |
| Working solution, 20 mg/L (intra-day) | 0.14 | 0.7 | Working solution, 20 mg/L (intra-day) | 0.18 | 0.9 |
| Working solution, 25 mg/L (intra-day) | 0.15 | 0.6 | Working solution, 25 mg/L (intra-day) | 0.20 | 0.8 |
| Sample solution from tablets, 5 mg/L (intra-day) | 0.06 | 1.3 | Sample solution from tablets, 5 mg/L (intra-day) | 0.08 | 1.6 |
| Sample solution from tablets, 10 mg/L (intra-day) | 0.10 | 1.0 | Sample solution from tablets, 10 mg/L (intra-day) | 0.12 | 1.2 |
| Sample solution from tablets, 15 mg/L (intra-day) | 0.12 | 0.8 | Sample solution from tablets, 15 mg/L (intra-day) | 0.13 | 0.9 |
| Sample solution from tablets, 20 mg/L (intra-day) | 0.12 | 0.6 | Sample solution from tablets, 20 mg/L (intra-day) | 0.16 | 0.8 |
| Sample solution from tablets, 25 mg/L (intra-day) | 0.17 | 0.7 | Sample solution from tablets, 25 mg/L (intra-day) | 0.17 | 0.7 |
| Working solution, 5 mg/L (inter-day) | 0.09 | 1.8 | Working solution, 5 mg/L (inter-day) | 0.11 | 2.1 |
| Working solution, 10 mg/L (inter-day) | 0.12 | 1.2 | Working solution, 10 mg/L (inter-day) | 0.15 | 1.5 |
| Working solution, 15 mg/L (inter-day) | 0.15 | 1.0 | Working solution, 15 mg/L (inter-day) | 0.18 | 1.2 |
| Working solution, 20 mg/L (inter-day) | 0.16 | 0.8 | Working solution, 20 mg/L (inter-day) | 0.20 | 1.0 |
| Working solution, 25 mg/L (inter-day) | 0.18 | 0.7 | Working solution, 25 mg/L (inter-day) | 0.23 | 0.9 |
| Sample solution from tablets, 5 mg/L (inter-day) | 0.08 | 1.7 | Sample solution from tablets, 5 mg/L (inter-day) | 0.09 | 1.9 |
| Sample solution from tablets, 10 mg/L (inter-day) | 0.15 | 1.5 | Sample solution from tablets, 10 mg/L (inter-day) | 0.17 | 1.7 |
| Sample solution from tablets, 15 mg/L (inter-day) | 0.16 | 1.1 | Sample solution from tablets, 15 mg/L (inter-day) | 0.19 | 1.3 |
| Sample solution from tablets, 20 mg/L (inter-day) | 0.18 | 0.9 | Sample solution from tablets, 20 mg/L (inter-day) | 0.22 | 1.1 |
| Sample solution from tablets, 25 mg/L (inter-day) | 0.20 | 0.8 | Sample solution from tablets, 25 mg/L (inter-day) | 0.25 | 1.0 |
| Swab extract from working solution, 5 mg/L | 0.15 | 3.2 | Swab extract from working solution, 5 mg/L | 0.17 | 3.6 |
| Swab extract from working solution, 10 mg/L | 0.23 | 2.3 | Swab extract from working solution, 10 mg/L | 0.27 | 2.7 |
| Swab extract from working solution, 15 mg/L | 0.24 | 1.6 | Swab extract from working solution, 15 mg/L | 0.27 | 1.8 |
| Swab extract from working solution, 20 mg/L | 0.26 | 1.3 | Swab extract from working solution, 20 mg/L | 0.32 | 1.6 |
| Swab extract from working solution, 25 mg/L | 0.30 | 1.2 | Swab extract from working solution, 25 mg/L | 0.32 | 1.3 |
| Swab extract from sample solution from tablets, 5 mg/L | 0.16 | 3.4 | Swab extract from sample solution from tablets, 5 mg/L | 0.18 | 3.7 |
| Swab extract from sample solution from tablets, 10 mg/L | 0.26 | 2.7 | Swab extract from sample solution from tablets, 10 mg/L | 0.29 | 3.0 |
| Swab extract from sample solution from tablets, 15 mg/L | 0.28 | 1.9 | Swab extract from sample solution from tablets, 15 mg/L | 0.35 | 2.4 |
| Swab extract from sample solution from tablets, 20 mg/L | 0.31 | 1.6 | Swab extract from sample solution from tablets, 20 mg/L | 0.37 | 1.9 |
| Swab extract from sample solution from tablets, 25 mg/L | 0.34 | 1.4 | Swab extract from sample solution from tablets, 25 mg/L | 0.42 | 1.7 |
Disclaimer/Publisher’s Note: The statements, opinions and data contained in all publications are solely those of the individual author(s) and contributor(s) and not of MDPI and/or the editor(s). MDPI and/or the editor(s) disclaim responsibility for any injury to people or property resulting from any ideas, methods, instructions or products referred to in the content. |
© 2023 by the author. Licensee MDPI, Basel, Switzerland. This article is an open access article distributed under the terms and conditions of the Creative Commons Attribution (CC BY) license (https://creativecommons.org/licenses/by/4.0/).
Share and Cite
Nikolaychuk, P.A. UV-Spectrophotometric Determination of the Active Pharmaceutical Ingredients Meloxicam and Nimesulide in Cleaning Validation Samples with Sodium Carbonate. J 2023, 6, 248-266. https://doi.org/10.3390/j6020019
Nikolaychuk PA. UV-Spectrophotometric Determination of the Active Pharmaceutical Ingredients Meloxicam and Nimesulide in Cleaning Validation Samples with Sodium Carbonate. J. 2023; 6(2):248-266. https://doi.org/10.3390/j6020019
Chicago/Turabian StyleNikolaychuk, Pavel Anatolyevich. 2023. "UV-Spectrophotometric Determination of the Active Pharmaceutical Ingredients Meloxicam and Nimesulide in Cleaning Validation Samples with Sodium Carbonate" J 6, no. 2: 248-266. https://doi.org/10.3390/j6020019