1. Introduction
The heavy dependence on fossil fuels has led to severe issues like energy crises, global warming, and climate change [
1]. Renewable energy presents a viable solution by diversifying energy resources, reducing carbon footprints, and increasing sustainability. Notably, the renewable energy sector is experiencing a significant shift, with wind energy emerging as a pivotal player. Wind energy’s growth has been remarkable, especially in terms of its capacity and market presence, a trend that is evident in global wind energy statistics and market confidence. The swift advancement and increasing capacity of wind energy in the past two decades have underscored its vital role in combating climate change and addressing energy concerns related to population growth and geopolitical dynamics [
2]. Offshore wind energy, in particular, holds immense potential for mass electrical power generation and is among the fastest-evolving technologies in the pursuit of achieving carbon neutrality. According to the Global Wind Energy Council report [
3], the sector is poised for a compound average annual growth rate of
until 2026 (
Figure 1).
Currently, most offshore wind turbines (OWTs) are fixed to the seabed by monopoles and tripods, which are suitable for shallow and intermediate-depth waters. Therefore, the stronger, more consistent winds in deep waters, coupled with reduced visual and acoustic disturbances, make FOWTs an attractive alternative [
4]. Designing and deploying FOWTs is complex, necessitating a deep understanding of the intricate physics of system behavior and the use of advanced tools that encompass aerodynamics, hydrodynamics, structural dynamics, and control systems. This is crucial, as the platform’s dynamic behavior significantly influences turbine performance.
For the long-term performance assessment of FOWTs, a blend of physical experiments, numerical methods, and data-driven techniques is essential. Many scenarios cannot be numerically modeled due to high computational demands, complexity, reliance on assumptions, and the need for detailed, high-quality input data [
5,
6]. The rise of machine learning (ML) represents a big leap forward in computational efficiency and scalability [
7]. The swift advancement in analytical and monitoring technologies has led to a dramatic increase in the quantity and complexity of data generation. This surge has necessitated more sophisticated computational and data analysis methods beyond conventional statistical tools [
8]. The role of machine learning (ML) in today’s world is significant: it influences nearly every facet of contemporary life and revolutionizes industries universally. Analytical methods requiring less prior knowledge, notably machine learning, have demonstrated their potential in addressing complex data patterns or formats through exceptional fitting capabilities. Consequently, the last decade has seen a rapid expansion in ML use, particularly deep learning, across various applications, including image classification and machine translation. These advancements are transforming numerous scientific disciplines, ranging from chemistry, materials, and biomedical sciences to quantum physics [
9,
10,
11,
12].
The remarkable performance of machine learning techniques, particularly Linear Regression (LR) and Artificial Neural Networks (ANNs), in predictive modeling, highlights the promising role of machine learning in improving renewable energy systems. This underscores the significance of employing machine learning to advance the prediction abilities within complex systems, thereby fostering the development of more effective and sustainable energy solutions [
13,
14].
Deep learning methods, particularly Gated Recurrent Unit (GRU), have been effective in enhancing wind farm efficiency by providing precise predictions of FOWT performance [
15,
16]. These methods are adept at adapting to the nonlinear relationships between inputs and outputs, a critical feature for optimizing performance, devising maintenance strategies, and integrating wind energy into power grids. Furthermore, deep learning models have proven effective in optimizing wind farm placement, real-time monitoring, and simulating environmental conditions [
17,
18].
Recent advancements in Artificial intelligence (AI), machine learning, and data-driven technics have revolutionized the dynamic analysis of FOWTs. For instance, Artificial Neural Networks have the ability to provide a robust framework for modeling and simulating complex systems. Their capacity to handle nonlinearities and uncertainties makes them particularly effective in predicting the performance and structural integrity of FOWTs. Neuro-fuzzy systems combine the learning capabilities of neural networks with the interpretability of fuzzy logic make them suitable in handling inherently irregular environmental data impacting FOWTs. Generative AI has the potential to be used in the design and optimization process of FOWTs by creating diverse and innovative solutions under data-scarce and imbalanced conditions [
19,
20,
21,
22,
23,
24].
The structural response predictability of FOWTs has also been examined using Recurrent Neural Networks (RNNs), which utilize cyclic connections to incorporate node outputs back into their inputs. This mechanism allows RNNs to retain a memory of prior inputs within a sequence, essential for processing data sequences where context or preceding elements matter [
25]. RNNs offer benefits like parameter sharing across time steps, adaptability in input/output lengths, and the ability to capture temporal dependencies. Models like GRU and Long Short-Term Memory (LSTM) have been employed for detecting structural damage in FOWT blades [
26].
A recent study merged a data-driven wind turbine system model with physical insights to forecast the structural dynamic responses of bottom-fixed offshore wind turbines under varied load conditions. Utilizing a Deep Residual Recurrent Neural Network (DR-RNN) constrained by system equations, this hybrid technique demonstrated notable computational efficiency and accuracy [
27]. Data-driven approaches were applied for optimal sensor placement and velocity prediction in wind turbine wakes by [
28], utilizing high-fidelity CFD data. The study began with proper orthogonal decomposition (POD) for dynamic flow analysis, followed by assessments of clustering and machine learning algorithms’ impact on prediction accuracy. The study considered the wake of a cylinder and a rotating wind turbine rotor in complex flow conditions. Their findings revealed that combining classification-based machine learning for sensor placement and Bi-LSTM networks is sufficient for predicting periodic signals. Still, more advanced techniques are needed for the complex data of the turbine’s near wake. A study demonstrated the potential of data-driven methods as alternatives to traditional predictive wake analysis models for wind turbines. Another methodology suggested by [
29] pinpoints key structural safety indicators for FOWTs. This approach utilizes a Multi-Layer Perception (MLP) neural network to measure the towers’ top acceleration and root force, promoting MLP as a tool for intelligent structural health monitoring of FOWTs in challenging marine environments. A deep learning strategy was introduced by [
26] for detecting structural damage in FOWT blades. This method involves developing a sequence-based framework using GRU and GRU neural networks, achieving
accuracy in identifying damage locations across various scenarios. Another study presented an advanced pitch controller for FOWTs using deep learning. The study used a GRU neural network to predict blade pitch control, countering the inherent delay in hydraulic actuator systems and consequently boosting turbine power generation efficiency. This approach improved power output by
and reduced pitch motion by about
, significantly enhancing FOWT structural integrity and performance [
30].
Despite these innovations, there is a noted scarcity of efforts to devise a deep learning model specifically tailored for predicting FOWT dynamic responses. This study developed a deep learning model that integrates OpenFAST software Version 3.5.2 with a CNN–GRU model, aiming to predict the platform pitch response of FOWTs, under a variety of environmental conditions. The primary purpose of this study was to introduce an innovative method for forecasting the dynamic behavior of FOWTs by integrating a CNN and a GRU network. The model aims to deliver precise and efficient predictions of FOWT dynamic responses, handle computational complexities, and manage nonlinear dynamics effectively.
2. Methodology
This section explains the novel CNN–GRU model (
Figure 2), engineered to forecast the dynamic behavior of spar-type FOWTs. The choice of CNN and GRU models over other ML models was owing to their unique strengths and capabilities in processing and predicting time series data. The CNN layers extract relevant features from the input data, and the GRU layers process these features to recognize and predict complex long-term patterns in the dataset, which are crucial for the objectives of this study. The development process including the architecture of the model, preparation, and preprocessing of the dataset is presented in the following subsections.
2.1. Integrating CNN and GRU in a Multivariate Model for Time Series Analysis
The CNN is a variant of Deep Neural Network (DNN) and excels in processing grid-structured data such as images. Its adaptability is evident in various domains, such as analyzing financial markets, where it is used for predicting stock trends and movements [
31]. The CNN’s design, echoing the animal visual cortex’s connectivity patterns, has been applied extensively in fields such as image and video recognition, recommendation engines, image categorization, medical image examination, and natural language processing [
32,
33]. Its capability to process multichannel input data renders it apt for diverse time-series data, effectively extracting a broad spectrum of features to bolster predictive precision [
34].
CNNs are acclaimed for their parameter efficiency, achieved through localized receptive fields and weight sharing, leading to accelerated learning and reduced overfitting risks [
35]. A standard CNN consists of convolutional, pooling, and fully connected layers. The convolutional layer applies multiple kernels to execute convolution operations, extracting key data features, while the pooling layer streamlines the learning process by downsizing the representation’s spatial dimensions. The equation for the convolution operation for a two-dimensional input is as follows:
Here, f is the input feature map, g represents the filter (kernel), i and j indices show the position in the output feature map, and m and n indices are used to sum over the dimensions of the filter g.
The pooling layer reduces the spatial size of the representation to reduce the number of parameters and computations in the network. It helps to detect features invariant to scale and orientation changes. The two most common pooling operations are max pooling and average pooling. The max pooling operation used in this study can be defined as
where
A is the pooling layer input matrix or the input feature map,
W represents the kernel for the pooling operation, and
i and
j are indices within the kernel over which the operation is applied. The max pooling layer selects the maximum value of each kernel to reduce the dimensionality and retain only the most significant features.
GRU neural networks are designed to address the vanishing gradient problem in RNN models through the use of update and reset gates. These gates regulate information transfer between neurons, determining the data that should be conveyed to the output. Their distinctiveness lies in their ability to preserve information over extended periods without degradation and to discard irrelevant data. The update gate specifically determines the extent to which information from a prior time step should be carried forward to the subsequent layer. The update gate,
, is shown as follows:
Here, is the sigmoid function that is used to normalize values between 0 and 1. represents the weight matrix for the update gate associated with the input, is the input vector at the current time step, is the weight matrix for the update gate associated with the previous time step output, and is the output vector from the previous time step. Subscript t denotes the current time step in sequential data processing, and indicates a dependency on the value from the previous time step. and superscripts denote parameters related specifically to the update and reset gates, respectively.
In a GRU neural network, the reset gate is responsible for deciding the amount of past information that should be omitted. When the value approaches zero after the sigmoid function is applied, the reset gate opts to disregard the previously computed state. This mechanism is particularly beneficial for processing sequential data, as it adapts to the shifting significance of historical data over time. The reset gate vector
at time step
t can be expressed as
Here, is the weight matrix associated with the input for the reset gate, and represents the weight matrix associated with the previous output for the reset gate. It is evident that the formulas for both update and reset gates are identical, with the distinctions between them stemming from their individual weights and functional purposes.
The power output of an FOWT is influenced by the historical data of several attributes. This multifaceted aspect of the issue can be depicted as follows:
where
are the data attributes, and
is predicted value at time
t. In a multivariate time series, the value of each variable is determined by its historical data and the values of other related variables. The objective is to pinpoint functions capable of accurately forecasting a variable’s future values, acknowledging the intertwined relationships between multiple time series. By integrating CNN and GRU models, our approach aims to uncover concealed patterns in the data, enhancing the precision of time series forecasts while mitigating the risk of overfitting.
2.2. Data Preparation
To assemble a thorough dataset encompassing a broad spectrum of environmental conditions and load scenarios, two widely recognized numerical codes from the National Renewable Energy Laboratory were employed: TurbSim [
36] is an advanced numerical tool for crafting wind fields in wind turbine performance analysis, and OpenFAST is a sophisticated open-source model simulating the dynamic responses and efficiency of offshore wind turbines. The core algorithm of OpenFAST solves coupled aerodynamic and structural dynamics equations in the time domain. OpenFAST has a modular structure, including AeroDyn for aerodynamic forces, HydroDyn for hydrodynamic loads, ServoDyn for control systems, and ElastoDyn for structural dynamics. These modules work fully coupled, exchanging data at each time step, allowing detailed analysis of turbine performance, including load prediction, fatigue analysis, and overall system dynamics.
Eight turbulent wind velocity fields, with mean horizontal wind speeds spanning from 10 to 24 m/s with 2 m/s intervals at hub height, were generated by TurbSim and utilized as inputs for the OpenFAST code. This study also considered seven oceanic conditions and seven uniformly distributed wind directions. The significant wave height varied between 0.09
and 9.14
, and wave periods ranged from 2
to 13.6
, mirroring the periodic sea states documented in existing studies [
37]. The wind directions spanned from −30 to 30 degrees. This approach yielded an extensive collection of 392 simulations, each lasting 800 s, generating a substantial dataset for analysis through OpenFAST. This study specifically focused on the OC3-Hywind phase
spar-type wind turbine, stabilized by a catenary mooring system [
37]. The distinct characteristics of the FOWT employed in this study can be found in the literature [
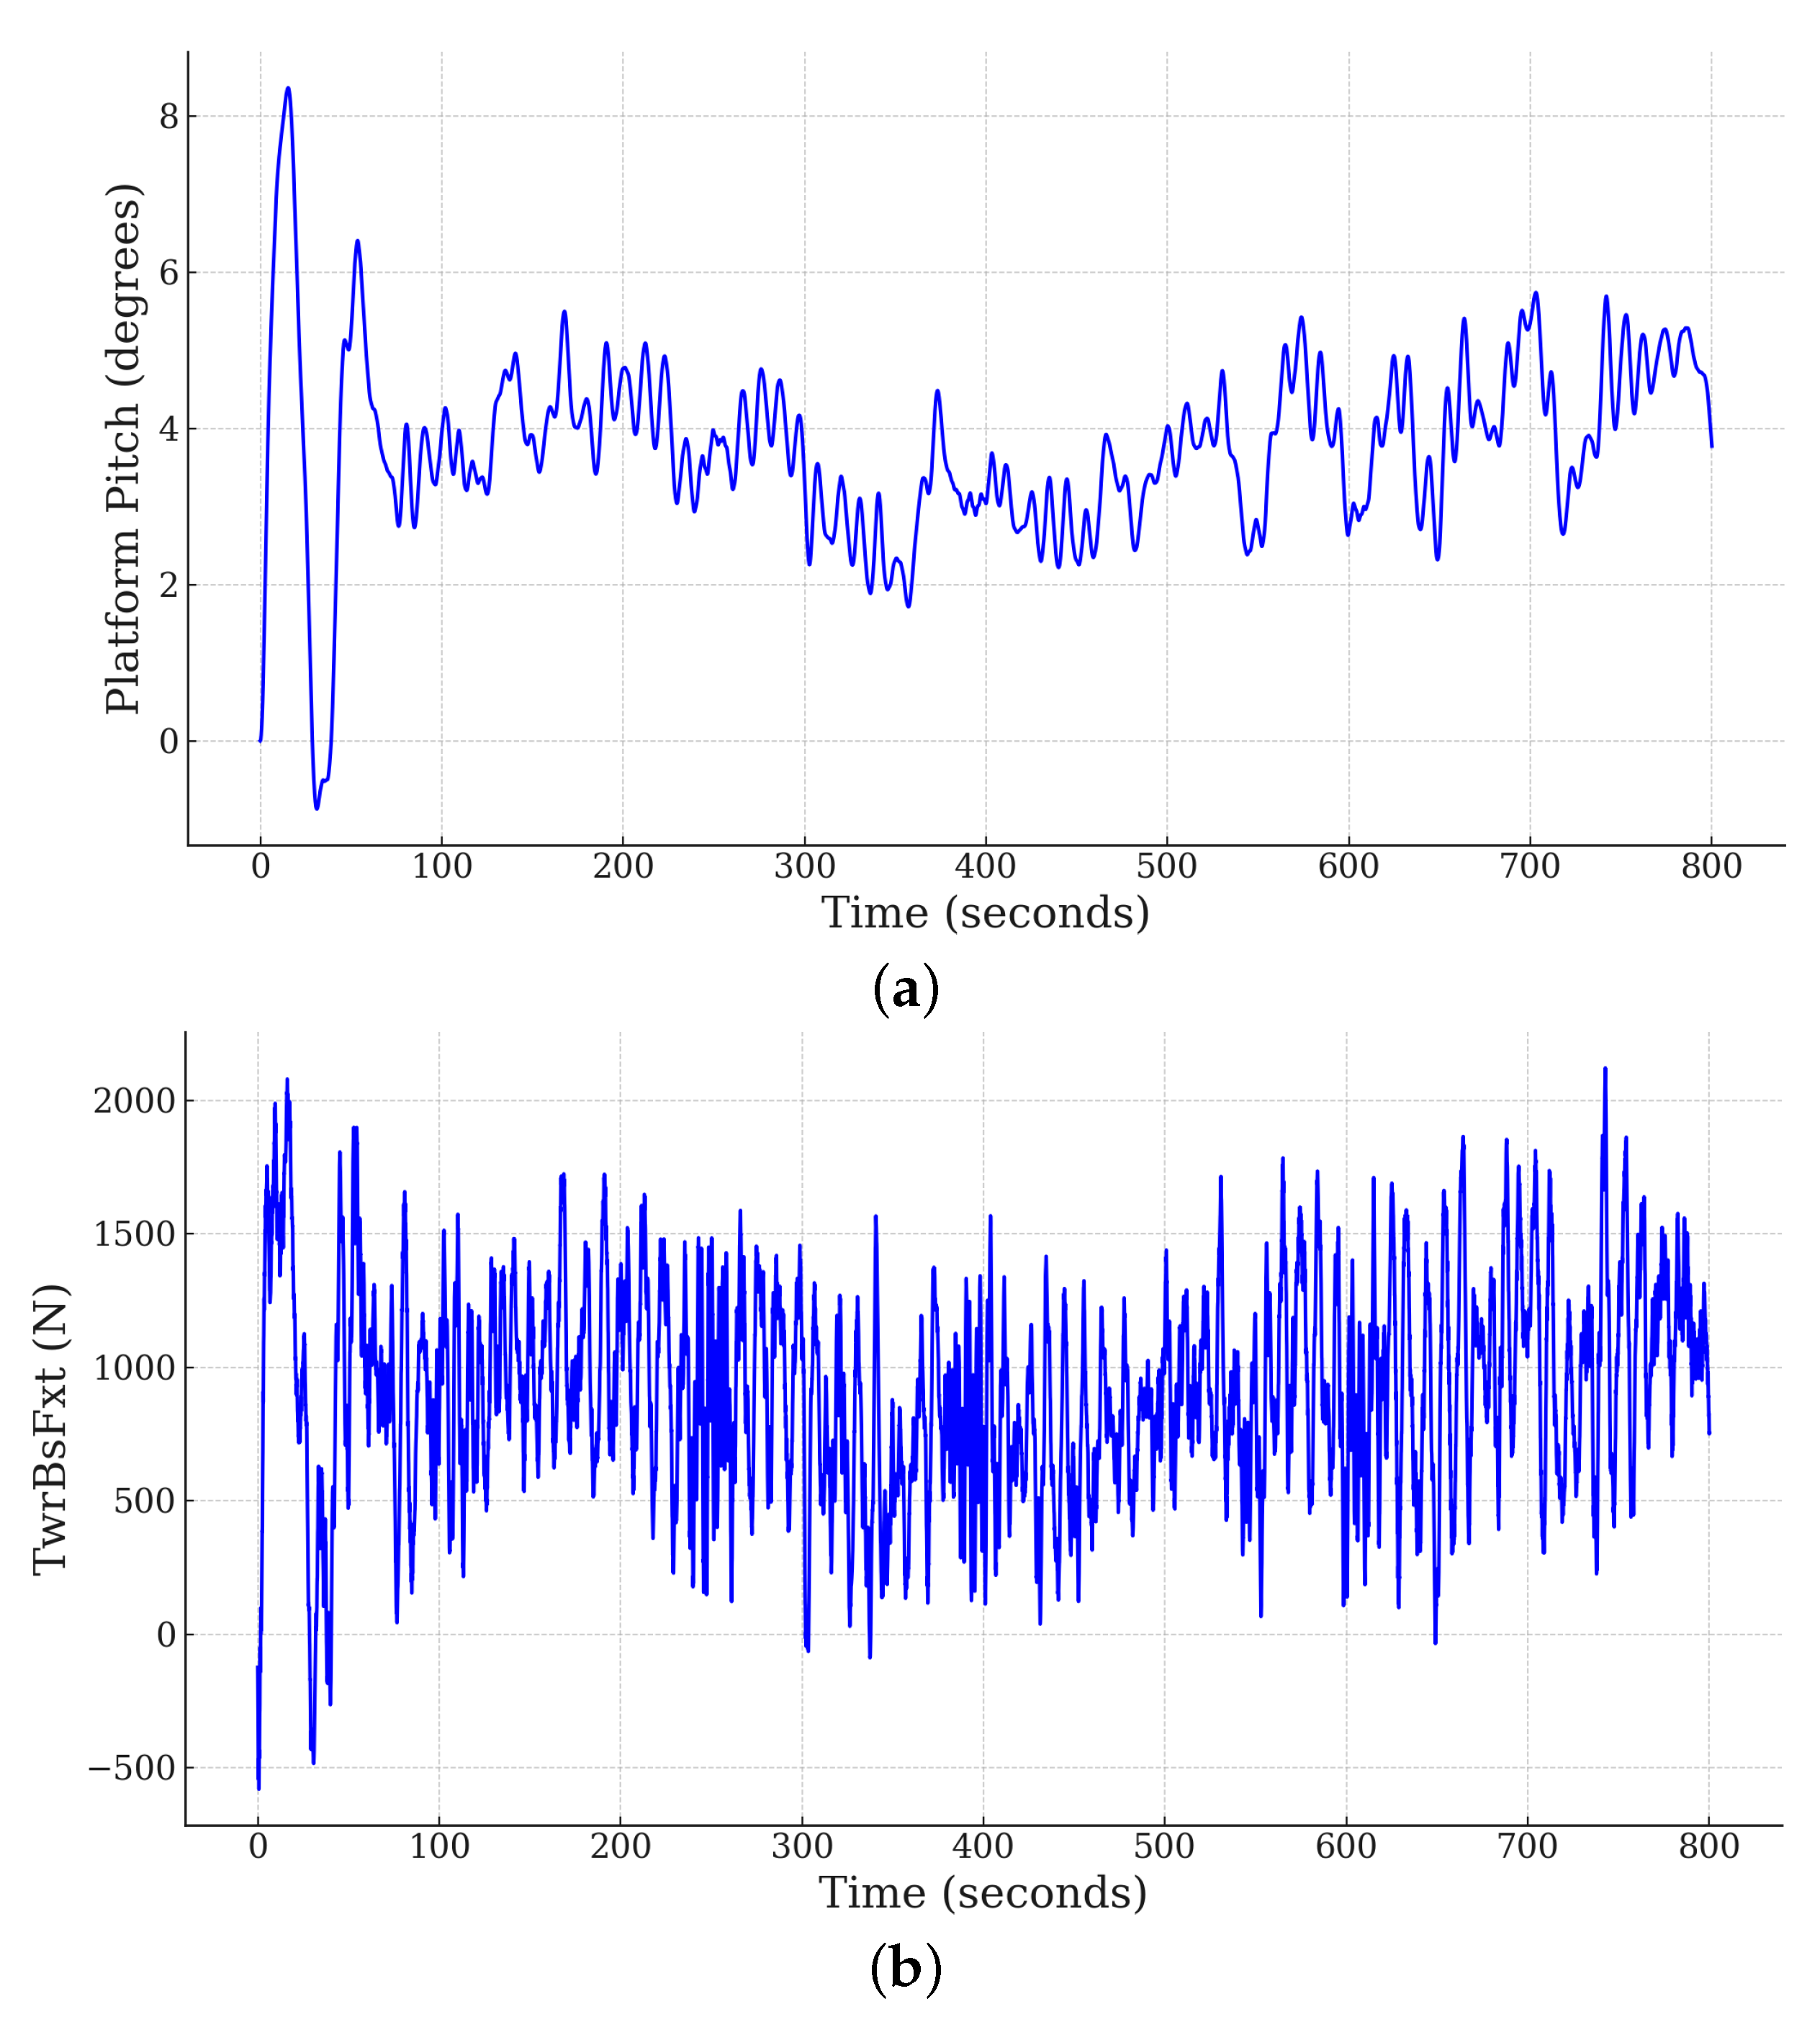
1]. As a time-series sample in the dataset, the platform pitch and hydrodynamic force at the tower’s base in the x direction are plotted in
Figure 3 for one of the load cases.
2.3. Data Preprocessing
During the data preprocessing phase, the raw data must be converted into a format appropriate for analysis. The dataset employed to train and test the deep learning model consisted of 392 OpenFAST simulation outputs. Running each simulation for 800 s resulted in an output shape of . All the simulations were conducted on OpenFAST 5 MW OC3Spar test code, which was pre-validated with measured data from the OC3 Hywind project, and all additional corrections were applied to this test model to perfectly match the actual data obtained from full-scaled spar wind turbine on-site measurements.
The main focus of this study was to develop an ML framework to predict the pitch response of a floating wind turbine to be used in advanced control systems since it is the most crucial rotational mode of motion for an FOWT in stabilizing power output [
38]. Accurately predicting the platform pitch response for FOWTs can showcase the potential of using ML methods in the predictive modeling of renewable energy systems. The pitch motion of floating wind turbine platforms is essential to structural stability, optimal performance, and long-term reliability [
39]. Effective pitch control stabilizes power output, reduces vibration, and maintains aero–servo–elastic stability [
40,
41]. Advanced control systems and strategies, such as tuned mass dampers and pitch control schemes, reduce platform motion and dynamic loads, enhancing the overall efficiency and robustness of floating wind turbines [
42]. For such control systems, the accurate prediction of platform pitch is crucial for minimizing the impact of platform motion on turbine performance and ensuring the stability and efficiency of wind farms in offshore environments [
43]. The sampling frequency used in OpenFast simulations is tailored for the solver’s numerical stability. However, it may not be ideal for deep learning models and could introduce noise into the data. Therefore, to ensure predictions were not affected by noise and to effectively track the trends and dependencies in platform pitch, the data’s sampling frequency was reduced to 1 s. Subsequently, all output files were merged to form an extensive dataset for the deep learning model. An analysis of the correlation between power generation and other features was conducted to pinpoint features whose past values might be indicative of future power generation. This correlation study led to the selection of 9 features that showed a strong correlation with power generation, as depicted in
Figure 4. The figure displays a matrix where each intersection of a row and column reveals the correlation between two distinct parameters.
In
Figure 4, “PtfmPitch” represents the platform pitch, indicating the tilt of the platform; “TTDspFA” refers to the initial fore-aft displacement at the tower-top; “RotThrust” denotes the rotor thrust, which is the force exerted by the wind on the turbine’s rotor. “YawBrFxp” measures the fore-aft shear, side-to-side shear, and vertical forces at the top of the tower; “TwrBsFxt” captures similar forces (fore-aft shear, side-to-side shear, and vertical forces), but at the base of the tower. “TwrBsMyt” represents the side-to-side bending, fore-aft bending, and yaw moments at the tower base. “TwHt1MLyt” indicates the local side-to-side bending, fore-aft bending, and yaw moments measured at tower gage 1. “HydroMyi” is related to the hydrodynamic moment about the side-to-side motion axis. “B1Pitch” is the pitch angle of blade 1. Lastly, “B1HDSMyi” refers to the hydrostatic moment from the 1st WAMIT body about the global y-axis at the 1st WAMT body reference point. The example depicted in
Figure 5 illustrates the first five rows of the dataset for one of the load cases.
The proposed model introduces a technique for creating lagged features to grasp the time-related dynamics and patterns within the dataset. Lagged features are previous data points in a time series, considered as distinct input variables, a method highly effective for time-series forecasting. This approach is grounded in the principle that historical data are a significant predictor of future trends. By instituting a lag of n time steps, each principal variable in the dataset is converted into a sequence of its past values, thus providing a richer context for the model’s forecasts. The present study utilized a 10-step lag, where each data point in the model accounted not only for a feature’s current value but also its previous 10 values. This approach enabled the model to learn from the data’s temporal evolution, identifying underlying patterns and trends. This sequential structure of the data proved to be especially beneficial for GRU models, which thrive on time-ordered data.
The advanced deep learning architecture in this study is a sequential model benefiting from the strengths of CNNs and GRU networks. The GRU layers are tasked with predicting platform pitch displacement, harnessing the long-term sequential patterns captured by the local features extracted by the CNN layers. The architecture’s initial layer is a one-dimensional convolutional layer, Conv1D, with a kernel size of 3 and 100 filters, employing Rectified Linear Unit (ReLU) as the activation function to process the incoming data sequences.
In the convolutional layer, a kernel size of 3 specifies the window breadth, while the 100 filters indicate the quantity of feature maps generated. After each convolutional layer, a max pooling layer (MaxPooling1D) with a pool size of 2 is applied, serving to reduce computational load and prevent overfitting by downsizing the data dimensionality.
The model incorporates GRU layers, with the first layer containing 64 units and outputting the complete sequence of the hidden state. A batch normalization layer succeeds this to foster training stability and efficiency. The subsequent GRU layer, also with 64 units, is distinct in not returning sequences but focusing on the output of the final time step to grasp the data’s extensive sequential dependencies. This is again followed by a batch normalization layer. The architecture culminates in a dense layer (dense) with a single unit, signifying the model’s output as either a continuous value or a probability score. The early stopping call back method is also applied to prevent overfitting and save time and computational resources when the model is not learning anymore.
For model compilation, the Adam optimizer was chosen for its proficiency in managing sparse gradients and its adaptable learning rate capability [
44].
The mean squared error (MSE) was selected as the loss function, commonly employed in regression tasks:
Here,
n indicates the total number of observations,
represents the actual value, and
is the model’s prediction. Utilizing MSE to gauge the model’s prediction error offers an extensive evaluation of the model’s precision. A notable feature of this metric is its capacity to quantify the discrepancy between forecasted and actual values through the mean of their squared differences [
45]. Models with lower MSE values are indicative of higher accuracy. This approach guarantees the rigorous scrutiny of the model’s effectiveness, ensuring that the findings are dependable and pertinent. Employing MSE for model evaluation is advantageous owing to its robustness and heightened sensitivity to substantial discrepancies.
3. Results and Discussion
The training results and subsequent test data evaluations affirmed the efficacy and potential applicability of the proposed CNN–GRU model. The model’s architecture managed to accurately predict wind turbine pitch response, with a training loss of 0.036 and a lower validation loss of 0.018, indicating that the model effectively captured generalizable patterns and excelled with new, unseen data.
Figure 6 plots the history of training and validation loss of the model against the number of epochs. The synergy in the CNN–GRU architecture, where CNNs excel at extracting the features from time series and GRUs adeptly recognize long-term patterns in complex datasets, likely contributes to successfully predicting the platform pitch of the FOWTs.
The MSE value from the comparison between test data and actual values was around 0.018, indicating a high accuracy level in the model’s predictions. Such a low MSE value, considering the data’s scale and outlier impact, suggests that the model’s forecasts closely mirror the actual pitch displacement values of the system.
The time series of predicted versus actual pitch displacement data across six load scenarios, depicted in
Figure 7,
Figure 8 and
Figure 9, showcase the model’s exceptional skill in accurately reflecting intricate trends and relationships within the features. In naming the load cases, the number following ‘w’ denotes the wind field number, the number after ‘s’ indicates the sea state, and the number following ‘d’ represents the direction number. For instance, ‘w1s2d1’ refers to a load case that employs the first wind field with a mean horizontal wind velocity of 10 m/s. This is combined with a sea state of two, characterized by significant wave heights of 0.67 m and a wave period of 4.8 s. ‘d1’ signifies that the horizontal inflow wind direction is at a −30-degree angle relative to the turbine hub’s central axis.
An additional twenty load cases were randomly selected from the entire set of load cases. The MSE values between the predictions and the actual platform pitch for these load cases are plotted in
Figure 10, providing further insight into the accuracy of the model.
Evaluating the statistical metrics linked to the model’s errors (residuals) yielded important insights into its predictive tendencies. The model exhibited a consistent, though modest, trend of overestimating the target variable, as indicated by an average error value of 0.03. While this pattern is subtle, its persistence is significant. The small scale of the mean error points to a relatively balanced model that does not heavily favor overestimation or underestimation. This finding is further supported by the median error, recorded at 0.033. The positive nature and close proximity of both the mean and median error values highlight a consistent slight overestimation trend in the model’s forecasts.
Figure 11 illustrates the histogram of error residual for the model, providing a visual representation of these findings.
The results from model evaluation highlight the efficacy of integrating Convolutional and Recurrent Neural Networks for managing complex time-series data featuring a multitude of variables and spatial correlations. The essence of proficient time-series forecasting lies in effectively capturing both spatial dimensions and temporal patterns. Furthermore, the high accuracy of this proposed model opens avenues for its practical application. It holds the potential to enhance operational efficiency by accurately forecasting FOWTs’ dynamic responses. This can lead to improved structural health monitoring and more efficient resource allocation, thereby optimizing overall wind turbine performance.
4. Conclusions
The integration of deep learning algorithms for forecasting the performance of FOWTs marks a significant advancement in renewable energy research. This study successfully predicted FOWT performance using a hybrid deep learning approach, merging a CNN and a GRU network, tailored to navigate the intricacies of FOWT systems. This model emerged as a timely and effective alternative to traditional numerical models, breaking new ground in the field.
The CNN–GRU model holds the potential to boost the dynamic performance of spar-type FOWTs by accurately predicting pitch displacements. This research validated the model’s capacity to enhance turbine efficiency and sheds light on its applicability in predictive maintenance and the development of sophisticated control systems.
From an engineering viewpoint, it is crucial to adapt the model for practical use in situations where verification data may be limited or absent. The industrial world relies heavily on the ability to adjust to the fluctuations in data while maintaining accuracy and efficiency. To tackle this challenge, the transfer learning approach can be leveraged, where models pretrained on extensive datasets are modified for industrial applications. By doing so, the knowledge already embedded in these models can be harnessed even in the absence of specific verification data. That is why the CNN—GRU model’s capability to generalize from learned patterns and predict dynamic responses under diverse conditions without explicit prior knowledge is immensely valuable. This study involved model training and assessment through a dataset that covered a wide range of environmental conditions and load scenarios. The key findings can be listed as follows:
The CNN–GRU model showed promising outcomes in predicting floating offshore wind turbines’ platform pitch dynamic response.
This study showcased the model’s effectiveness in handling various data scenarios and its adaptiveness and generalization capability.
Deep learning methods have the potential to optimize turbine efficiency and integrate wind power into energy grids.
Incorporating deep learning algorithms into the domain of renewable energy heralds a future of more efficient, sustainable, and reliable energy solutions. This research significantly contributes to the efforts regarding wind energy utilization, with the methodologies devised here showing considerable potential for future renewable energy advancements. The applications of such models are not confined to wind turbines alone, indicating a wide spectrum of possibilities for future studies aimed at optimizing a variety of renewable energy systems.


