Article

Comparative Life Cycle Assessment of Different Portland Cement Types in South Africa

by
Oluwafemi E. Ige
* and
Oludolapo A. Olanrewaju
Department of Industrial Engineering, Durban University of Technology, Durban 4001, South Africa
*
Author to whom correspondence should be addressed.
Clean Technol. 2023, 5(3), 901-920; https://doi.org/10.3390/cleantechnol5030045
Submission received: 8 April 2023 / Revised: 17 May 2023 / Accepted: 7 July 2023 / Published: 13 July 2023

Abstract

:
Cement has long been recognized as an energy- and emission-intensive construction material. Cement production has recently experienced significant growth despite its high energy consumption, resource usage, and carbon emissions. This study aims to assess and compare the life cycle assessment (LCA) of traditional Portland cement (CEM I) to those of three blended cement types (CEM II/B-L, CEM II/B-V, and CEM III/A), which assume mature technologies for reducing carbon emissions in South Africa, using LCA in compliance with ISO/TS 14071 and 14072. As its scope, the study employs the “cradle to gate” method, which considers the raw materials, fuel usage, electricity, transportation, and clinkering stages, using 1 kg of cement as the functional unit. The LCA analyses were performed using SimaPro 9.1.1.1 software developed by PRé Consultants, Amersfoort, Netherlands and impact assessments were conducted using the ReCiPe 2016 v1.04 midpoint method in order to compare all 18 impact categories of 1 kg of cement for each cement type. The assessment results show reductions in all impact categories, ranging from 7% in ozone depletion and ionizing radiation (CEM II/B-L) to a 41% reduction in mineral resource scarcity (CEM III/A). The impacts of global warming were reduced by 14% in the case of CEM II/B-L, 29% in the case of CEM II/B-V and 35% in the case of CEM III/A. The clinkering process was identified as the primary cause of atmospheric impacts, while resource depletion impacts were attributed to raw materials, fuels, and electricity processes, and toxicity impacts were primarily caused by raw materials. Alternative materials, like fly ash and ground granulated blast furnace slag (GGBFS), can significantly help to reduce environmental impacts and resource consumption in the cement industry.

1. Introduction

Cement production is a multiplex process that uses numerous raw materials, non-renewable energy, electricity, and heat energy, as well as air and water as auxiliary resources [1,2,3]. This process significantly impacts our environment due to its raw material and high energy use and processing [4]. The main environmental problems are energy use and air emissions, wastewater production, solid waste production, and noise. Therefore, cement is a widely used construction material whose production has an enormous environmental impact, especially with regard to carbon dioxide (CO2, a greenhouse gas) emissions and energy consumption [5,6]. A significant amount of CO2 (900–1000 kg/ton of cement production) is emitted during the heating of the limestone and clay to 1450 °C in cement production [7,8]. Cement production, the second largest industrial source of carbon emissions, contributes about 5–10% of global anthropogenic CO2 emissions [9,10] and 3% of total greenhouse gas (GHG) emissions [2,11,12]. Cement production accounts for about 12–15% of total industrial energy usage globally [11,13]. Cement industries are most concerned about NOX and SO2, among other air pollutants. These emissions are both direct and indirect. Most carbon dioxide (CO2) emissions are direct emissions from calcium carbonate (CaCO3) calcination to calcium oxide (CaO) during clinker production [14,15], while indirect emissions are caused by burning fossil fuels, used in calcination, material processing, transportation, and cement grinding [15,16]. Regardless of production technology and location, direct and indirect CO2 emissions contribute approximately equal amounts of CO2 emissions [17].
Global cement production is estimated to emit 4.3 Gigatonnes (Gt) of CO2 eq/year by 2050 if there is no mitigation effort, representing a 260% increase over 1990 emission levels [18,19]. Various mitigation strategies are available for reducing GHG emissions from cement production, including improving energy efficiency, switching to alternative fuels, and using recycled materials as aggregate. The production and transportation of cement materials result in a significant carbon footprint. Numerous initiatives are underway to mitigate its environmental impacts. Notably, using by-products has emerged as a noteworthy development in this regard. Assessing the possible environmental impacts of different cement products is of utmost importance toward reducing their harmful effects on climate change, ecosystem quality, human health, and the resources required for cement production. Among the most effective ways to reduce resource consumption and carbon emissions from cement production is to use industrial waste as an alternative material and fuel [20]. Alternative fuels are often employed in the kiln and calciner to reduce non-renewable fossil fuel usage and pollutant emissions from fuel burning [21]. Another possible method is to use alternative materials, such as supplementary cementitious materials (SCMs), industrial by-products, and waste. The properties of these SCMs enable them to be used as partial or complete substitutes for clinker in Portland cement during cement production. Also, SCM application can improve the industrial relationship between the cement industry and other sectors because SCMs are primarily composed of waste from other industries [12]. Various SCMs, such as blast furnace slag (BFS) from the steel industry, as well as ground limestone powder (GLP) and fly ash (FA) from the coal industry, are available for reducing carbon emissions from Portland cement production and for producing low-carbon blended cement [22,23,24].
Despite concerns regarding the global availability of fly ash and slags, South Africa has a relatively abundant supply of both [25], which could be a tremendous opportunity for the local cement industry to use these two wastes to produce eco-blends. Approximately 40 million tons of fly ash are produced annually in South Africa [25]. Furthermore, roughly 9.3 kWh per ton of energy consumption are required to process FA as an SCM in cement [26]. FA is used in this study under the ‘no allocation’ principle [27,28], indicating that no upstream environmental impacts from coal-fired power plants have been allocated to FA. BFS is a solid by-product of the iron–steel metallurgical industry that has been stored for a long period, occupying large land spaces and causing environmental pollution in the soil, underground water, and air. FA and ground granulated blast furnace slag (GGBFS) are widely used in cement production, which reduces the consumption of natural resources and their environmental impact. Also, achieving environmental protection through comprehensive waste resource use is advantageous. FA is a by-product that usually results from burning coal for electricity generation in coal-fired power plants. Although FA can be used directly as a cement substitute [28], it can also be combined with conventional raw materials to produce Portland cement [29]. FA as a cement substitute can improve the properties of cement strength and durability and reduce GHG emissions [30], as well as the strength development rate [31]. GGBFS is a by-product of hot metal production in the blast furnaces of steel plants, produced by water-quenching slag [15] and used as a partial substitute for Portland cement in cement production. It can increase technical properties, such as strength, permeability, and corrosion resistance, when used as a substitute in Portland cement production [32]. Using GGBFS in cement production consumes fewer raw materials and reduces GHGs, mainly CO2 and other environmental impacts [33,34,35], thereby improving the cement’s technical properties [36,37,38].
In South Africa, the age of cement plants ranges between 5 and more than 70 years [39]. Limestone, shells, and chalk or marl are among the most used raw materials in cement production, along with clay, shale, slate, silica sand, iron ore, blast furnace slag, and gypsum. Some cement plants in the country use only low-grade limestone as a raw material for clinker production [40]. Portland Cement (CEM I) is the most commonly produced cement product in South Africa, followed by blended cement products such as CEM II–CEM III, with 16 integrated cement plants within the country [41,42] using the dry process [18,43,44]. CEM I cement is Portland cement with more than 95% clinker content. CEM II cement refers to Portland cement with clinker content between A (80–94% clinker ratio) and B (65–79% clinker ratio). Gypsum, plus other pozzolanic components such as fly ash, blast furnace slag, micro silica and ground limestone, are present in CEM II cement. CEM III cement refers to Portland cement with clinker content between A (35–64% clinker ratio) and B (20–34% clinker) [40,42]. CEM III contains gypsum and GGBFS. Since blended cement needs a finer grind and is produced with different cement constituents, blended cement production requires more electricity than Portland cement production. South African cement products are sold within the country and to other Southern African countries, including Namibia, Swaziland, Lesotho, and Botswana. The CO2 released during clinker production, an intermediate stage in cement production, is the primary GHG emission. Clinker production, where the raw meal is converted into clinker, is the most energy-intensive and emission-prone stage in cement production, [3,45].
In 2019, South Africa ranked seventh in the world and first in Africa regarding GHG emissions, mainly due to its dependence on coal [46]. Burning fossil fuels accounts for about half of the CO2 emissions associated with clinker production, while the remaining emissions are from limestone calcination [47]. The cement industry in South Africa plays a vital role in meeting the government’s developmental goals to reduce GHG emissions. Still, it is also one of the country’s largest emitters of GHGs, accounting for 1% of total emissions. Therefore, the cement sector must take action to mitigate and reduce its carbon footprint in order to fulfill both the national development and international climate change commitments.
Furthermore, the total energy required for cement production is influenced by location, production efficiency, technology, the energy mix used to generate electricity, and kiln fuel selection [47]. Several methods have been proposed for reducing CO2 emissions, conserving non-renewable fossil fuels, reducing fuel costs, and preventing waste incineration and landfilling. These include reducing the clinker/cement ratio, using waste or raw materials as fuel, and upgrading the current technology [48,49,50]. Cement production can also use non-carbonate materials, reducing CO2 emissions, but the amounts used in South Africa are low and unreported. Despite recent increases in the use of alternative fuels, further improvements are still possible. In cement production, burning fossil fuels contributes to significant amounts of GHG emissions, so substituting the fuels used in the cement industry can reduce these GHG emissions.
When implementing the clinker substitution strategy in the cement industry, it is essential to evaluate its environmental impacts comprehensively. Life cycle assessment (LCA) is a suitable standard tool used to measure not only the global warming potential (GWP) of blended cements, also called SCM-based cements, but their additional effects on ecosystems, human health, and resource availability. Rather than limiting the impact assessment to the production stage of cement only, LCA can assess the entire life cycle of cement, starting from the extraction of raw materials to its end disposal. Since 2009, LCA has been carried out on blended cements in order to assess how eco-friendly they are when substituting clinker with SCMs in blended cements. Despite this, there has been no attempt to gather and compare these LCAs. Consequently, an updated publication is necessary in order to consolidate these existing LCAs and provide direction and assistance to researchers and stakeholders in the emerging field of SCM-based cement.
The cementitious properties of GGBFS make it an ideal substitute for clinker in cement production. For instance, in CEM III products, GGBFS substitution ranges from 21 to 95%, depending on the type of blend of cement products. The following are the advantages of Portland FA and Portland GGBFS blended cement: both are abundant and cost-effective, have the same cost as PC, reduce other environmental impacts from landfills and dams when used as CSMs in cement production, demonstrate the same performance as traditional Portland cement, and reduce carbon emissions from cement production. Likewise, Portland limestone has a similar price to Portland cement, is abundant in many countries, has the same performance as Portland cement, and uses the same equipment as traditional Portland cement.
This study selected different cement types with a share of clinker substitutes and compared them to traditional Portland cement products with a substantial percentage of GLP, GGBFS, and FA substituted for clinker. Cementitious materials like FA and GGBFS are used in cement production to substitute clinker in order to reduce cost, energy, and CO2 emissions. The selected products are CEM I, CEM II/B-L, CEM II/B-V, and CEM III/A (SAN 50197-1). The clinker used in this study was the finished product, an essential product in cement production.

2. Literature Review

Since the cement industry consumes a lot of energy and significantly impacts the environment, it is essential to identify and quantify the environmental impacts caused by cement production and to identify opportunities for environmental improvement through effective methods. The impurities in primary limestone raw materials are an example of non-carbonate materials [40]. The cement industry has used a variety of alternative fuels around the world, including waste from wastewater treatment plants, industrial wastes (such as plastic waste and scrap tires) [51,52], wood residue [53,54,55], and biomass waste [56,57,58,59]. Moreover, innovative materials in cement production, such as blended Portland cement, might also be significant in producing sustainable cement [42,60]. Several studies have investigated the environmental impacts of cement production in the United States [29,61], Europe [48,62,63,64,65], India [66], Africa [67,68,69,70], Canada [71], Japan [72,73,74], Hong Kong [54], and China [75,76,77,78,79]. LCA is a vital tool for assessing the environmental impact of cement production and for developing and selecting potential methods. Many studies on LCA have focused on improving technology and plant variability [38,63,64], as well as using FA and GBFS to produce blended cement [35,80,81,82]. Habert et al. [83] and Crossin [15] developed multi-factor allocation procedures with which to examine the advantages of using industrial waste in cement production. They indicated the possibility and limitations of using industrial waste. These studies used the LCA method to investigate cement’s environmental impact and focused on using GGBFS, FA, and limestone powder as partial substitutes for raw materials.
Hossain et al. [54] used the LCA method to thoroughly evaluate the energy consumption and GWP impacts of various types of cement produced in Hong Kong. They suggested two sustainable approaches to reducing the cement industry’s energy consumption and GHG emissions. According to the LCA results, the environmental impacts of Portland cement production are primarily due to importing raw materials and burning fossil fuels. One effective way to mitigate these impacts is using alternative materials like fly ash. Additionally, incorporating locally generated glass bottle waste into the raw materials and using a biofuel produced from locally generated wood waste as a co-fuel with coal can further reduce the environmental impacts of cement production. The assessment found that using waste materials to replace materials in clinker production, or using biofuel instead of coal, could result in a 12% reduction in greenhouse gas emissions and a 15% reduction in energy consumption for the cement industry in Hong Kong.
Yang et al. [76] used LCA and partial LCC to compare the environmental impacts of the production of six different strength grades of cement in China. Based on the comparative results, compared to cement with a lower strength grade, a cement with a higher strength grade has more environmental impacts, but somewhat better economic performance. Also, the study identifies high resource and energy consumption, direct emissions, and raw material transport as the main processes contributing to the environmental impacts and economic costs. The study suggests promoting cement production technology, decreasing limestone and energy consumption, increasing the energy recovery rate, and optimizing transport distance as effective approaches to reducing the environmental impacts and economic costs in the Chinese cement industry.
Pushkar and Verbitsky [81] used The LCA model to investigate the environmental impacts of five different blended cement types produced with FA, GBFS, and limestone powder in Israel. They used three allocation methods to demonstrate the variability of the results. They discovered that using SCMs in concrete resulted in environmental loads that were 15–55% higher than those of OPC concrete, with the degree of increase depending on the specific types of SCMs used. The study found that the selection of the most environmentally friendly concrete mixture, the environmental ranking of pozzolanic blended cement compared to Portland cement, and the method of evaluating the two types of concrete mixtures were influenced by the allocation approach used for the pozzolanic blended cement.
Gabel and Tillman [84] investigated the environmental impact of cement production in Sweden by utilizing various alternatives, such as industrial wastes as raw materials. The model was used to explore potential development options, including increasing the use of industrial by-products and wastes as raw materials and fuels. According to the simulations conducted using the model, an increase in the use of recovered material and alternative fuel could substitute the usage of resources, while meeting the current requirements for clinker performance. The simulation results also showed that increasing the use of recovered material and alternative fuel can replace resource usage while reducing CO2, NOX, SO2, CO, VOC, CH4, and dust emissions by 30–80%.
Hossain et al. [85] used The LCA method to analyze and compare the sustainability and environmental impacts of natural blocks produced with virgin materials (FA and cement). The study used 1 t of block production as a functional unit. The results showed that eco-blocks used 26–32% less energy and released 17–20% less GHG in CO2 equivalents contributing to GWP. Depending on the type of eco-block, the reduction of 22–29% lower SO2 equivalent contributes to acidification potential and 20–26% PM2.5 equivalent, which relates to inorganic respiratory potential. There were significant increases in respiratory effects by approximately 60%, GHG emissions by 30%, and non-renewable energy consumption by 38%.
Chen et al. [27] used the LCA methodology to assess and compare the environmental impacts of two different SCMs (BFS and FA) and Portland cement. The study used three tested allocation procedures to determine the environmental burdens of the system. The results have discussed the specificity of SCMs and the driving forces behind their use. They showed that, under mass allocation, the use of GBFS and FA resulted in global warming effects of approximately 165% and 495% higher than that of OPC, respectively, and the energy consumption related to using GBFS was 346% higher, while that of FA was 744% higher. The study proposed a new allocation procedure that evaluates environmental burdens based on relative economic value, which could be generalized for other waste recycling and used as a regulation tool between different industrial branches.
Saade et al. [35] used the LCA methodology to examine the environmental impacts of different blended cement types in Brazil using BFS and FA in cement production. The study examines allocation by mass, economic value, and system expansion and finds that each method presents advantages and disadvantages. Ultimately, the system expansion approach is the most accurate for modeling the studied processes and considering potential improvements at a whole-system level. As predicted, allocating impacts based on mass results in significant impacts on BFS, and, as the BFS content increases, the environmental loads of blended cement also increase gradually. Allocating impacts based on economic value shows a similar trend, except for global warming and terrestrial ecotoxicity, which are influenced by the allocation method chosen.
Y. Li et al. [80] assessed the environmental impact of using blast furnace slag in Portland cement production at a typical cement plant in Beijing according to ISO 14040/14044 standards [86,87]. The study also analyzed the impact of factors such as resource usage, transportation distance, and allocation methods using the LCA model. According to the results, slag-based cement production caused the most notable environmental impacts regarding global warming, accounting for 58.5%, while acidification potential accounted for 21.7% of the total environmental impact. According to the sensitivity analysis, the overall environmental impact of slag-based cement was significantly affected by the amount of limestone and energy used, as well as the chosen allocation methods. However, the consumption and transportation distance of blast furnace slag were not considered. Cement production using blast furnace slag would lead to a minor rise in electricity usage, yet bring significant advantages to conserving land resources and materials. Additionally, it would significantly reduce the overall environmental impact of cement.
Lee and Park [33] measured the environmental advantage of GBFS recycling from three different points of view: life cycle inventory on CO2, global warming impact characterization, and product system weighted impact using the Eco-indicator 99 method of LCA. Song et al. [88] used the LCA method to evaluate the process of using BFS as an alternative material for slag cement production and ready-mixed concrete. They calculated its environmental benefits, for example, energy savings, consumption reduction, and carbon emissions reduction. Shen et al. [89] examined low-carbon technologies using gypsum plus slag-based cement for cement production in China. The comparative impact assessment of different types of cement in the context of cement production has only been addressed in a few previous LCA studies. Currently, South Africa produces various types of cement, such as CEM I, CEM II/B-L, CEM II/B-V and CEM III/A. The environmental impact related to the production of each type of cement needs to be assessed and compared through a case-specific LCA study.
Therefore, this study evaluates and compares the environmental impacts of 18 impact categories of the different blended cement types with traditional Portland cement in the South African cement industry, according to International Organization for Standardization (ISO) ISO/TS 14071 and 14072 standards [90,91], focusing on the cradle-to-gate system boundary. Regarding using different clinker substitutes in cement production, we provide a detailed environmental investigation and analyze various impact categories from different cement products in South Africa. A hybrid LCA was conducted using secondary data from Ecoinvent, modeled after South Africa, to assess and compare the environmental impacts caused by the different cement products in South Africa. This analysis investigated the impacts produced by the cement industry, their impacts on the environment, and the opportunities for environmental improvement at a national level.

3. Materials and Methods

3.1. Details of Types of Cement in South Africa

This work assesses potential CEM II/B-L, CEM II/B-V and CEM III/A based on reducing the clinker-to-cement ratio. As per the cement standards in South Africa (SAN 50197-1), traditional Portland cement (CEM I) has a ratio of 95% Portland cement clinker and 5% gypsum, with 0–5% of admixture (e.g., slag, fly ash). CEM III/A is a type of Portland cement that contains 35–64% of clinker, 5% of gypsum, and 36–65% of GGBFS. CEM II/B-L is a type of Portland cement containing 65–75% clinker, 5% gypsum, and 21–35% limestone. CEM II/B-V is a type of Portland cement containing 65–79% clinker, 5% gypsum, and 21–35% fly ash.

3.2. Evaluating the Environmental Impacts of the Cement Industry

Following the LCA principle specified by ISO standards, this study uses the ISO/TS 14071 and 14072 [90,91], the latest version of the ISO 14040 and 14044 [86,87], as the LCA methodological framework against which to assess and compare the environmental impact of different types of cement in South Africa. The ISO guidelines outline the four main stages of the LCA methodology structure: goal and scope definition, life cycle inventory (LCI), life cycle impact assessment (LCIA), and life cycle interpretation. The four cement types were analyzed and compared using inventory datasets from SimaPro V9. 1.1.1, developed by PRé Consultants Amersfoort, Netherlands, and the Ecoinvent database 2020 [92], established in Switzerland.

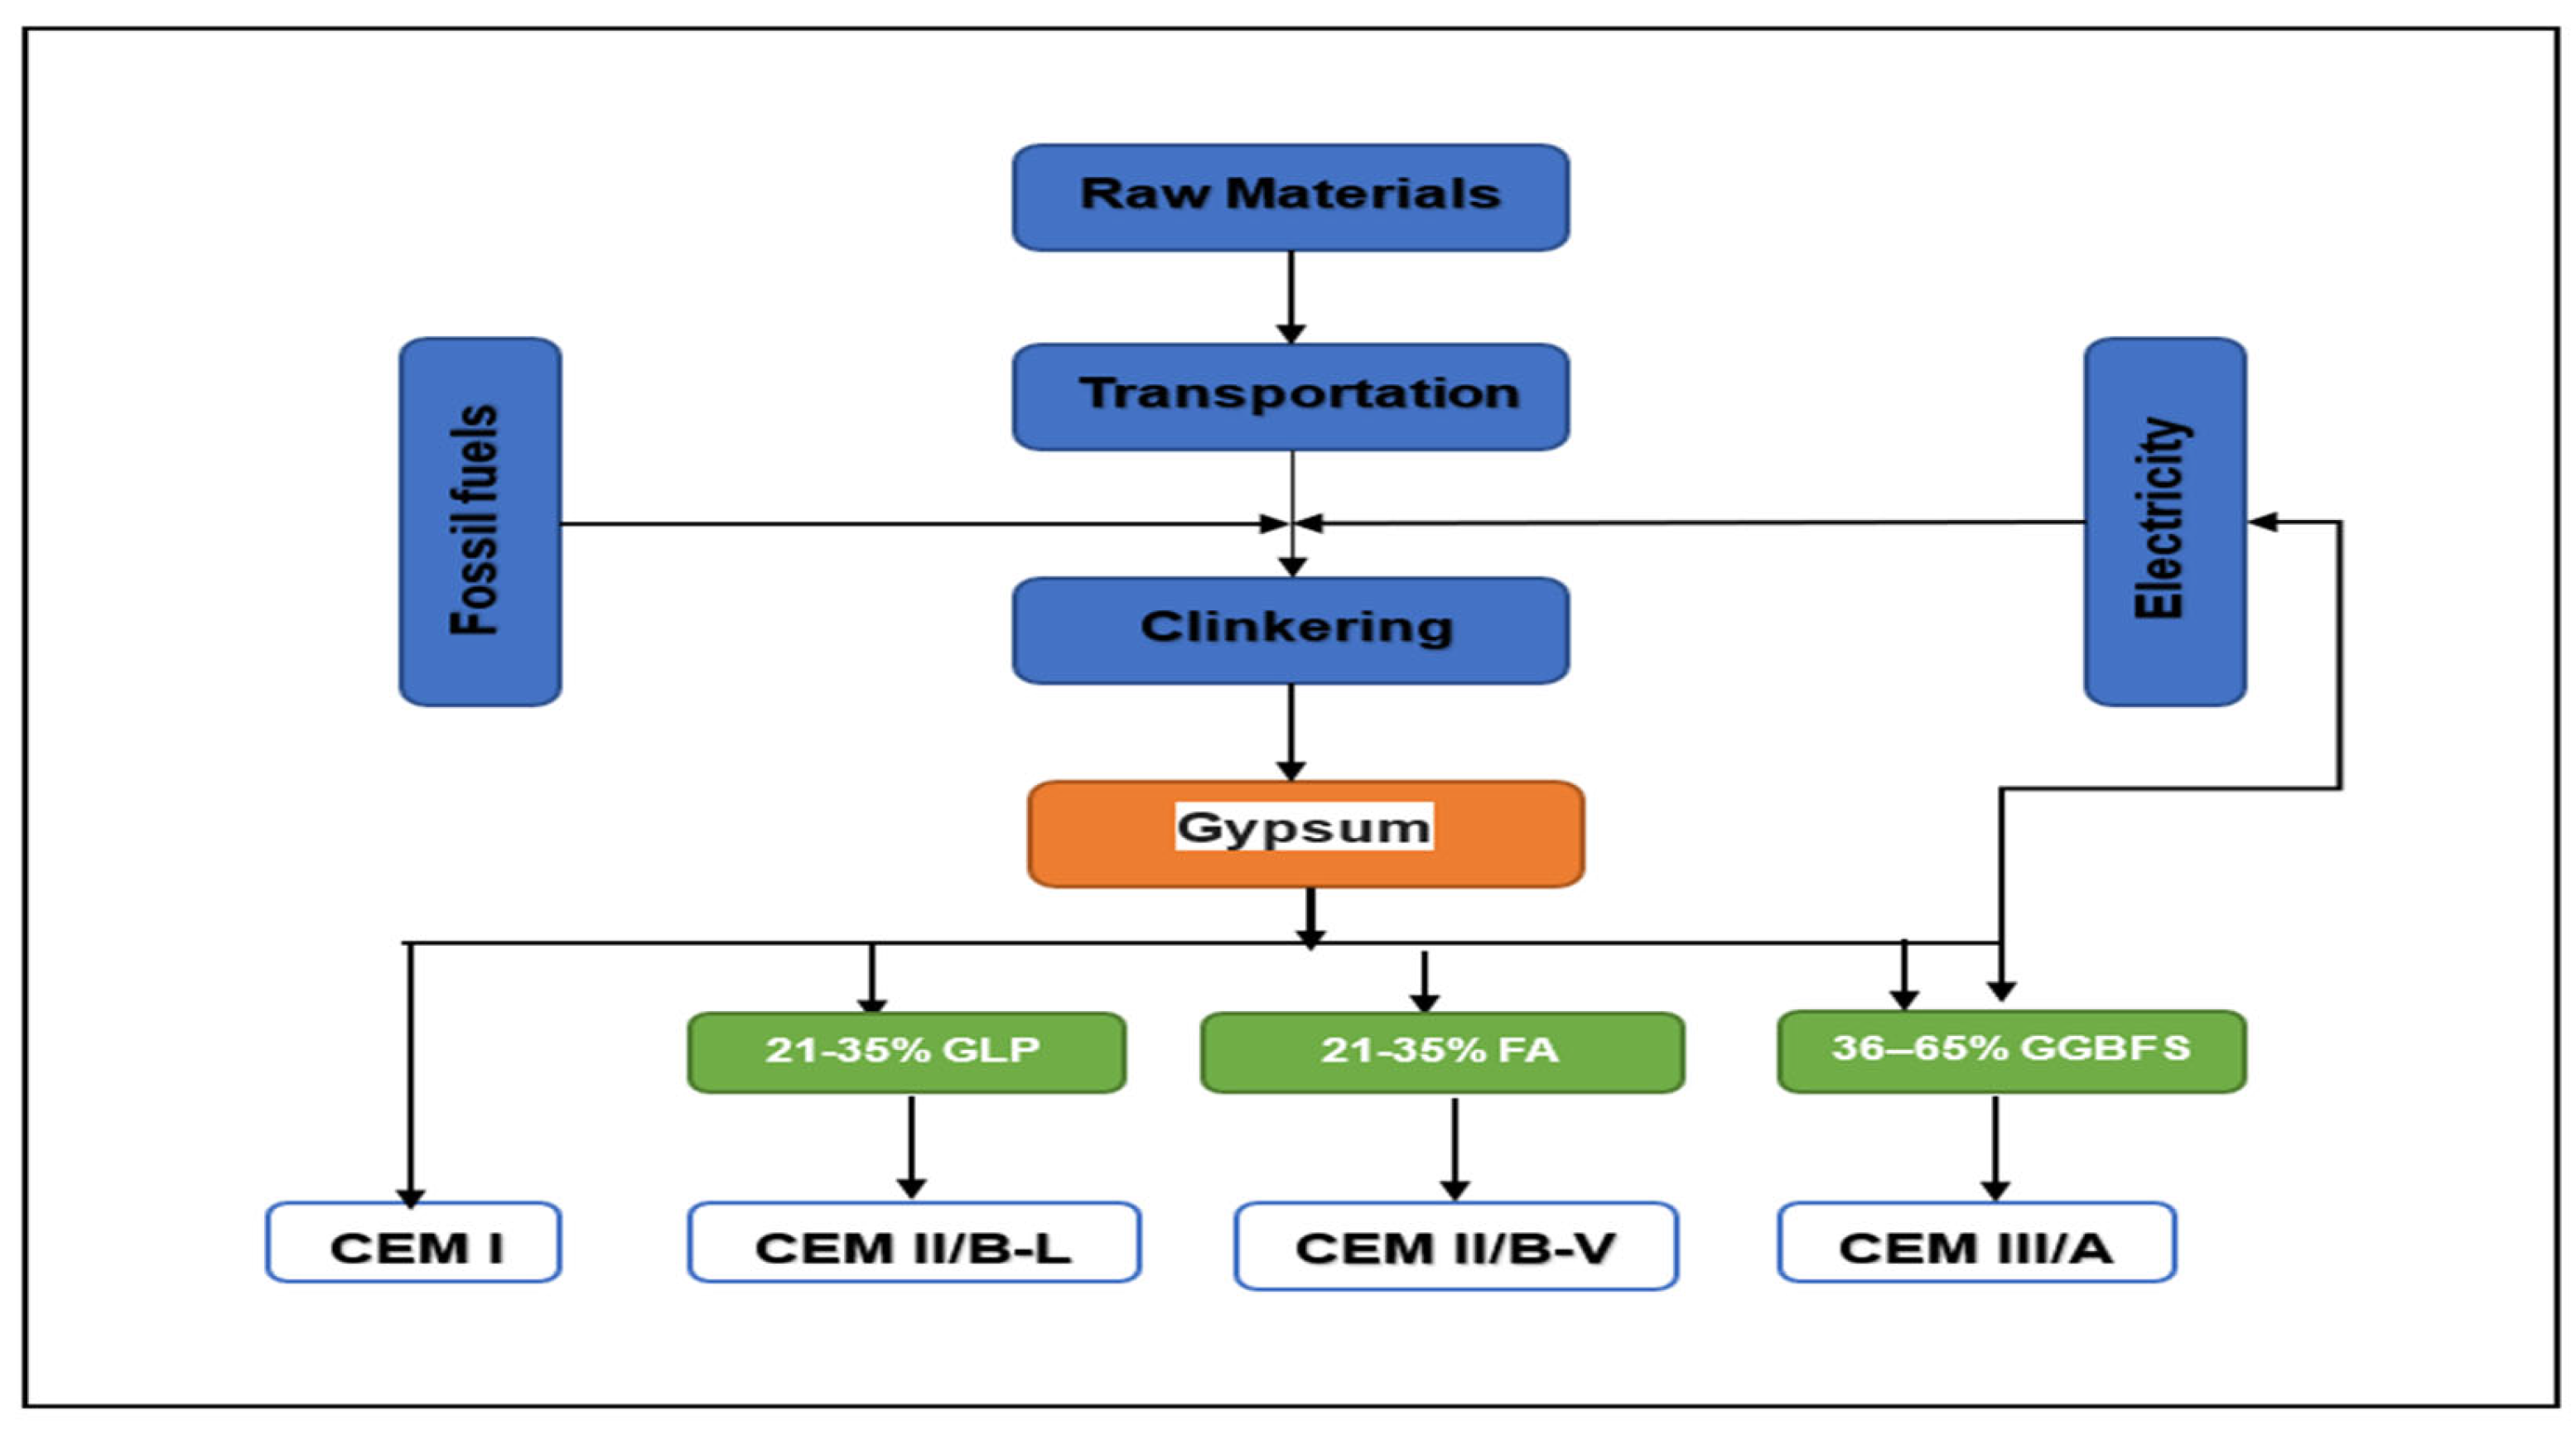
3.3. The Functional Unit, System Boundary, and the Goal and Scope Definitions

Clearly defining the goal and scope of the LCA study includes specifying the purpose of the assessment, the functional unit (i.e., per ton of cement produced), the system boundaries (which processes and inputs/outputs are included), and the time frame for the assessment. In order to define the goal and scope of the study, we determined system boundaries and selected a functional unit. The intended goal of this study is to assess and compare the environmental impact of different types of cement produced in South African cement plants. The system boundary determines which unit processes must be integrated or omitted in cement production. The system boundary includes raw material extraction, the production stage, electricity consumption, plant operations, and transportation to/within the plant. This study used the cradle-to-gate method, similar to Stafford et al. [93] and Ige et al. [67]. In this study, data collection and calculations have been adapted to utilize 1 kg of cement produced in South Africa as the functional unit for LCA, which is widely recognized within research fields. This decision was made because cement is commonly packaged in bags and measured in kilograms or tons by weight. A functional unit provides inputs and outputs as references. The system boundary of cement production is shown in Figure 1.
Due to methodological issues, the boundary did not include the packing unit, cement consumption waste treatment, or final disposal of cement as waste. In order to accomplish the goal and scope of the study, the whole production process is combined into five production stages: raw material usage, transportation, electricity usage, fuel usage, and clinkering stage, as shown in Figure 1.

3.4. The Inventory Analysis

Data were collected on all inputs (e.g., raw materials, energy, water) and outputs (e.g., emissions, waste) associated with each stage of cement production, from raw material extraction to the end of life. These data should be based on reliable sources and representative of the specific cement production system being assessed. Table 1 contains the input/output inventory data for 1 kg of South African Portland cement obtained from the Ecoinvent database v3.8 [94,95,96,97]. Equivalency or characterization factors indicate different environmental flows’ comparative degrees of impact. As a result, each environmental flow is multiplied by the characterization factors to make them equal in value to the category indicator. The dataset was based on average data, obtained from five cement companies from 2017 to 2021, the year of the calculation accounting for 90% of the cement market share. This study used SimaPro 9.1.1.1 LCA tools developed by PRé Consultants, Amersfoort, Netherlands to design the product assemblies and life cycles for different cement products and to identify the inventory element’s environmental impacts.
We used the Ecoinvent Cement, Portland ZA Cut-off, U” dataset for Portland Cement (CEM I) [94] production, the limestone 21–35% ZA Cut-off, U” dataset for Portland Limestone Cement (CEM II/B-L) [95] production, the fly ash 21–35% ZA Cut-off, U” dataset for Portland Fly-Ash Cement (CEM II/B-V) [96] production, and the blast furnace slag 36–65% ZA Cut-off, U” dataset for Portland blast furnace slag cement (CEM III/A) [97] as a reference.

3.5. Life Cycle Impact Assessment

The potential environmental impacts associated with the inputs and outputs identified in the LCI were evaluated. LCIA involves assessing various impact categories, such as global warming potential (expressed in CO2 equivalents), acidification potential, eutrophication potential, resource depletion, and others. LCIA methods and impact category indicators were selected based on scientific consensus and relevance to the study. According to Cucek et al. [98], environmental impacts can be used to assess different environmental indicators, such as GWP, PMFP, ODP and others, for sustainability assessment. The impacts were assessed with SimaPro 9.1.1.1 software developed by PRé Consultants, Amersfoort, Netherlands using the ReCiPe 2016 midpoint method. This approach is a practical and commonly used method for assessing environmental impacts. It involves linking different life cycle inventory results to multiple damage categories through several midpoint categories using the midpoint/damage approach. The ReCiPe is a method in LCIA used to evaluate the impact category at endpoint and midpoint approaches. It was developed to harmonize the midpoint and endpoint methods, thereby eliminating the necessity of selecting an LCIA method within an LCA model [99]. The midpoint approach provides a scientific and comprehensive assessment of various environmental impacts, considering cause-and-effect relationships [100].
Using impact categories helps distinguish between the environmental impacts of various selections. This study uses the ReCiPe 2016 Midpoint (H) V1.04 method [101] to assess the environmental impact of different cement types produced in South Africa. The midpoint method consists of 18 midpoint impact categories, including global warming (GWP), fine particulate matter formation (PMFP), stratospheric ozone depletion (ODP), ozone formation, terrestrial ecosystems (EOFP), human health (HOFP), terrestrial acidification (TAP), freshwater eutrophication (FEP), marine eutrophication (MEP), fossil resource scarcity (FFP), mineral resource scarcity (SOP), water consumption (WCP), land use (LOP), ionizing radiation (IRP), terrestrial ecotoxicity (TETP), freshwater ecotoxicity (FETP), marine ecotoxicity (METP), human carcinogenic toxicity (HTPc), and human non-carcinogenic toxicity (HTPnc).

3.6. Interpretation

The LCA results were analyzed and interpreted in order to understand the environmental hotspots, identify the significant contributors to impacts, and assess the overall environmental performance of the cement production system. Interpretation may include sensitivity analysis, normalization, and weighting of impact categories in order to provide a comprehensive perspective.

4. Results and Discussion

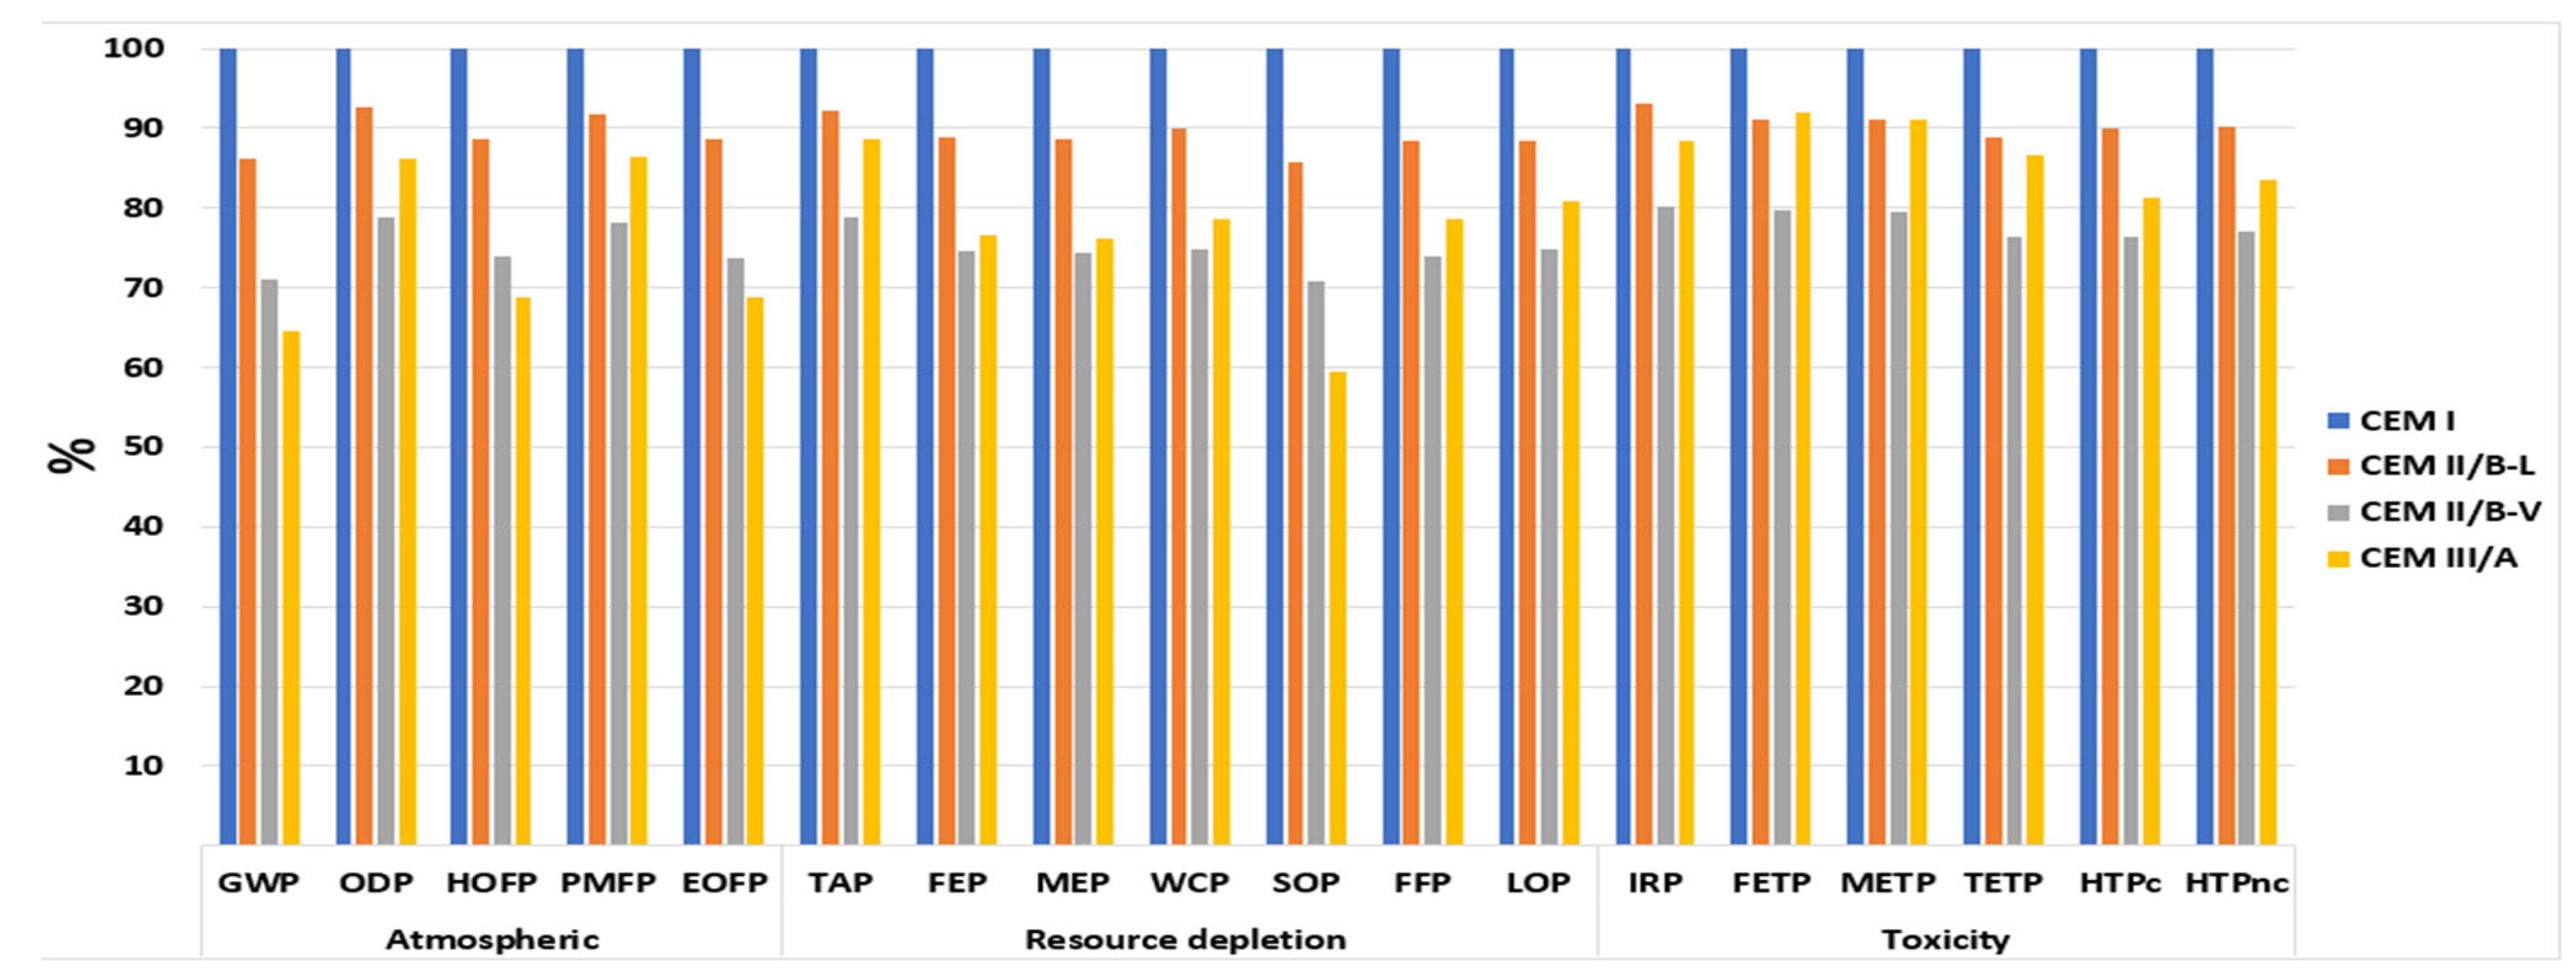
4.1. The Characterization Results of the Impact Indicators (Midpoint Analysis)

The impacts of each environmental impact category were calculated using different units to make it easier to compare the different scenarios. Table 2 presents the comparative characterization results of 1 kg of CEM I, CEM II/B-L, CEM II/B-V, and CEM III/A at the midpoint method. The impact categories studied in this work were divided into three impact groups (atmospheric, resource depletion, and toxicity) in order to enable visual analysis of the results. The atmospheric impacts consist of GWP, PMFP, ODP, EOFP, and HOFP, whereas resource depletion impacts include TAP, FEP, MEP, FFP, SOP, WCP, and LOP, and toxicity includes IRP, TETP, FETP, METP, HTPc, and HTPnc.
Generally, CEM III/A demonstrates the highest reduction in all impact categories, followed by CEM II/B-V and CEM II/B-L. This study showed that the impact on GWP was reduced by 14% in CEM II/B-L, 29% in CEM II/B-V, and 35% in CEM III/A, compared to CEM I.
Stafford et al. [93] stated that GWP is the most studied impact category in the LCA literature on cement production. Eco-blend cement significantly reduces GWP when compared to traditional PC. This study discovered that CEM III/A eco-blend cement emits 0.64 kg CO2, compared to CEM I and CEM II/B-L, which release 0.99 kg CO2 eq and 0.86 kg CO2 eq, respectively. As shown in Figure 2, this study compared the characterization result of CEM III/A with 36–65% GGBFS substitution to that of CEM I. Similarly, as shown in Figure 3, the GWP of CEM II/B-V eco-blend cement is 0.71 kg CO2 eq. With regard to the atmospheric impacts, CEM III/A shows the lowest contribution to GWP and HOFP, followed by CEM II/B-V, which contributes to PMFP, EOFP, and ODP.

4.1.1. Atmospheric Impact Category

The result showed that CEM III/A with GGBFS as an alternative material significantly reduced its environmental impact, particularly for GWP, HOFP, and EOFP at atmospheric impact categories. These results are consistent with other results reported in the literature, showing that 1 kg of traditional cement generates, on average, 0.6 to 1 kg CO2 eq [48,54,65,75,76,102,103,104,105,106,107,108]. According to Feiz et al. [64], Portland cement containing more clinker emitted more CO2 than cement containing more by-products, such as GGBFS. CEM I has a higher GWP due to several energy-intensive stages, such as raw material grinding, limestone decarbonization at 1400–1450 °C (calcination), and clinker grinding. The ODP values range from 1.53 × 10⁻⁷ kg CFC11 eq/kg to 1.94 × 10⁻⁷ kg CFC11 eq/kg. These values are within the values obtained from the Brazilian cement industry, which varies from 1.40 × 10⁻⁷ kg CFC11 eq/kg to 2.54 × 10⁻⁷ kg CFC11 eq/kg [93,109], and higher than the values obtained in Turkey, which range from 2.27 × 10⁻⁹ kg CFC11 eq/kg to 2.68 × 10⁻⁹ kg CFC11 eq/t [110], Spain, ranging from 2.28 × 10⁻⁸ kg CFC11 eq/kg to 4.37 × 10⁻⁸ kg CFC11 eq/kg [65], the Italian cement industry, ranging from 4.0 × 10⁻⁸ kg CFC11 eq/kg to 5.4 × 10⁻⁸ kg CFC11 eq/kg [105], and China, at 4.48 × 10⁻¹⁰ kg CFC11 eq/kg [107].
The PMFP values range between 7.93 × 10⁻⁴ kg PM2.5 eq/t for CEM I and 6.86 × 10⁻⁴ kg PM2.5 eq/t for CEM III/A, showing a reduction of 8% for CEM II/B-L, 22% for CEM II/B-V, and 14% for CEM III/A. These results are comparable to the literature values, ranging from 8.82 × 10⁻⁵ kg PM2.5 eq/kg to 5.88 × 10⁻⁴ kg PM2.5 eq/kg [65,76,109,110]. The HOFP values range from 1.45 × 10⁻³ kg NOx eq/kg to 2.10 × 10⁻³ kg NOx eq/kg, and the EOFP values range from 1.46 × 10⁻³ kg NOx eq/kg to 2.12 × 10⁻³ kg NOx eq/kg, showing similar reductions, of 11% in CEM II/B-L, 26% in CEM II/B-V, and 31% in CEM III/A relative to CEM I.

4.1.2. Resource Depletion Impact Category

Results for resource depletion impact range from 1.92 × 10⁻³ kg SO2 eq/kg to 2.44 × 10⁻³ kg SO2 eq/kg for TAP. TAP reductions vary from 8% for CEM II/B-L to 11% for CEM III/A and 21% for CEM II/B-V. FEP results range from 2.36 × 10⁻⁴ kg P eq/kg to 3.16 × 10⁻⁴ kg P eq/kg, while the reductions range from 11% for CEM II/B-L to 23% for CEM III/A and 25% for CEM II/B-V. These are consistent with other studies, which reported from 1.02 × 10⁻³ kg SO2 eq/kg to 1.74 × 10⁻² kg SO2 eq/kg for TAP [48,75,76,93,105,106,107,109,110], and from 6.52 × 10⁻⁶ kg P eq/kg to 1.38 × 10⁻⁴ kg P eq/kg for FEP [65,93,103,109]. The values for MEP range from 1.44 × 10⁻⁵ kg N eq/kg to 1.93 × 10⁻⁵ kg N eq/kg, with reductions of 11% for CEM II/B-L, 24% for CEM III/A, and 26% for CEM II/B-V. These values are lower than others studied, from 1.68 × 10⁻⁴ kg N/kg to 4.16 × 10⁻⁴ kg N eq/kg [65,93]. The values for FFSP are 1.03 × 10⁻¹ kg oil eq/kg to 1.39 × 10⁻¹ kg oil eq/kg, with reductions of 12% CEM II/B-L, 21% for CEM III/A, and 26% for CEM II/B-V. This is also within the values obtained from a study in Brazil: 1.25 × 10⁻¹ kg oil eq/kg [93]. WCP values range from 1.02 × 10⁻³ m3/kg to 1.36 × 10⁻³ m3/kg, and show reductions of 10% for CEM II/B-L, 21% for CEM III/A, and 25% for CEM II/B-V. The values of the WCP are similar to those from the study of Moretti and Caro, which reported 1.35 × 10⁻³ m3/kg [105]. LOP values range from 5.86 × 10⁻³ m2a crop eq/kg to 7.83 × 10⁻³ m2a crop eq/kg, with reductions of 11% for CEM II/B-L, 19% for CEM III/A, and 25% for CEM II/B-V, compared to CEM I. The results of the LOP agree with those of the study of Çankaya & Pekey [110], which reported 7.22 × 10⁻⁴ m2a crop eq/kg to 1.40 × 10⁻³ m2a crop eq/kg, and Palermo et al. [109], reporting 9.99 × 10⁻⁴ m2a crop eq/kg to 1.54 × 10⁻³ m2a crop eq/kg. The values of SOP range from 1.28 × 10⁻³ kg Cu eq to 2.16 × 10⁻³ kg Cu eq, with reductions of 14% for CEM II/B-L, 29% for CEM II/B-V, and 41% for CEM III/A, relative to CEM I. The SOP results agree with those of the study by Palermo et al. [109], which ranged from 1.17 × 10⁻³ kg Cu eq to 1.55 × 10⁻³ kg Cu eq.

4.1.3. Toxicity Impact Category

The values for IRP ranged from 8.01 × 10⁻³ kBq Co-60 eq/kg to 9.97 × 10⁻³ kBq Co-60 eq/kg, with reductions of 7%, 12%, and 20% for CEM II/B-L, CEM III/A, and CEM II/B-V, respectively. METP values ranged from 1.70 × 10⁻² kg 1,4-DCB/kg to 2.14 × 10⁻² kg 1,4-DCB/kg, with reductions of 9%, 9%, and 21% for CEM II/B-L, CEM III/A, and CEM II/B-V, respectively, relative to CEM I. TETP values ranged from 7.96 × 10⁻¹ kg 1,4-DCB/kg to 1.04 kg 1,4-DCB/kg, with reductions of 11%, 13%, and 24% for CEM II/B-L, CEM III/A, and CEM II/B-V, respectively. These values are higher than values found in other studies [93,107,109]. The values for FETP impact range from 1.26 × 10⁻² kg 1,4-DCB/kg to 1.58 × 10⁻² kg 1,4-DCB/kg, with reductions of 9%, 8%, and 20% for CEM II/B-L, CEM III/A, and CEM II/B-V, respectively. The values for HTPc range from 1.86 × 10⁻² kg 1,4-DCB/kg to 2.44 × 10⁻² kg 1,4-DCB/kg, with a reduction of 10% for CEM II/B-L, 19% for CEM III/A, and 24% for CEM II/B-V, while values for HTPnc range from 3.83 × 10⁻¹ kg 1,4-DCB/kg to 4.97 × 10⁻¹ kg 1,4-DCB/kg, with a reduction of 10% for CEM II/B-L, 16% for CEM III/A, and 23% for CEM II/B-V.

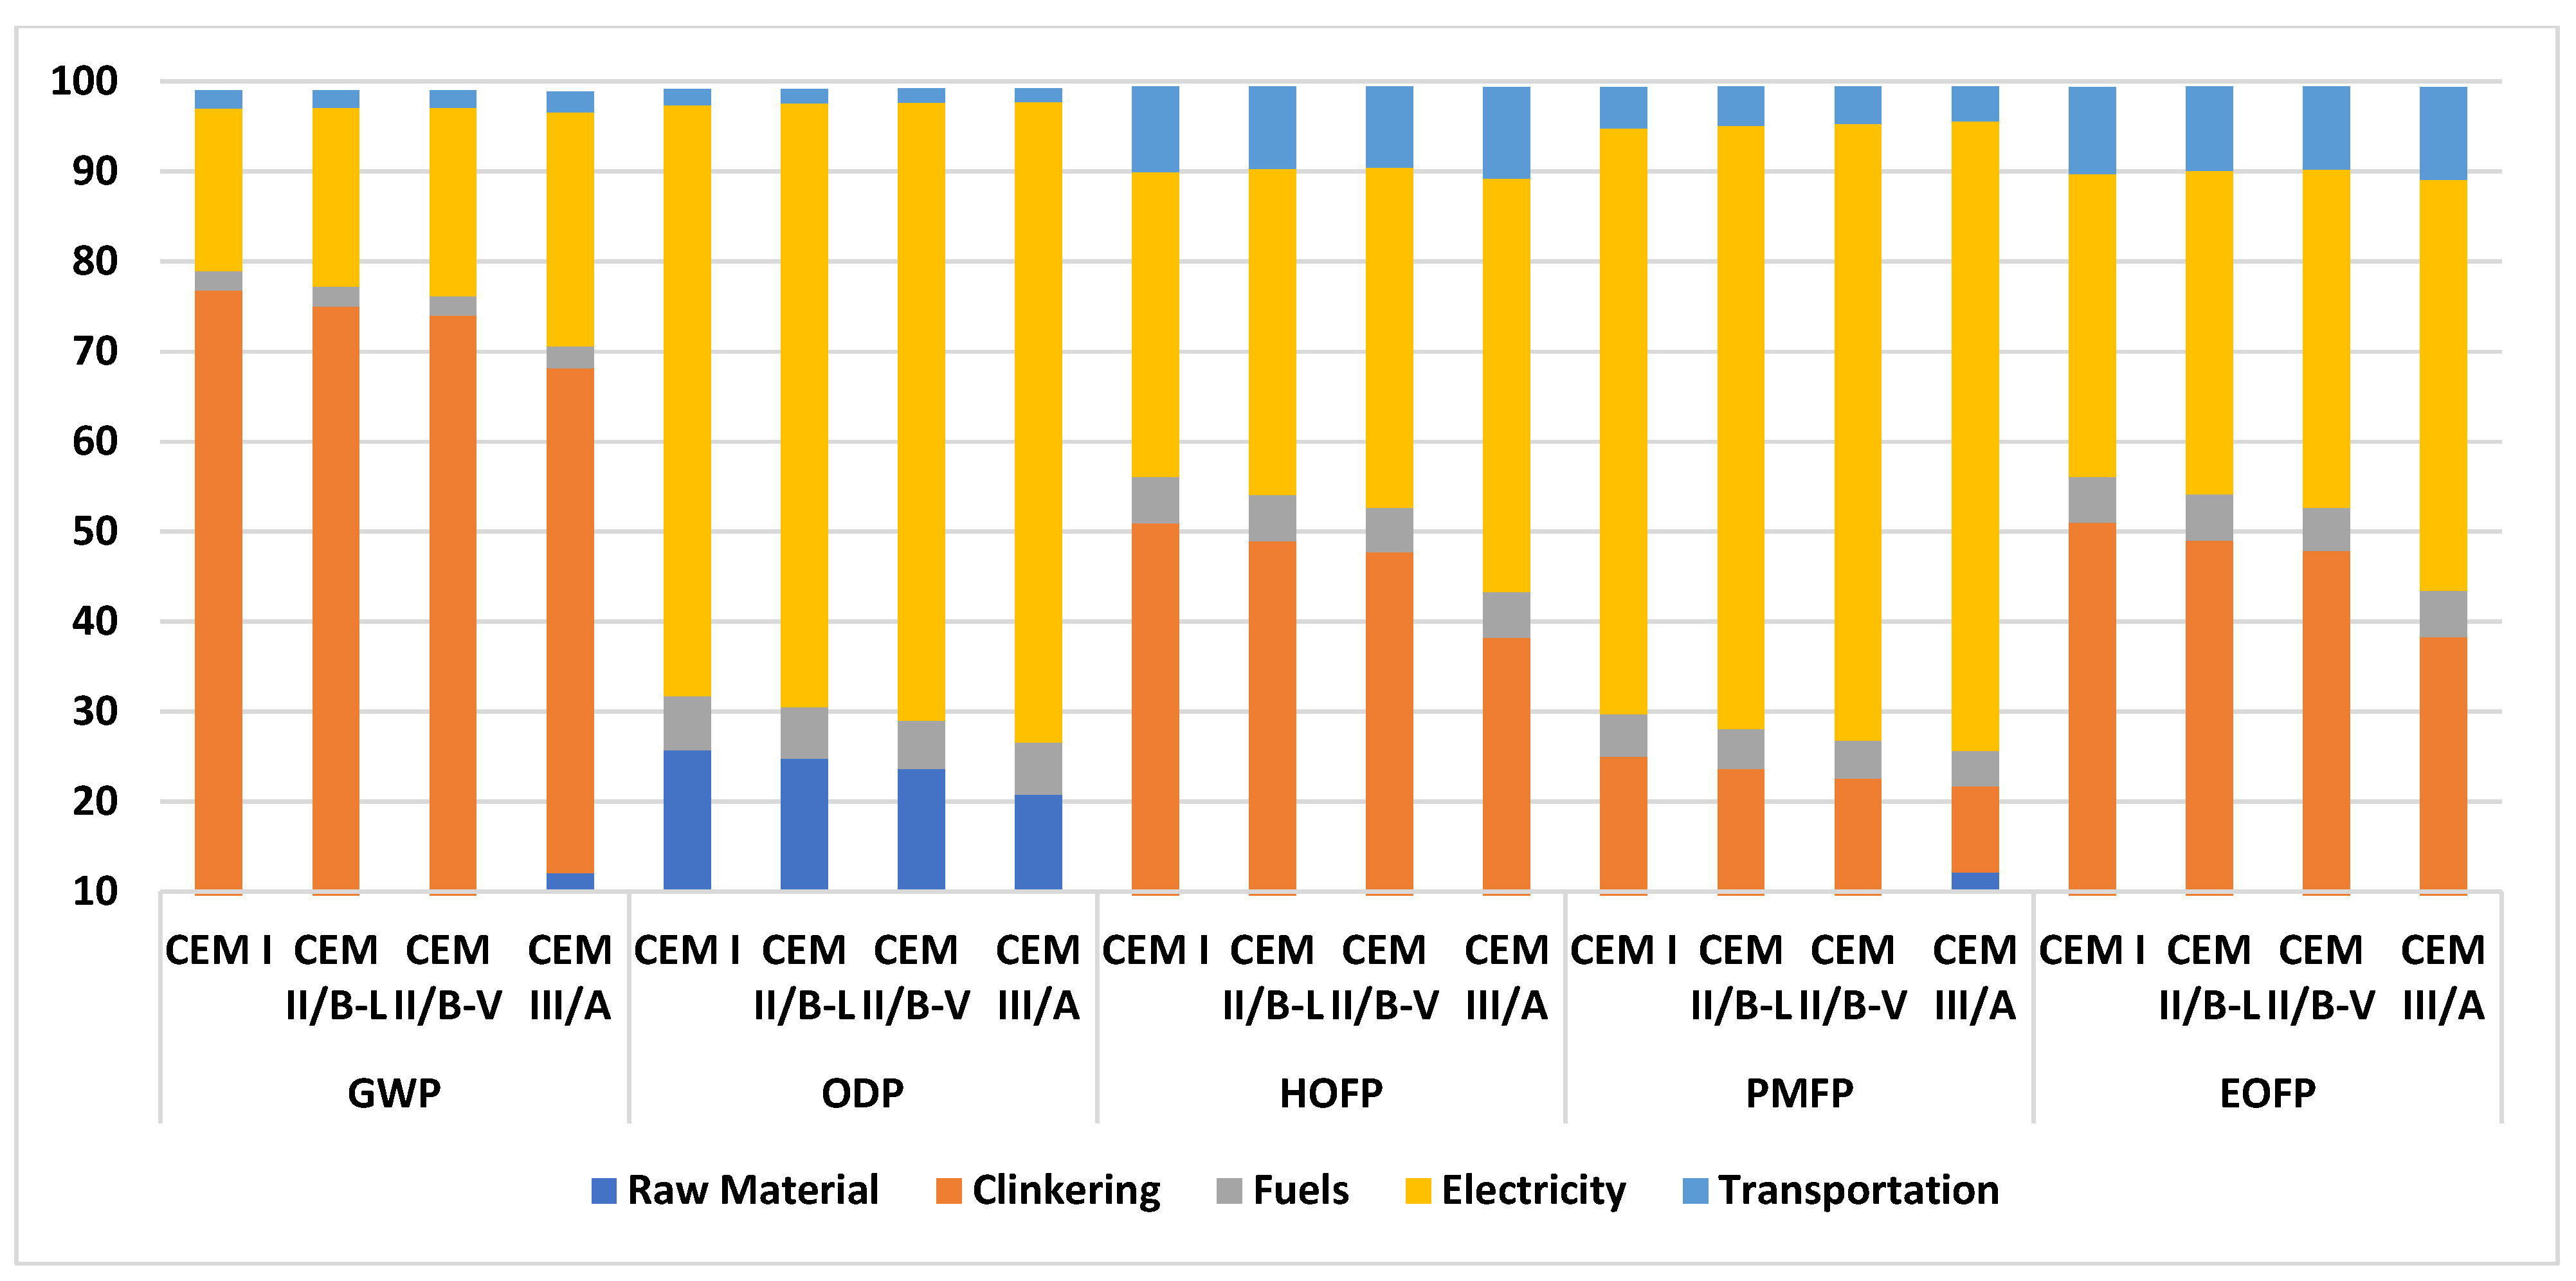
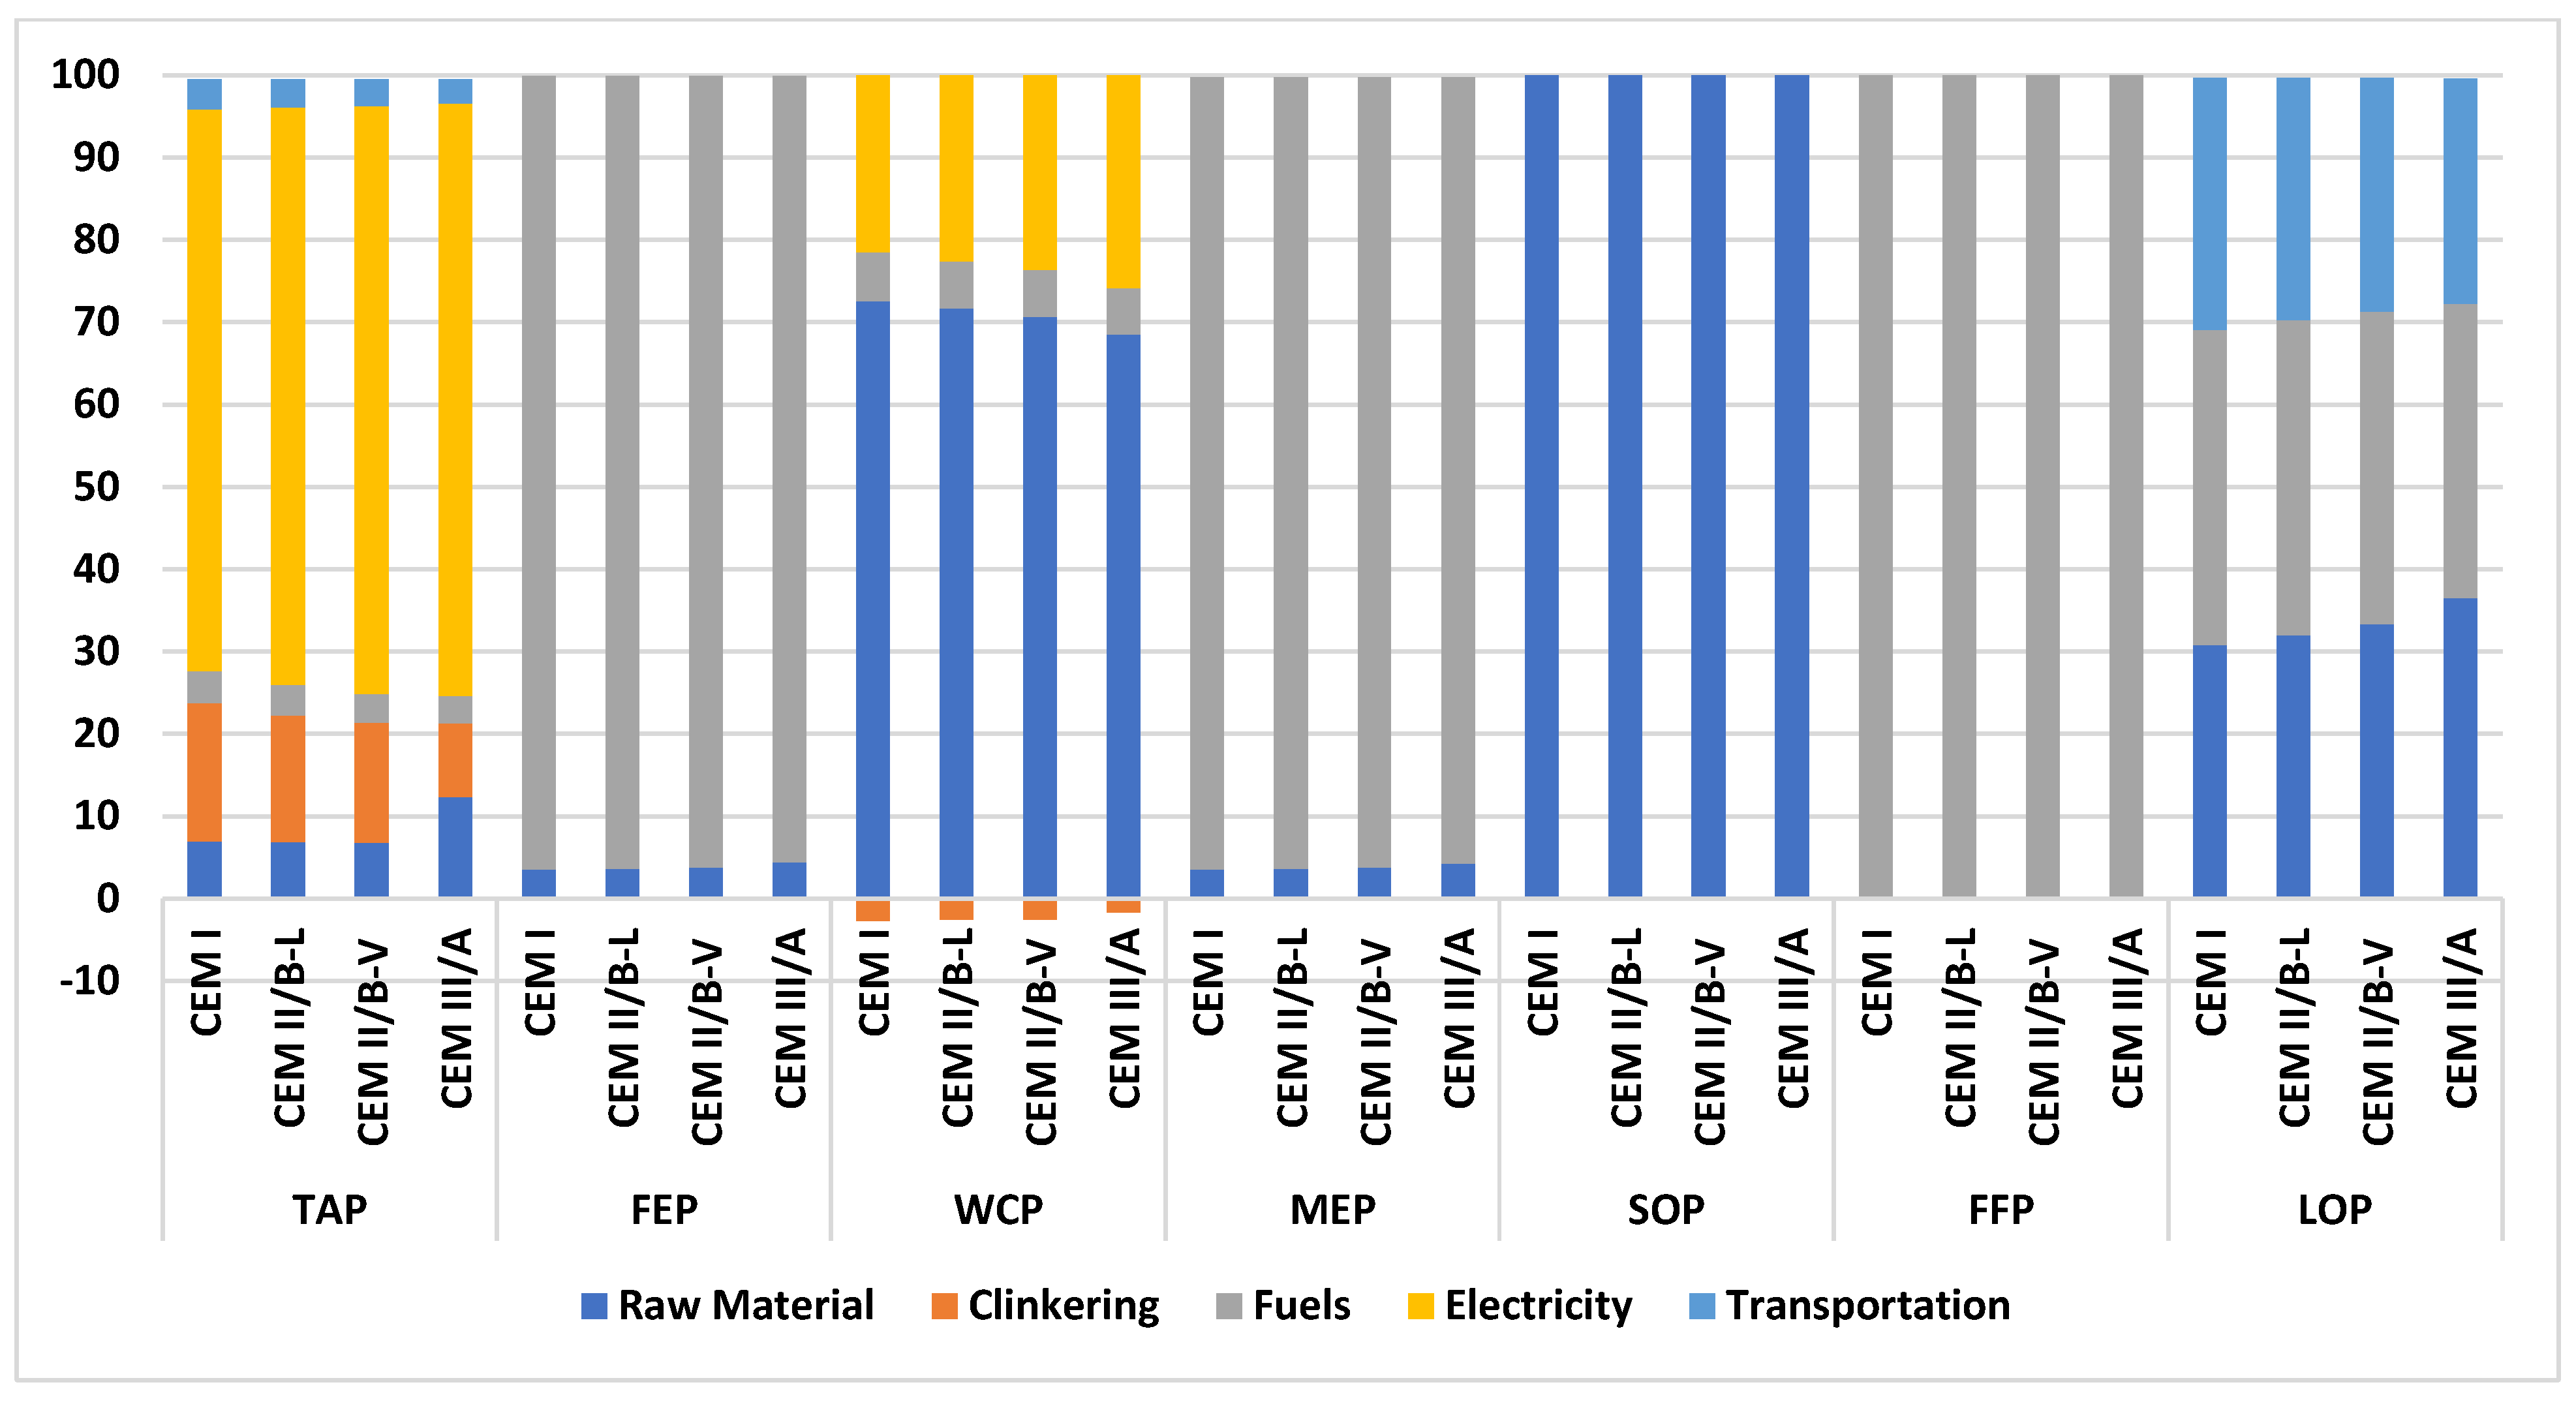
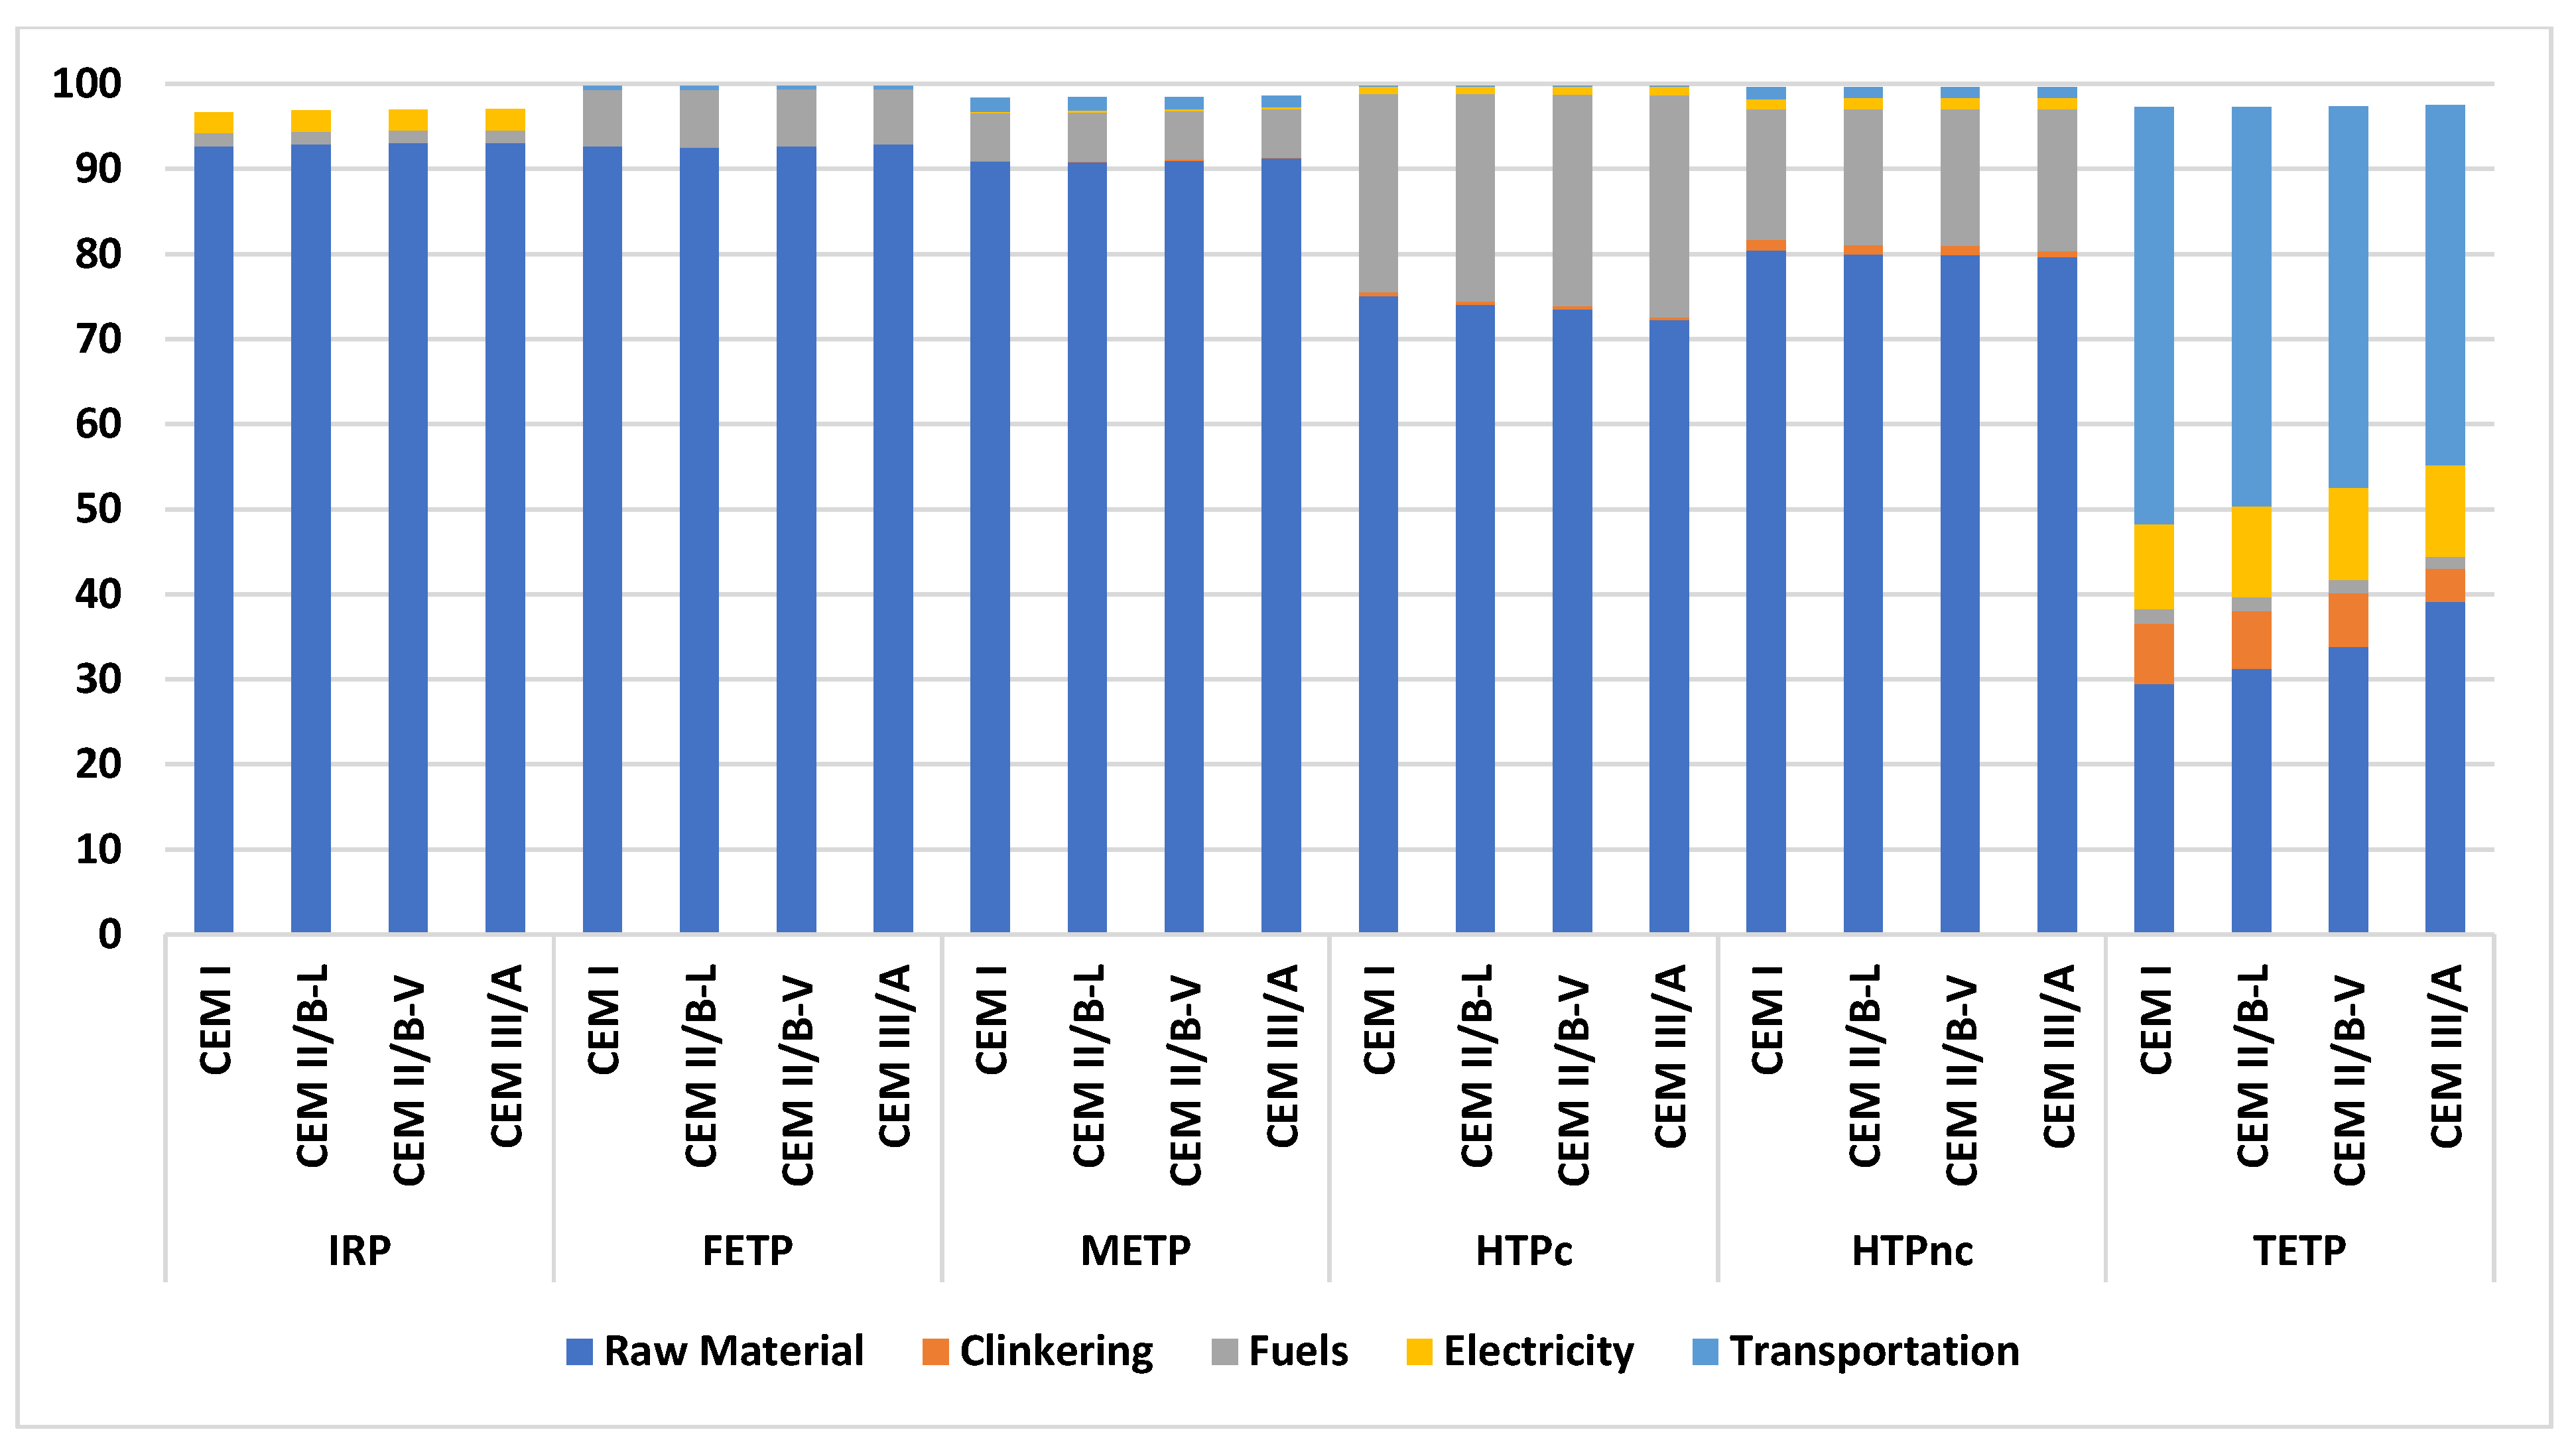
4.2. Contribution Analysis at the Midpoint

Figure 3 presents results for each impact category, but evaluating the different processes’ contributions to the final values is also essential. The LCIA results were divided into five production processes: clinkering, raw material, electricity usage, transportation, and fuel usage [67,93,103,108,110], which are comparatively studied and interpreted. The raw material process covers the extraction of limestone for clinker and cement production, including the inputs and outputs relevant to plant operation and control. Clinkering includes all emissions released directly by the kiln during clinker production. Fuel usage consists of the production of fuels used for thermal energy during cement and clinker production. The electricity stage includes electrical energy used to produce both clinker and cement. The transportation consists of the land transportation (via trucks and trains) of raw materials and fuels.
Figure 3. Contribution analysis results for atmospheric impacts at the midpoint.
Cleantechnol 05 00045 g003
The results show that the clinkering and electricity usage stages significantly contribute to atmospheric impact categories. The clinkering stage contributes the most to the GWP (76% in CEM I to 75% in CEM II/B-L, 73% in CEM II/B-V, and 56% in CEM III/A). As a result of the low clinker–cement ratio compared to CEM I, CEM II/B-L, CEM II/B-V, and CEM III/A have a low negative impact on the environment, according to our results. HOFP and EOFP have the same values (42% in CEM I to 40% in CEM II/B-L, 39% in CEM II/B-V, and 29% in CEM III/A). These values are expected, since clinker production is the most intensive and presents the highest atmospheric emissions. These results are similar to those from other studies in the literature [48,103,108,109,110], which determined that clinkering is the primary cause of GWP, HOFP, and EOFP in cement production. Electricity usage is the major contributor to the ODP (66% in CEM I to 67% in CEM II/B-L, 69% in CEM II/B-V, and 71% in CEM III/A) and PMFP (65% in CEM I to 67% in CEM II/B-L, 68% in CEM II/B-V, and 70% in CEM III/A). CEM III/A showed the highest values in both ODP and PMFP due to GGBFS substitution. As a result, cement production with GGBFS, to some extent, increases electricity usage while significantly improving the benefits of land resources and material savings, as well as reducing the environmental impact of cement. This study discovered that electricity usage is the major contributor to PMFP, similar to the study of Çankaya and Pekey [110] in Turkey, which is also linked to PMFP because South Africa and Turkey both depend on fossil fuels for electricity generation.
The impact contributions of resource depletion categories are more homogeneous. The results show that raw materials and fuel usage are the major contributors to resource depletion impact categories, as shown in Figure 4. This result was primarily due to the massive coal reserves in South Africa. Raw materials mainly contribute to SOP (100% in CEM I, CEM II/B-L, CEM II/B-V, and CEM III/A). This is in line with the other literature [109,110]. Raw materials also contribute to WCP (73% in CEM I to 72% in CEM II/B-L, 71% in CEM II/B-V, and 68% in CEM III/A) and LOP (31% in CEM I to 32% CEM II/B-L, 33% in CEM II/B-V, and 37% in CEM III/A). Fuel usage contributes most to FFP (100% in CEM II/B-L, CEM II/B-V, and CEM III/A), as well as MEP and FEP, which have the same values (96% in CEM I, CEM II/B-L, and CEM II/B-V, and 95% in CEM III/A), and LOP (38% in CEM I, CEM II/B-L, and CEM II/B-V, and 36% in CEM III/A). These results are similar to what was found in the other literature [109,110].
Fuel usage (38% in CEM I to 38% CEM II/B-L, 38% in CEM II/B-V, and 36% in CEM III/A), transportation (31% in CEM I to 29% CEM II/B-L, 28% in CEM II/B-V, and 27% in CEM III/A), and raw materials (31% in CEM I to 32% CEM II/B-L, 33% in CEM II/B-V, and 37% in CEM III/A) are the major contributors to LOP. Electricity is the highest contributor to TAP (68% in CEM I to 70% CEM II/B-L, 71% in CEM II/B-V, and 72% in CEM III/A) and the clinkering stage also contributes (17% in CEM I to 15% in CEM II/B-L and CEM II/B-V, and 9% in CEM III/A). In this study, raw materials and fuel usage are the main contributors to eutrophication impacts (FEP and MEP). This result is similar to those from studies in Brazil [109], Spain [103], and Southern Europe [48], which showed that clinkering and electricity usage significantly impact FEM and MEP.
The results show that raw materials contribute the most significantly regarding toxicity impact categories, as shown in Figure 5. Raw materials contribute 93% in CEM I, CEM II/B-L, CEM II/B-V, and CEM III/A to FETP and IRP; 91% in CEM I, CEM II/B-L, CEM II/B-V, and CEM III/A to METP; 80% in CEM I, CEM II/B-L, CEM II/B-V, and CEM III/A to HTPnc; and 75% in CEM to 74% in CEM II/B-L and CEM II/B-V, and 72% in CEM III/A to HTPc. However, transportation (49% in CEM I to 47% in CEM II/B-L, 45% in CEM II/B-V, and 42% in CEM III/A) and raw materials also contribute (30% in CEM I to 31% in CEM II/B-L, 34% in CEM II/B-V, and 39% in CEM III/A) to TETP. These results were attributable to the significantly high material usage and direct air emission. This study shows that the raw materials stage mainly contributes to TETP, METP, and FETP. This result is similar to those of studies in Turkey [110] and Brazil [109] regarding cement production. This study also shows that raw materials contribute to HTPc and HTPnc. This result aligns with a study by Palermo et al. [109], compared to the studies by Çankaya & Pekey [110] and García-Gusano et al. [103] that showed electricity usage contributes mainly to HTPc and HTPnc.
The GWP results of atmospheric impacts show a 14% reduction in CEM II/B-L, 29% in CEM II/B-V, and 35% in CEM III/A, compared to CEM I. This indicates that using SCMs (industrial by-products) as clinker substitutes significantly reduces the environmental impact per kg of cement finished products in South Africa. The impact of CEM III/A cement production, as measured by TAP, is lower than that of CEM I production, due to the higher GGBFS content used in Portland blast furnace slag-blended cement production. The size of GGBFS is smaller (1–2 mm) than clinker (10–40 mm). Furthermore, clinker has a poorer grindability than GBFS, so, theoretically, GBFS should have a lower acidification potential. Although using GGBFS may require additional efforts because of lower grindability and extra drying requirements, it still has a lower environmental impact than other by-products when used as a substitute for clinker. Overall, replacing clinker with GGBFS is still a beneficial practice.

5. Conclusions

This study assessed and compared the environmental impacts of different cement types in South African cement plants, using the LCA method. When comparing CEM I to the other three cement types, the GWP results of the atmospheric impacts show a reduction of 14% in CEM II/B-L, 29% in CEM II/B-V, and 35% in CEM III/A. More differences in process dominance characterize the resource depletion impacts.
The clinkering process was identified as the primary cause of atmospheric impacts, while resource depletion impacts were attributed to raw materials, fuels, and electricity processes, and toxicity impacts were primarily caused by raw materials. All analyzed categories showed lower environmental impacts in configurations characterized by lower clinker-to-cement ratios, namely CEM II/B-L, CEM II/B-V, and CEM III/A.
The characterization results show that the clinkering stage contributes the most to the GWP (76% in CEM I to 75% in CEM II/B-L, 73% in CEM II/B-V, and 56% in CEM III/A). This study indicates that the clinker content significantly impacts the studied system. According to the contribution analysis, the processes related to the clinkering stage contribute the most to atmospheric impacts, while raw materials-related processes contribute to the most toxicity impacts. The results indicate that the clinker content significantly impacts the studied system. Reducing the clinker content in cement production and replacing it with industrial by-products will reduce fuel-related CO2 emissions and calcination-related CO2.
This work improves the life cycle database for South Africa’s cement industry and allows for comparing the environmental impacts of different types of cement. The primary sources of GHGs in cement production include CO2 from raw material calcination and fossil CO2 from fuel burning. Substituting traditional raw materials with non-carbonate from CaO can reduce CO2 emissions during calcination. However, coprocessing alternative raw materials with higher carbon-based content may increase GHGs and carbon-based emissions. Coprocessing fossil and biogenic waste can reduce fuel-based CO2 emissions.
In conclusion, this study highlights the potential environmental benefits of using blended cement products over traditional Portland cement. The results show that using alternative materials, like GGBFS or fly ash, instead of clinker can significantly reduce the GHG emissions associated with cement production. Combining measures in clinker production and cement blending can offer the most significant savings in CO2 emissions and resource use. The results of this study provide valuable insights into the South African cement industry and can inform future efforts toward reducing the environmental impacts of cement production. Using the “cradle to gate” approach and SimaPro 9.1.1.1 software for LCA, as well as the ReCiPe 2016 v 1.04 midpoint method for impact assessment, provides a robust and reliable framework through which to assess the environmental impacts of cement production.

Author Contributions

Methodology, O.E.I. and O.A.O.; software, O.E.I. and O.A.O.; validation, O.E.I., writing—original draft preparation, O.E.I.; writing—review and editing, O.A.O.; supervision, O.A.O. All authors have read and agreed to the published version of the manuscript.

Funding

This research received no external funding.

Institutional Review Board Statement

Not applicable.

Informed Consent Statement

Not applicable.

Data Availability Statement

Not applicable.

Conflicts of Interest

The authors declare no conflict of interest.

References

  1. Valderrama, C.; Granados, R.; Cortina, J.L.; Gasol, C.M.; Guillem, M.; Josa, A. Implementation of best available techniques in cement manufacturing: A life-cycle assessment study. J. Clean. Prod. 2012, 25, 60–67. [Google Scholar] [CrossRef]
  2. Galvez-Martos, J.-L.; Schoenberger, H. An analysis of the use of life cycle assessment for waste co-incineration in cement kilns. Resour. Conserv. Recycl. 2014, 86, 118–131. [Google Scholar] [CrossRef]
  3. Ige, O.E.; Olanrewaju, O.A.; Duffy, K.J.; Collins, O.C. A review of the effectiveness of Life Cycle Assessment for gauging environmental impacts from cement production. J. Clean. Prod. 2021, 324, 129213. [Google Scholar] [CrossRef]
  4. Georgiopoulou, M.; Lyberatos, G. Life cycle assessment of the use of alternative fuels in cement kilns: A case study. J. Environ. Manag. 2018, 216, 224–234. [Google Scholar] [CrossRef]
  5. Schorcht, F.; Kourti, I.; Scalet, B.M.; Roudier, S.; Sancho, L.D. Best available techniques (BAT) reference document for the production of cement, lime and magnesium oxide. Eur. Comm. Jt. Res. Cent. Inst. Prospect. Technol. Stud. Luxemb. 2013, 506. [Google Scholar] [CrossRef]
  6. Mikulčić, H.; Klemeš, J.J.; Vujanović, M.; Urbaniec, K.; Duić, N. Reducing greenhouse gasses emissions by fostering the deployment of alternative raw materials and energy sources in the cleaner cement manufacturing process. J. Clean. Prod. 2016, 136, 119–132. [Google Scholar] [CrossRef]
  7. Andrew, R.M. Global CO2 emissions from cement production. Earth Syst. Sci. Data 2018, 10, 195–217. [Google Scholar] [CrossRef] [Green Version]
  8. Benhelal, E.; Zahedi, G.; Shamsaei, E.; Bahadori, A. Global strategies and potentials to curb CO2 emissions in cement industry. J. Clean. Prod. 2013, 51, 142–161. [Google Scholar] [CrossRef]
  9. Jakobsen, J.; Roussanaly, S.; Anantharaman, R. A techno-economic case study of CO2 capture, transport and storage chain from a cement plant in Norway. J. Clean. Prod. 2017, 144, 523–539. [Google Scholar] [CrossRef] [Green Version]
  10. Jordal, K.; Voldsund, M.; Størset, S.; Fleiger, K.; Ruppert, J.; Spörl, R.; Hornberger, M.; Cinti, G. CEMCAP–making CO2 capture retrofittable to cement plants. Energy Procedia 2017, 114, 6175–6180. [Google Scholar] [CrossRef]
  11. Scrivener, K.L.; Kirkpatrick, R.J. Innovation in use and research on cementitious material. Cem. Concr. Res. 2008, 38, 128–136. [Google Scholar] [CrossRef]
  12. Feiz, R.; Ammenberg, J.; Baas, L.; Eklund, M.; Helgstrand, A.; Marshall, R. Improving the CO2 performance of cement, part III: The relevance of industrial symbiosis and how to measure its impact. J. Clean. Prod. 2015, 98, 145–155. [Google Scholar]
  13. Usón, A.A.; Ferreira, G.; López-Sabirón, A.M.; Sastresa, E.L.; De Guinoa, A.S. Characterisation and environmental analysis of sewage sludge as secondary fuel for cement manufacturing. Chem. Eng. Trans. 2012, 29, 457–462. [Google Scholar]
  14. Zeman, F. Oxygen combustion in cement production. Energy Procedia 2009, 1, 187–194. [Google Scholar] [CrossRef] [Green Version]
  15. Crossin, E. The greenhouse gas implications of using ground granulated blast furnace slag as a cement substitute. J. Clean. Prod. 2015, 95, 101–108. [Google Scholar] [CrossRef]
  16. Gao, T.; Shen, L.; Shen, M.; Chen, F.; Liu, L.; Gao, L. Analysis on differences of carbon dioxide emission from cement production and their major determinants. J. Clean. Prod. 2015, 103, 160–170. [Google Scholar] [CrossRef]
  17. Malhotra, V. Global warming, and role of supplementary cementing materials and superplasticisers in reducing greenhouse gas emissions from the manufacturing of portland cement. Int. J. Struct. Eng. 2010, 1, 116–130. [Google Scholar] [CrossRef]
  18. Arp, R.; Bole-Rentel, T.; Jakuja, N. Greenhouse Gas Emissions Reduction Options for the South African Cement Sector; WWF Technical Report; Emerging Climate Smart Business Opportunities; WWF: Gland, Switzerland; Pretoria, South Africa, 2018; Available online: http://awsassets.wwf.org.za/downloads/wwf_2018_ghg_reduction_options_for_sa_cement_sector.pdf (accessed on 2 May 2022).
  19. Müller, N.; Harnisch, J.; Mesguen, J. How to Turn Around the Trend of Cement Related Emissions in the Developing World; WWF—Lafarge Conservation Partnership: Gland, Switzerland, 2008. [Google Scholar]
  20. Kunche, A.; Mielczarek, B. Application of System Dynamic Modelling for Evaluation of Carbon Mitigation Strategies in Cement Industries: A Comparative Overview of the Current State of the Art. Energies 2021, 14, 1464. [Google Scholar] [CrossRef]
  21. Pitak, I.; Rinkevičius, D.; Kalpokaitė-Dičkuvienė, R.; Baltušnikas, A.; Denafas, G. The strategy for conservation non-renewable natural resources through producing and application solid recovery fuel in the cement industry: A case study for Lithuania. Environ. Sci. Pollut. Res. 2022, 29, 69618–69634. [Google Scholar] [CrossRef]
  22. Gartner, E.; Hirao, H. A review of alternative approaches to the reduction of CO2 emissions associated with the manufacture of the binder phase in concrete. Cem. Concr. Res. 2015, 78, 126–142. [Google Scholar] [CrossRef] [Green Version]
  23. Gartner, E. Industrially interesting approaches to “low-CO2” cements. Cem. Concr. Res. 2004, 34, 1489–1498. [Google Scholar] [CrossRef]
  24. Scrivener, K.L. Options for the future of cement. Indian Concr. J 2014, 88, 11–21. [Google Scholar]
  25. Shekhovtsova, J. Using South African Fly Ash as a Component of Alkali-Activated Binder. Ph.D. Thesis, University of Pretoria, Pretoria, South Africa, 2015. [Google Scholar]
  26. Porritt, J. The Concrete Industry Sustainability Performance Report; First Report; The Concrete Centre (Mineral Products Association): Camberley, UK, 2009; Available online: https://www.concretecentre.com/TCC/media/TCCMediaLibrary/Products/MB_First_Concrete_Performance_Report_Mar09.pdf (accessed on 23 February 2023).
  27. Chen, C.; Habert, G.; Bouzidi, Y.; Jullien, A.; Ventura, A. LCA allocation procedure used as an incitative method for waste recycling: An application to mineral additions in concrete. Resour. Conserv. Recycl. 2010, 54, 1231–1240. [Google Scholar] [CrossRef] [Green Version]
  28. Van den Heede, P.; De Belie, N. Environmental impact and life cycle assessment (LCA) of traditional and ‘green’concretes: Literature review and theoretical calculations. Cem. Concr. Compos. 2012, 34, 431–442. [Google Scholar] [CrossRef]
  29. Huntzinger, D.N.; Eatmon, T.D. A life-cycle assessment of Portland cement manufacturing: Comparing the traditional process with alternative technologies. J. Clean. Prod. 2009, 17, 668–675. [Google Scholar] [CrossRef]
  30. McLellan, B.C.; Williams, R.P.; Lay, J.; Van Riessen, A.; Corder, G.D. Costs and carbon emissions for geopolymer pastes in comparison to ordinary portland cement. J. Clean. Prod. 2011, 19, 1080–1090. [Google Scholar] [CrossRef] [Green Version]
  31. David, J.; Flower, M.; Sanjayan, J.G. Green house gas emissions due to concrete manufacture. Int. J. Life Cycle Assess. 2007, 12, 282. [Google Scholar]
  32. Yi, H.; Xu, G.; Cheng, H.; Wang, J.; Wan, Y.; Chen, H. An overview of utilization of steel slag. Procedia Environ. Sci. 2012, 16, 791–801. [Google Scholar] [CrossRef] [Green Version]
  33. Lee, K.-M.; Park, P.-J. Estimation of the environmental credit for the recycling of granulated blast furnace slag based on LCA. Resour. Conserv. Recycl. 2005, 44, 139–151. [Google Scholar] [CrossRef]
  34. Silva, M.G.d.; Saade, M.R.M.; Gomes, V. Influence of service life, strength and cement type on life cycle environmental performance of concrete. Rev. IBRACON De Estrut. E Mater. 2013, 6, 844–853. [Google Scholar] [CrossRef] [Green Version]
  35. Saade, M.R.M.; da Silva, M.G.; Gomes, V. Appropriateness of environmental impact distribution methods to model blast furnace slag recycling in cement making. Resour. Conserv. Recycl. 2015, 99, 40–47. [Google Scholar] [CrossRef]
  36. Halbiniak, J.; Katzer, J.; Major, M.; Major, I. A proposition of an in situ production of a blended cement. Materials 2020, 13, 2289. [Google Scholar] [CrossRef]
  37. Bignozzi, M. The use of industrial waste for the production of new blended cement. In Waste Management: Research Advances to Convert Waste Wealth; Nova Science Publishers Inc.: Hauppauge, NY, USA, 2010; pp. 191–201. [Google Scholar]
  38. Malhotra, V.; Hammings, R. Blended cements in North America—A review. Cem. Concr. Compos. 1995, 17, 23–35. [Google Scholar] [CrossRef]
  39. South pole ice movement. Earth-Sci. Rev. 1976, 12, 91–92. [CrossRef]
  40. SouthAfricaGHGinventory. Draft 8th National GHG Inventory Report South Africa 2000–2017; Department of environment, Forestry and Fisheries: Pretoria, South Africa, 2022. Available online: https://www.dffe.gov.za/sites/default/files/gazetted_notices/8thnational-greenhouse-gasinventory-reportg47133gon2321.pdf (accessed on 17 February 2023).
  41. Ntuli, M.; Dioha, M.; Ewim, D.; Eloka-Eboka, A. Review of energy modelling, energy efficiency models improvement and carbon dioxide emissions mitigation options for the cement industry in South Africa. Mater. Today Proc. 2022, 65, 2260–2268. [Google Scholar] [CrossRef]
  42. Ige, O.E.; Duffy, K.J.; Olanrewaju, O.A.; Collins, O.C. An Integrated System Dynamics Model and Life Cycle Assessment for Cement Production in South Africa. Atmosphere 2022, 13, 1788. Available online: https://www.mdpi.com/2073-4433/13/11/1788 (accessed on 12 June 2022). [CrossRef]
  43. Ige, O.E. Energy Efficiency in the South African Cement Finishing Plant: Drivers, Barriers And Improvement. Ph.D. Thesis, University of KwaZulu-Natal, Durban, South Africa, 2018. [Google Scholar]
  44. Ige, O.E.; Inambao, F.L.; Olanrewaju, O.A.; Duffy, K.J.; Collins, O.C. Drivers and Barriers to Industrial Energy Efficiency: A Case Study of South Africa’s Cement Finishing Mill Plant (Advances in Energy Research); Acosta, M.J., Ed.; Nova Science Publishers: Hauppauge, NY, USA, 2020; Volume 33, p. 45. [Google Scholar]
  45. Agency, E.E. EMEP/EEA Air Pollutant Emission Inventory Guidebook 2016: Technical guidance to prepare national emission inventories. EEA-Rep. 2016, 21. [Google Scholar]
  46. Bekun, F.V.; Emir, F.; Sarkodie, S.A. Another look at the relationship between energy consumption, carbon dioxide emissions, and economic growth in South Africa. Sci. Total Environ. 2019, 655, 759–765. [Google Scholar] [CrossRef]
  47. Petek Gursel, A.; Masanet, E.; Horvath, A.; Stadel, A. Life-cycle inventory analysis of concrete production: A critical review. Cem. Concr. Compos. 2014, 51, 38–48. [Google Scholar] [CrossRef]
  48. Stafford, F.N.; Dias, A.C.; Arroja, L.; Labrincha, J.A.; Hotza, D. Life cycle assessment of the production of Portland cement: A Southern Europe case study. J. Clean. Prod. 2016, 126, 159–165. [Google Scholar] [CrossRef]
  49. Hasanbeigi, A.; Lu, H.; Williams, C.; Price, L. International Best Practices for Pre-Processing and Co-Processing Municipal Solid Waste and Sewage Sludge in the Cement Industry; Ernest Orlando Lawrence Berkeley National Laboratory: Berkeley, CA, USA, 2012. [Google Scholar]
  50. Beltran, L.; Arnesh, T. Uses of Alternative Fuels as Best Practices to Reduce CO2 Emissions from the South African Cement Industry. In Proceedings of the International Conference on Industrial Engineering and Operations Management, Pretoria/Johannesburg, South Africa, 29 October–1 November 2018. [Google Scholar]
  51. Madlool, N.; Saidur, R.; Hossain, M.; Rahim, N. A critical review on energy use and savings in the cement industries. Renew. Sustain. Energy Rev. 2011, 15, 2042–2060. [Google Scholar] [CrossRef]
  52. Tsiliyannis, C.A. Industrial Wastes and By-products as Alternative Fuels in Cement Plants: Evaluation of an Industrial Symbiosis Option. J. Ind. Ecol. 2018, 22, 1170–1188. [Google Scholar] [CrossRef]
  53. Hossain, M.U.; Poon, C.S.; Wong, M.Y.K.; Khine, A. Techno-environmental feasibility of wood waste derived fuel for cement production. J. Clean. Prod. 2019, 230, 663–671. [Google Scholar] [CrossRef]
  54. Hossain, M.U.; Poon, C.S.; Lo, I.M.; Cheng, J.C. Comparative LCA on using waste materials in the cement industry: A Hong Kong case study. Resour. Conserv. Recycl. 2017, 120, 199–208. [Google Scholar] [CrossRef]
  55. Zhang, L.; Mabee, W.E. Comparative study on the life-cycle greenhouse gas emissions of the utilization of potential low carbon fuels for the cement industry. J. Clean. Prod. 2016, 122, 102–112. [Google Scholar] [CrossRef]
  56. Junginger, H. Biomass Use in the Dutch Cement Industry ENCI, Maastricht, The Netherlands. 2009. Available online: https://dspace.library.uu.nl/handle/1874/43939 (accessed on 23 February 2023).
  57. Vorayos, N.; Vorayos, N.; Jaitiang, T. Energy-environmental performance of Thai’s cement industry. Energy Rep. 2020, 6, 460–466. [Google Scholar] [CrossRef]
  58. Kusuma, R.T.; Hiremath, R.B.; Rajesh, P.; Kumar, B.; Renukappa, S. Sustainable transition towards biomass-based cement industry: A review. Renew. Sustain. Energy Rev. 2022, 163, 112503. [Google Scholar] [CrossRef]
  59. Papanikola, K.; Papadopoulou, K.; Tsiliyannis, C.; Fotinopoulou, I.; Katsiampoulas, A.; Chalarakis, E.; Georgiopoulou, M.; Rontogianni, V.; Michalopoulos, I.; Mathioudakis, D. Food residue biomass product as an alternative fuel for the cement industry. Environ. Sci. Pollut. Res. 2019, 26, 35555–35564. [Google Scholar] [CrossRef]
  60. Schneider, M.; Romer, M.; Tschudin, M.; Bolio, H. Sustainable cement production—Present and future. Cem. Concr. Res. 2011, 41, 642–650. [Google Scholar] [CrossRef]
  61. Loijos, A.; Santero, N.; Ochsendorf, J. Life cycle climate impacts of the US concrete pavement network. Resour. Conserv. Recycl. 2013, 72, 76–83. [Google Scholar] [CrossRef]
  62. Castañón, A.; García-Granda, S.; Guerrero, A.; Lorenzo, M.; Angulo, S. Energy and environmental savings via optimisation of the production process at a Spanish cement factory. J. Clean. Prod. 2015, 98, 47–52. [Google Scholar] [CrossRef]
  63. Feiz, R.; Ammenberg, J.; Baas, L.; Eklund, M.; Helgstrand, A.; Marshall, R. Utilizing LCA and key performance indicators to assess development within the cement industry: A case study of a cement production cluster in Germany. In Proceedings of the Greening of Industry Network Conference (GIN 2012), Linköping, Sweden, 21–24 October 2012. [Google Scholar]
  64. Feiz, R.; Ammenberg, J.; Baas, L.; Eklund, M.; Helgstrand, A.; Marshall, R. Improving the CO2 performance of cement, part I: Utilizing life-cycle assessment and key performance indicators to assess development within the cement industry. J. Clean. Prod. 2015, 98, 272–281. [Google Scholar] [CrossRef] [Green Version]
  65. García-Gusano, D.; Garraín, D.; Herrera, I.; Cabal, H.; Lechón, Y. Life Cycle Assessment of applying CO2 post-combustion capture to the Spanish cement production. J. Clean. Prod. 2015, 104, 328–338. [Google Scholar] [CrossRef]
  66. Meshram, R.; Kumar, S. Comparative life cycle assessment (LCA) of geopolymer cement manufacturing with Portland cement in Indian context. Int. J. Environ. Sci. Technol. 2022, 19, 4791–4802. [Google Scholar] [CrossRef]
  67. Ige, O.E.; Olanrewaju, O.A.; Duffy, K.J.; Collins, O.C. Environmental Impact Analysis of Portland Cement (CEM1) Using the Midpoint Method. Energies 2022, 15, 2708. [Google Scholar] [CrossRef]
  68. Hugo, J.; Barker, A.; Stoffberg, H. The carbon footprint and embodied energy of construction material: A comparative analysis of South African BRT stations. Acta Structilia 2014, 21, 45–78. [Google Scholar]
  69. Olagunju, B.D. Life Cycle Assessment of the Production Of Cement: A South African Case Study. Ph.D. Thesis, Durban Universirty of Technology, Durban, South Africa, 2021. [Google Scholar]
  70. Boughrara, S.; Chedri, M.; Louhab, K. Evaluation of environmental impact of cement production in Algeria using life cycle assessment. Int. Lett. Chem. Phys. Astron. 2015, 45, 79–84. [Google Scholar] [CrossRef]
  71. Brown, D.; Sadiq, R.; Hewage, K. An overview of air emission intensities and environmental performance of grey cement manufacturing in Canada. Clean Technol. Environ. Policy 2014, 16, 1119–1131. [Google Scholar] [CrossRef]
  72. Kawai, K.; Osako, M. Reduction of natural resource consumption in cement production in Japan by waste utilization. J. Mater. Cycles Waste Manag. 2012, 14, 94–101. [Google Scholar] [CrossRef]
  73. Kurokawa, D.; Nakaguchi, A.; Hirano, Y.; Iida, T.; Mori, T.; Matsuzawa, K.; Sakai, E. Effects of a composition change of ordinary Portland cement on waste utilization and CO2 emissions in Japan. J. Mater. Cycles Waste Manag. 2021, 23, 1270–1275. [Google Scholar] [CrossRef]
  74. Taruya, T.; Okuno, N.; Kanaya, K. Reuse of sewage sludge as raw material of Portland cement in Japan. Water Sci. Technol. 2002, 46, 255–258. [Google Scholar] [CrossRef] [Green Version]
  75. Li, C.; Cui, S.; Nie, Z.; Gong, X.; Wang, Z.; Itsubo, N. The LCA of Portland cement production in China. Int. J. Life Cycle Assess. 2015, 20, 117–127. [Google Scholar] [CrossRef]
  76. Yang, D.; Fan, L.; Shi, F.; Liu, Q.; Wang, Y. Comparative study of cement manufacturing with different strength grades using the coupled LCA and partial LCC methods—A case study in China. Resour. Conserv. Recycl. 2017, 119, 60–68. [Google Scholar] [CrossRef]
  77. Chen, W.; Hong, J.; Xu, C. Pollutants generated by cement production in China, their impacts, and the potential for environmental improvement. J. Clean. Prod. 2015, 103, 61–69. [Google Scholar] [CrossRef]
  78. Hong, J.; Li, X. Environmental assessment of sewage sludge as secondary raw material in cement production—A case study in China. Waste Manag. 2011, 31, 1364–1371. [Google Scholar] [CrossRef]
  79. Li, C.; Nie, Z.; Cui, S.; Gong, X.; Wang, Z.; Meng, X. The life cycle inventory study of cement manufacture in China. J. Clean. Prod. 2014, 72, 204–211. [Google Scholar] [CrossRef]
  80. Li, Y.; Liu, Y.; Gong, X.; Nie, Z.; Cui, S.; Wang, Z.; Chen, W. Environmental impact analysis of blast furnace slag applied to ordinary Portland cement production. J. Clean. Prod. 2016, 120, 221–230. [Google Scholar] [CrossRef]
  81. Pushkar, S.; Verbitsky, O. Effects of different allocation approaches for modeling mineral additives in blended cements on environmental damage from five concrete mixtures in Israel. Mater. Struct. 2016, 49, 4401–4415. [Google Scholar] [CrossRef]
  82. Huang, T.; Chiueh, P.; Lo, S. Life-cycle environmental and cost impacts of reusing fly ash. Resour. Conserv. Recycl. 2017, 123, 255–260. [Google Scholar] [CrossRef]
  83. Habert, G.; Bouzidi, Y.; Chen, C.; Jullien, A. Development of a depletion indicator for natural resources used in concrete. Resour. Conserv. Recycl. 2010, 54, 364–376. [Google Scholar] [CrossRef]
  84. Gäbel, K.; Tillman, A.-M. Simulating operational alternatives for future cement production. J. Clean. Prod. 2005, 13, 1246–1257. [Google Scholar] [CrossRef] [Green Version]
  85. Hossain, M.U.; Poon, C.S.; Lo, I.M.; Cheng, J.C. Evaluation of environmental friendliness of concrete paving eco-blocks using LCA approach. Int. J. Life Cycle Assess. 2016, 21, 70–84. [Google Scholar] [CrossRef]
  86. Song, X.; Yang, J.; Liu, J. Environmental Benefits Assessment of Blast FurnaceSlagRecyclingforGreenBuildingMaterialsBasedonLCA. China Popul. Resour. Environ. 2012, 22, 51. [Google Scholar]
  87. Shen, W.; Cai, Z.; Liu, Z. Humble talk about low carbon dioxide emission technique for cement-concrete industry. Cem. Guide N. Epoch 2008, 14, 1–6. [Google Scholar]
  88. ISO/TS,14071:2014; ISO/TS. Environmental Management—Life Cycle Assessment—Critical Review Processes And Reviewer Competencies: Additional Requirements and Guidelines to ISO 14044:2006. International Organization for Standardization: Geneva, Switzerland,, 2014. Available online: https://www.iso.org/obp/ui/#iso:std:iso:ts:14071:ed-1:v1:en (accessed on 23 February 2023).
  89. ISO/TS,14072:2014; ISO/TS. Environmental Management—Life Cycle Assessment—Requirements and Guidelines for Organizational Life Cycle Assessment. International Organization for Standardization—ISO: Geneva, Switzerland,, 2014. Available online: https://www.iso.org/obp/ui/#iso:std:iso:ts:14072:ed-1:v1:en (accessed on 23 February 2023).
  90. ISO. 14044: International Organization for Standardization. In Environmental Management: Environmental Management: Life Cycle Assessment; Requirements and guidelines; International Organization for Standardization—ISO: Geneva, Switzerland, 2006; Available online: https://www.iso.org/obp/ui/#iso:std:iso:14044:ed-1:v1:en (accessed on 12 June 2022).
  91. ISO. 14040: International organization for standardization. In Environmental Management: Life Cycle Assessment; Principles and Framework; International Organization for Standardization—ISO: Geneva, Switzerland, 2006; Available online: https://www.iso.org/obp/ui/#iso:std:iso:14040:ed-2:v1:en (accessed on 12 June 2022).
  92. Moreno Ruiz, E.; Valsasina, L.; FitzGerald, D.; Symeonidis, A.; Turner, D.; Müller, J.; Minas, N.; Bourgault, G.; Vadenbo, C.; Ioannidou, D. Documentation of Changes Implemented in Ecoinvent Database v3. 7 & v3. 7.1; Ecoinvent Association: Zürich, Switzerland, 2020. [Google Scholar]
  93. Stafford, F.N.; Raupp-Pereira, F.; Labrincha, J.A.; Hotza, D. Life cycle assessment of the production of cement: A Brazilian case study. J. Clean. Prod. 2016, 137, 1293–1299. [Google Scholar] [CrossRef]
  94. Muigai, R. Portland Cement CEM I: Ecoinvent Database 3.8 Documentation Cement Production, Portland—ZA, Ecoinvent Association, Allocation, Cut-Off Ed. Identifying Improvement Potentials in Cement Production with Life Cycle Assessment, 2021; Ecoinvent Association: Zürich, Switzerland, 2021; Available online: https://v38.ecoquery.ecoinvent.org/Details/UPR/241bb8d5-a2f1-4f1c-81e3-a9b4b4d2ab54/290c1f85-4cc4-4fa1-b0c8-2cb7f4276dce (accessed on 23 February 2023).
  95. Muigai, R. Portland Limestone Cement CEM II B-L, Ecoinvent Database Ecoinvent 3.8 Dataset Documentation Cement Production, Limestone 21–35%ZA, Ecoinvent Association, Allocation, Cut-Off ed. Identifying Improvement Potentials in Cement Production with Life Cycle Assessment 2021; Ecoinvent Association: Zürich, Switzerland, 2021; Available online: https://v38.ecoquery.ecoinvent.org/Details/UPR/9ac1eb4e-9058-480a-9674-5dec33831cde/290c1f85-4cc4-4fa1-b0c8-2cb7f4276dce (accessed on 23 February 2023).
  96. Muigai, R. CEM II B-V Portland Fly Ash Cement, Ecoinvent Database Ecoinvent 3.8 Dataset Documentation Cement Production, Cement Production, Fly Ash 21–35%—ZA, Ecoinvent Association, Allocation, Cut-Off Ed. Identifying Improvement Potentials in Cement Production with Life Cycle Assessment 2021; Ecoinvent Association: Zürich, Switzerland, 2021; Available online: https://v38.ecoquery.ecoinvent.org/Details/UPR/38bc268a-5180-4cc7-aeee-1f975139bf26/290c1f85-4cc4-4fa1-b0c8-2cb7f4276dce (accessed on 23 February 2023).
  97. Muigai, R. CEM III A Blast Furnace Slag Cement, Ecoinvent Database Ecoinvent 3.8 Dataset Documentation Cement Production, Blast Furnace Slag 36–65%—ZA, Ecoinvent Association, Allocation, Cut-Off Ed. Identifying Improvement Potentials in Cement Production with Life Cycle Assessment 2021, Ecoinvent, Ed.; Ecoinvent Association: Zürich, Switzerland, 2021; Available online: https://v38.ecoquery.ecoinvent.org/Details/UPR/69c3f6e0-b349-4b17-b681-004fcfbc5518/290c1f85-4cc4-4fa1-b0c8-2cb7f4276dce (accessed on 23 February 2023).
  98. Čuček, L.; Klemeš, J.J.; Kravanja, Z. A review of footprint analysis tools for monitoring impacts on sustainability. J. Clean. Prod. 2012, 34, 9–20. [Google Scholar] [CrossRef]
  99. Goedkoop, M.; Heijungs, R.; De Schryver, A.; Struijs, J.; van Zelm, R. ReCiPe 2008. A LCIA method which comprises harmonised category indicators at the midpoint and the endpoint level. In Characterisation: Updated RIVM Report; RIVM: Bilthoven, The Netherlands, 2013. [Google Scholar]
  100. Bare, J.C. Life cycle impact assessment research developments and needs. Clean Technol. Environ. Policy 2010, 12, 341–351. [Google Scholar] [CrossRef]
  101. Huijbregts, M.A.; Steinmann, Z.J.; Elshout, P.M.; Stam, G.; Verones, F.; Vieira, M.; Zijp, M.; Hollander, A.; Van Zelm, R. ReCiPe2016: A harmonised life cycle impact assessment method at midpoint and endpoint level. Int. J. Life Cycle Assess. 2017, 22, 138–147. [Google Scholar] [CrossRef]
  102. Bushi, L.; Meil, J. An Environmental Life Cycle Assessment of Portland-Limestone and Ordinary Portland Cements in Concrete; Cement Association of Canada: Ottawa, ON, Canada, 2014; p. 10. [Google Scholar]
  103. García-Gusano, D.; Herrera, I.; Garraín, D.; Lechón, Y.; Cabal, H. Life cycle assessment of the Spanish cement industry: Implementation of environmental-friendly solutions. Clean Technol. Environ. Policy 2015, 17, 59–73. [Google Scholar] [CrossRef]
  104. Güereca, L.P.; Torres, N.; Juárez-López, C.R. The co-processing of municipal waste in a cement kiln in Mexico: A life-cycle assessment approach. J. Clean. Prod. 2015, 107, 741–748. [Google Scholar] [CrossRef]
  105. Moretti, L.; Caro, S. Critical analysis of the life cycle assessment of the Italian cement industry. J. Clean. Prod. 2017, 152, 198–210. [Google Scholar] [CrossRef]
  106. Panahandeh, A.; Asadollahfardi, G.; Mirmohammadi, M. Life cycle assessment of clinker production using refuse-derived fuel: A case study using refuse-derived fuel from Tehran municipal solid waste: Reducing emissions and conserving fossil fuel in cement making and making beneficial use of solid waste. Environ. Qual. Manag. 2017, 27, 57–66. [Google Scholar] [CrossRef]
  107. Song, D.; Yang, J.; Chen, B.; Hayat, T.; Alsaedi, A. Life-cycle environmental impact analysis of a typical cement production chain. Appl. Energy 2016, 164, 916–923. [Google Scholar] [CrossRef]
  108. Vázquez-Rowe, I.; Ziegler-Rodriguez, K.; Laso, J.; Quispe, I.; Aldaco, R.; Kahhat, R. Production of cement in Peru: Understanding carbon-related environmental impacts and their policy implications. Resour. Conserv. Recycl. 2019, 142, 283–292. [Google Scholar] [CrossRef]
  109. Palermo, G.C.; Castelo Branco, D.A.; Fiorini, A.C.O.; de Freitas, M.A.V. Comparative life cycle assessment of three 2030 scenarios of the Brazilian cement industry. Environ. Monit. Assess. 2022, 194, 153. [Google Scholar] [CrossRef]
  110. Çankaya, S.; Pekey, B. A comparative life cycle assessment for sustainable cement production in Turkey. J. Environ. Manag. 2019, 249, 109362. Available online: https://www.sciencedirect.com/science/article/pii/S0301479719310710?via%3Dihub (accessed on 23 February 2023). [CrossRef]
Figure 1. System boundary of cement production.
Cleantechnol 05 00045 g001
Figure 2. GWP of eco-blend cement versus traditional Portland cement in South Africa.
Cleantechnol 05 00045 g002
Figure 4. Contribution analysis results for resource depletion impacts at the midpoint.
Cleantechnol 05 00045 g004
Figure 5. Contribution analysis results for toxicity impacts at the midpoint.
Cleantechnol 05 00045 g005
Table 1. Life cycle inventory of cement production considered.
MaterialsType of Cement
Traditional Scenario (Portland Cement)Alternative Scenario
(Portland Blend Cement)
(CEM I)CEM II/B-LCEM II/B-VCEM III/A
Cement factory (Unit)5.36 × 10−115.36 × 10−115.36 × 10−115.36 × 10⁻¹¹
Clinker (kg)0.9020.760.6180.427
Gypsum (kg)0.04750.040.03250.0225
Fly ash (kg)----
Limestone, crushed (kg)0.050.2--
Ground granulated blast furnace slag (kg)---0.55
Ethylene glycol (kg)1.9 × 10−41.9 × 10−41.9 × 10−41.9 × 10−4
Electricity (kWh)0.03760.04970.04970.0497
Steel, low-alloyed (kg)5.25 × 10−55.25 × 10−55.25 × 10−55.25 × 10−5
Output
Heat (MJ)0.1350.1790.1790.179
Cement Product (kg)1111
Table 2. Midpoint characterization results of different types of cement produced in South Africa (per kg of cement).
Impact Category.UnitCEM ICEM II/B-L CEM II/B-VCEM III/A
Atmospheric impacts
GWPkg CO2 eq0.9930.8560.7060.641
ODPkg CFC11 eq1.94 × 10−71.80 × 10−71.53 × 10−71.68 × 10⁻⁷
HOFPkg NOx eq2.10 × 10−31.86 × 10−31.55 × 10−31.45 × 10⁻³
PMFPkg PM2.5 eq7.93 × 10−47.28 × 10−46.19 × 10−46.86 × 10⁻⁴
EOFPkg NOx eq2.12 × 10−31.88 × 10−31.56 × 10−31.46 × 10⁻³
Resource depletion impacts
TAPkg SO2 eq2.44 × 10−32.25 × 10−31.92 × 10−32.17 × 10⁻³
FEPkg P eq3.16 × 10−42.81 × 10−42.36 × 10−42.42 × 10⁻⁴
WCPm31.36 × 10−31.22 × 10−31.02 × 10−31.07 × 10⁻³
MEPkg N eq1.93 × 10−51.72 × 10−51.44 × 10−51.47 × 10⁻⁵
SOPkg Cu eq2.16 × 10−31.85 × 10−31.53 × 10−31.28 × 10⁻³
FFPkg oil eq0.1390.1230.1030.109
LOPm2a crop eq7.83 × 10−36.93 × 10−35.86 × 10−36.33 × 10⁻³
Toxicity impact
IRPkBq Co-60 eq9.97 × 10−39.29 × 10−38.01 × 10−38.82 × 10⁻³
FETPkg 1,4-DCB1.58 × 10−21.44 × 10−21.26 × 10−21.45 × 10⁻²
METPkg 1,4-DCB2.14 × 10−21.95 × 10−21.70 × 10−21.95 × 10⁻²
TETPkg 1,4-DCB1.040.9270.7960.902
HTPckg 1,4-DCB2.44 × 10−22.20 × 10−21.86 × 10−21.98 × 10⁻²
HTPnckg 1,4-DCB0.4970.4480.3830.415
Disclaimer/Publisher’s Note: The statements, opinions and data contained in all publications are solely those of the individual author(s) and contributor(s) and not of MDPI and/or the editor(s). MDPI and/or the editor(s) disclaim responsibility for any injury to people or property resulting from any ideas, methods, instructions or products referred to in the content.

