1. Introduction
Municipal solid waste (MSW) in several regions has historically been deposited in landfills or incinerated; new process solutions are needed to reduce carbon dioxide emissions, methane emissions, and to introduce the circular economy principle for the valorization of these undifferentiated fractions by creating new added value products and reducing energy dependency for a more sustainable, clean and resilient society.
Decree-Law No 73 of 17 June 2011 [
1] amends the Framework Law on Waste and replaces Directive No 2008/98/EC of the European Parliament and the Council of 19 November on waste [
2]. In this Decree-Law the following goals are provided, according to the theme of this work:
Strengthening the prevention of waste production and encouraging its reuse and recycling to prolong its use in the economy before returning it under conditions appropriate to the natural environment.
Promoting the full use of the new organized waste market to consolidate the recovery of waste, with advantages for economic agents, as well as stimulating the use of specific waste with high recovery potential.
Encouraging selective collection, in particular of bio-waste, and establishing a regulatory framework for the free marketing of the compound for agricultural recovery.
The Strategic Plan for Solid Urban Waste 2020 (PERSU 2020), approved in September 2020 [
3], is the strategic instrument for urban waste management for the period 2014–2020.
PERSU 2020 had the goal to achieve, by 31 December 2020, a reduction by 35% of the total amount of urban biodegradable waste (UBW) deposited, compared to the total quantity produced in 1995, which was recorded as 2,252,720 tons, which means that in 2020, only 788,452 tons of UBW were landfilled, at the level of mainland Portugal. However, in view of the emergence of the new European Waste Directive, published on 30 May 2018, which formalizes the targets for urban waste management by 2035, a readjustment has been made under THE PERSU 2020+ [
4].
In the area of the European Directive 2018/851 of the European Parliament and the Council of 30 May 2018 [
5], amending Directive 2008/98/EC on waste, the following differentiated goals were designated:
From 2024, selective collection of bio-waste will be mandatory.
By 2030, 60% by weight of urban waste needs to be recycled.
In 2035, only 10% of waste can be landfilled.
In Portugal, close to 1.8 million tonnes of bio-waste were produced from undifferentiated urban waste (36.4%) in 2018, and 5% was selectively collected (this does not include selectively collected green waste). The quantity selectively collected represents 9 kg/capita in 2018 [
6]. In 2021, 33% of urban waste was recycled [
7].
The indicators of urban waste produced and recycled are described in
Table 1.
In 2019, the total urban waste produced was 491 kg/inhab in Madeira and 703 kg/inhab in Porto Santo. The PERSU 2020+ [
4] constitutes an adjustment to the measures provided in the Strategic Plan for Urban Waste (PERSU 2020) [
3].
These targets are quite ambitious and are aligned with the objectives of the National Energy and Climate Plan 2030 [
8] and the EU Green Deal [
9], in accordance with the circular economy principle. However, there is a lack of development of these solutions in isolated electricity production systems with unknown compositions of feedstocks, inventory of resources, where the main solutions are still landfill and incineration for organic waste fractions such as food waste, that is part of undifferentiated urban waste.
In order to fulfill the research gap about the valorization of bio-waste from municipal solid waste in isolated electricity production systems [
10], which are the parameters that characterize these waste fractions and which feedstocks, considering their compositions are unknown, could be most suitable for creating valorization solutions for the production of biogas, Porto Santo Island was selected as a case study to address these research questions.
This research contributes to the increase of the circular economy and the recovery of bio-waste at a regional level in our society.
1.1. State-of-the-Art of Bio-Waste Parameters and Process Solutions
The bio-waste produced could be separated and recycled at source for home composting, an aerobic treatment solution, or separately collected and treated by an anaerobic digestion process, which consists of the decomposition of organic matter into methane, carbon dioxide, inorganic nutrients, and compost in an oxygen-devoid environment and in the presence of gaseous hydrogen, as a result of the metabolic interaction of various groups of microorganisms, which help each other, self-regulating the digestion process. This type of digestion occurs because the microorganisms that take part in it can reproduce in the absence of oxygen. According to Petrovic et al. [
11], biogas production from the anaerobic digestion process has been investigated considering different wastes from vegetable oils such as pumpkin seeds press cake, grape seeds press cake, olive mill pomace, coconut oil, sludge from a vegetable oil industry wastewater treatment plant, and with municipal sewage sludge with a good biogas yield. Lignocellulosic biomass was considered as a resource in Kamusoko et al. [
12] for biogas production. The research study showed that the composition of potential feedstocks, such as cellulose, lignocellulose and lignin content of the biomass, total nitrogen content, and pH could determine the efficiency of the anaerobic digestion process. The feedstocks considered in Kamusoko et al. [
12] were, lignocellulosic crop residues—wheat straw, maize stover, and soybean straw.
According to Zhu et al. [
13], the effects of micro-aeration on batch anaerobic digestion with different organic wastes showed that could increase methane yields and led to the faster conversion of volatile fatty acids into methane. Khan et al. [
14], have studied rice winery wastewater and molasses to produce biogas from anaerobic digestion at an increasing organic loading rate with a good COD removal rate and methane content (69.14%). Ganeshan et al. [
15] studied anaerobic digestion for biomethane production in Matlab, with a 92% accuracy for batch and continuous processes and different organic load rates. According to Govarthanan et al. [
16], biogas generation in anaerobic digesting processes can be boosted by utilizing customized nanoparticles to dose ions to be supplied to microbes, facilitating the degradation of organic substrates. Studies have identified lignocellulosic resources for biogas plants, however, there is a gap in the research concerning organic waste from food, its composition, and the differentiated separation of these organic waste fractions in the community for biogas plants.
According to Wang et al. [
17], anaerobic digestion has been considered for organic waste valorization based on the mechanisms of microbial communities.
The organic fraction of undifferentiated urban solid waste consists of a substrate that requires different stages of complex metabolic reactions to be digested.
Each stage of the process is described considering the main reactions that occur and the objective within the anaerobic digester.
The anaerobic digestion process occurs in four stages, and it is necessary for a vast microbial flora to exist, to facilitate the degradation of organic substrates. The main reactions that occur are:
1.1.1. Hydrolysis
In this first phase of digestion, there is a degradation of the most complex organic molecules, such as large proteins, that are broken into amino acids, lipids into fatty acids and glycerol, and complex carbohydrates (such as polysaccharides, cellulose, and leach) into simple sugars such as glucose. Hydrolytic bacteria are responsible for the creation of monomers that secrete the enzymes responsible for catalysis, such as proteases, cellulases, and lyases. Food bio-residues can be represented generically by the molecule C
6H
10O
4 [
18].
The hydrolysis reaction where bio-waste molecules are broken down into glucose is described by the following reaction [
19]:
If the raw material to be digested is complex, as in the case of residues with a high cellulose content, the hydrolytic phase is slower. On the other hand, when there is less complex organic matter, such as food waste, the kinetics are faster. According to Wo et al. [
20], iron improved the anaerobic co-digestion performance of kitchen waste, and improved the biogas yield, under the batch mode and mesophilic conditions.
According to Hue et al. [
21], the hydrolysis rate can be improved by feedstock pre-treatment in order to reduce the particle size, facilitate the dissolution of organic matter, and soluble chemical oxygen demand, improving the methane yield.
1.1.2. Acidogenesis
The hydrolysis process is followed immediately by the fatty acid formation phase, called acidogenesis. In this process, acidogenic or fermentative bacteria use hydrolysis products as the substrate and convert them into simple organic compounds such as volatile fatty acids (propionic acid, formic, lactic), ketones (acetone), and alcohols.
Small concentrations of carbon dioxide, acetate, and hydrogen are also formed at this stage, depending on the type of bacteria, as well as the temperature conditions and pH [
22].
The reactions of acid formation are divided into two parts according to the equations:
- (1)
Glucose conversion into ethanol
- (2)
Glucose transformation into propionate:
1.1.3. Acetogenesis
In the acetogenic stage, the substrates obtained in the fermentation stage are transformed into acetate, carbon dioxide, and hydrogen, that in the next phase will be the substrates for methane production.
Under normal conditions this hydrogen would serve to inhibit oxidation, and therefore the reaction only continues if the partial pressure of this gas is low enough to thermodynamically allow the reaction. The bacteria involved in this transformation are called hydrogen-producing bacteria (OHPA).
In acetogenesis there are three main reactions of glucose conversion (Equation (4)), ethanol (Equation (5)), and bicarbonate (Equation (6)) in acetate.
There is also the reaction (Equation (7)) converting propionate into acetate:
1.1.4. Methanogenesis
The methanogenesis stage is the most important stage of anaerobic digestion, because it is at this stage that there is the transformation of the substrate obtained in the acetogenesis phase into methane, carbon dioxide, and water. The bacteria responsible for this process are strict anaerobic bacteria, requiring for their development a redox potential between −250 and −300 mV. Meta-genetic bacteria degrade only a limited number of substrates with low carbon numbers: acetate, methylamine, hydrogen, and carbon dioxide.
Bacterial populations convert the soluble material into methane, from which two-thirds comes from acetate (Equations (8) and (9)), or the fermentation of an alcohol, such as methanol (Equation (10)), and a third comes from the reduction of carbon dioxide by hydrogen (Equation (11)).
This is the step of the process that controls the speed of digestion because the bacteria involved have a slower growth rate than the bacteria involved in the phases described earlier.
Although the anaerobic digestion is carried out in four stages, in fact all processes occur simultaneously and synergistically during biogas production. The production of electricity and thermal energy was performed in a biogas CHP process.
2. Materials and Methods
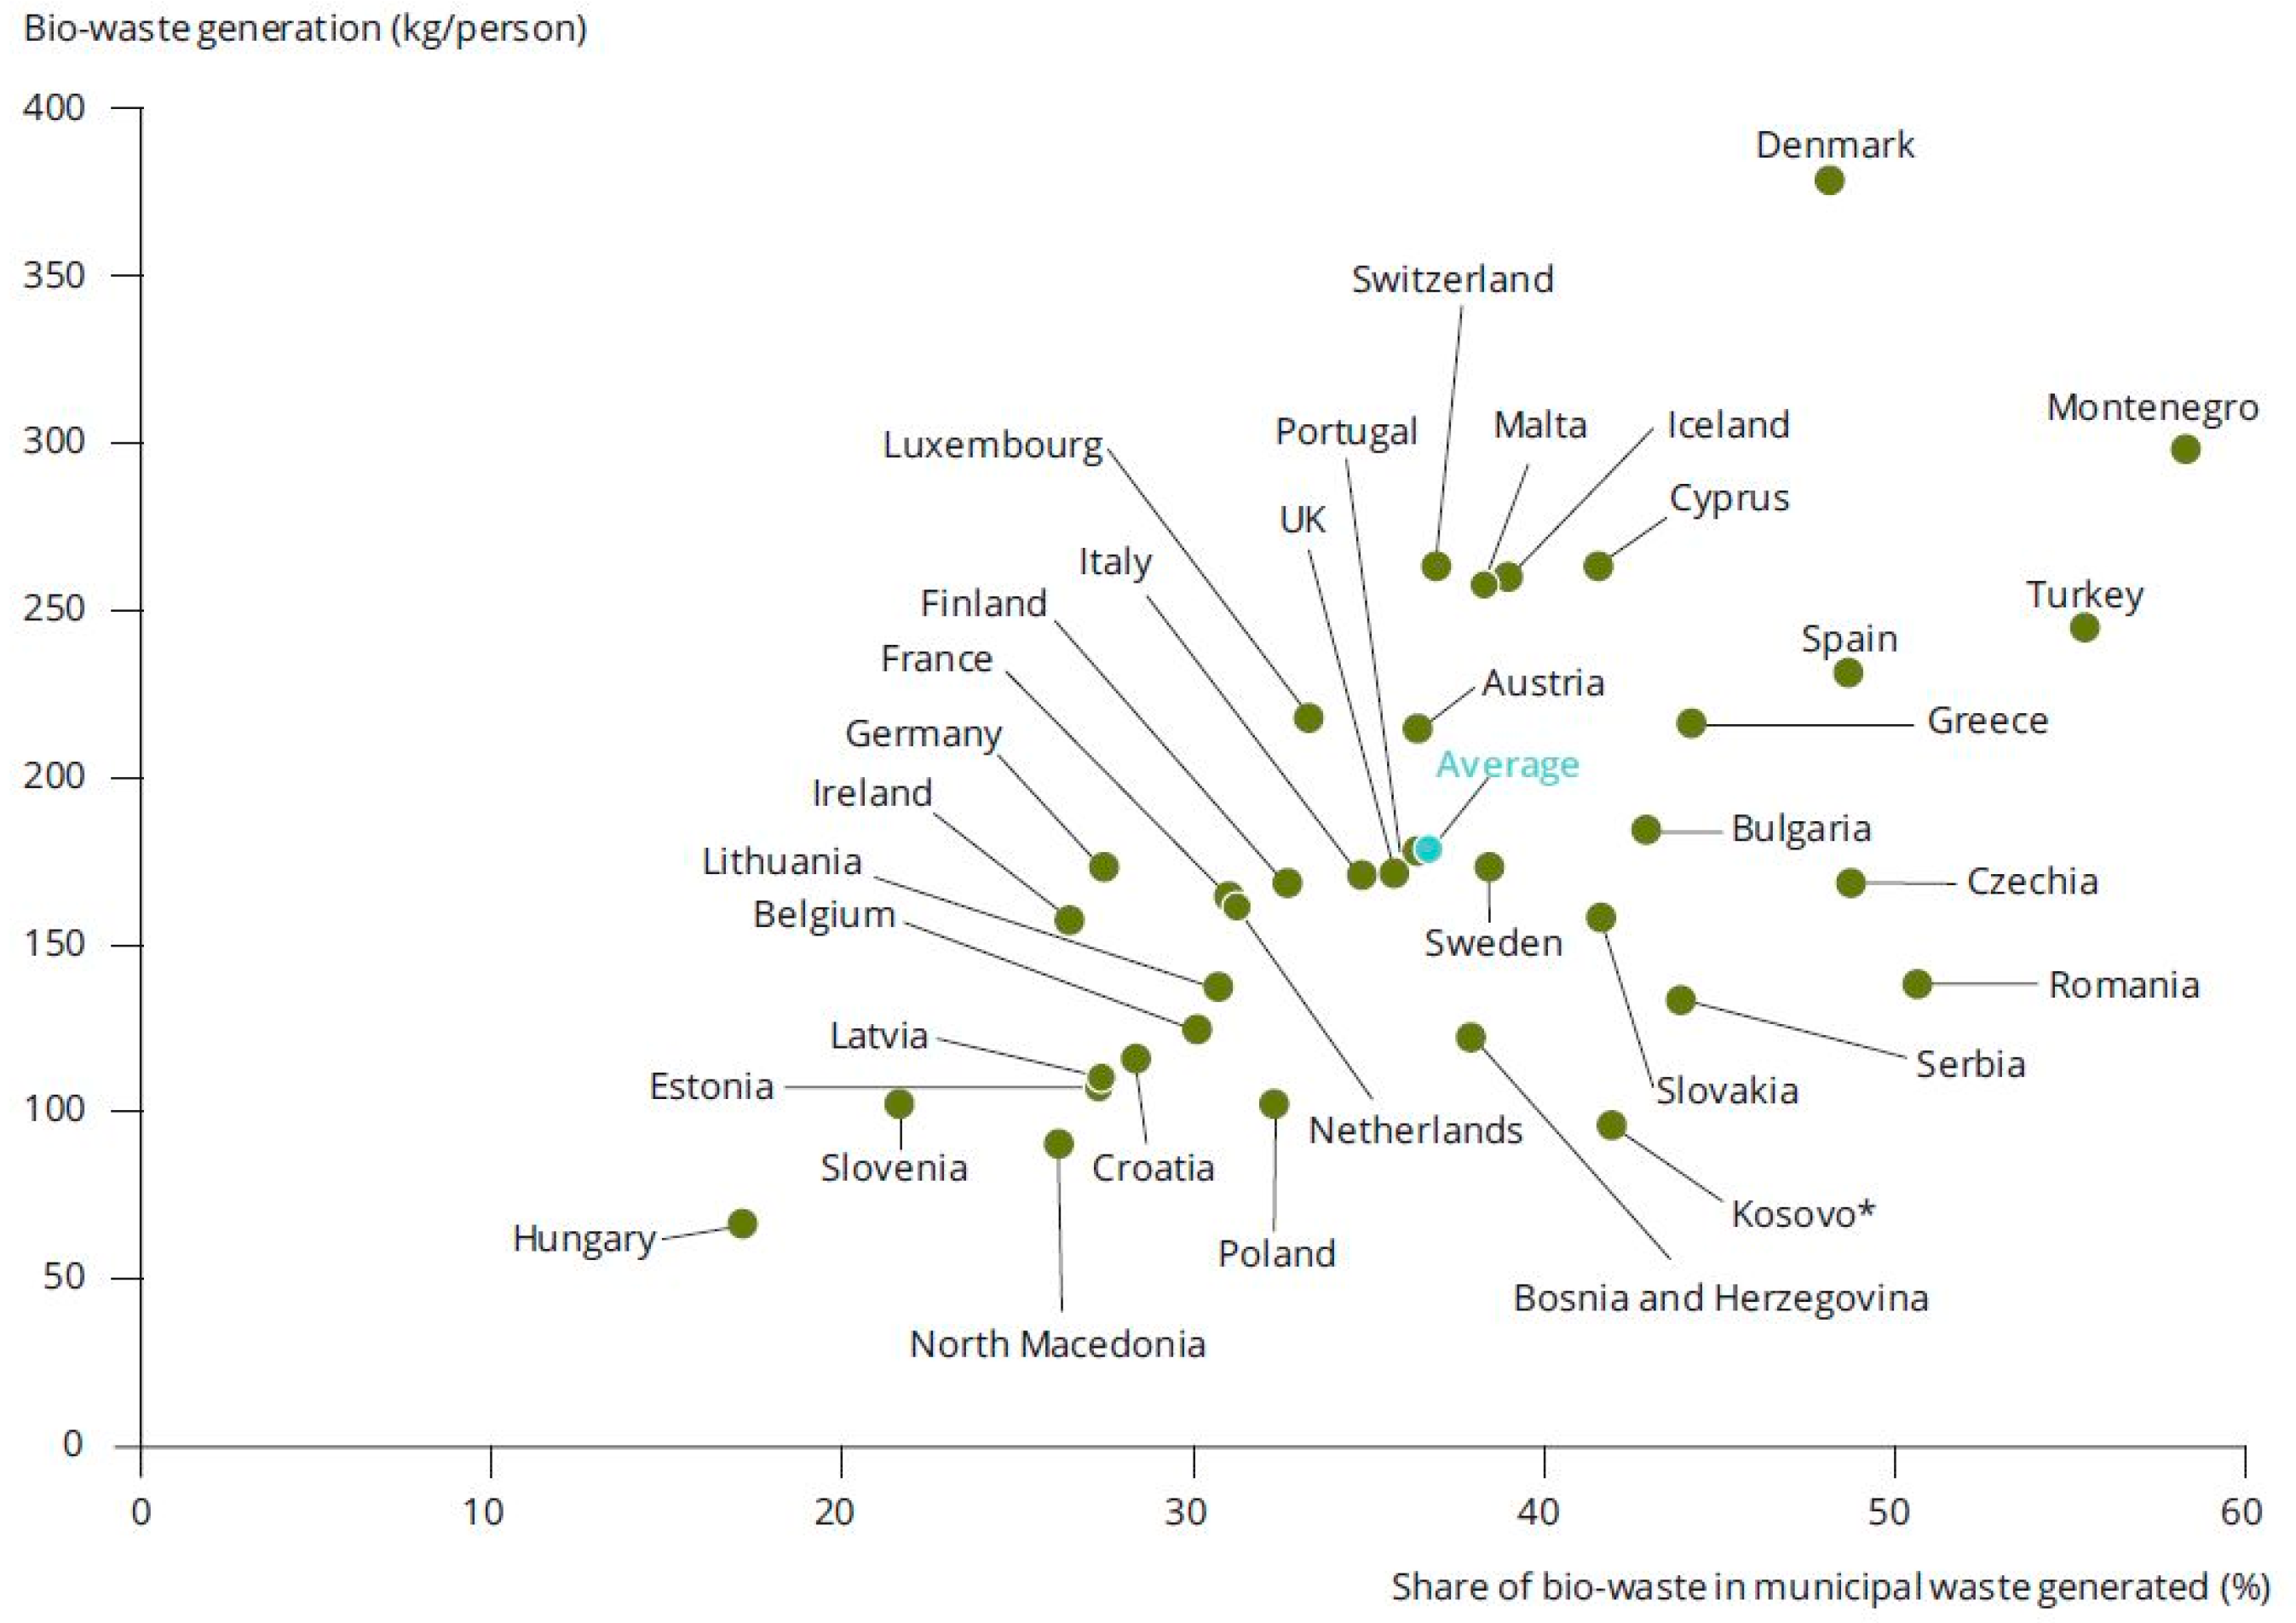
It is estimated that the amount of bio-waste generated annually in the EU is between 76.5 and 102 million tonnes of food and garden waste, and 37 million tonnes of waste from the food and beverage industry. The bio-waste share in undifferentiated urban waste generated differs by location, according to
Figure 1 the average accounts for more than 30% of municipal waste generated.
According to EEA Report No. 4/2020 [
23], Denmark had a large generation of bio-waste per person from municipal solid waste in the EU-28 in 2017, with almost 50% of the share in municipal waste generated being bio-waste. Montenegro had almost 60% of its municipal solid waste being bio-waste.
In this research, it was estimated in Portugal that 39% of the undifferentiated urban waste produced is bio-waste, including green waste collected selectively.
Table 2 indicates the rates achieved in landfilling and the targets for Portugal.
In the Archipelago of Madeira, 1.6% of the urban waste is landfilled on Madeira Island, and 48.5% of urban waste is landfilled in Porto Santo Island in 2020. The recycling of green waste in Madeira Island in the Solid Waste Treatment plant for composting was 0.3% of the total urban waste generated in 2020.
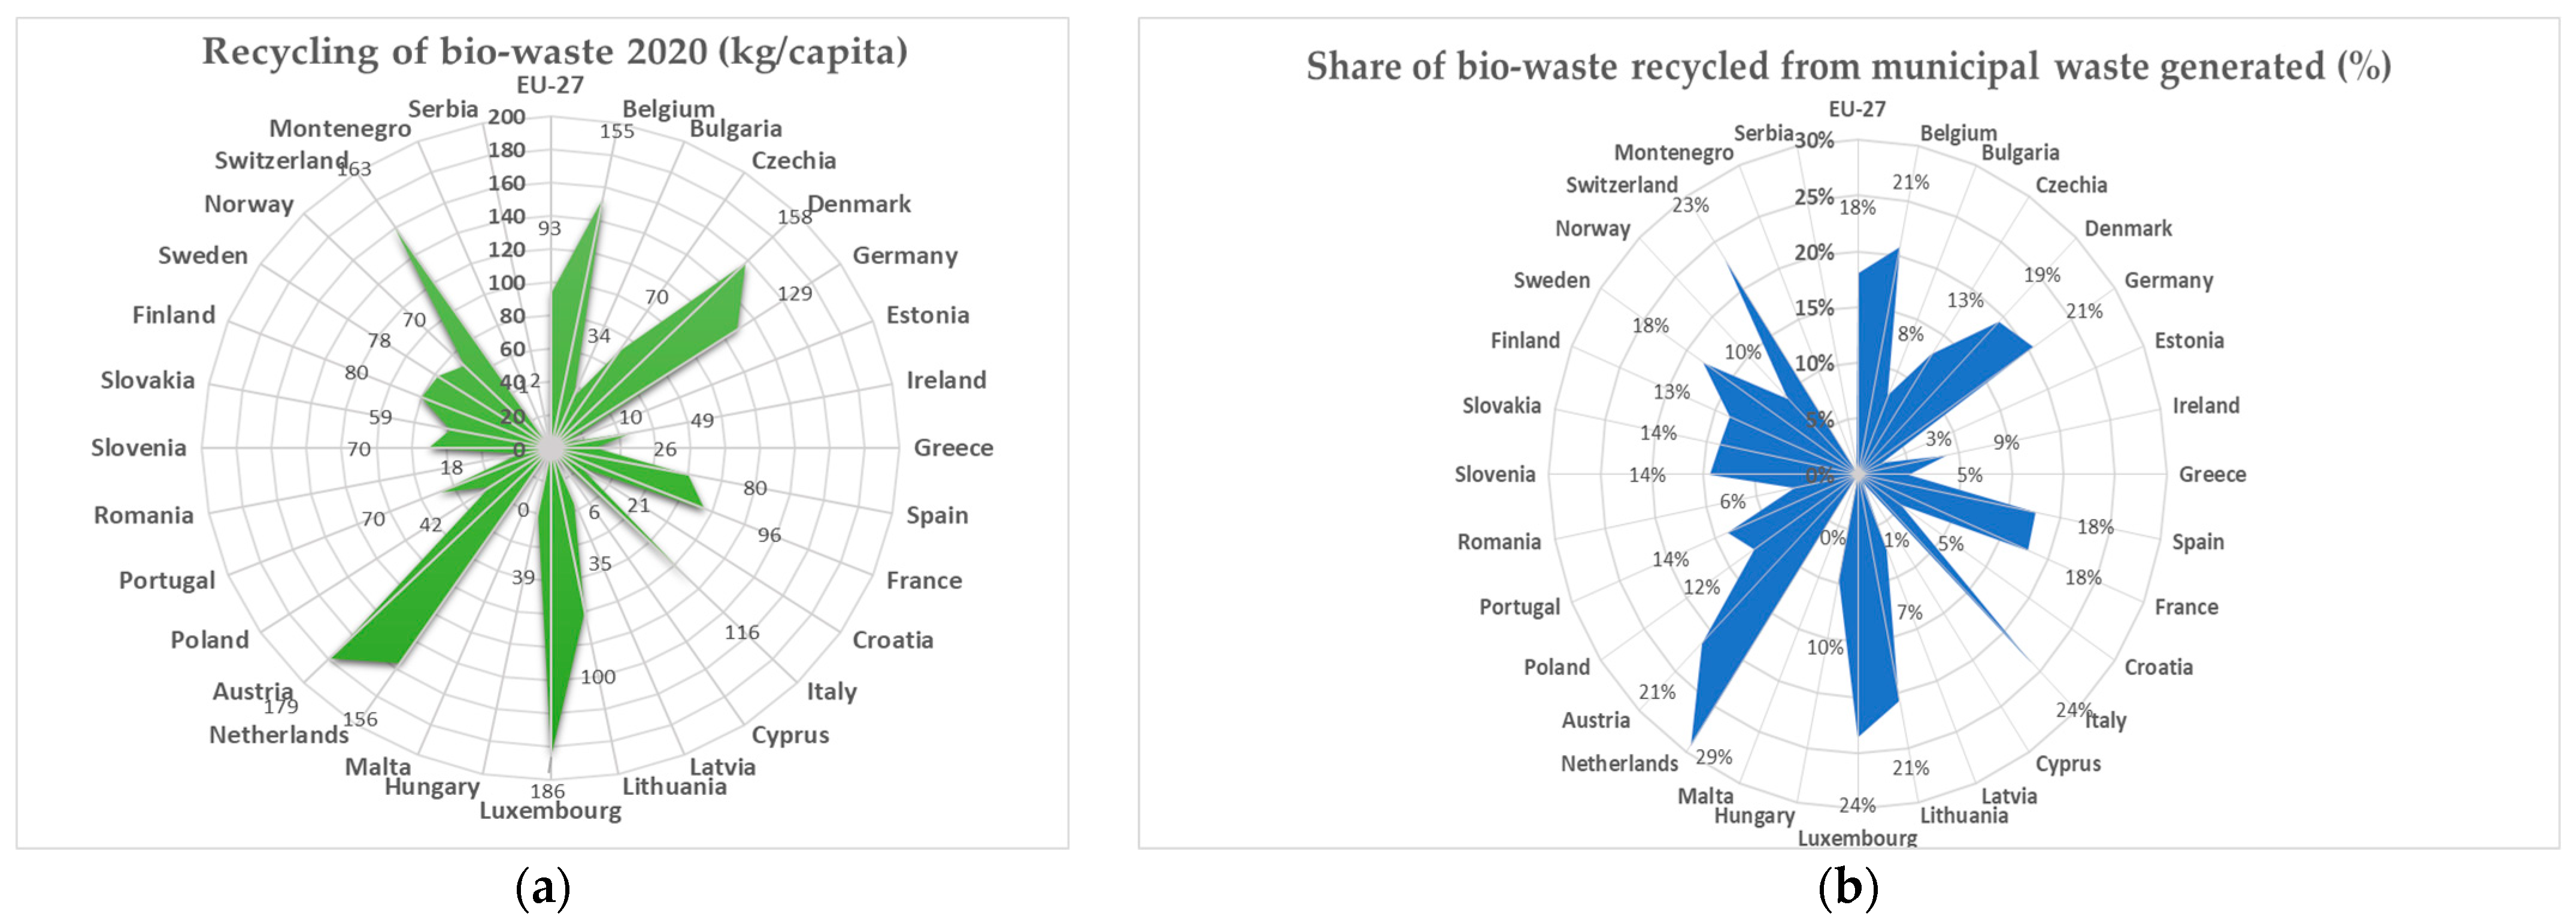
The total recycling of bio-waste from composting and digestion was 70 kg/capita in Portugal in 2020 [
24].
Figure 2 demonstrates the recycling of bio-waste in the EU-27.
The Archipelago of Madeira should incorporate this transition, to ensure the increase of the differentiated separation of bio-waste from undifferentiated solid waste, considering the European targets and adjustment in the PERSU 2020+ [
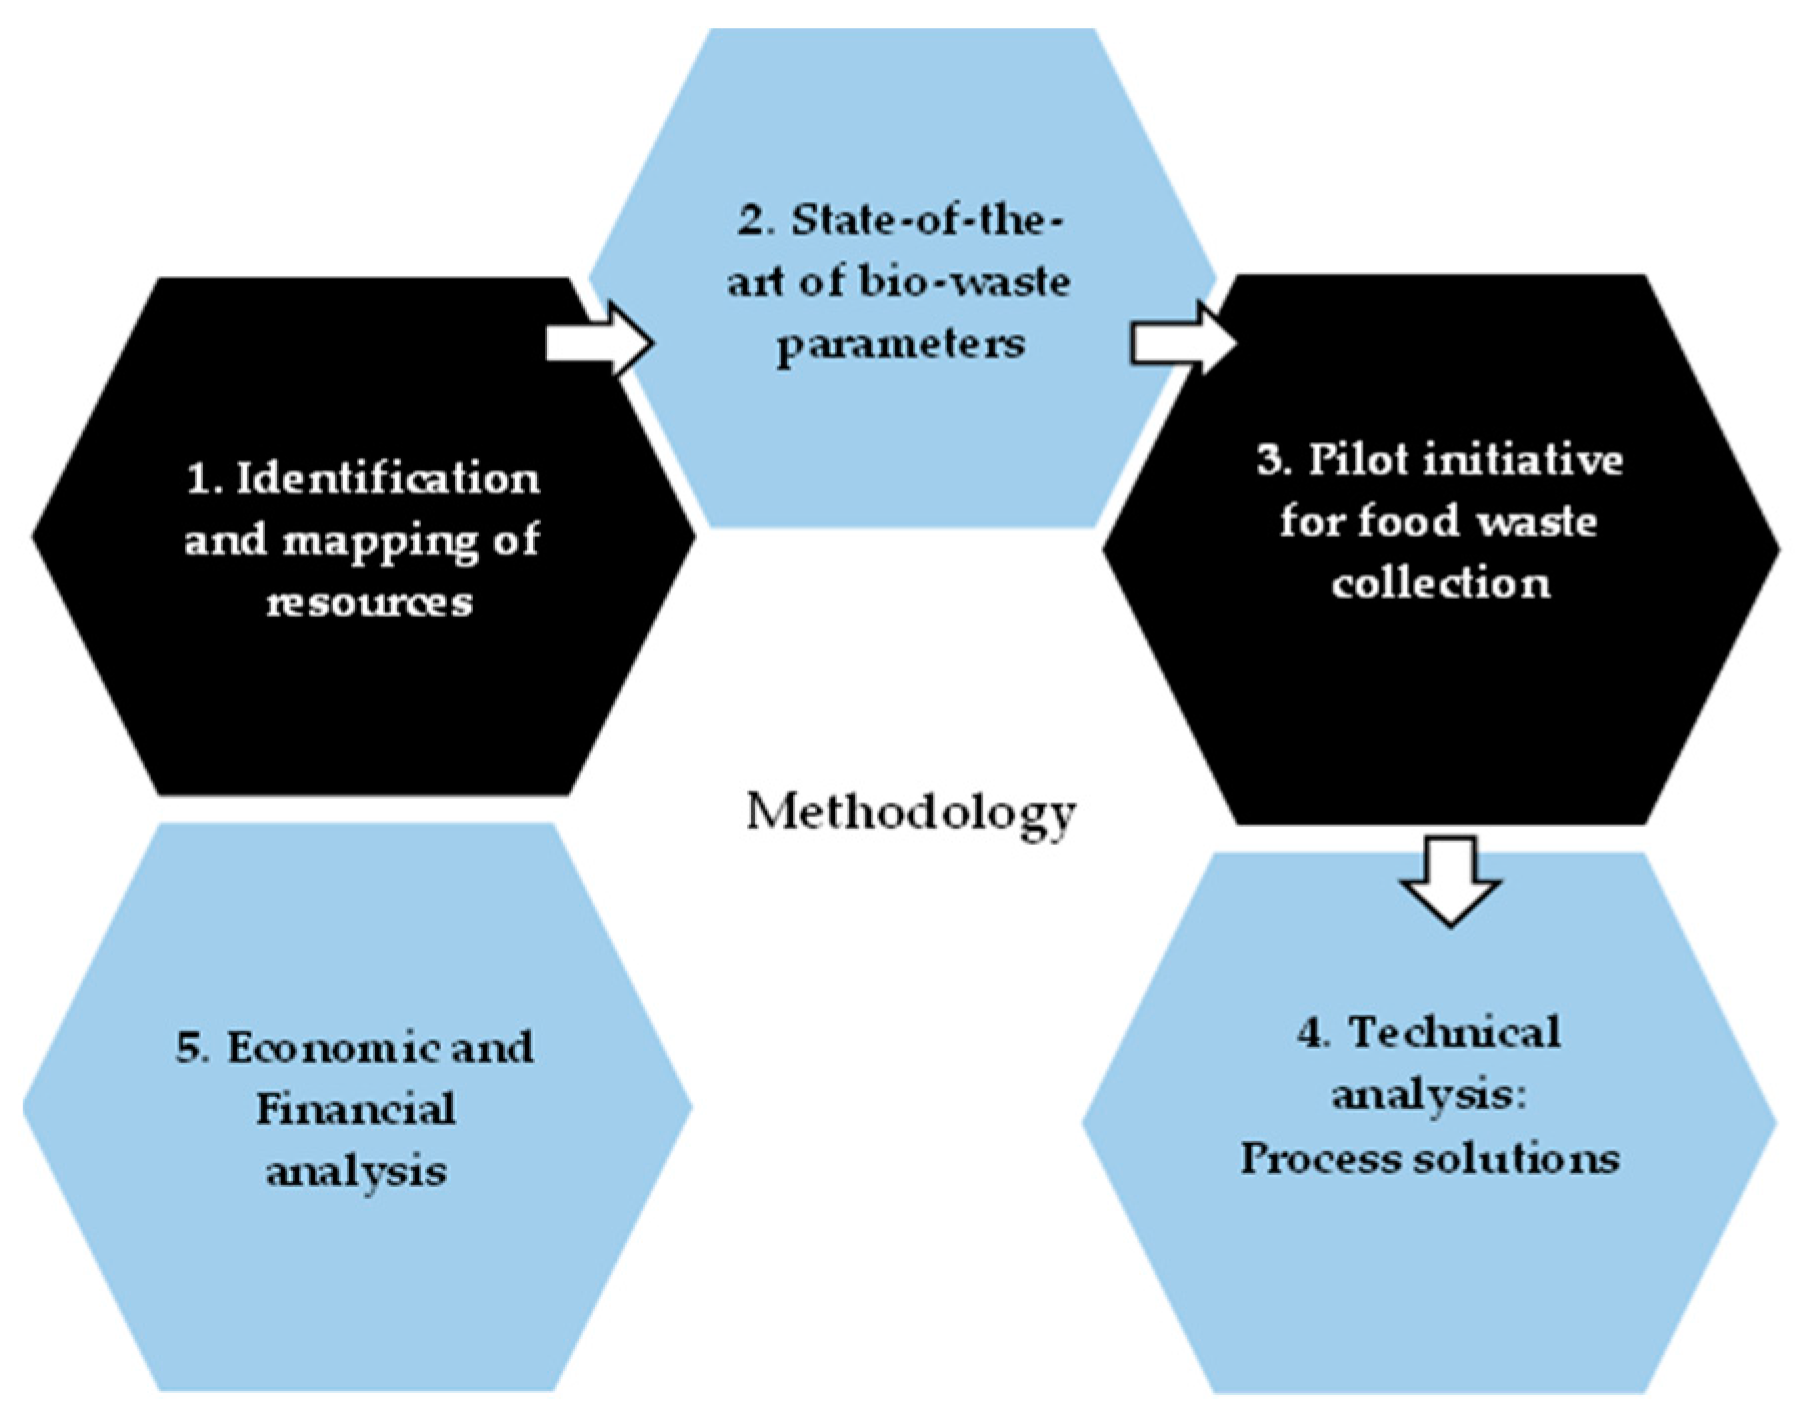
4] of the national targets. For this reason, this research work was developed, and the case study of Porto Santo Island was selected, with a background of a promising and very demanding legislative framework. The research performed was developed according to the five steps methodology created and represented in
Figure 3.
The methodology developed was accomplished by mapping the bio-waste production circuit, by the identification of the parameters needed to be analyzed in the chemistry laboratory, map analysis, block diagram design of the process developed, and several calculations for biogas production including technical research analysis of subproducts produced regarding reactions, and process conditions such as temperature, pH, water, and total solids content. Sludge was also considered as a resource for biogas and composting, due to the amount of this resource on the Island.
Questionnaires were made for the quantification of the production of bio-waste fraction in the local community, regarding occupancy of the tourism sector (n° lodgers) and instructions for the better separation and collection of bio-waste samples according to the properties of these biodegradable fractions.
Case Study
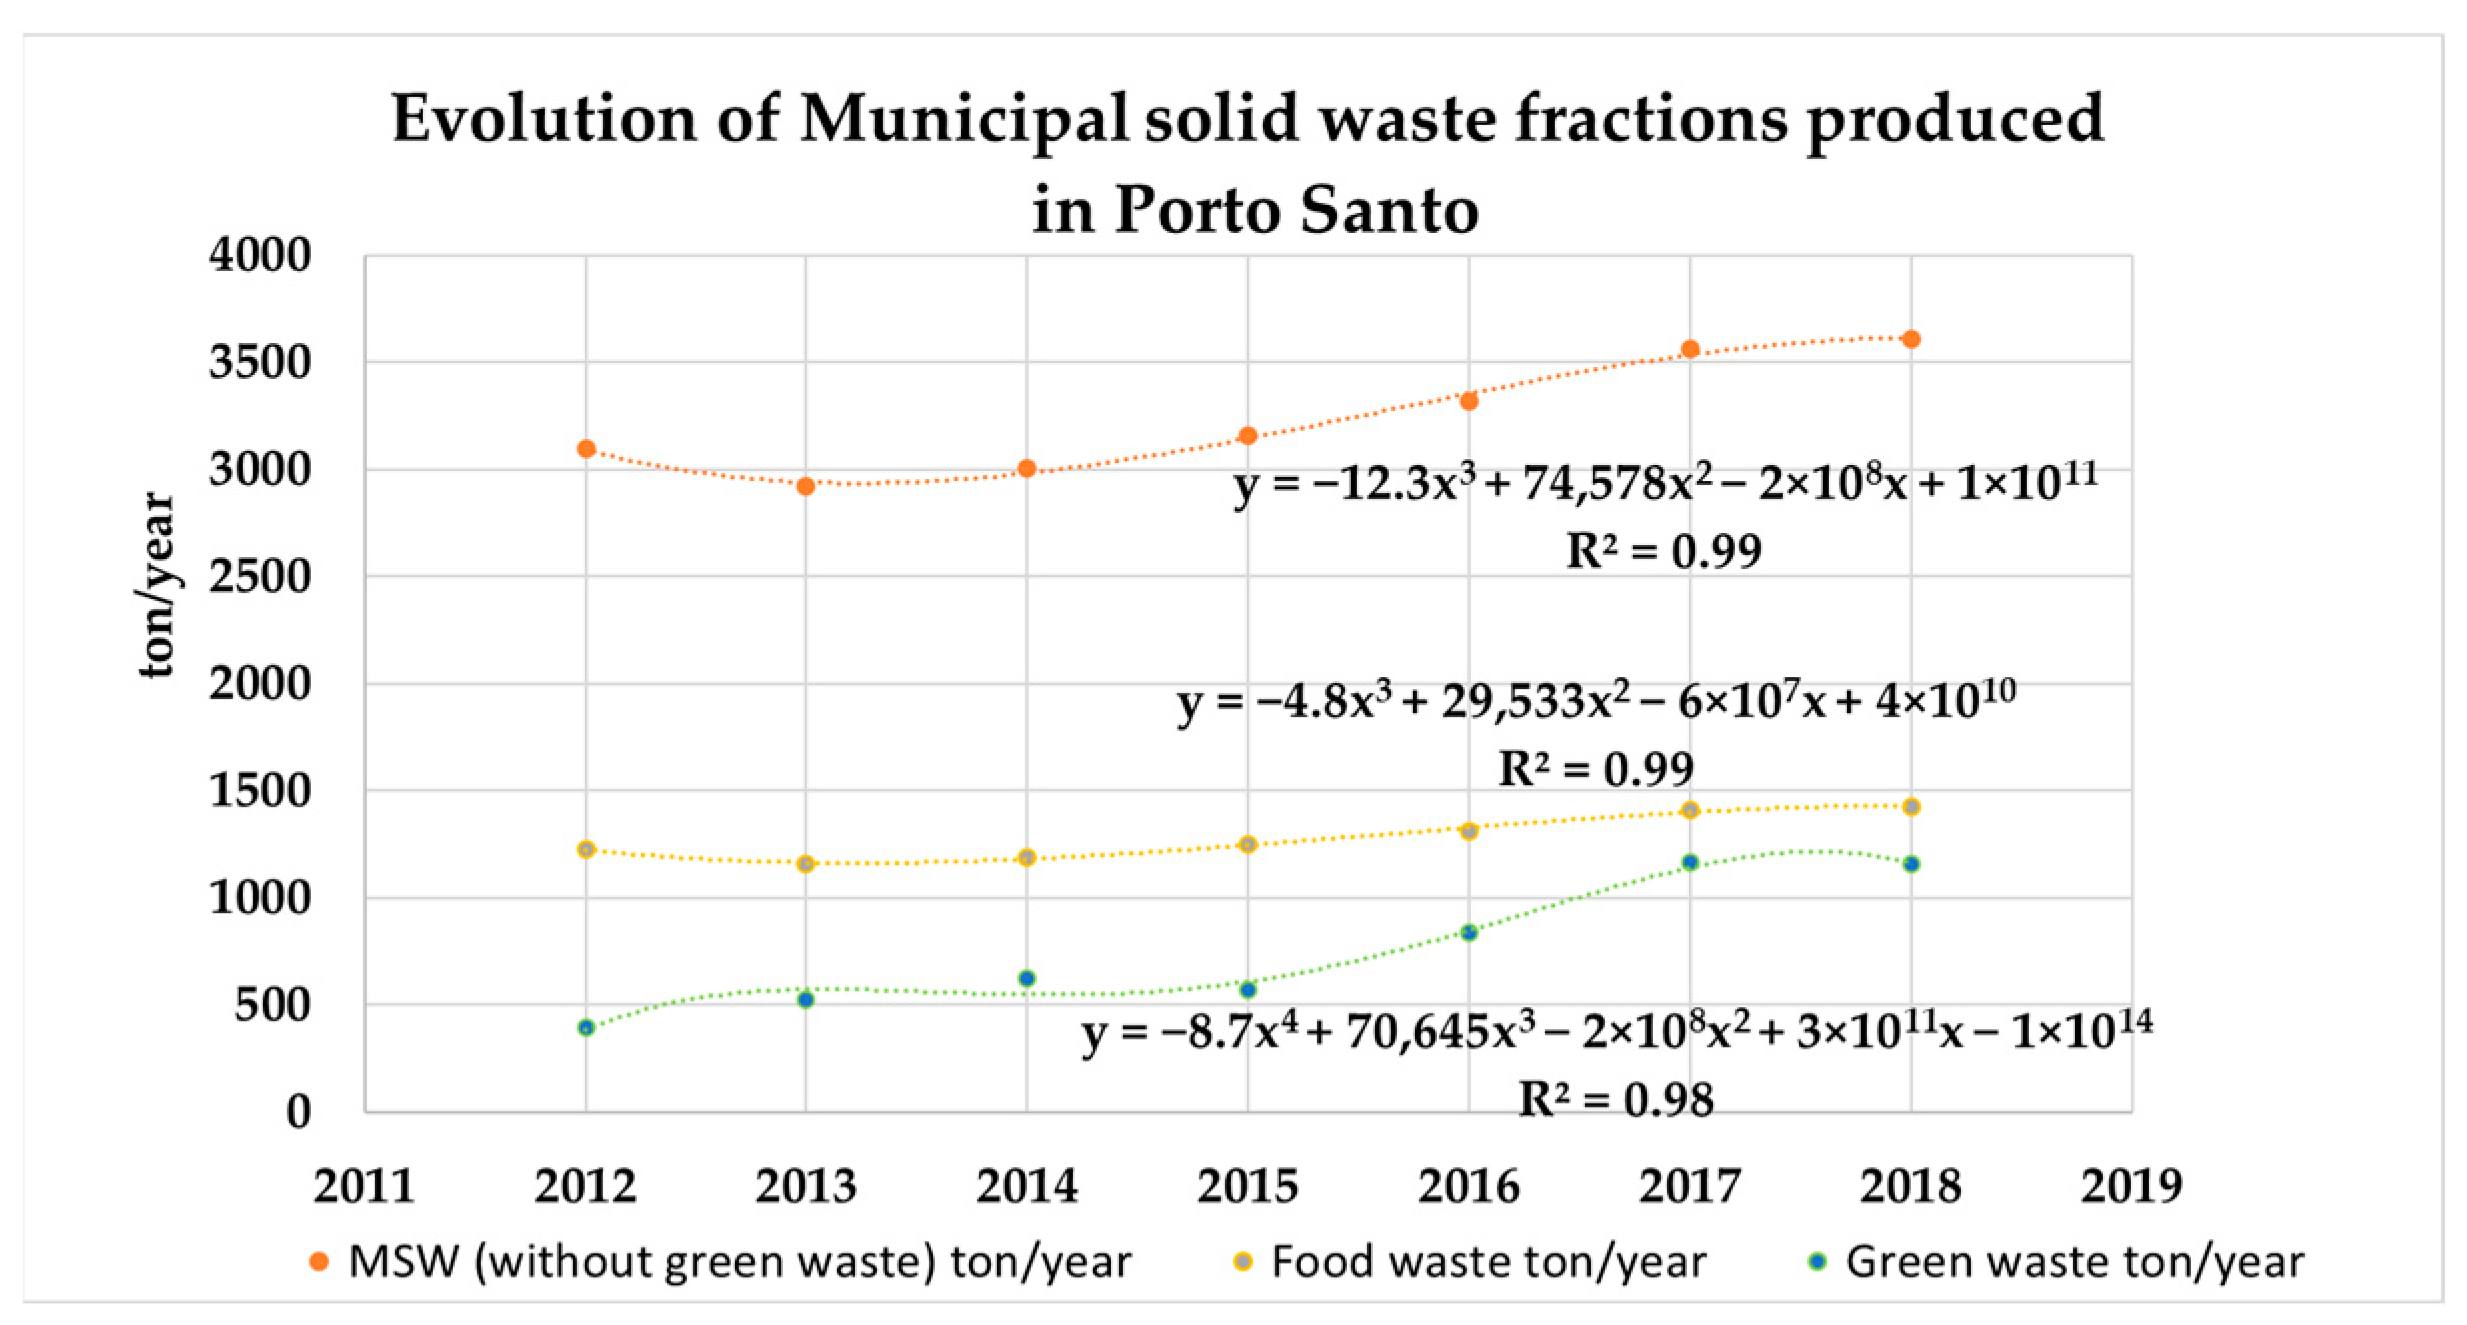
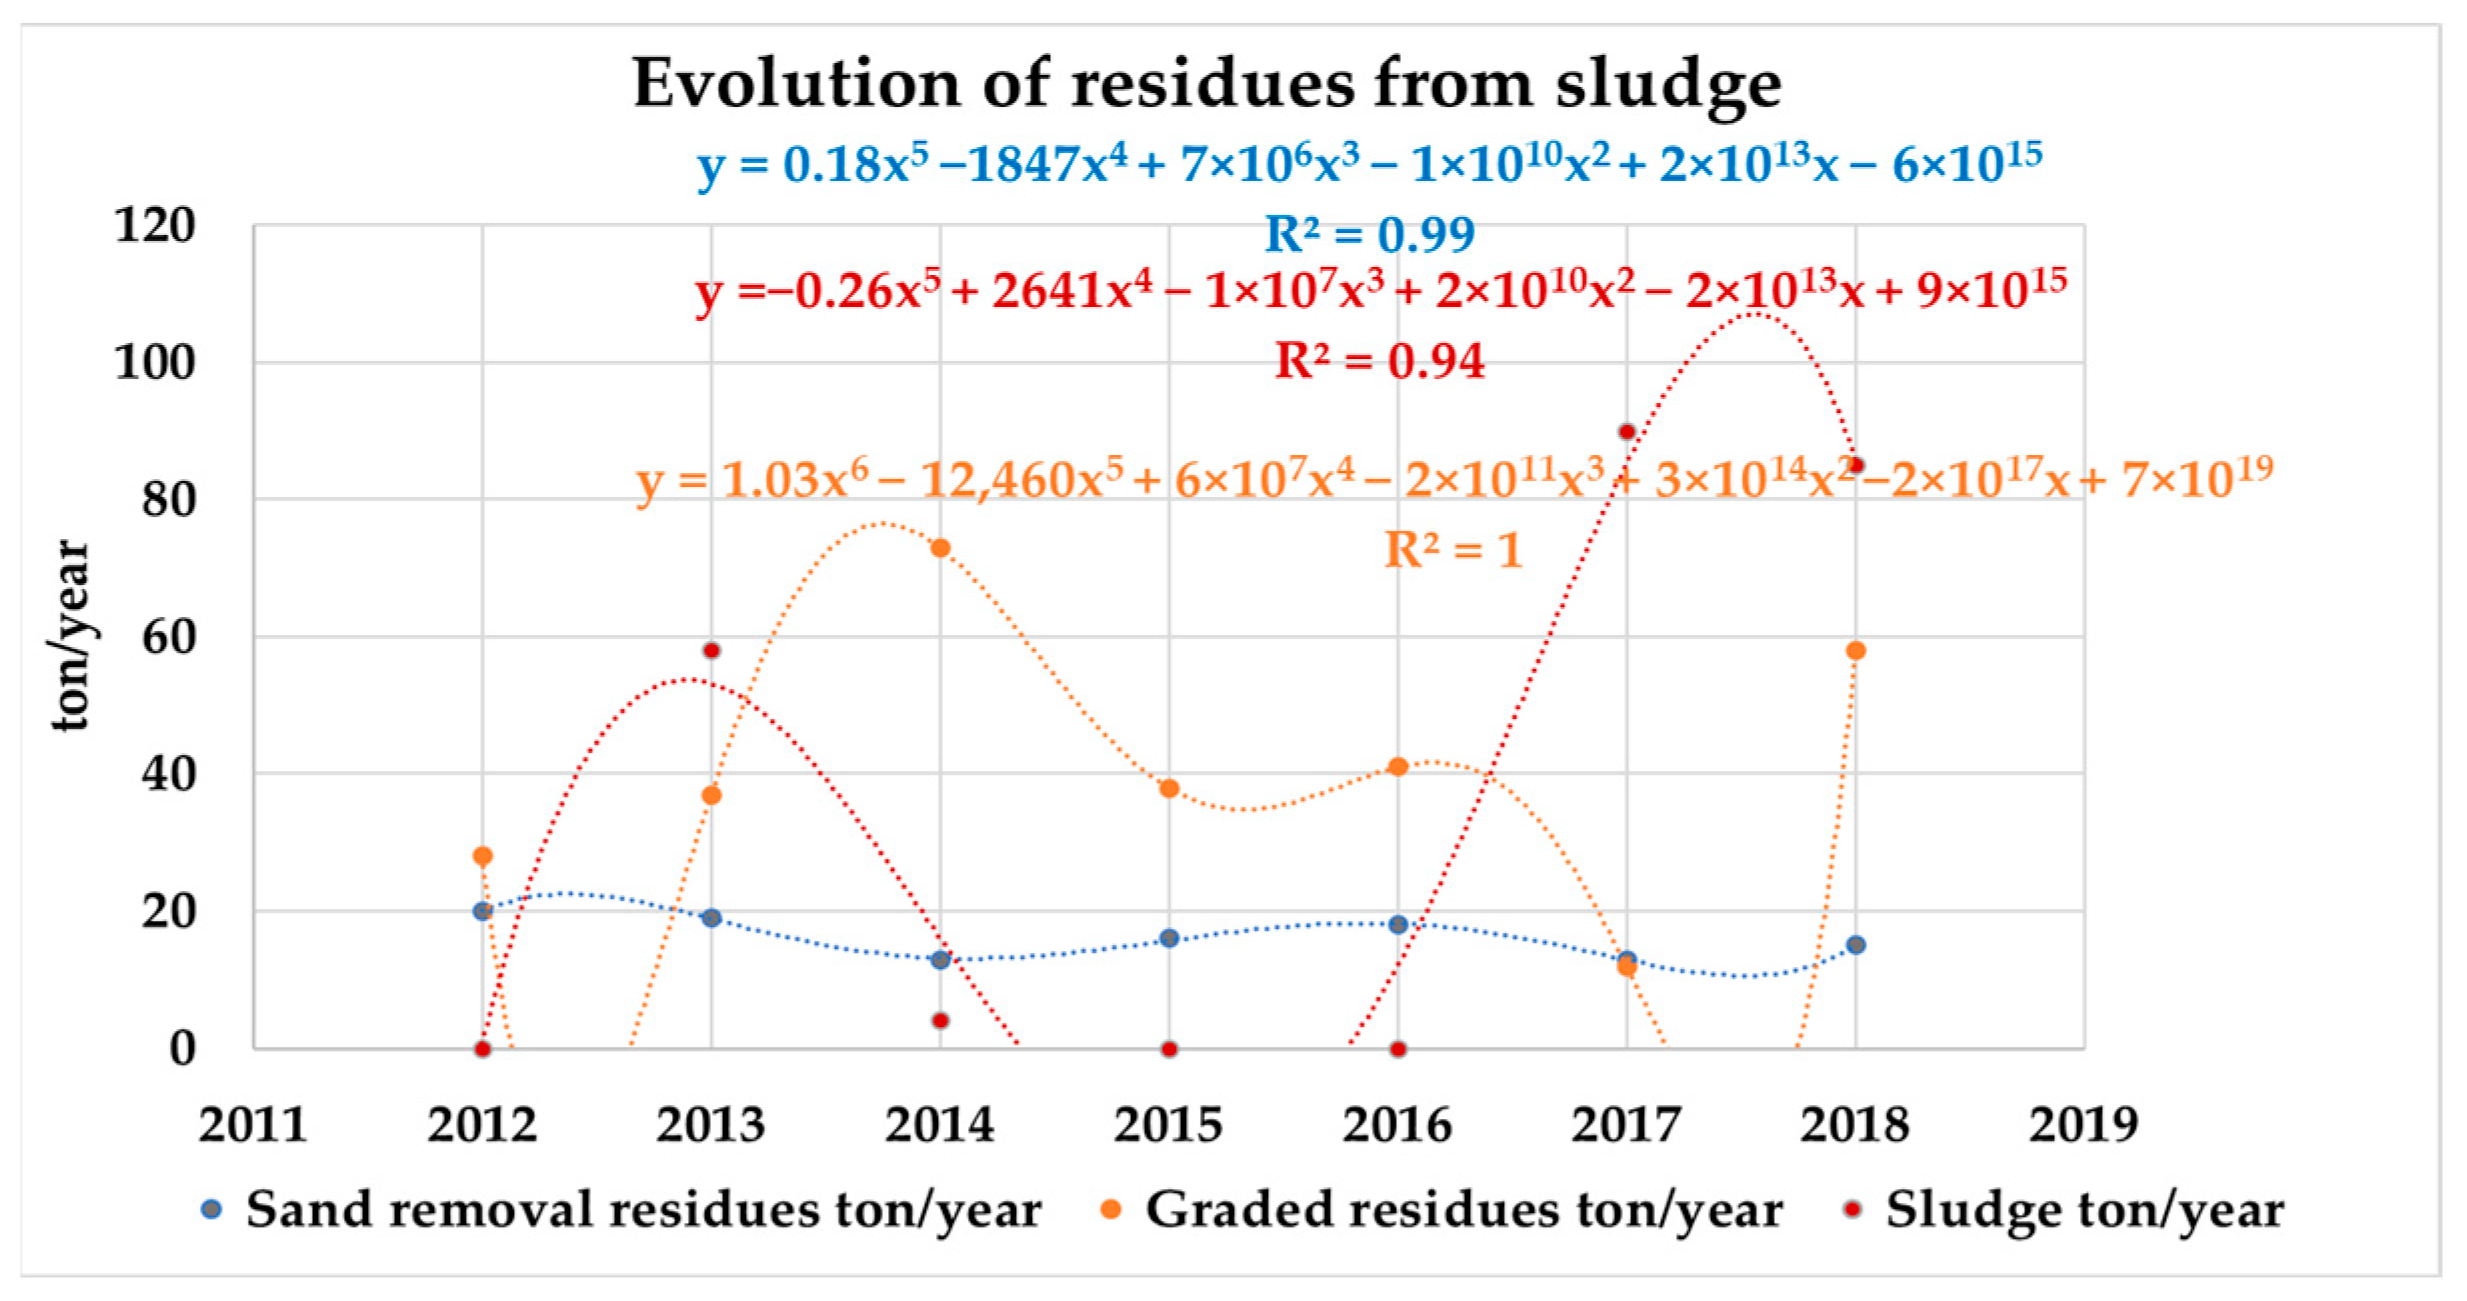
The total production of MSW in Porto Santo in 2018 was 3606 tonnes, and 1154 tonnes of green waste. The bio-waste fraction from the undifferentiated municipal solid waste was 39.6%, the equations calculated for the evolution of production of these waste fractions are shown in
Figure 4. In Porto Santo, there was a significant increase in the disposal of MSW in landfills between 2015 and 2016, from 268 tonnes to 8016 tonnes, respectively, followed by a decrease in the year 2017. From 2018, there was again an increase in the disposal of landfill waste and an increase in the separation of organic waste for wood production.
According to the history of production of sludge in Porto Santo, production increased from the year 2017. A representation of the total annual production of this type of raw material is shown in
Figure 5.
The total production of raw materials identified, including food waste, green waste, and sludge, was 2868 tonnes in 2018.
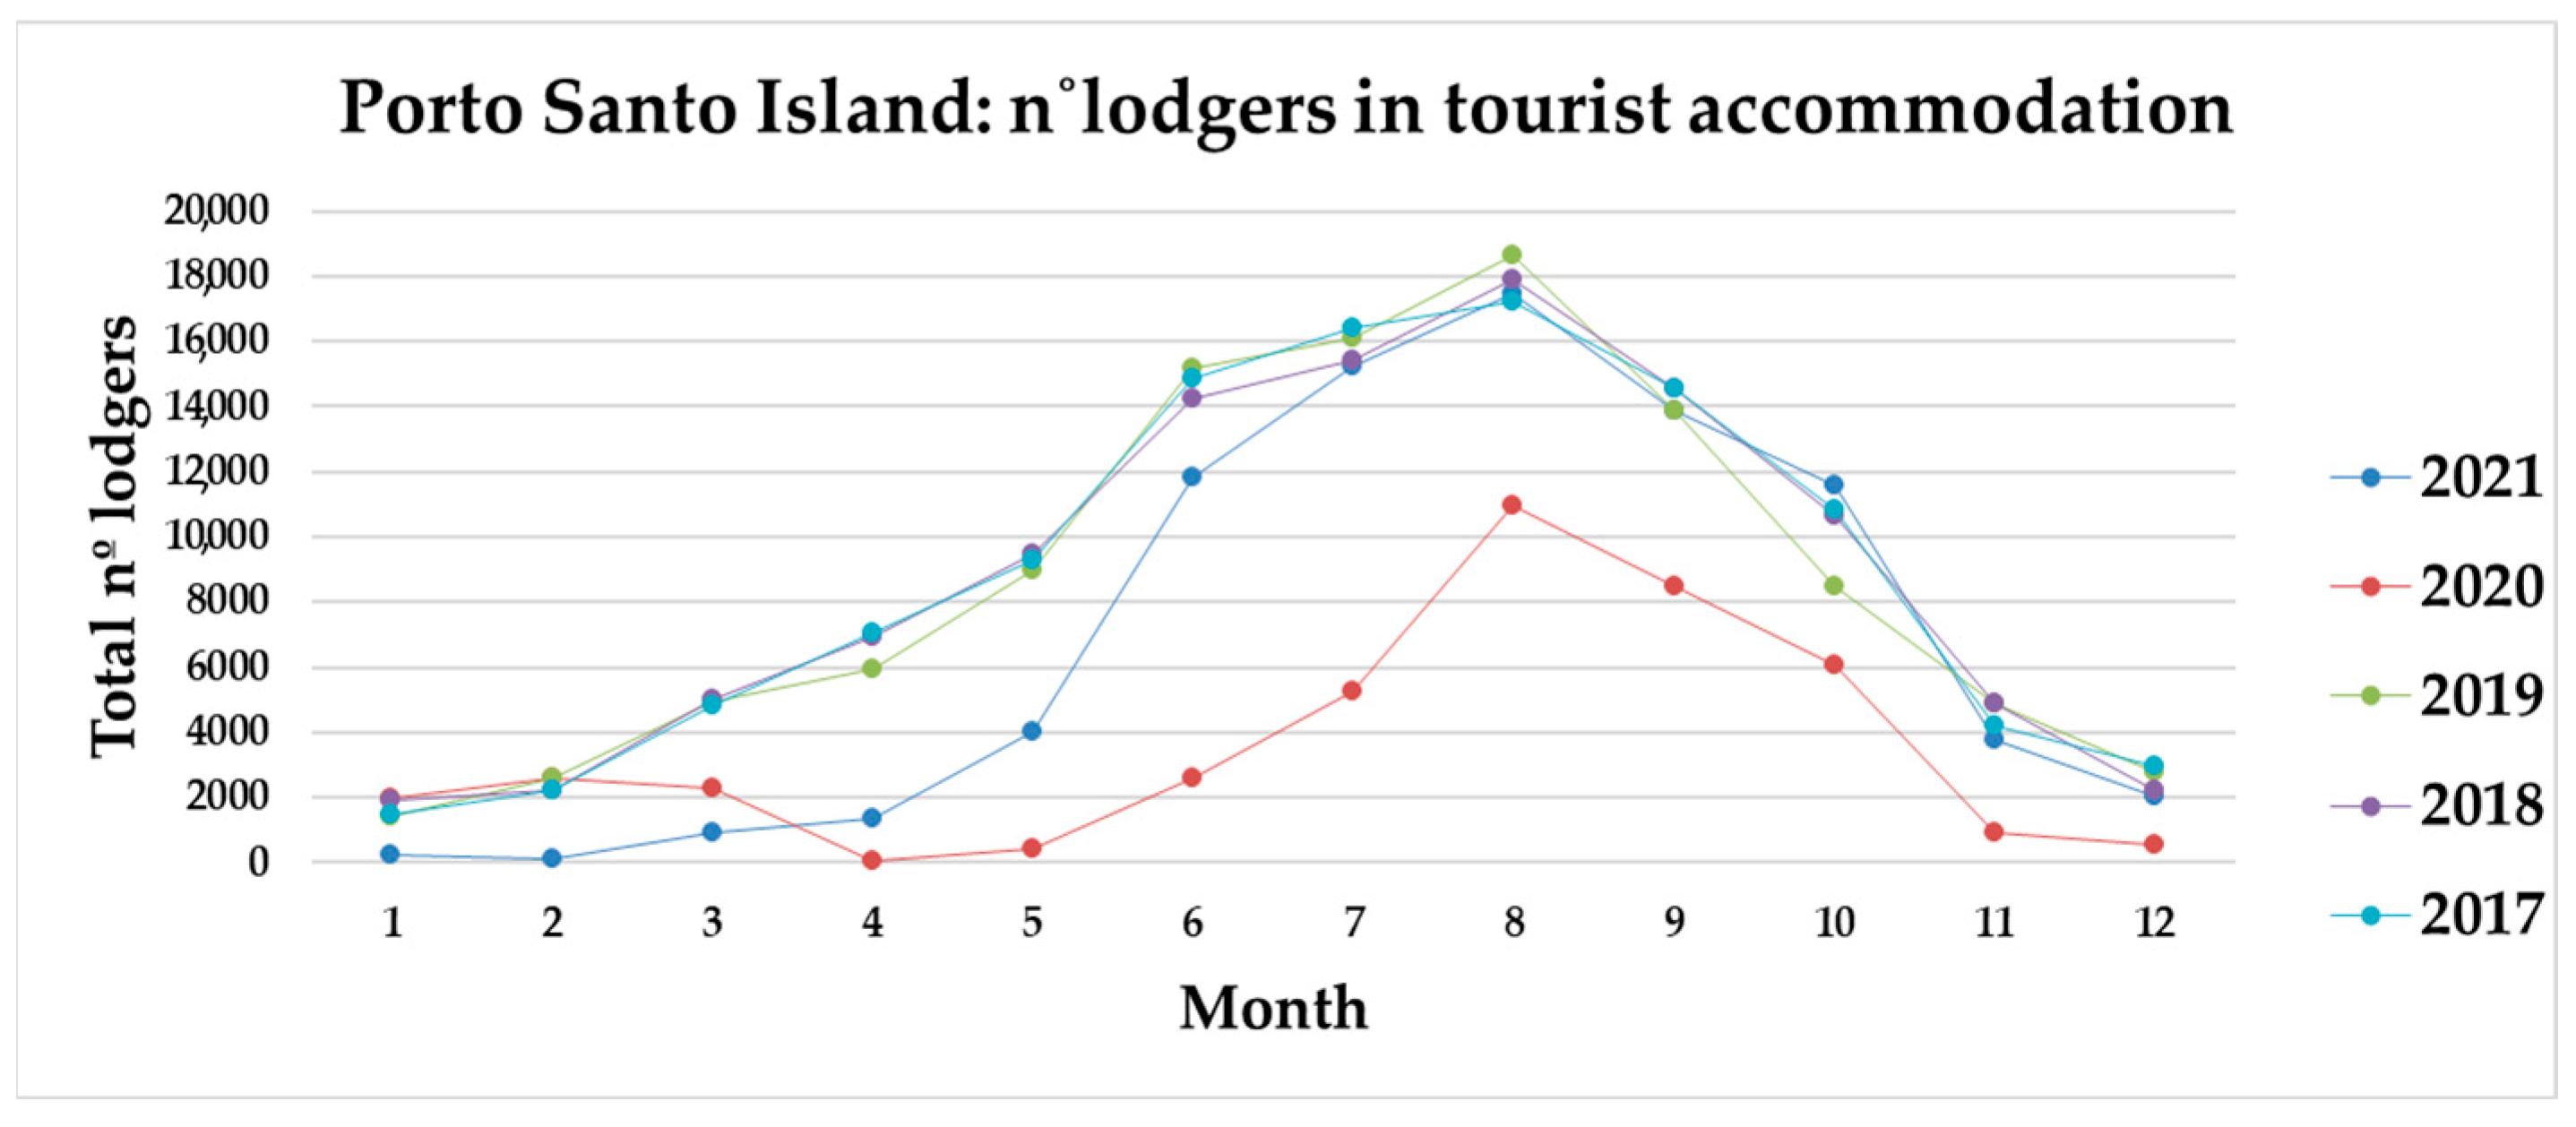
The Island of Porto Santo had 5149 inhabitants in 2021, and the total n° of lodgers in tourist accommodation was 82,495.
Figure 6 demonstrates the n° of lodgers per month on the island during 2021; the maximum value was achieved in August, with 17,451 lodgers, and the minimum value achieved was in February, with 144 lodgers [
25].
3. Results
3.1. Projection of the Production of Bio-Waste and Sludge in Porto Santo by 2060
Food waste represents approximately 32–62% of municipal solid waste and is expected to rise because of rapid urbanization and population growth worldwide. Considering the production history of MSW [
25], population projections until 2060 [
26], and the equations developed according to the production history of food waste, green waste and sludge, the production of raw material was designed to be valued.
The projected results of production by 2060, for urban solid waste and for each type of raw material to be fed in the anaerobic digestion unit that will be converted, is represented in
Figure 7. The total values include food waste, green waste, sludge, and sludge fractions.
3.2. Chemical and Physical Parameters of Bio-Waste
Which parameters were important to analyze was studied and, according to the state-of-the-art, the following parameters were selected and analyzed in the laboratory of ISQ:
The pH value, at 23 °C, obtained for food waste is 4.6, and for green waste is 8.1. Bacteria are very sensitive, and the ideal conditions for their proliferation, in terms of pH, are neutral to slightly acidic media (best conditions: 6.6 ≤ pH ≤ 7) [
21].
Regarding the anaerobic digestion process, the pH interval accepted by the bacteria involved in the process is between 5.5 and 8.5, although the closer to pH 7, the better the conditions for the bacteria. In this sense, considering the pH values obtained, it is recommended that there is a mixing tank of the raw material before the digester, to make the necessary pH corrections to a neutral pH value.
Anaerobic digestion takes place in two categories that are related to moisture content: dry digestion, with a typical total solids content (TSC) of 25% to 30%; and wet digestion, with a TSC (dry matter) typically less than 15%. In the case of the substrate being the bio-waste fraction of MSW, there is always a need to add water to lower the TSC [
27].
Dry digestion leads to smaller and, consequently, cheaper digestion reactors. However, these reactor savings can be offset by the higher inherent cost of pumping equipment required to move denser material. Large TSC values also cause resistance to runoff at pipe level. This type of resistance causes great wear to mechanical equipment, so greater maintenance care is required.
Wet digestion systems tend to have better mixing and agitation, thus increasing the degree of digestion. They are also more conducive to co-digestion with more diluted substrates, such as residual sludge.
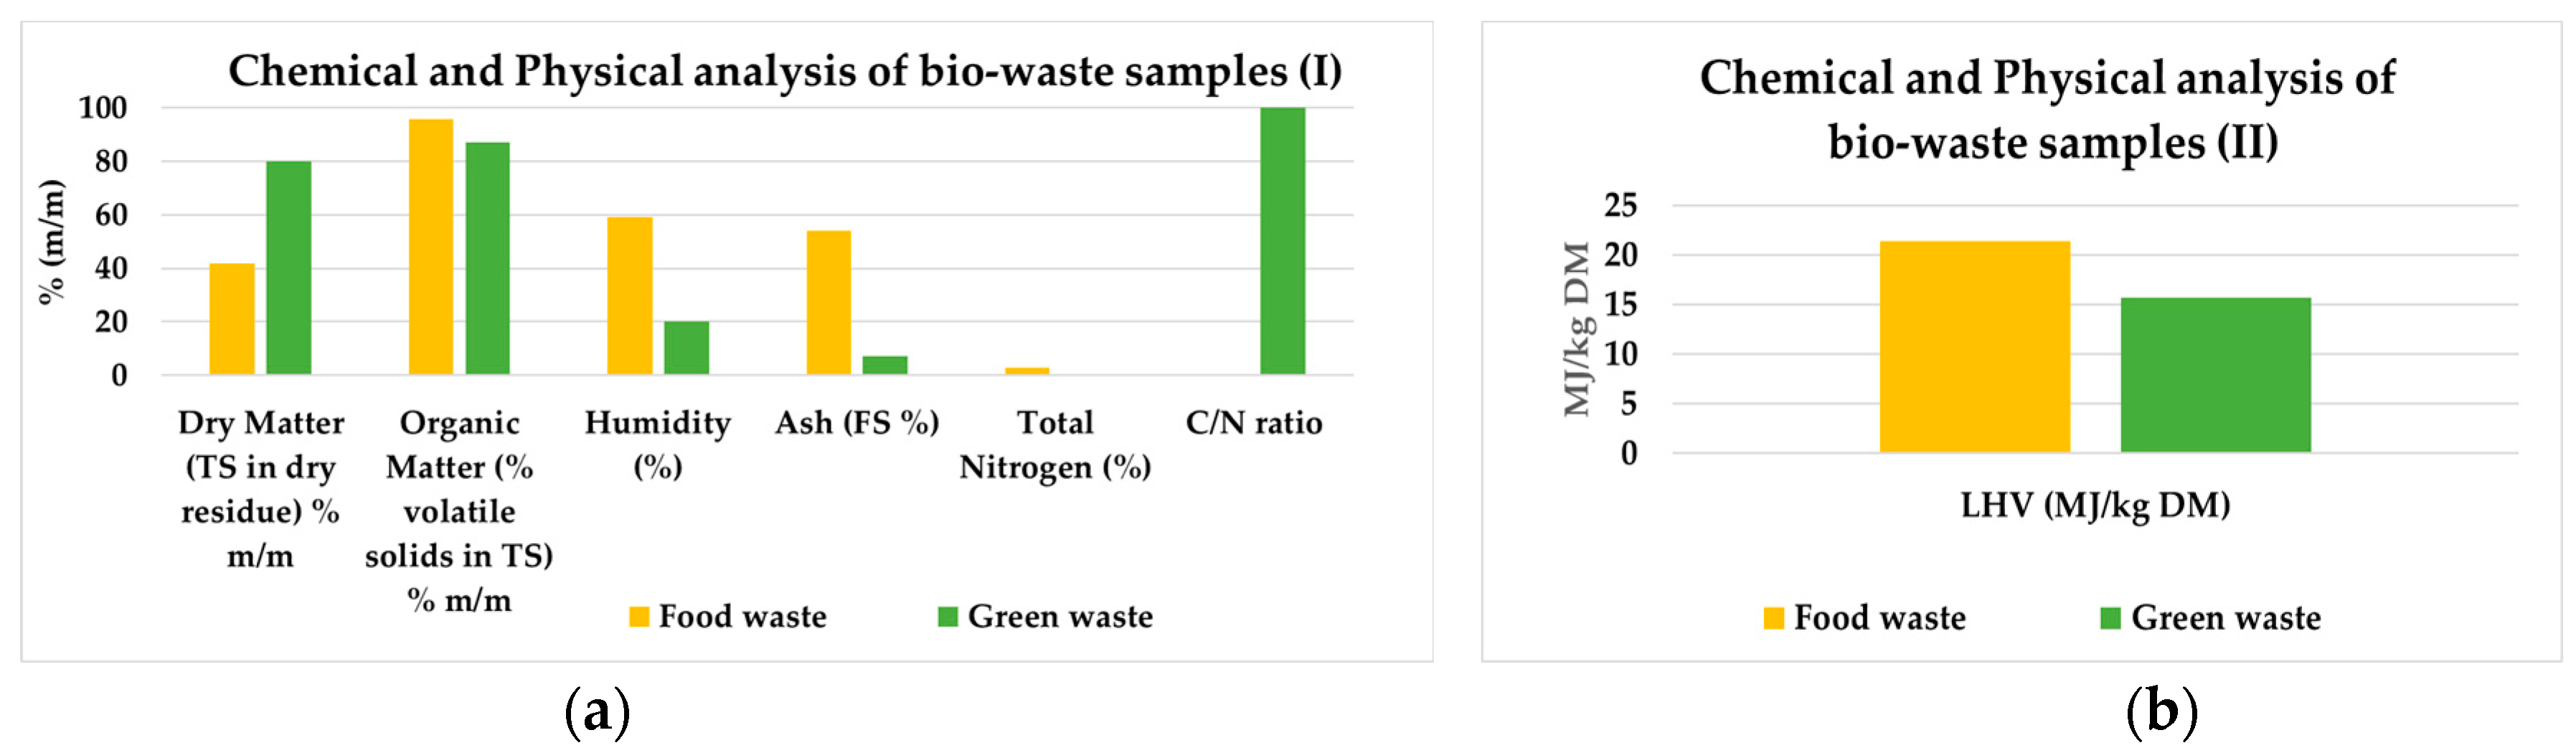
In this sense, given that the recovery unit is composed of co-digestion of bio-residues with more diluted substrates, the wet digestion system is recommended, and it is necessary to add water to lower the content of total solids in the mixture. It was verified in the results of the analyses shown in
Figure 8, that the C/N ratio of food residues is 7.0 and of green waste is 100. Since the C/N ratio of the substrate to be digested is not always at the ideal values, it is common practice to mix substrates, or add surfactants to the substrate before the digestion process. For example, a substrate with a high nitrogen concentration, such as food, will be corrected with a substrate with a high carbon content, to obtain a mixture with a C/N ratio within the ideal range. The percentage of volatile solids in total solids (organic matter) in the case of municipal organic waste, such as bio-residues, is 80–95%, and in the case of plant and green residues is 76–90%. Analyzing
Figure 8, organic matter values are in the order of 96% for food waste samples and 87% in the case of green residues, according to the literature.
The chemical and physical analyses of sludge sample 1 and sludge sample 2 are described in
Figure 9. The total phosphorus, potassium, and magnesium contents were determined according to BS EN 13346:2000 [
28], and could be beneficial for the formulation of an organic corrective compound for agriculture purposes from the digestate.
The pH, at 23 °C, of the sludge samples 1 and 2 were 7.2 and 6.9, respectively, the parameters analyzed, and values obtained are according to Decree-law No.276/2009 [
29].
The chemical analysis of heavy metals in sludge for agriculture purposes in
Table 3 demonstrate that the values obtained are according to the limit of concentration values in Decree-law No.276/2009 [
29], described in
Table 3.
3.3. Solutions for Bio-Waste and Sludge Valorization
The integrated solutions of biogas production, through the anaerobic digestion process associated with cogeneration for electricity production for self-consumption, and heat with energy integration in the heating of the mesophilic digester, were developed.
Two scenarios addressing the problem are presented:
3.3.1. Centralized Solution
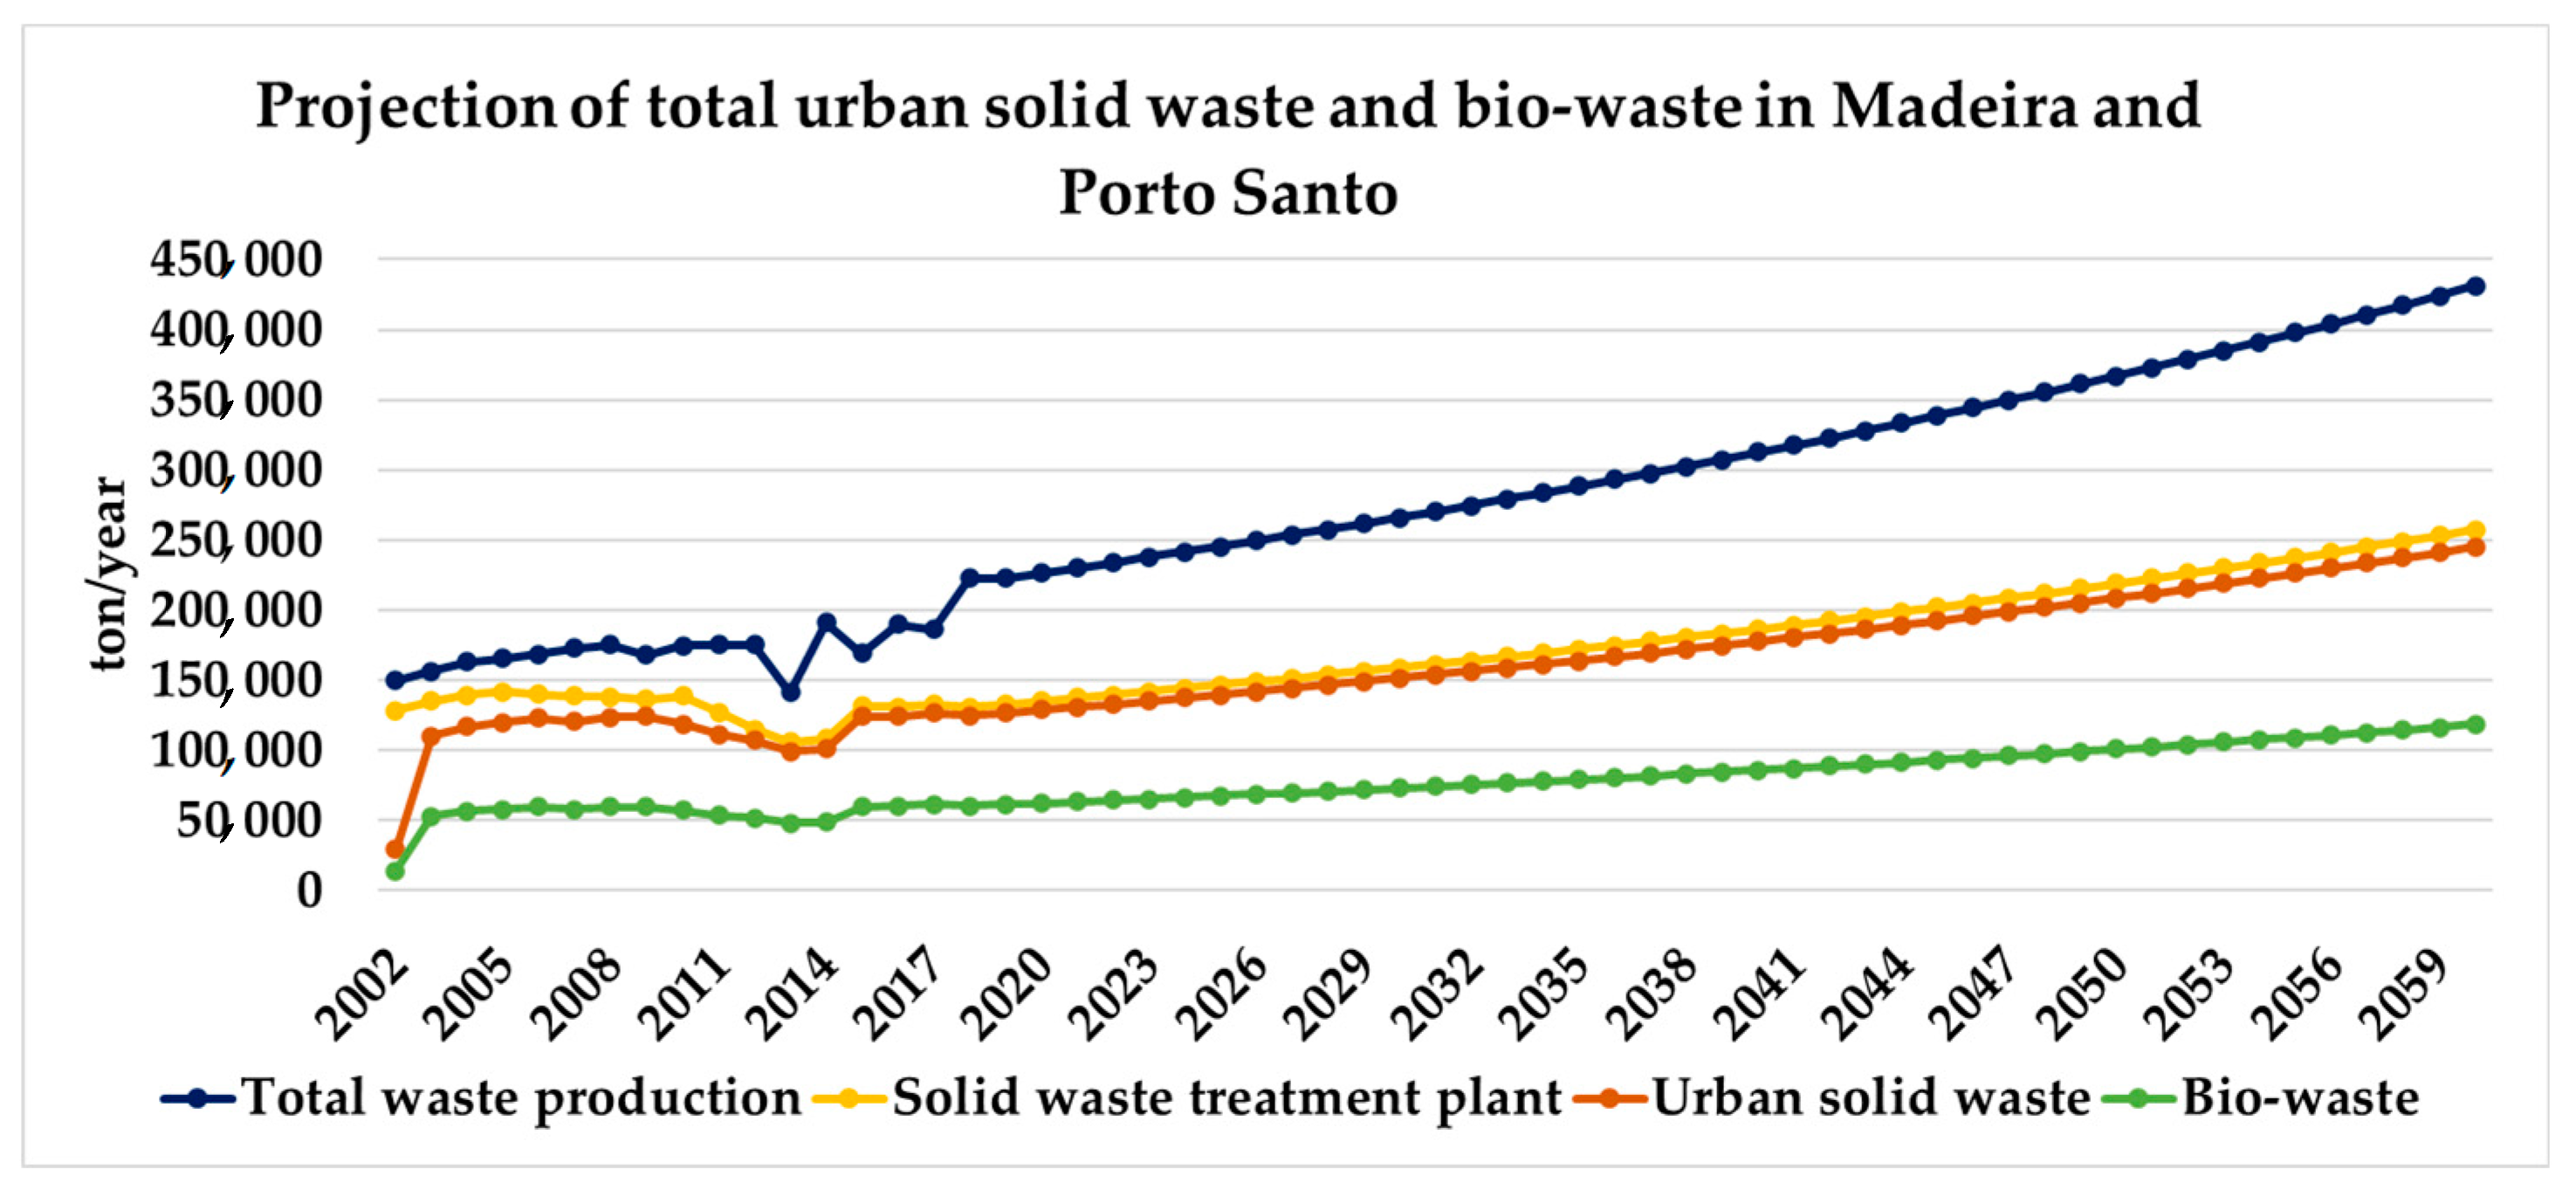
In this solution, the bio-waste produced on Madeira and Porto Santo Island is converted into biogas in Madeira. The total bio-waste is 64,224 tonnes/year, corresponding to 7.54 GWh of electricity generated from biogas and 12.14 GWh of heat recovered in the cogeneration unit. Total compost production is 16,474 tonnes/year.
Figure 10 demonstrates the projection of total bio-waste until 2060, and total urban waste generation, in Madeira and Porto Santo.
The bio-waste fraction is currently undifferentiated from the municipal solid waste and is sent to the existing incineration plant on Madeira Island.
3.3.2. Local Solution
This solution includes the recovery of bio-waste on the Island of Porto Santo through the anaerobic digestion process, and without transporting this waste to Madeira Island.
The two solutions analyzed reveal different advantages. In solution (a), the capacity of the unit is more significant, increasing biogas production; however, this fraction of waste is being sent for incineration in the solid waste treatment plant. Regarding solution (b), it was concluded that it could be more promising in the paradigm of the energy transition and the principle of the circular economy on Porto Santo Island, enabling the recovery of waste produced on the island without the need for the transport of the waste by sea.
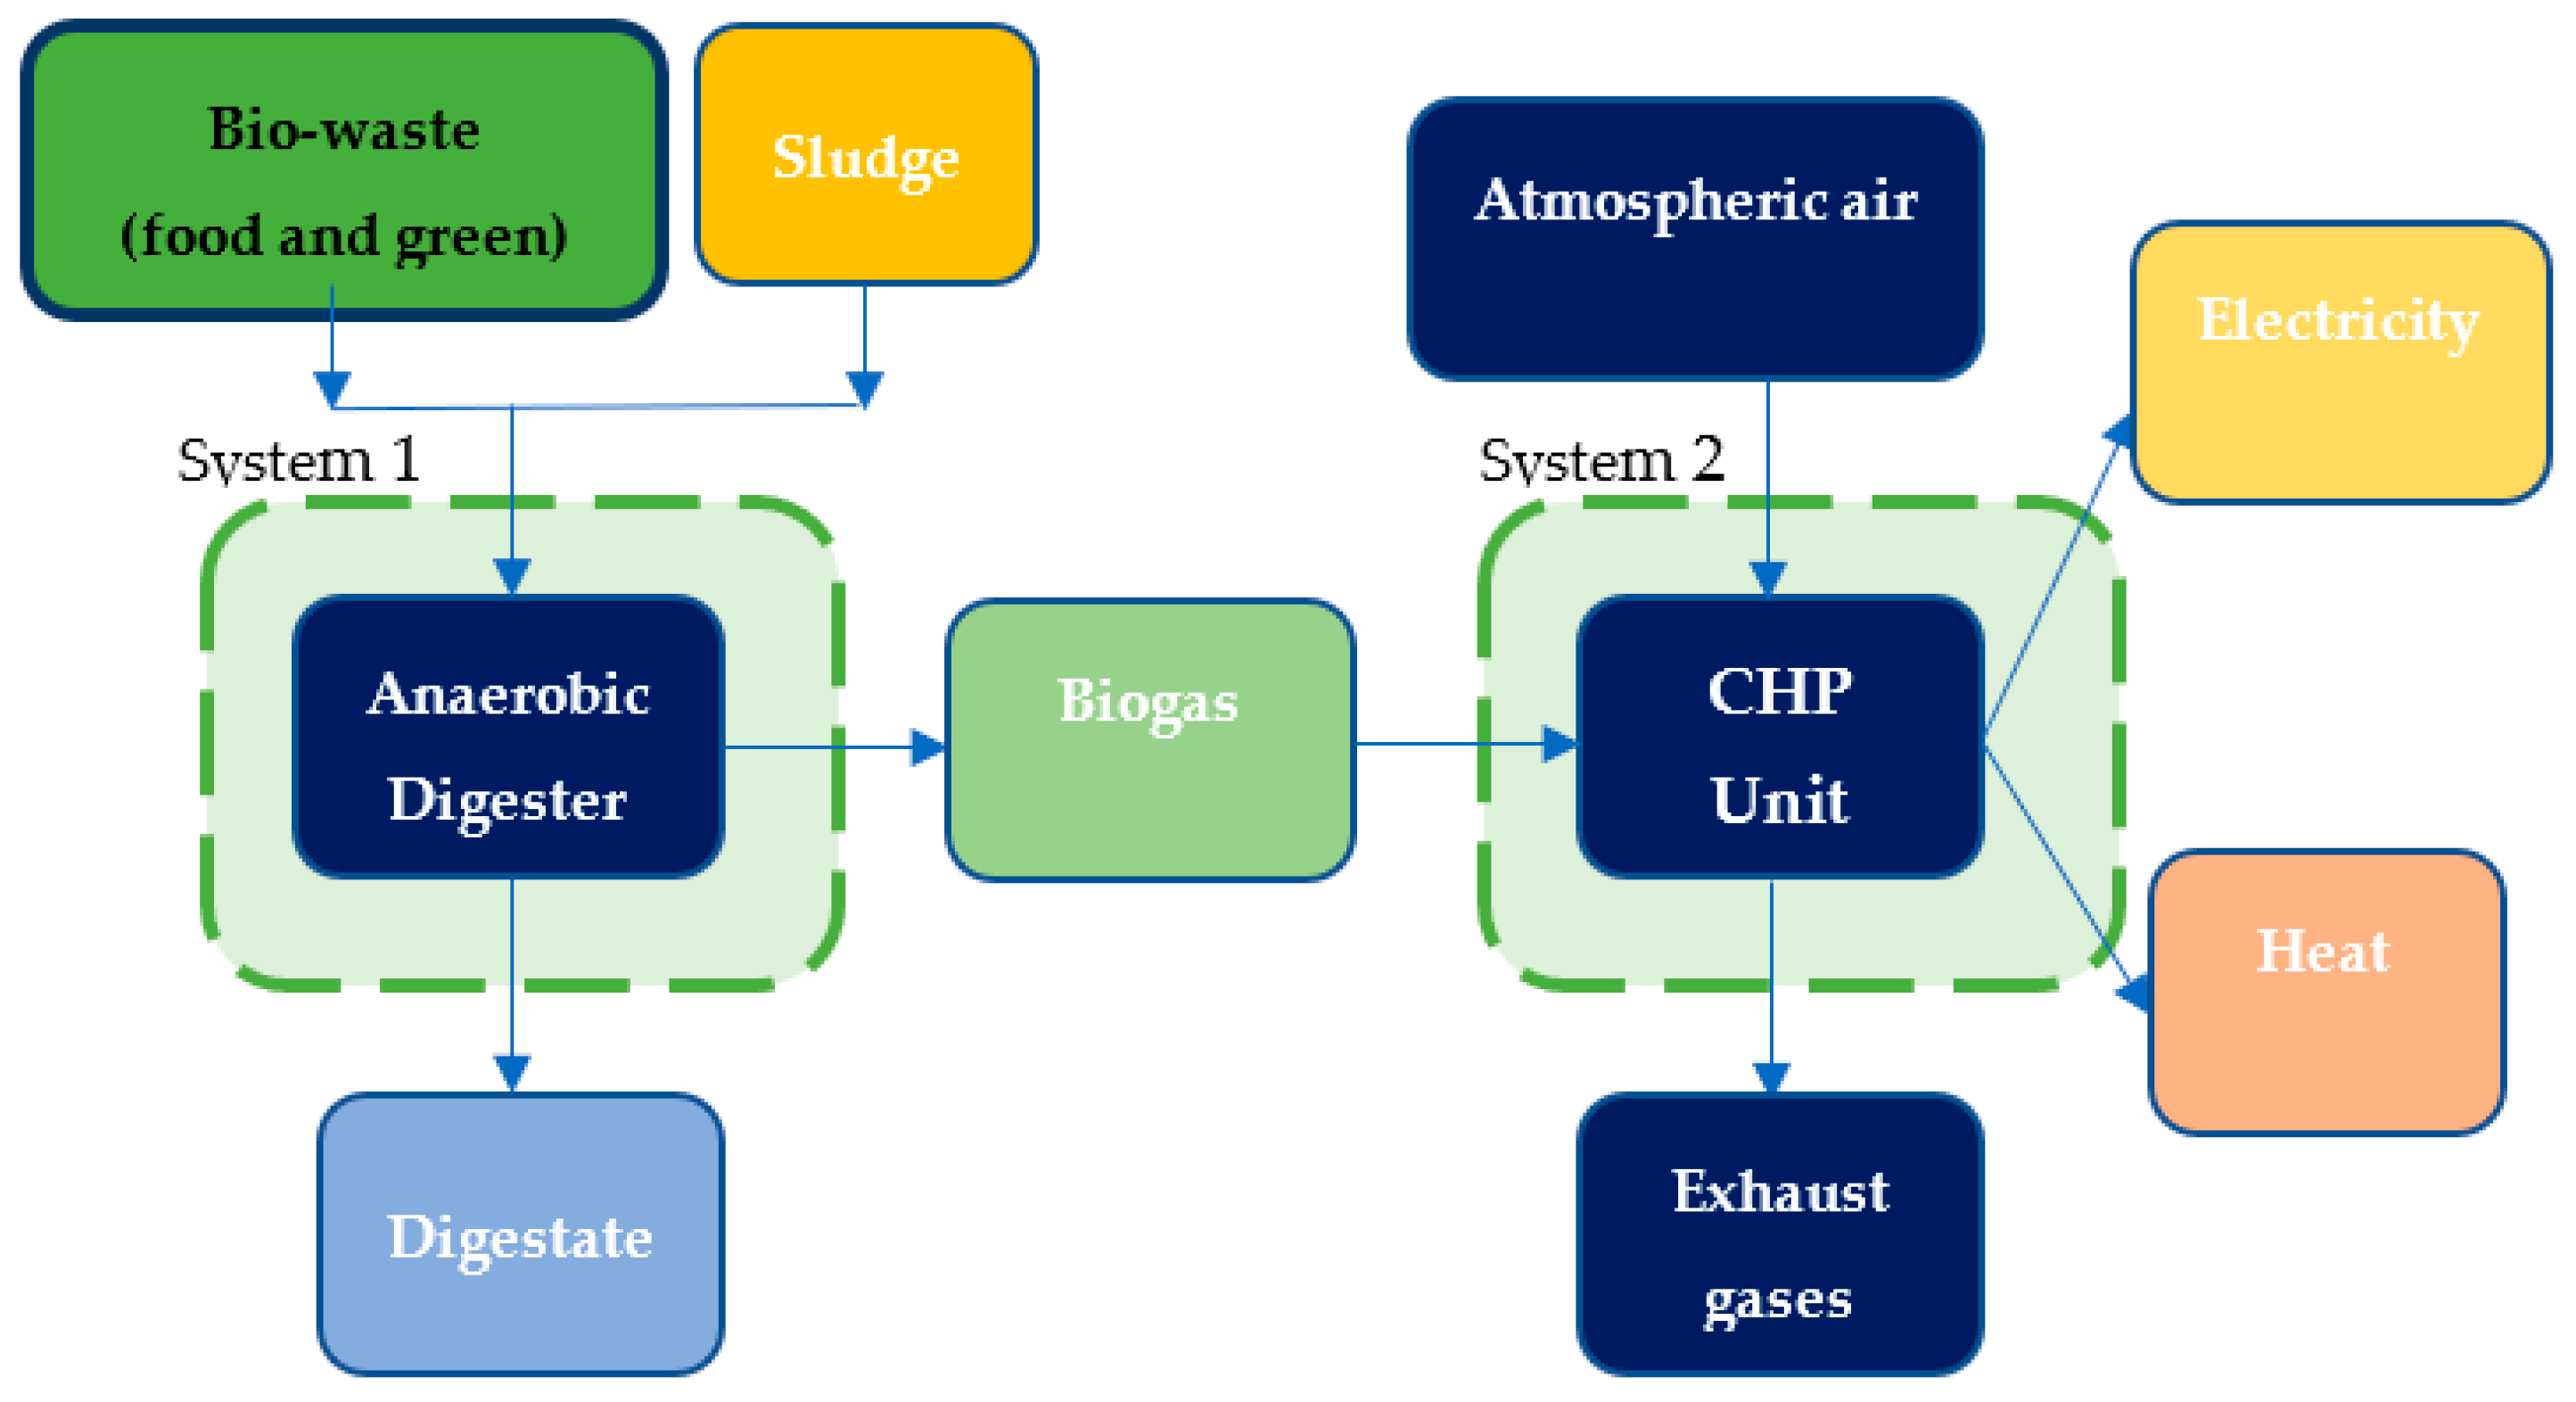
The process block diagram is represented in
Figure 11.
Considering the annual production of food waste and green waste shown in the previous sections, and according to the production projections of these by 2060, the total feedstock is approximately 4500 tonnes.
Taking into consideration the seasonality in the island of Porto Santo, there was an increase in waste production in August, due to the strong tourist activity on the island at this time of year.
Additionally, it was concluded that the minimum feed of raw material from November to April is on the order of 76 tonnes/month, and within the months of May to October is 141 tonnes/month, however these values do not include the data of green waste production.
3.4. Detailed Description of the Process
By analyzing the data described in the previous sections, the following components of the process are proposed:
Sorting at the reception of waste
Waste crusher
Mixing tank for dilution and homogenization of waste
Continuous feeding mesophilic anaerobic digester and complete mixture with 35-day HRT
Compressed gasometer
Heat and electric power generator with an installed power of 181.3 kW
Pasteurization/sanitization unit to comply with digested sanitary standards before composting
Digest tank
Centrifugal separator of the liquid and solid fraction of the digested substrate for reuse of the liquid fraction.
In this sense, according to the block diagram of the process represented in
Figure 8, a detailed description of each of the stages of the pre-treatment process of the raw material was carried out:
3.4.1. Storage
The storage of waste received, especially food, must comply with the standards defined in Decree-Law No. 73 of June 17 2011 [
1].
3.4.2. Triage
Sorting is essential in order to ensure the separation of contaminants, such as packaging that packs food, metals, glass, and other materials that are not digested in the anaerobic digestion process. These materials can be removed by mechanical, magnetic, or manual means.
3.4.3. Waste Crusher and Waste Mixing Tank
The crusher is necessary at this stage of the process in order to homogenize the mixture at the inlet of the digester, and a mixing tank is necessary to correct the solids content by adding water (with a dilutive effect), the pH of the mixture, and the temperature. According to Nagarajan et al. [
30], raw materials such as biomass waste could be treated in an hydrodynamic cavitation before the anaerobic digestion.
3.4.4. Anaerobic Digestion
The anaerobic digestion is carried out in closed reactors, the potential green exhaust gas emissions of CH
4, N
2O, and NH
3 were calculated according to the IPCC’s global warming (GWP) potentials as CO
2 equivalent emissions. The methane fraction is sent to the CHP unit, where the unburnt methane is calculated. Emissions of N
2O and NH
3 into the atmosphere are significantly lower and easier to control than those resulting from composting. According to Bisschops et al. [
31], each tonne of bio-waste sent to the anaerobic digester produces biogas with a conversion into methane (CH
4) dependent on the type of raw material. In this case, the average conversion into biogas was calculated according to the tonnes of food waste, green residues, and sludge separately.
Due to the potential for energy recovery of biogas associated with the potential of production of compost (especially in the field of treatment of selectively collected bio-waste), the anaerobic digestion solution is the most environmentally and economically beneficial recovery technique [
32]. It was verified that with the load of 2868 tonnes/year of raw material in the recovery unit, 272,221 m
3/year of biogas could be produced.
The processing and recovery of this waste on the island of Porto Santo represent EUR 119,452 savings in maritime transport.
The anaerobic digester selected, according to the state-of-the-art, has the following characteristics:
Moisture Content: Wet Way
Temperature Range: Mesophilic
Number of Process Steps: One Step
Digester Feeding: Continuous
The digester will have a continuous digestion, and a reduction in the total solids content of organic waste will be made by refeeding the liquid fraction of the anaerobic digestion product, resulting from a post-treatment through the solid-liquid separator. The recirculation of the digested liquid fraction provides an increase in the digester’s yield.
According to these characteristics, and Vandevivere et al. [
33], a Complete Mixing Digester (CMD or CSTR) is proposed. This selection is justified by having a stirring and mixing system that allows a more efficient contact between the substrate and the microorganisms responsible for anaerobic digestion [
34].
The shape of the anaerobic digester is a factor that influences its energy performance, namely in the exchange of heat with the outside, and to reduce the costs associated with the material. In this sense, the Complete Mixing Digester was selected to be cylindrical, and, in order to minimize the lateral area, the diameter of the base of the digester will have the same value as the height.
It is recommended to use a constitutive material stainless steel, and to have thermal insulation 80 mm thick, which is commercially available, and a steel sheet cover, in order to ensure thermal insulation.
These materials will provide a long service life, good structural stability, and an excellent tightness while still having a relatively simple construction. The mesophilic temperature range is optimal for these types of waste fractions. According to Ortega et al. [
35], there could a thermophilic adaptation into reactors that operate at a mesophilic range.
3.4.5. Digester Sizing
The required volume of an anaerobic digester is obtained according to a relationship between the volume of residue to be converted and the hydraulic retention time (HRT) in days. This relationship is translated into the following equation:
In which: Volume of the anaerobic digester (m3), Total volume of residues to be converted per year (m3/year), HRT is the hydraulic retention time (35 days), and PF—Operating period (325 days/year).
The total volume of waste to be converted per year was obtained knowing that 2868 ton of waste entered the unit in 2022, whose mass density is 570 kg/m3, corresponding to 5032 m3/year of waste to be converted.
Considering 35 days HRT, as selected in the previous section, and a period of operation of the anaerobic digestion unit of 325 days, through the application of Equation (13), it was determined that the minimum volume of the anaerobic digester to be installed in the CPRS of Porto Santo to enhance food bio-waste is 542 m3.
The volume of the anaerobic digester should contain some free space in its dome for biogas retention, so the digester should have an extra volume of 10% [
36].
In this sense, the final volume of the digester to be installed should be 596 m3. It is normal to have a solids content between 20% and 30% at the beginning of the process, when using materials such as plant waste and food waste. By adding solid-liquid materials, it is possible that the material at the entrance of the biodigester can be continuous, which is advantageous for microorganisms, as there will be a uniform distribution of material throughout the day.
This facilitates the interactions between the different groups of microorganisms in the degradation chain and also reduces the risk of overload if they feed with a large amount of material at once [
27].
In case it is necessary to reduce the solids content to 14%, it is recommended to add a greater amount of water in order to dilute the raw material in the mixing tank at the inlet of the digester.
At the exit of the anaerobic digester, at the top is the biogas (gas fraction) and at the base of the digester is the digestate (liquid-solid fraction).
3.4.6. Digestate
At the base of the digester, the digestate is usually rich in phosphorus, potassium, and nitrogen, thus containing the essential nutrients for plants and soil correction.
Its high content of volatile fatty acids, that may be phytotoxic, imply that its direct use is not appropriate, and liquid and solid fraction separation equipment is required.
3.4.7. Digestate Storage
The amount of digestate resulting from the digestion process after the pasteurization phase will be stored in a reservoir with a maximum retention time of eight days.
3.4.8. Solid-Liquid Separation
To make the anaerobic digestion product safe, and of a quality for future use of the compound, it is necessary to carry out a pasteurization/hygiene post-treatment [
37].
This process ensures compliance with community rules on human health, described in Regulation No 1774/2002 of 3 October [
38]. This Regulation lays down the following minimum requirements for digested feed in the composting plant:
Maximum particle size before entering the composting reactor: 12 mm;
Minimum temperature inside the pasteurization unit of 70 °C;
Minimum retention time of one hour, without interruptions, at this temperature
After the pasteurization phase, when the quality of the digested substrate is assured, a process of separation of the liquid phase and the solid phase should take place.
The liquid fraction is recirculated to the anaerobic digester in order to dilute the raw material fed to the digester, in order to reduce the content of solids in the digester and avoid large water flow rates [
39]. The equipment chosen for this separation is a solid-liquid separator screw press.
Table 4 shows the results obtained and the quantities of digestate and compost produced.
3.4.9. Biogas
The determination of the amount of biogas produced was made taking into account the biogas yield of each type of raw material: food waste, green residues, and sludge according to [
40].
According to the RNC [
41], PERSU II [
42], and RNBC [
43], carbon dioxide emissions should be reduced by 2050. For this purpose, biogas could be considered as an energy transition solution that mitigates climate change [
44]. Organic waste fractions to produce biogas could be managed according to the legislation [
45,
46,
47,
48,
49]. The low heating value of biogas was calculated based on the bibliographic analysis performed on the expected composition of biogas produced by the digestion of bio-residues, and also of a part of the organic fraction of municipal solid waste. The average value obtained was LHV = 21 MJ/m
3. The anaerobic digestion unit produces 272,222 m
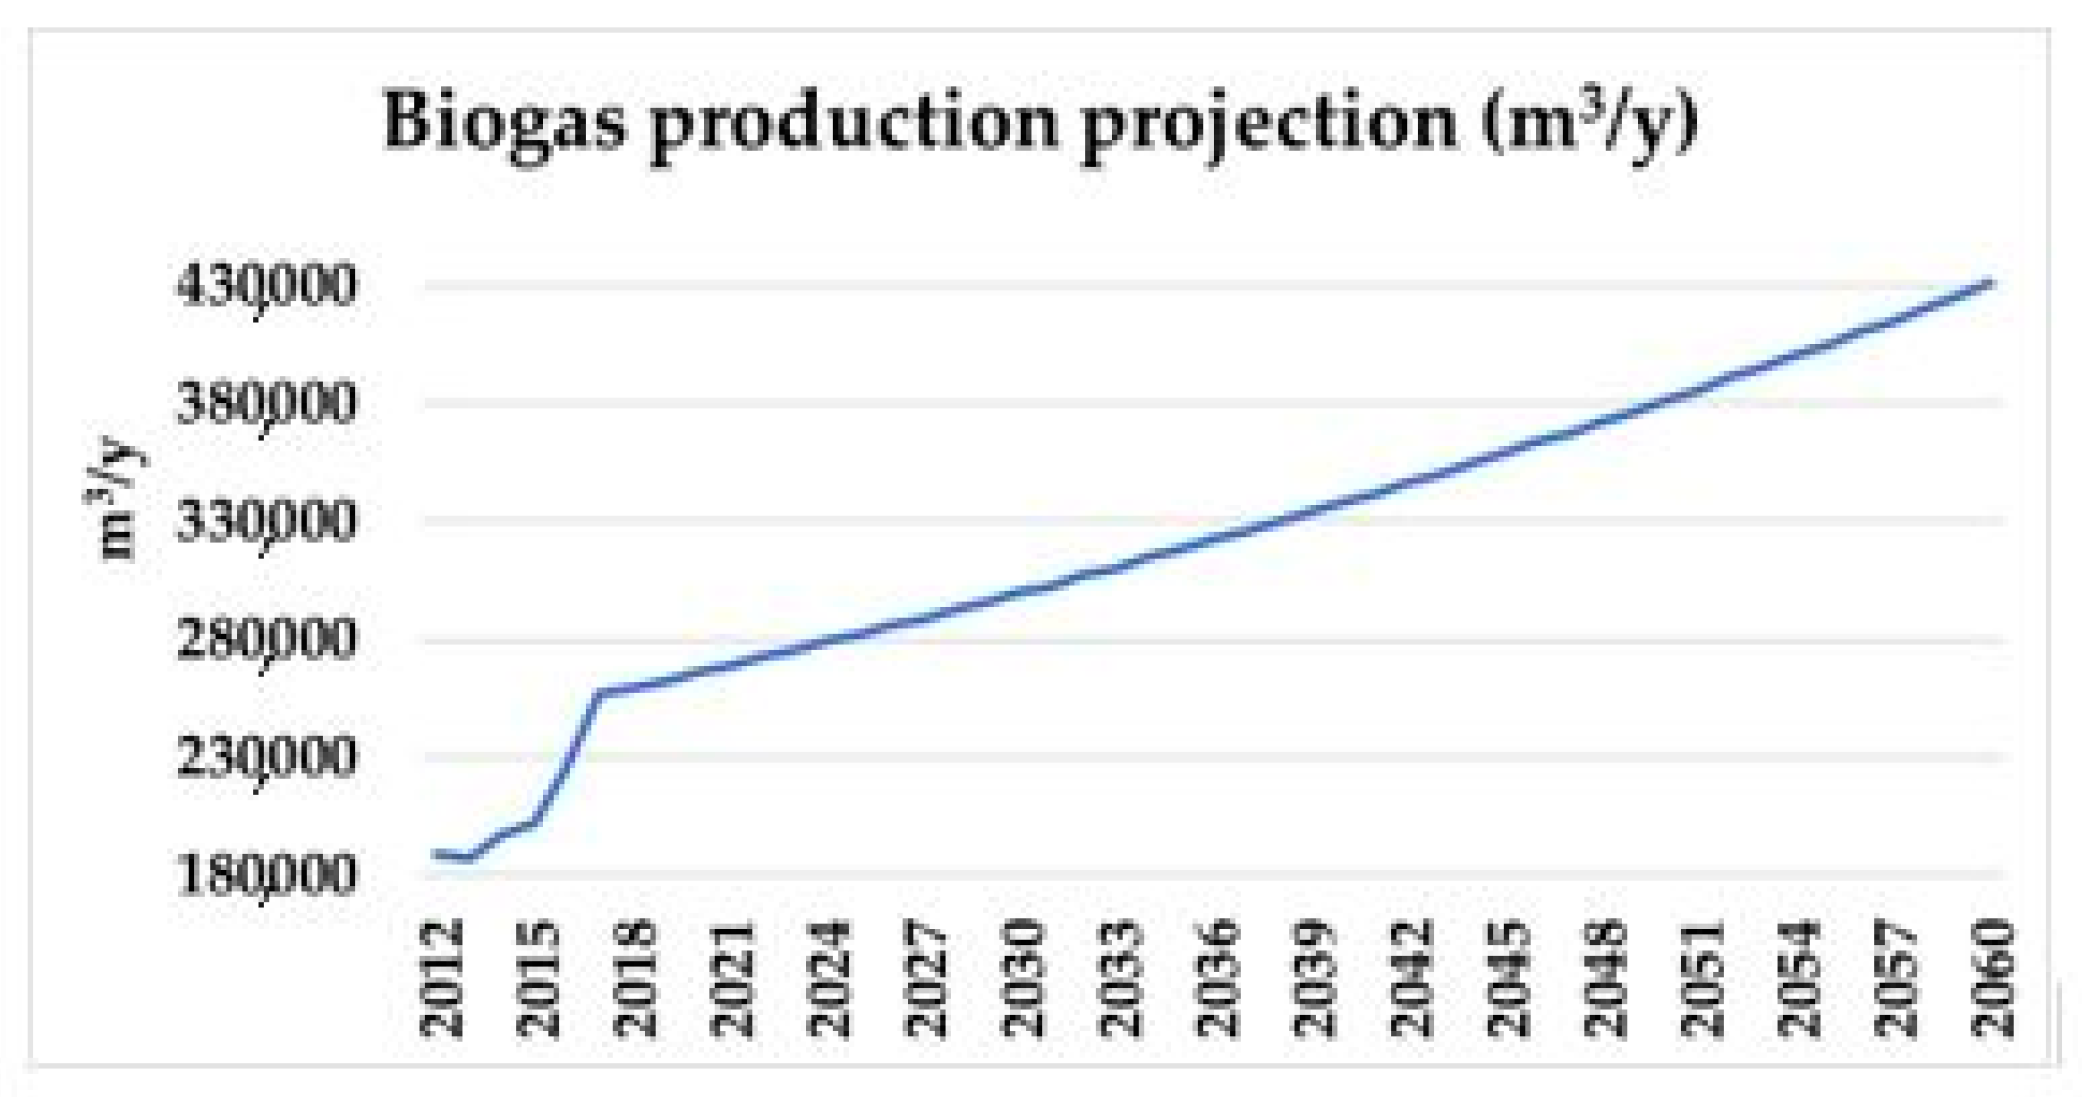
3 of biogas, equivalent to 5717 GJ/year. The total production of biogas was calculated and projected for 2060 in
Figure 12.
3.4.10. Cogeneration
The biogas flow produced is 272,221 m3/year and is used in the cogeneration process for electricity and heat production.
3.4.11. Production of Electricity and Thermal Energy
The production of electrical and thermal energy is in a CHP unit where 21% of the energy contained in the biogas consumed is transformed into electric energy and 34% into usable thermal energy [
50]. The biogas CHP unit has a total efficiency of 55%.
The power installed in the CHP unit is based on the annual energy contained in the biogas to be consumed continuously over the year according to Equation (14). For this calculation, maintenance stops and seasonal variations in biogas production were not included.
According to
Table 5, the total electricity that can be exported is about 70% of the converted energy, which corresponds to 232 MWh, and the total thermal energy exported is about 80% of the thermal energy recovered through cogeneration, which corresponds to 433 MWh.
This thermal energy is the total energy that the CHP unit produces, however the energy value available for heating the digester and pasteurizer can be calculated knowing that:
In which: Qr is the heat necessary to provide to the waste, m is the mass of waste to be digested (tonnes/year), C is the specific heat of the waste (kJ/kg °C), and ΔT is the temperature difference between the wastes that are fed to the digester.
Considering the temperature difference of the exhaust gases of the cogeneration unit of 300 °C, and a temperature inside the digester of 35 °C [
51], the mass thermal capacity of the exhaust gases of 1.045 kJ/kgK [
52], and a mass of 2868 ton/year of raw material (waste) at the inlet of the digester. Furthermore, the value of 794.3 GJ/year of thermal energy available for heating the digester and pasteurizer was obtained, which corresponds to 220.6 MWh.
3.5. Economic Feasibility Analysis
The economic viability of the solution concerns the initial investment, production costs, and revenues. According to Jacinto S. [
53], it is possible, through values indicative of the costs of implementation of anaerobic digestion units per unit of installed power, to calculate the cost of the initial investment including direct and indirect costs.
3.5.1. Initial Investment
The investment includes the direct costs related to the base equipment for the digestion unit: mixing tank, digester, pasteurization unit, digested storage tank, gasometer, pipes, and solid-liquid separator and for CHP unit, and includes instrumentation and control, electrical installations, buildings and structures, services, thermal insulation, and terrain.
The indirect costs of the investment include the costs of design, and supervision from the construction and provision of unforeseen events.
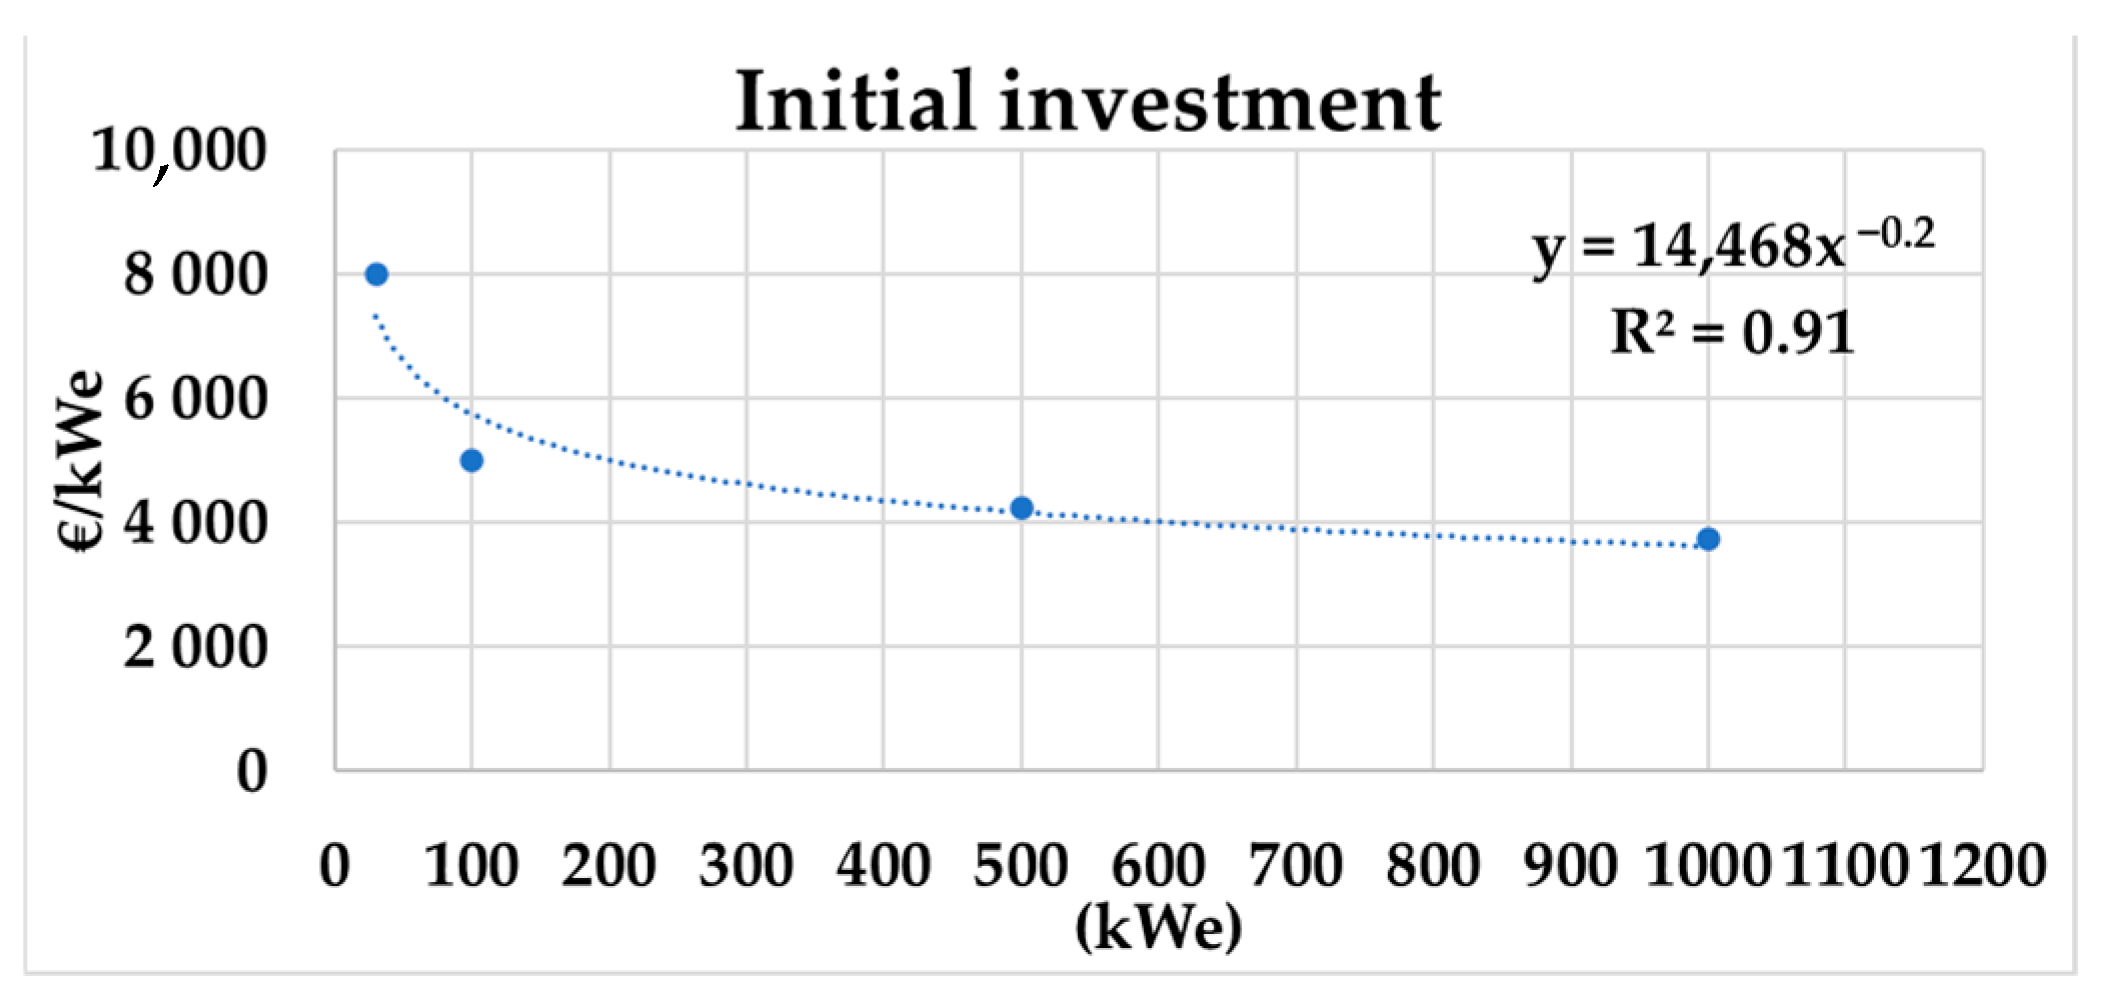
Figure 13 demonstrates the trend in the initial investment calculated as a function of the electrical power installed in the anaerobic digestion unit.
The best function that represents the variation of the initial investment with the installed electrical power is as follows:
According to bibliographic analysis and
Figure 8, it is concluded that the required investment increases for smaller anaerobic digestion units.
It was found by the representation of the electrical power installed in anaerobic digestion units that the feasibility will be greater for large units than smaller anaerobic digestion units.
Considering that in this study the total installed power is 181.3 kW, which corresponds to 65.2 kWe, through Equation (15) it was calculated that the initial investment required is 6273 €/kWe. In this sense, the initial investment of the plant to value bio-waste (green and food) and sludge on the island of Porto Santo is EUR 409,372, for the installed electrical power of 65.2 kWe. The initial investment is composed of all the direct costs that relate to the physical costs of the plant recovery unit of bio-waste (food and green waste) and indirect costs of the investment.
The indirect costs of the investment are related to the project, supervision, expenses of work, and provision of unforeseen events.
The costs inherent to the components of the initial investment were calculated based on the structure of the direct and indirect costs set out in
Figure 14.
According to
Figure 14, the share of the base equipment is the most significant of the structure of direct costs, representing 46% total of these costs. The results obtained for the different portions that make up the initial investment are shown in
Table 6.
3.5.2. Production Costs
Utilities: Consumption of Thermal Energy and Electricity
The utilities were calculated from the point of view of electricity consumed and thermal energy.
First, the thermal needs raised are concentrated in the heating of food, green, and sludge waste that is at room temperature, up to the digester temperature of 35 °C. According to the legislation in force, there are also thermal needs in the post-treatment of the digestate, that should be heated up to 70 °C in the pasteurizer. The consumption of thermal energy, taking into account the load of waste fed per year, is 157.7 MWh, knowing that on average represents 55 kWh per tonne of fresh organic waste, which corresponds to 567.9 GJ/year.
In terms of electricity consumption and a literature review, the energy-consuming equipment is shown in
Table 7. These are the equipment to be used in the proposed anaerobic digestion unit.
The equipment chosen is based on the purpose of waste treatment, meeting the requirements in the installation. According to
Table 7, the electrical energy consumption of the equipment of the anaerobic digestion unit is 907.2 MJ/day, which corresponds to, with the 325-day operating period, 294.8 MJ/year, equivalent to 81.9 MWh/year.
Table 8 represents the results obtained.
The results represent a greater potential of thermal energy that can be sold to public, private spaces, or even in the heating of the swimming pool of a hotel unit or school. This analysis is annual, it is recommended to deepen the real potential of this energy to be used in the colder months, directly.
Regarding consumption and production values, it is verified that 25% of the electricity and 29% of the thermal energy produced through biogas is for self-consumption.
The energy consumption in 2017 on the island of Porto Santo in the domestic sector was 1229.8 kWh/inhabitant [
64]. It was concluded that the electricity obtained in this anaerobic digestion unit would be capable of serving about 204 inhabitants/year. This installment represents a cost of EUR 8248 /year in production costs.
3.5.3. Revenues
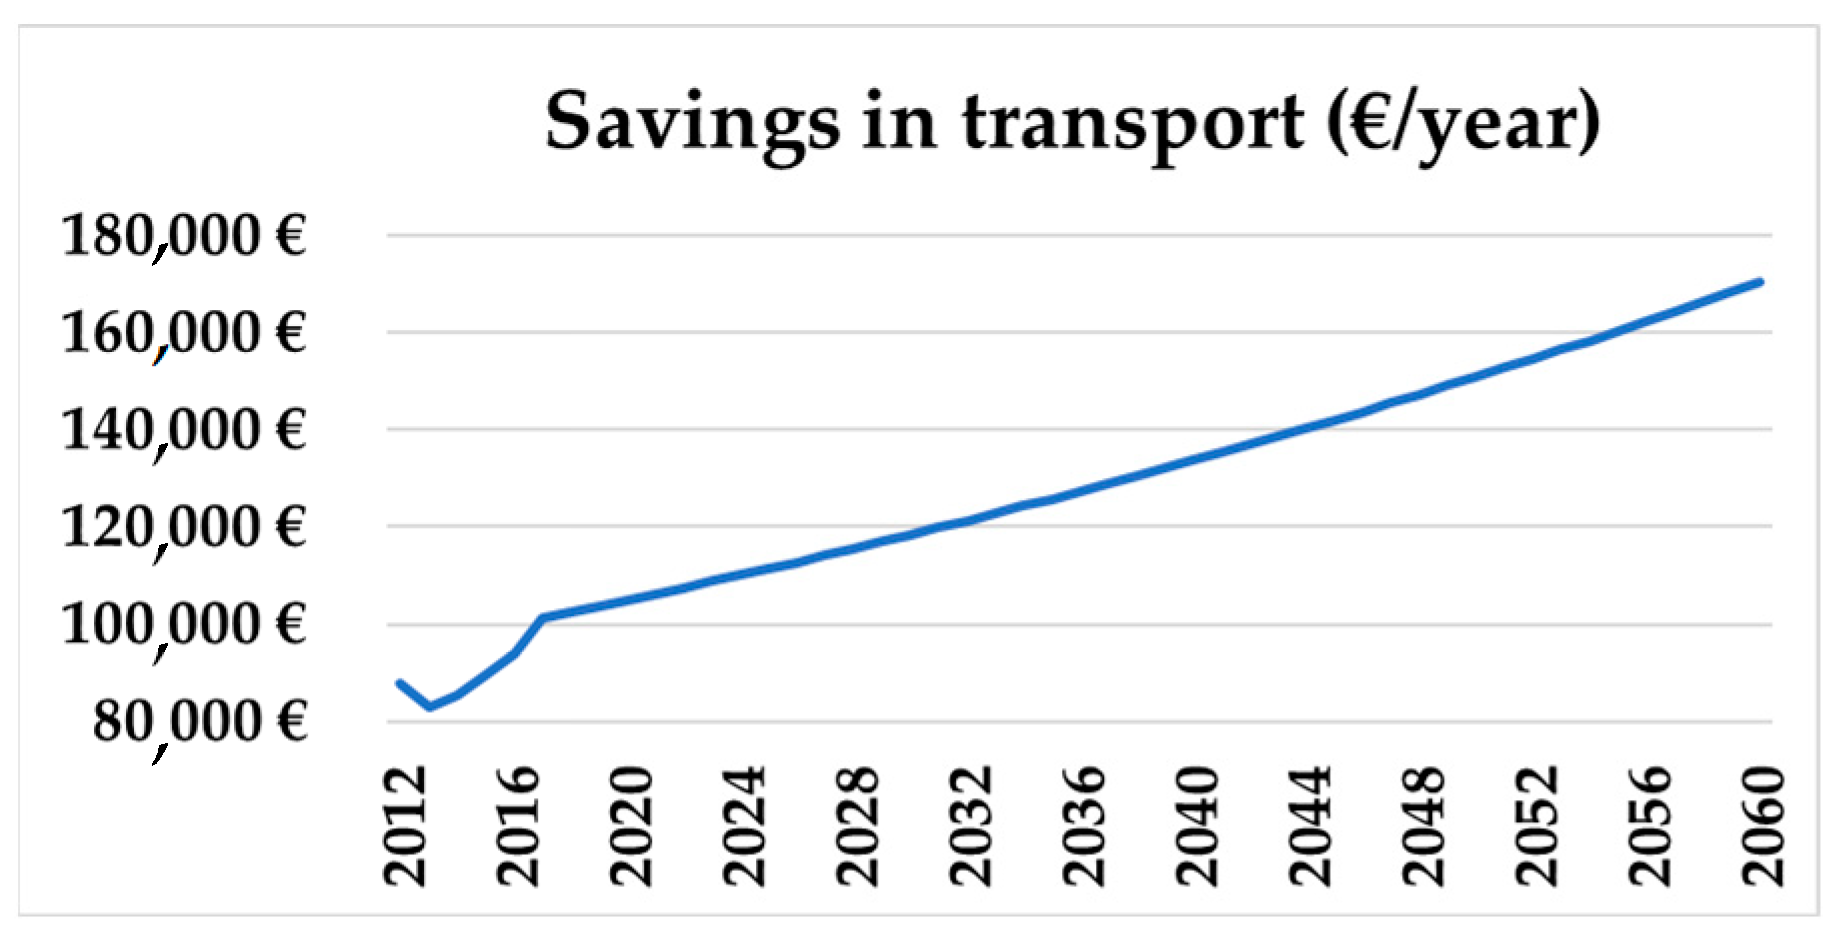
Savings on Maritime Transport to Madeira Island
Currently the fraction of food waste existing in undifferentiated municipal solid waste is transported by sea from the island of Porto Santo, where it is produced, to Madeira island. In this sense, according to the unit cost of transport for each tonne of waste, the savings in transport in the case of the installation of the food waste recovery unit in Porto Santo Island were calculated.
Figure 15 represents the savings in maritime transport of food waste.
The saving in the maritime transport of bio-waste, due to its recovery on the island of Porto Santo, was EUR 119,452.
Harnessing Energy for Self-Consumption
In this scenario, 81.9 MWh produced are intended for electrical energy consumption of the digestion unit, and the thermal energy consumption is 157.7 MWh. The cost of energy is 0.1007/kWh, therefore, the cost of the utilities was calculated to be EUR 8248, this cost ceases to exist in the case of self-consumption [
65].
Use of Energy for Injection into the Electricity Grid
According to Decree-Law No. 25/2013 of February 19 [
66], the electricity tariff produced using the recovery of waste by anaerobic digestion through biogas production is set at EUR 95.4 /MWh.
According to the values obtained for the useful production of electricity, 332.7 MWh, a remuneration of EUR 31,609 /year is obtained. If the energy for self-consumption is used, this amount is EUR 7813.5.
Sale of Thermal Energy
The thermal energy that can be sold is based on the tariff of EUR 0.035 /kWh with a loss of 10% in the distribution network, in total, EUR 18,974. In the case of self-consumption, there is a decrease in the sales flow rate of EUR 5521.1, but it saves on the utility costs.
This analysis is done assuming that all available thermal energy is sold throughout the year, for applications ranging from air conditioning to warm sanitary waters.
Biogas Used for CHP Unit
Using the anaerobic digestion process, 272,221 m3/year of biogas are produced. This gas flow can be pressurized and directed to a gasometer to improve its specification, and can serve as fuel for engine activation in the cogeneration unit with the objective of producing electricity and thermal energy.
Revenue from the Reduction of the Waste Management Fee
Decree-Law No. 73/2011, of June 17 [
1], indicates that a Waste Management Fee (TGR) is applied for each tonne of waste, or comparable, that is sent to landfill. This rate in the case of RAM is EUR 4.53/tonne. By valuing the fraction of waste through an anaerobic digestion unit, it is intended to avoid this cost, simultaneously with the value of the waste management operation, thus being a source of revenue. Taking into account that in the proposed anaerobic digestion unit the recovery of 2868 tonnes per year is envisaged, there is a remuneration of the waste management fees of EUR 93,306.
Carbon Credits (CER and GHG Landfill)
Since the Kyoto Protocol, the Clean Development Mechanism (CDM) and the carbon credits market have been created. The CDM carbon credit is called Certified Emission Reductions (CER).
One CER corresponds to one tonne of equivalent carbon dioxide, which is the result of multiplying the tonnes emitted of a GHG by its global warming potential [
67,
68,
69].
The global warming potential of CO
2 was stipulated as 1 [
70] and the values indicated for GHG emissions from landfill corresponded to 0.69 and 0.54 kgCO
2 eq/kg of RSU, in which a CER is EUR 7.14. In this sense, in the case of 2868 tonnes/year of waste is equivalent to 1979 tonnes of CO
2 eq, i.e., 1979 CERs. The revenue stemming from carbon credits is EUR 14,131.
GHG Emissions from Anaerobic Digestion Plant, CHP and Composting
The emission factors of CH
4, N
2O, and NH
3 were calculated, according to the IPCC (2007), for the anaerobic digestion plant, CHP, and composting plant [
71].
N
2O and CH
4 are potential greenhouse gases, with global warming potentials (GWP) of 298 kg CO
2 eq/kg and 25 kg CO
2 eq/kg, respectively. According to Cuhls [
72] and Wulf [
73], the CO
2 equivalent of NH
3 is 2.98 kg CO
2 eq/kg NH
3.
Calculations were made according to Equation (14):
Table 9 demonstrates the total kg CO
2 eq calculated to be emitted from the anaerobic digestion plant, CHP, and composting.
The contribution of the unburnt methane in the CHP unit is 46 kg CH
4 released into the atmosphere. In the anaerobic digestion plant, the N
2O could be released from the liquid digestate, and methane could be released from composting, considering the content in the solid digestate [
74]. The 8031 kg of CH
4 calculated in the anaerobic digestion are sent into the CHP unit.
Sale of Compost
In the unit proposed in this study, the production of compost will be carried out. Its use offers agronomic benefits, such as improving soil structure, moisture infiltration, water retention capacity, soil microorganisms, and nutrient supply. The compound from cooking waste contains about 1% N, 0.7% P
2O
5, and 6.5% K
2O. Phosphorus recycling can reduce the need to import mineral fertilizers, while peat substitution will reduce the negative impacts on wetland ecosystems [
75]. The price of a well-placed quality compound on the market can reach EUR 14 /tonne, which contributes in this case to an annual revenue of EUR 10,300.
The annual revenues calculated are in
Table 10, for scenario 1.
3.6. Investment Map, Depreciation Map and Income Statement
The Economic feasibility analysis considering Arati et al. [
76], Nielsen et al. [
77] and the calculations of the financial charges, investment map, the amortization map, and the income statement are shown in
Table 11 and
Table 12 for the 20-year project time horizon. The net result of the period is positive after 5 years.
In scenario 1, characterized for including revenues calculated in
Table 12, the net result of the period is positive after 5 years. At the end of 20 years, and according to the income statement, a net result of EUR 61,340 was obtained. Considering scenario 2, characterized for self-consumption of the electricity and thermal energy, there is a decrease in sales and savings in production costs, which implies that the net result of the period is positive after 7 years. The solution could be incorporated with hydrogen [
78].
A composting plant for Madeira and Porto Santo combined solution has a total equipment investment of EUR 1.6 M for 10,000 tonnes/year to 16,000 tonnes/year.
Table 13 demonstrates the total investment costs, including the requalification and adaptation work for the composting plant [
79].
In Madeira Island, there is a composting plant in the Solid Waste Treatment Plant that could be requalified for these waste fractions [
80].
In Porto Santo Island, a composting system for 736 tonnes/year of compost could have an investment of EUR 70,100 [
81].
4. Discussion
This research demonstrated that biogas production from the conversion of bio-waste such us food waste, green waste, and sludge is a promising solution, with a significant role in waste valorization into bioenergy.
Hydrolysis, acidogenesis, and methanogenesis involve diverse microbial communities during the anaerobic digestion process. Pre-treatment of feedstocks improve the production yield, however, it increases the production cost and the use of energy and/or chemicals. The feedstock concentration, temperature, microbial size, and pH can influence hydrolysis, acidogenesis, and methanogenesis. It was found that feedstock, technology, and operating conditions highly influence the digestate product’s characteristics. Furthermore, incentive policies and regulations for organic waste valorization in the anaerobic digestion process, and for digestate use and biogas production, would promote environmental and economic benefits. In addition, quality regulation of biogas from organic waste, and social awareness, are essential as part of the organic waste circular economy paradigm. Since there was no history of food and green waste specifications produced in Porto Santo, a pilot initiative for differentiated separation, collection, transport, and physicochemical analyses of food and green waste samples was carried out in the participating hotel sector; collection of samples was supported by ARM.
This pioneering initiative was based on the conduct of a questionnaire and the mapping of the waste collection circuit. Food and vegetables are examples of materials with relatively high nitrogen levels and thus low C/N ratio values (carbon/nitrogen). Wood chips, dry leaves, and green leaves have a higher proportion of carbon, so higher C/N ratios. This fact was verified in the results, with an impact on the efficiency of the anaerobic digestion process. The technical feasibility analysis of the implantation of an anaerobic digester with biogas production and compost was performed to evaluate food bio-waste, green residues, and sludge at the Solid Waste Processing Center in Porto Santo; and through a cogeneration unit, electrical and thermal energies were produced for self-consumption and with sales potential. According to the mass balance, 2868 tonnes of raw material is fed to the digester, with a hydraulic retention time of 35 days, operating in a continuous regime, in a range of mesophilic temperature (35 °C), by wet route.
This solution enables the production of 272,221 m3 of biogas to be used as fuel in a cogeneration unit to transform chemical energy into electrical and thermal energies. The solution presented ensures compliance with specific community legislation regulating anaerobic digestion units of the organic fraction, as presented in Regulation No 1774/2002 of 3 October. The savings in the transport of waste due to the recovery in the island of Porto Santo instead of being transported to the island of Madeira is EUR 119,452.
In energy terms, the unit has a positive balance, showing electrical and thermal self-consumption lower than the total energy value obtained by the cogeneration unit. The value of this self-consumption is approximately 25% for electricity and 29% for thermal energy. This fact allows the electricity needs of 204 habitants of the island of Porto Santo to be addressed annually. The initial investment is EUR 409,372, and the production cost is EUR 285,699, and all portions of the production cost were calculated for the 20-year time horizon, including depreciation. The implantation area of the unit is below the available area of the CPRS of Porto Santo.
5. Conclusions
This research contributed to the identification, specification of resources, and the energetic valorization of bio-waste from undifferentiated municipal solid waste, green waste, and sludge, including the development of a solution for the island of Porto Santo, in the Madeira archipelago, with the possibility of injection of the excess electricity produced into the grid. This work is in compliance with the targets of the European Directive 2018/851 of the European Parliament and the Council of 30 May 2018, in which: from 2024 the selective collection of bio-waste will be mandatory; from 2030, 60% of municipal waste must be recycled; and by 2035, only 10% of waste can be landfilled. According to the selected raw material, the production specifications and projections for 2060, the process block diagram, and the proposed installation of an anaerobic digestion unit with cogeneration were calculated and designed. It was concluded that the total revenue value is EUR 287,773, based on the calculation of the electricity sale, thermal energy and compost sales, revenues from the waste management rate, and carbon credits. Additionally, savings on the transport of waste were included since it is converted on the island of Porto Santo, where it is produced, instead of being transported to Madeira Island. The income statement shows a positive net result after five years. According to the analysis, the planned investment would be covered before the end of the useful life provided for the installation (20 years), making it possible to conclude that for increasing values of installed power, the investment project becomes increasingly attractive to ensure higher returns. The decrease in the cost of investment would make the project more attractive, possibly by using community subsidies and funds. The study presented here is an example that the decentralized solution can be beneficial and have advantages in energy terms. The implementation of this unit on the island of Porto Santo could solve the problem of not currently practicing the differentiated separation of food bio-waste. This solution developed is in accordance with the principle of the circular economy, enables the creation of more jobs, and is in line with the goals of the European Union, the European Ecological Pact (EU Green Deal), and the Smart Fossil Free Island initiative, thus enabling the reduction of CO2 emissions into the atmosphere.


