Article

Surface Coal Mine Soils: Evidence for Chronosequence Development

Department of Earth Sciences, Kent State University, Kent, OH 44242, USA
*
Author to whom correspondence should be addressed.
Soil Syst. 2023, 7(2), 59; https://doi.org/10.3390/soilsystems7020059
Submission received: 24 April 2023 / Revised: 2 June 2023 / Accepted: 5 June 2023 / Published: 7 June 2023

Abstract

:
Anthropogenic changes to soil properties and development can dominate soil systems, particularly in coal mining-impacted landscapes of the Appalachian region of the United States. Historical mining operations deposited spoils which are developing into mine soils in chronosequences, allowing for a correlation between emplacement age and rates of change in soil properties. The study site was in the Huff Run Watershed (Mineral City, OH, USA) with a series of eleven spoil piles that were deposited over a 30-year time period. Surface soils were analyzed for bulk density, loss on ignition (LOI) as a proxy for organic matter, particle size, and bulk mineralogical (by X-ray diffraction) and elemental (by X-ray fluorescence) compositions. The following linear trends were observed across the transect from older to younger mine soils: bulk density increased from 1.0 cm−3 to 1.5 g cm−3; LOI decreased from ~20% to 5%; the content of sand-sized particles and quartz decreased from ~50% to 30% and 50% to 25%, respectively, with a corresponding increase in the contribution of clay mineral from ~25% to 60%; and Fe and other trace metals (Cu, Ni, Pb, Sb, Sn, and Te) decreased in concentration, while Al, Mg, and K increased in concentration. These trends are likely the result of: (1) organic matter accumulation as vegetation becomes more abundant over time; (2) transport of clays out of more recently emplaced waste; and (3) oxidative dissolution of primary sulfides releasing Fe and other trace metals followed by re-precipitation of secondary Fe-phases and trace metal sequestration. The findings presented here provide insight into the future behavior of these materials and can potentially be used to assess the inferred age of previously unexamined mine soils across a wider geographic area. These results can also inform decisions related to reclamation activities and ecosystem restoration.

1. Introduction

Human activities have dramatically altered natural soil properties and development (pedogenesis) through urbanization and mining and it has been recognized that human-induced changes (anthropedogenesis) can dominate soil systems [1]. It is estimated that approximately half of the 13 billion hectares of Earth’s soil have now been converted to human use, dominated by agricultural, urban development, and mining activities [2]. In the Appalachian region of the United States, over two centuries of coal mining have dramatically altered the landscape, and it is estimated that there is a cumulative mining footprint of 5900 km2 [3]. Coal mining can alter landscapes with severe impacts on land resources and the ecological environment via stripping, excavation, transportation and dumping of mine waste (i.e., mine spoil) [4]. The extent of abandoned mine spoil can be difficult to quantify, although in Ohio alone, it has been estimated that there are approximately 36 billion tons of known coal mine spoil spread over 600 km2 [5]. The addition of mine spoil can dramatically alter the physical and chemical properties of soils, and the soils that develop subsequent to mine spoil addition are defined as mine soil, which develop from the mixture of fragmented waste rock and native soils [6,7]. Although traditional perspectives on soil development have emphasized a slow rate of change, anthropedogenesis in mining-impacted areas can alter a range of soil properties on the decadal time-scale [8]. Affected properties include acidification and salinization, organic matter dynamics, translocations of chemical species (solutes and colloids of silicate clay, organic matter, and Fe and Al oxides), redoximorphic features, mineral properties (surface charge properties, aggregation, and porosity), gas and water relations, and even rooting depth and texture [8]. Assessing the magnitude and rate of changes during mine soil development is critical for ecological restoration and land reclamation [9].
Quantifying changes in soil properties over time can be achieved using soil chronosequences, which are a group of related soils that differ primarily as a result of differences in time, where other soil-forming factors are held relatively constant [10,11]. Chronosequences are important geologically because they are valuable tools used in examining a variety of characteristics, both physical and chemical, which describe earth materials along the path from parent rock material to soil [10]. This approach has also been applied to understanding the differences in pedogenesis in anthropogenically impacted soils and natural soils using the comparison of soils formed from pyrite-bearing hardrock and pyrite-bearing coal mine wastes [12,13]. Mine soils typically have distinctly different morphological features compared to contiguous native soils, primarily because mine soils are comparatively very young mixtures of fragmented rock and soil. This can result in significant differences in bulk density, which has been reported to be higher in mine soils compared to native soils as a result of mining equipment use and organic inputs on older sites [14]. The mineralogy and bulk composition of mine soils can also vary significantly compared to contiguous native soils due to the addition of phases only associated with the waste material generated from mining [15,16]. In coal mine waste, these differences are primarily due to the presence of pyrite (FeS2) and other metal sulfides and secondary Fe(III)-bearing phases that form as a result of oxidative dissolution and re-precipitation, such as goethite (FeO(OH)), ferrihydrite (5Fe2O3∙9H2O), schwertmannite (Fe16(OH,SO4)12–13O16∙10–12H2O), and jarosite (KFe3(SO4)2(OH)6) [17]. Metal(loid)s associated with the primary sulfide minerals (e.g., As, Cu, Pb, Zn, etc.) released during weathering are transported down gradient and potentially re-sequestered during formation of secondary Fe phases [18]. These changes in mineralogy and bulk composition can be significant indicators of the evolution of anthropogenic materials to a mature soil [19].
The nature of historical surface coal mining practices can potentially result in the formation of an anthropogenically created chronosequence within a more constrained geographic region with geologically related materials. Prior to the passage of the Surface Mining Control and Reclamation Act of 1977 (SMCRA), treatment of mine spoil was not required and there is an extensive legacy of untreated mine spoil in areas where pre-SMCRA mining occurred [20], as noted above. The morphology and spatial distribution of the spoil piles is related to coal mining activities as follows: pre-SMCRA mining operations typically began at the base of a hill where there was an exposure of an economically viable coal seam. This seam was further uncovered by the removal of overburden, and the overburden and residual coal-bearing material was then piled just downhill of the next anticipated mining location. After leaving a relatively stable hill slope, the operations would then move uphill, and the next mass of overburden would then be used as fill material for the most recent excavation. This process, commonly referred to as “shoot and shovel”, would result in a series of spoil piles that were more recently emplaced from lower to higher elevation and is typical of the pre-SMCRA surface contour mines that dominate large portions of the Appalachian region [20,21]. With this time versus elevation spatial arrangement, a chronosequence approach can be applied to this transect of spoil piles, similar to classical chronosequences, where the bottom of the hill represents the oldest materials and the top of the transect represents the youngest materials. Further, the fate of abandoned surface coal mining-related spoil is of particular concern as it is well documented that piles of spoil are often non-point sources of toxic elements that can impact down-gradient ecosystems [12,13].
Deposition of mine spoil from historical surface mining operations therefore presents a unique opportunity to apply a chronosequence approach to mine soils and monitor changes in physical properties and composition over a constrained time period in geologically related material. This project aimed to characterize changes in the physicochemical properties of shallow soils developing on historical coal mine waste to explore how bulk density, organic matter content, particle size distribution, and bulk mineralogical and elemental composition change over time. The findings of this work provide insight as to the future behavior of these materials and can guide studies to assess the inferred age of soils developing on coal mine waste in other regions in order to provide a trajectory for changes in future soil development which can influence decisions on reclamation activities.

2. Materials and Methods

2.1. Field Site and Soil Sampling

The field site is subwatershed 25 (Figure 1) of the Huff Run Watershed (HR-25), which is located in Tuscarawas County near Mineral City, Ohio. This site was chosen because it was previously classified as one of the most highly AMD-impacted watersheds by the Huff Run Watershed Restoration Partnership [22], and therefore serves as an ideal location for studying weathering processes which are impacting the Huff Run Watershed due to the extensive mining that occurred in this region. The watershed spans a 0.44 km2 area and is underlain by Pennsylvanian sandstones and siltstones, which are interlayered with claystone, limestone, and coal [23]. The coal seams present were mined and extracted beginning in the early 1800s, and operations continued here until 1922 when the underground mine was abandoned [24]. Surface mining within the watershed and at HR-25 became dominant in the late 1940s and ceased in the late 1970s [24], and this 30-year timeframe is believed to correspond to the oldest (deposited ~70–80 years ago) and newest spoil piles (deposited ~50 years ago) of the current investigation. This is also consistent with the size and density of the trees at the field site, in comparison to trees dated with growth rings within the same subwatershed [25]. During this period when surface mining dominated the extractive activities at the site, mining practices and equipment remained relatively consistent, and remediation has not occurred where mine soils are developing. Although details regarding the specific location of surface mines were poorly documented, the entire study area is on land known to be impacted by both surface mining and mine waste [5]. The site is situated in the Alleghany Plateau region and remains unglaciated; thus, the surface material prior to mining operations should reflect bedrock composition. Mean annual precipitation is ~106 cm, and mean annual temperature is ~11 °C (average for 2008–2018 in Tuscarawas Country) [26]. Spoil piles are undergoing reforestation with tree species dominated by red maple (~75%), with other species including American elm (Ulmus americana), autumn olive (Elaeagnus umbellata), bitternut hickory (Carya cordiformis), black cherry (Prunus serotina), black oak (Quercus velutina), choke cherry (Prunus virginiana), common dogwood (Cornus sanguinea), and sassafras, and higher vegetation density observed in older spoils [27]. Legacy spoil piles remain undisturbed and un-reclaimed across this site, and previous work has been conducted to characterize spoil piles adjacent to the current study with a focus on colloid transport and toxic metal mobility within these non-point sources of contamination to the watershed. Solid-phase characterization of these piles found an assemblage of common soil minerals including quartz, feldspars, micas, and clays [5,28]. This previous work led to the conception of this research. Past remediation work at this site focused on AMD point-sources (i.e., mine seeps and abandoned underground mine works) included capping a few spoil piles with clay that were immediately adjacent to the point-sources [24]; however, the vast majority of the abandoned spoil materials remain untreated and are the target of the current investigation.
Soil sampling (Figure S1) included collecting three replicate samples from each spoil pile, which were homogenized in the laboratory post drying. A core sampling apparatus was constructed at a length of approximately 8.25 cm; the inner diameter is 10.16 cm. The volume of the sample apparatus was determined as 668.85 cubic centimeters; this large sample volume was intended to avoid errors associated with coarse rock fragments. The samples were taken by digging into the side of a pile to remove the surface vegetation and O-horizon. The samples were then bagged and geocached with a Garmin handheld unit. Spoil pile samples were collected moving from lowest to highest elevation maintaining an increase in elevation between piles (Figure 1C,D). Soil color was fairly consistent among the samples (Figure S1E). Field-based observations indicated that the spoil piles had similar drainage properties; standing water has never been observed on or near the piles following large rain events, and all sites sit at least 2 m above the local water table based on soil cores collected within the subwatershed [5].

2.2. Sample Preparation and Analyses

Initial drying was conducted by opening the bags and allowing them to dry to the atmospheric moisture of the lab. The samples were then placed in the oven for final drying using aluminum trays at a temperature of 58 °C. Samples were removed from the oven and weighed every few days to continuous mass (until the mass of moisture loss represented less than 5% of the bulk sample mass), and dried material was then archived. Once the dried subsamples were sieved at 2 mm and milled down to homogeneous silt sized particles using the 8000 M SPEX Sample Prep ball mill and tungsten carbide grinding balls, three subsamples were taken for loss on ignition, bulk mineralogy, and bulk elemental composition. A fourth, un-milled subsample was taken for analysis of particle size distribution. The known in situ volume of the composite sample was used in calculation with the weighed dry mass of material to determine bulk dry density was ascertained [29].

2.2.1. Loss on Ignition

Loss on ignition (LOI) was used as a proxy for organic matter content [30,31], although a small fraction of mass loss may be due to dehydration of clays and poorly crystalline oxide phases. Sample preparation for loss on ignition, following a previously established procedure, used dry, sieved subsamples that were used in loss on ignition procedures. Weighed masses of subsample with a target mass of 2.5 g were placed in ceramic crucibles with lids. These crucibles were placed in an oven and brought to 550 °C using a Thermofisher Thermolyne muffle furnace for one hour, and then allowed to cool before being re-weighed. Given previous work on the soil pore water composition [32] and XRD results (discussed below), it is unlikely that significant amounts of carbonate were present, and only 2–4% of additional mass loss at 950 °C in similar soils has been reported [27]; therefore, loss on ignition at higher temperatures was not performed.

2.2.2. Particle Size Analysis and Methods

Subsamples of material were homogenized and passed through a 2 mm sieve prior to grain size analysis performed using a MalvernTM Mastersizer 2000 laser diffraction particle size analyzer equipped with a Hydro 2000MU manual inlet system. The instrument measured background laser obscuration in clean distilled water for self-calibration prior to each sample. The sample was then mixed with distilled water and ultrasonicated for 1 min. During analyses, laser obscuration for all samples was maintained between 12 and 15% to optimize analyses. The resultant data are binned into one hundred bins ranging across the material diameters up to 1 mm. For contribution of grain sizes between 1 and 2 mm, an additional subsample was taken from the original archived sample and a hand sieve analysis was performed to measure the mass difference between the total mass and the mass of the 1–2 mm fraction, which was typically less than 10%. DistFitTM 1.6.10, a particle size multi-modality fitting software, was used to fit Rosin–Rammler distributions to the curves produced by the samples. Rosin–Rammler distributions have been shown to produce the most accurate results when paired with the MalvernTM laser diffractometer data [33] and were thus used for the selected fit parameters. As discussed below, three modes were found to adequately describe the particle size distributions, where the modes approximately corresponded to the smallest (mode 1), medium (mode 2), and largest (mode 3) sized particles within the overall particle size distribution, and roughly correlate to the clay, silt, and sand size fractions, respectively; particle size distribution is presented in traditional USDA grain sizes sand, silt, and clay fractions. For each mode, DistFitTM calculates: (1) the percent contribution of each mode to the overall particle size distribution; and (2) the mean particle size and standard deviation for each mode.

2.2.3. X-ray Diffraction and X-ray Fluorescence

Subsamples for X-ray diffraction (XRD) and X-ray fluorescence (XRF) analyses were prepared using the methods described in Wood (2018): dried soil samples were passed through a 2 mm sieve before being milled to remove larger particles. After 8–10 min in the mill, the samples were sufficiently homogeneous and powdered. The XRD powder samples were then loaded and lightly pressed into the sample disk and analyzed using a Rigaku Miniflex 6G Diffractometer. Scans were conducted at 40 KV and 15 Amps from a theta 2 angle range of 3.0 to 90.0°. Rigaku’s PDXL software, with the whole pattern powder fitting (WPPF) method utilizing a Rietveld refinement connected to the International Centre for Diffraction Data (ICDD) database, was used in the determination of mineralogical presence and relative abundance. This was used in tandem with the elemental data to geochemically fingerprint the piles and contrast the composition and properties of the material along the transect.
For XRF analysis, the dry powdered samples weighing 11 g were diluted using 1.2 g of SPEX 3642 cellulose binder. After which, the sample/binder mix was pressed using a SPEX 3614 40 mm evacuable die set and Carver 25-ton press under a load of 20 tons for a duration of two minutes. The resultant discs were then analyzed using a PANalytical Epsilon 3 Series X-ray Fluorescence Spectrometer (Malvern Panalytical, Malvern, United Kingdom).

2.2.4. Statistical Approach

A combination of Microsoft Excel 2019 and R (R Core Team, 2021) equipped with the CRAN statistical package was utilized in the statistical analysis of the full dataset. DistFitTM was used in the curve fitting of particle size distributions and produced goodness-of-fit values [32]. The dataset was imported to R. Missing values were replaced with a value of 1 × 10⁻⁹ to avoid mathematical errors due to missing values—for example, when an element was found to be below the detection limit of XRF analysis. This would allow for the missing value to remain an outlier while providing the R functions with a value to prevent an entire variable from being excluded from the correlation matrix. The dataset was then centered and scaled, and a correlation matrix and significance values were computed using the Spearman method.

3. Results

3.1. Soil Density and Loss on Ignition

An overall increase in bulk density occurs in the spoil piles from lower to higher elevation (Figure 2A) (rho = 0.864 p = 0.0006), with some deviation in pile #1 (above the trend) and piles #9 and #10. Bulk dry density values range from 0.96 to 1.50 g cm−3 with an average value of 1.19 ± 0.18 g cm−3. Soil sample integrity could not be retained during the sampling of pile #9 due to low soil moisture, and this data point has been excluded from the trend. However, given that the bulk density value of pile #9 falls very close to the overall trend, it was kept in the statistical analyses discussed below. In contrast to bulk density, loss on ignition values decreased as elevation increased (rho = −0.809 p = 0.003), with values ranging from 5.93 to 21.55 wt.% and an average value of 11.71 ± 4.12% (Figure 2B). Although there were some minor outliers, both bulk density and loss on ignition changed linearly over the transect.

3.2. Particle Size Distribution

Sample particle size distributions were best fit using three Rosin–Rammler distributions (i.e., modes) of grain sizes (Figure S2). The particle size distribution was integrated to compare the contribution of clay, silt, and sand sized particles (Figure 3). The contribution of sand sized grains decreased motion up the transect (rho = −0.445, p = 0.1697) while the contribution of silt sized particles increased (rho = 0.436, p = 0.1797), and the contribution of clay sized particles displayed no overall trend (rho = −0.183, p = 0.5892). Mean particle diameter within each size fraction was also determined (Figure S3). The mean particle size within the clay-sized fraction (mode 1) increased across the transect (rho = 0.845, p = 0.001) and decreased for silt-sized particles (mode 2; rho = −0.291, p = 0.385). The mean particle diameter of sand-sized particles (mode 3) had no obvious trend (rho = −0.055, p = 0.873).

3.3. Bulk Mineralogy

The bulk mineralogical composition of the mine soils was dominated by common soil minerals (Figure 3B and Figures S4–S14, and Table S1). Quartz content ranges from 17.0 to 54.0% by volume with an average of 26.6 ± 10.6% and, in general, decreased motion up the transect. Feldspar content, defined as the sum of albite, anorthite, and microcline, ranged from 9.3 to 24.5% with an average of 15.4 ± 5.1%. Muscovite content ranged from 0.5 to 27.0% with an average value of 6.2 ± 7.6%. Clay content, defined as the sum of chlorite, illite, and kaolinite, ranged from 29.8 to 70.7% with an average value of 51.5 ± 12.6%. In general, feldspars and clays tend to increase with an increase in elevation, while the proportion of quartz and muscovite decreased with an increase in elevation.

3.4. Bulk Elemental Composition

The bulk composition results (Figure 4) are grouped by element clusters based on the results of the soil parameter correlation matrix analyses (Figure 5, and discussed in the next section). Additional elemental concentration profiles are shown in Figure S15. All data are reported in Table S2.
Group 1 (Figure 4, grey diamonds): Antimony concentrations ranged from 89.50 to 128.10 ppm with an average value of 105.60 ± 10.51 ppm. Tellurium concentrations ranged from 197.20 to 297.50 ppm with an average value of 261.70 ± 25.51 ppm. Tin concentrations ranged from 32.30 to 44.53 ppm with an average value of 39.67 ± 3.20 ppm. All three elements reported here display a trend with higher concentrations at the bottom of the transect in the older piles and lowest at the top of the transect in younger piles.
Group 2 (Figure 4, black circles): Silicon values ranged from 37.03 to 57.74 wt.% with an average value of 48.06 ± 5.68 wt.%. Titanium concentrations ranged from 0.88 to 1.70 wt.% with an average value of 1.47 ± 0.22 wt.%. Zirconium values ranged from 0.05 to 0.18 wt.% with an average value of 0.10 ± 0.03 wt.%. Silicon, Zr, and Ti exhibit minimum values in the middle of transect, although the effect is more muted for Ti.
Group 3 (Figure 4, blue squares): Aluminum ranged from 12.07 to 22.16 wt.% with an average value of 18.16 ± 3.13 wt.%. Magnesium values ranged from 0.61 to 1.44 wt.%. with an average value of 1.06 ± 0.25 wt.%. The concentration of K ranged from 3.84 to 9.40 wt.% with an average value of 7.49 ± 1.50 wt.%. These three element trends all increase toward the top of the transect with younger piles.
Group 4 (Figure 4, green triangles): Nickel concentrations ranged from 15.03 to 101.13 ppm with an average of 51.22 ± 20.24 ppm. Lead values ranged from 18.17 to 81.38 ppm with an average value of 43.69 ± 18.75 ppm. Iron concentrations ranged from 4.13 to 14.37 wt.% with an average of 6.93 ± 2.65 wt.%. Copper was observed to range from 25.02 to 58.04 ppm with an average value of 44.89 ± 9.36 ppm. All four element trends are lowest in the top of the transect with the younger piles and increase motion down the transect as the ages of the piles increase.
Group 5 (Figure 4, purple hexagons): Manganese concentrations ranged from 0.06 to 1.64 wt.% with an average value of 0.44 ± 0.52 wt.%. Zinc concentrations ranged from 65.32 to 177.88 ppm with an average value of 107.70 ± 27.75 ppm. Phosphorus concentrations ranged from 0.13 to 0.30 wt.% with an average value of 0.20 ± 0.06 wt.%. Arsenic concentrations ranged from 16.10 to 156.00 ppm with an average value of 75.29 ± 43.51 ppm. Strontium concentrations ranged from 0.03 (300 ppm) to 0.09 (900 ppm) wt.% with an average value of 0.06 ± 0.02 wt.% or (600 ± 200 ppm). Chromium concentrations ranged from 215.30 to 399.60 ppm with an average value of 303.04 ± 50.67 ppm. Gallium concentrations ranged from 39.00 to 111.40 ppm with an average value of 81.36 ± 17.60 ppm. Barium concentrations ranged from 0.10 (1000 ppm) to 0.18 wt.% (1800 ppm) with an average value of 0.13 ± 0.02 wt.% (1300 ± 200 ppm). These elements show little to no overall trends across the transect, with the exception of Mn, Zn, and P, in which the elements show their highest concentrations near the middle of the transect and much lower concentrations on the bottom and top of the transect.

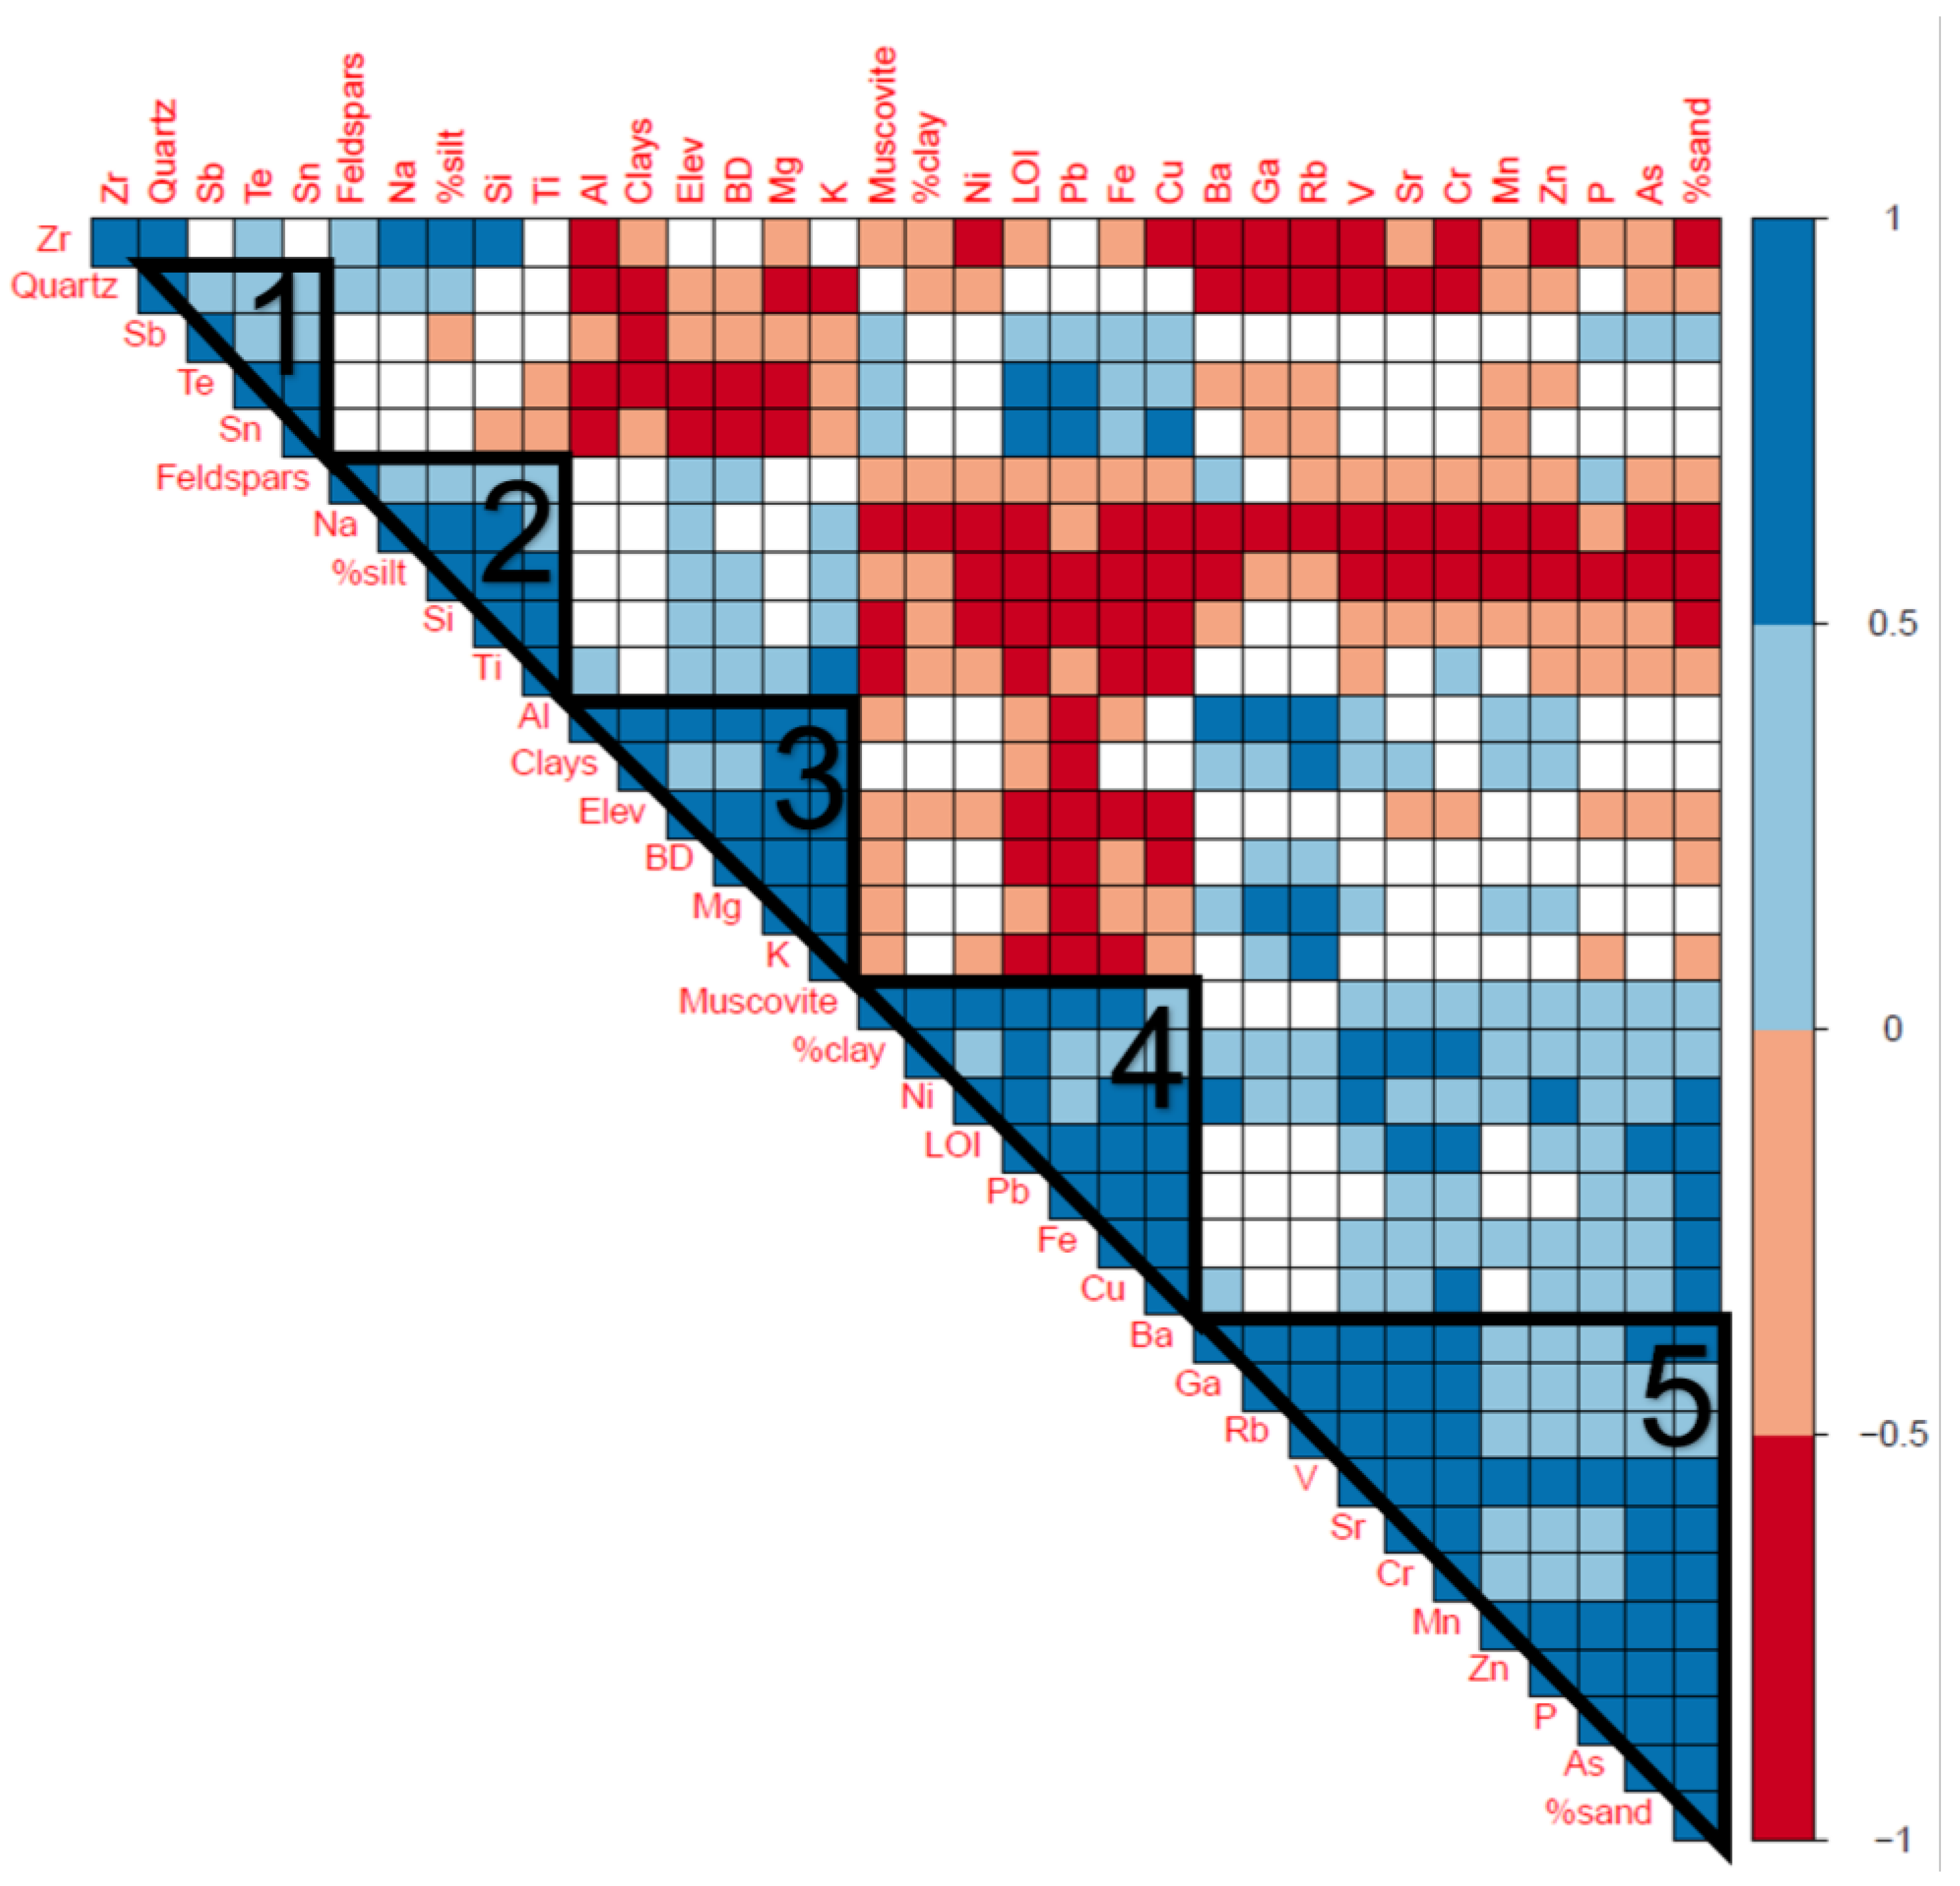
3.5. Statistical Analyses

Some correlations among soil physical and chemical parameters are obvious in the results discussed above, such as the positive correlations observed between elevation and bulk density (Figure 2A); clay content with typical clay-bearing elements (e.g., Al, K, and Mg) (Figure 3 and Figure 4); and Fe and trace metals (e.g., Cu, Ni, and Pb) (Figure 4). The statistical approach was used to create a correlation matrix diagram (Figure 5) to further elucidate the relationships between the soil parameters. The correlation matrix is ordered by hierarchical clustering, which groups variables that are positively correlated with each other by strength of correlation. This is an exploratory statistical approach that compares data across all variables in the dataset and highlights trends that may not be readily apparent. The following regions indicate clusters of variables which represent the strongest positive correlations (Figure 5, black-outlined triangles with black text font); (1) quartz, Sb, Te, and Sn; (2) Feldspars, Na, silt content, Si, and Ti; (3) Al, clay minerals, pile elevation, bulk density, Mg, and K; (4) Muscovite, clay content, Ni, LOI, Pb, Fe; and Cu (5) Ba, Ga, Rb, V, Sr, Cr, Mn, Zn, P, As, and sand content. The framework created by the correlation matrix diagram and the relationships across these datasets allow us to integrate observed connections between particle size, mineralogy, elemental abundances, and physical properties, which may shed light on processes that are dominant across this transect that are responsible for soil formation in these mine spoils. These processes will be discussed below.

4. Discussion

This study aimed to characterize trends in soil properties observed over a transect to which a chronosequence approach was applied. The major trends observed in the above results are summarized in a conceptual model (Figure 6), and the discussion below provides context for changes in soil properties during weathering reactions and soil formation.

4.1. The Relationship between Soil Physical Characteristics and Spoil Pile Relative Age

The decrease in bulk density with an increase in time since emplacement (Figure 2) was one of the strongest and most statistically significant trends observed in the current work, and is consistent with previous work on pedogenetic trends of natural [10,33,34,35] and anthropogenically impacted [36,37,38,39] soils. Bulk density is primarily a function of organic matter content, soil texture (i.e., particle size distribution), and porosity and is generally higher when mine soils have low organic content, high clay content, and are compacted [40,41]. With respect to organic matter content (using the loss on ignition values as proxy for organic content), our observations were consistent with the correlation between lower bulk density and higher organic content in mine soils that had been developing the longest and had higher vegetation densities. The increasing organic matter content and resulting decrease in bulk density over decadal time scales during soil development is typically dominated by biological activity [37,38,42,43]. Plants and microorganisms contribute organic matter in the forms of humic substances that encourages aggregate formation following decomposition and sorption processes, thus increasing soil organic matter content and creating void spaces that can occur in a matter of several years [42]. Trees are thought to dominate organic matter inputs to soils in all fractions, and microbes have been suggested to be responsible for a portion of the inputs to inter-aggregate and labile organic matter [44]. Additionally, tree root networks can senesce, or die off and decompose, leaving behind voids ranging from yearly to decadal time scales [43,45]. With respect to organic matter content, the most recently emplaced spoil piles at the top of the transect had low LOI values (<10%) (Figure 2) which approximately correspond to 5% total organic carbon (TOC) [46] and are consistent with previous bulk density values of approximately 1.5 g cm−3 [47] (similar to our observation) and consistent with values observed in mine soils developing in forestry-reclaimed sites [15]. The low TOC values at the top of the transect are also consistent with a lack of time for soil weathering and organic matter input into the soils developing on the most recently emplaced mine spoil. The LOI values at the bottom of the transect correspond to approximately 10% TOC and are consistent with the TOC content of decades old abandoned mine spoil [48], which can have TOC values as low as a few percent in un-reclaimed spoil [49]. This indicates that despite a low density of trees at the current site, total biological activity is sufficient to increase organic matter to a range consistent with biologically productive soils. However, the corresponding decrease in bulk density to approximately 1 g cm−3 cannot be explained by the addition of organic matter alone and is likely dependent on changes in porosity as well, which were not measured here and warrant further investigation.
Bulk density is also correlated with soil texture, where particle size distributions are typically dependent on physical weathering dynamics, particularly in siliciclastic sedimentary rocks such as sandstones, siltstones, and shales. Particle size distributions of very young soils closely resemble their parent materials as the disintegration of rock fragments continually introduce sediment grains [36,37]. However, the resistance to weathering and mineralogy of the parent material is crucial in the fate of soil particle size distributions. For example, soils developing from sandstones experience minimal shifts in particle size distribution, whereas soils developing from siltstones and shales results in a net increase in the silt size fraction followed by an accumulation of clay size particles [20]. These changes are the results of a combination of physical processes including vacillating humidity, freeze/thaw cycles, slaking, abrasion, and fracturing [36,37]. These processes can be modified in anthropogenically impacted soils, particularly those developing from mine spoil as surface bulk densities of mine soils are typically higher compared to undisturbed soils because of compaction during emplacement and high coarse-fragment content [40]. Our observations of the particle size distribution and bulk mineralogy are consistent with these trends; soils developing on more recently emplace mine spoil have a higher fraction of silt- and clay-sized particles (Figure 3A) and a higher proportion of clay minerals (Figure 3B), which are more easily compacted during emplacement in contrast to quartz sand-rich materials. As the soils continue to develop, transport of very fine particles likely occurs during rainfall events and seasonal freeze/thaw and wet/dry cycles [14,50], leading to a decrease in silt and clay in top soils and a decrease in bulk density as the proportion of sand and quartz increases. Recent work at this site has also documented colloidal clay transport in the pore waters of soils developing on mine spoil over similar time scales [27], highlighting the mobility of the fine particles in this setting.
Overall, the significant changes in soil properties observed in this study are supported by previous work, where a decrease in bulk density is related to an increase in organic matter content and particle coarsening as fine particles are transported away, highlighting the rapid pace of changes in mine soils. Changes in bulk density during the weathering of a parent material are traditionally thought to take place on long time scales, where the formation of mature soils can take up to thousands to tens of thousands of years [51]. In contrast, anthropogenically impacted soils may be subject to an accelerated pedogenetic pathway, with soils forming within decades to a century after emplacement of the anthropogenic source material [19]. This is due to the (bio)geochemical instability of the anthropogenic parent material and potentially supplemented by microbially mediated influences, as the deposition of crushed spoil on the surface of the Earth typically allows for rapid hydration and redox reactions in comparison to natural regolith wherein these interactions are happening at depth and proceed more slowly [12,19,52,53]. Anthropogenic materials that have been excavated and piled at the surface experience drastically shifted environmental conditions which are favorable for more rapid weathering, and evidence for these pedogenetic mechanisms is further examined through changes in the chemical characteristics of these soils.

4.2. Controls on Mineral Distribution and Bulk Composition

The bulk composition of the surface soils across the transect (Figure 4) highlights the following trends in elemental distribution moving up the transect to younger spoil piles: (1) decreasing concentrations, which includes Fe, Ni, Cu, and Pb (Figure 5, group 4) and Sb, Te, and Sn (Figure 5, group 1); increasing concentrations, which includes Al, Mg, and K (Figure 5, group 3); and elements that do not exhibit a clear trend across the transect, which includes Si, Ti, and Zr (Figure 5, group 2) and Sr, Cr, Ga, Ba, P, Mn, Zn, and As (Figure 5, group 5).
With respect to Fe, the overall soil concentration is similar to the Fe content of the parent coal shale, which dominates the lithology of the mine waste [54] with the soils on the most recently emplaced spoil piles slightly depleted in Fe and the soils on the oldest spoil piles slightly enriched relative to the parent shale. This trend is likely controlled by the oxidative dissolution of pyrite and other sulfides followed by the re-precipitation of secondary Fe-(oxy)hydroxides and Fe-hydroxysulfates [55,56,57,58], which has been observed in mine soils in the same subwatershed [59,60]. The release of Fe during oxidative dissolution can result in the immediate re-precipitation or transport down gradient and precipitation further from the source sulfide and is controlled by local hydro(geo)chemical conditions and flow parameters ranging from the pore scale to the landscape scale [55,61,62]. Although secondary Fe phases were not detected by bulk XRD in the current study, these phases have been observed in mine soils at the same field site [27,31]. Further, the formation of secondary mineral coatings can result in the persistence of small (sub-millimeter) pyrite grains [5]. The Fe trend observed here showed depletion in younger soils and enrichment in older soils relative to the parent shale; therefore, it likely reflects the loss of Fe in more recently emplaced materials through oxidative dissolution which is transported downgradient and accumulates as secondary phases in soils that have been developing for more time. The trend in group 1 and group 3 trace metals is likely related to the fate of Fe as well; pyrite is the primary source of these metals in the parent material [54], and these metals can be re-sequestered during secondary Fe phase formation [63,64,65]. However, in contrast to Fe, the concentrations of Ni and Cu are depleted across the transect relative to the parent shale. Although the concentrations of the other elements in groups 1 and 3 were not reported in the parent shale, previous work has shown that their transport in similar materials is often similar to Ni and Cu [66,67,68]. The depletion in Ni and Cu is likely the result of the transport of these metals, either as aqueous phases and/or associated with mobile colloids [60], where only a fraction of the released metals are re-sequestered. In addition to secondary Fe phases, organic matter can also sequester these metals, and we note that the metals in groups 1 and 2 also correlate to the LOI values. Although recent work has shown the importance of secondary Fe phases in the sequestration of these metals, further work is warranted to investigate the relationship between organic matter accumulation and trace metal transport in these materials.
In contrast to Fe and other trace metals, Al, K, and Mg were observed to decrease in soils with the increasing age of the spoil piles, correlating with the clay content in the soil (Figure 5, group 3). Previous work has demonstrated that the concentrations of Al, K, and Mg increase with increasing clay content and decreasing quartz content [69], and the transport of clays described above with respect to changes in particle size distribution and bulk density is also likely controlling the distribution and concentration of Al, K, and Mg. The results observed here are also consistent with previous work [27] that demonstrated that colloids of clay were transported in pore waters of this same watershed, resulting in correlated trends in clays and Al, K, and Mg. With respect to elements that do exhibit a dominantly linear increase or decrease across the transect, the distributions of Mn, Zn, and As (Figure 5, group 5) were observed to have maximum values in concentration in the middle of the transect, with other elements in group 5 exhibiting a more muted response. The distribution of Mn is likely impacted by the following factors: (1) release of soluble Mn(II) through the oxidative dissolution of primary sulfides followed by the transport and re-precipitation of Mn-oxide similar to Fe [18,70,71,72]; KSU-URC-2019(2) release of Mn(II) and sequestration by clay minerals [73] followed by the potential transport of clay minerals described above; and (3) accumulation and cycling of Mn in soluble-phases and organic matter due to plant-soil interactions [26]. Although previous work has shown that Zn typically behaves in a similar way to Fe and the other trace metals in similar settings [72,73], Zn exhibited the same concentration profile as Mn. The combination of these processes may result in the maximum in Mn and Zn content in the middle of transect, with other elements within the group associated with Mn-oxides and clay minerals [74].
The final group of elements, including Si, Ti, and Zr (Figure 5, group 2), exhibit minimum concentrations in the middle of the transect (Figure 4). It is possible that these trends are controlled by the combination of accumulation of more refractory, less mobile phases including quartz (SiO2), rutile (TiO2) and other Ti-oxides, and zircons (ZrSiO4) [75,76]. Alternatively, this trend may reflect potential heterogeneous amounts of the minerals in the overburden for which the concentration of these elements would be more sensitive in contrast to Fe and other metals. In addition to coal shales, the spoil materials also contained mixed quantities of overburden materials, dominated by clastic lithologies, and mineral compositions dominated by quartz, feldspars, and micas [21,77]. Heterogeneities in spoil composition may also explain deviations from overall trends in other metals, particularly the spike in Fe concentration in pile #2. Ultimately, the bulk composition of mine soils resulted in clear trends across the transect and changes over time are likely dominated by Fe cycling, clay transport, and minor variations in the presence of other overburden lithologies.

5. Conclusions

The chronosequence approach to mine soils formation was effective in examining the characteristics which have undergone change on a decadal time scale. Soils developing on coal mine waste (i.e., mine soils) deposited over time show clear trends in soil properties as functions of age since emplacement, with older mine soils having higher organic matter, Fe, trace metal, and quartz/sand content, and lower bulk densities and clay content. Future work will aim to expand the results in this paper by documenting changes in these variables with depth in the mine soils across similar temporal transects to broaden the chronosequence approach. However, given the heterogeneity in the spoil piles and the lack of defined horizons [5,31], the properties of surface material may be a useful proxy for the overall soil profile over the time series, although this requires further examination.
The majority of the observed variables changed linearly over the transect and this is likely the result of: (1) organic matter accumulation as vegetation becomes more abundant over time; (2) the transport of clays out of more recently emplaced waste; and (3) the oxidative dissolution of primary sulfides. The findings presented here provide insight as to the future behavior of these materials and can guide further work in assessing the inferred age of previously unexamined mine soils across a wider geographic area. Further, these results can also inform decisions related to reclamation activities and ecosystem restoration. The restoration of mine soils has been shown to be a soil-driven process, and the value of examining mine soil chronosequences in order to evaluate the effects of ecosystem restoration practices on soil processes has been recognized [4]. The properties evaluated in the current study (i.e., bulk density, organic matter content, particle size, and bulk mineralogical and elemental compositions) are dominant variables in accounted for during different phases of reclamation, which typically include geomorphic reshaping, soil reconstruction, hydrological stability, vegetation restoration, and landscape rebuilding [4]. Further, coal mine waste is evaluated for the potential to continually release toxic elements, and our results indicate that over a time period of approximately decades to at most a century, these mine soils continue to slowly leach toxic elements. These elements are likely associated with secondary Fe and Mn oxides and organic matter and could therefore be remobilized following a change in hydrology or the ecosystem functions that can destabilize these phases.

Supplementary Materials

The following supporting information can be downloaded at: https://www.mdpi.com/article/10.3390/soilsystems7020059/s1, Figure S1. Photographs of soil sampling; Figure S2. Particle size distribution as a function of particle diameter (µm); Figure S3. Mean particle diameter within each size fraction; Figures S4–S14. Bulk Mineralogy Analyses; Figure S15. Additional bulk XRF data; Table S1. X-ray diffraction whole pattern fitting results; and Table S2. Bulk element composition determined by XRF for each Huff Run Spoil Pile (HRSP) sample.

Author Contributions

Conceptualization, K.E.S. and D.M.S.; methodology, K.E.S. and D.M.S.; validation, K.E.S. and D.M.S.; formal analysis, K.E.S.; investigation, K.E.S.; resources, D.M.S.; data curation, D.M.S.; writing—original draft preparation, K.E.S. and D.M.S.; writing—review and editing, K.E.S. and D.M.S.; visualization, K.E.S. and D.M.S.; supervision, D.M.S.; project administration, D.M.S.; funding acquisition, D.M.S. All authors have read and agreed to the published version of the manuscript.

Funding

This research was funded in part by the Kent State University Research Council.

Institutional Review Board Statement

Not applicable.

Informed Consent Statement

Not applicable.

Data Availability Statement

The data presented in this study are available in the Supplementary Material.

Acknowledgments

The authors thank Marissa Lautzenheiser (Huff Run Watershed Restoration Partnership) for logistical support at the study site and the following Kent State University staff and students: Merida Keatts for training and assistance with laboratory instruments and equipment; Chelsea Smith for field work and sample collection assistance. Comments from the three anonymous reviewers improved this manuscript.

Conflicts of Interest

The authors declare no conflict of interest.

References

  1. Yaalon, D.H.; Yaron, B. Framework for man-made soil changes-an outline of metapedogenesis. Soil Sci. 2006, 171, S154–S159. [Google Scholar] [CrossRef]
  2. Richter, D., Jr. Humanity’s transformation of Earth’s soil: Pedology’s new frontier. Soil Sci. 2007, 172, 957–967. [Google Scholar] [CrossRef] [Green Version]
  3. Pericak, A.A.; Thomas, C.J.; Kroodsma, D.A.; Wasson, M.F.; Ross, M.R.; Clinton, N.E.; Campagna, D.J.; Franklin, Y.; Bernhardt, E.S.; Amos, J.F. Mapping the yearly extent of surface coal mining in Central Appalachia using Landsat and Google Earth Engine. PLoS ONE 2018, 13, e0197758. [Google Scholar] [CrossRef] [PubMed] [Green Version]
  4. Feng, Y.; Wang, J.; Bai, Z.; Reading, L. Effects of surface coal mining and land reclamation on soil properties: A review. Earth Sci. Rev. 2019, 191, 12–25. [Google Scholar] [CrossRef]
  5. Singer, D.M.; Herndon, E.; Cole, K.; Koval, J.; Perdrial, N. Formation of secondary mineral coatings and the persistence of reduced metal-bearing phases in soils developing on historic coal mine spoil. Appl. Geochem. 2020, 121, 104711. [Google Scholar] [CrossRef]
  6. Zipper, C.E.; Burger, J.A.; Barton, C.D.; Skousen, J.G. Rebuilding soils on mined land for native forests in Appalachia. Soil Sci. Soc. Am. J. 2013, 77, 337–349. [Google Scholar] [CrossRef] [Green Version]
  7. Thomas, K.; Sencindiver, J.; Skousen, J.; Gorman, J. Soil horizon development on a mountaintop surface mine in southern West Virginia. Green Lands 2000, 30, 41–52. [Google Scholar]
  8. Richter, D.; Hofmockel, M.; Callaham, M.A.; Powlson, D.S.; Smith, P. Long-term soil experiments: Keys to managing Earth’s rapidly changing ecosystems. Soil Sci. Soc. Am. J. 2007, 71, 266–279. [Google Scholar] [CrossRef]
  9. Weiler, J.; Firpo, B.A.; Schneider, I.A.H. Technosol as an integrated management tool for turning urban and coal mining waste into a resource. Miner. Eng. 2020, 147, 106179. [Google Scholar] [CrossRef]
  10. Stevens, P.; Walker, T. The chronosequence concept and soil formation. Q. Rev. Biol. 1970, 45, 333–350. [Google Scholar] [CrossRef]
  11. Walker, L.R.; Wardle, D.A.; Bardgett, R.D.; Clarkson, B.D. The use of chronosequences in studies of ecological succession and soil development. J. Ecol. 2010, 98, 725–736. [Google Scholar] [CrossRef]
  12. Uzarowicz, Ł.; Skiba, S. Technogenic soils developed on mine spoils containing iron sulphides: Mineral transformations as an indicator of pedogenesis. Geoderma 2011, 163, 95–108. [Google Scholar] [CrossRef]
  13. Uzarowicz, Ł. Microscopic and microchemical study of iron sulphide weathering in a chronosequence of technogenic and natural soils. Geoderma 2013, 197, 137–150. [Google Scholar] [CrossRef]
  14. Sencindiver, J.; Ammons, J. Minesoil genesis and classification. Reclam. Drastically Disturb. Lands 2000, 41, 595–613. [Google Scholar]
  15. Sena, K.L.; Yeager, K.M.; Barton, C.D.; Lhotka, J.M.; Bond, W.E.; Schindler, K.J. Development of Mine Soils in a Chronosequence of Forestry-Reclaimed Sites in Eastern Kentucky. Minerals 2021, 11, 422. [Google Scholar] [CrossRef]
  16. Skousen, J.; Daniels, W.L.; Zipper, C.E. Soils on Appalachian coal-mined lands. In Appalachia’s Coal-Mined Landscapes: Resources and Communities in a New Energy Era; Springer: Cham, Switzerland, 2021; pp. 85–109. [Google Scholar]
  17. Evangelou, V.B. Pyrite Oxidation and Its Control: Solution Chemistry, Surface Chemistry, Acid Mine Drainage (AMD), Molecular Oxidation Mechanisms, Microbial Role, Kinetics, Control, Ameliorates and Limitations, Microencapsulation; CRC Press: Boca Raton, FL, USA, 2018. [Google Scholar]
  18. Kruse Daniels, N.; LaBar, J.A.; McDonald, L.M. Acid Mine Drainage in Appalachia: Sources, Legacy, and Treatment. In Appalachia’s Coal-Mined Landscapes: Resources and Communities in a New Energy Era; Zipper, C.E., Skousen, J., Eds.; Springer International Publishing: Cham, Switzerland, 2021; pp. 193–216. [Google Scholar]
  19. Huot, H.; Simonnot, M.-O.; Morel, J.L. Pedogenetic trends in soils formed in technogenic parent materials. Soil Sci. 2015, 180, 182–192. [Google Scholar] [CrossRef] [Green Version]
  20. Daniels, W.L.; Haering, K.; Galbraith, J.; Thomas, J. Mine Soil Classification and Mapping Issues on Pre-and Post-SMCRA Appalachian Coal Mined Lands. Proc. Am. Soc. Min. Reclam. 2004, 2004, 450–481. [Google Scholar]
  21. Haering, K.C.; Daniels, W.L.; Galbraith, J.M. Appalachian Mine Soil Morphology and Properties. Soil Sci. Soc. Am. J. 2004, 68, 1315–1325. [Google Scholar] [CrossRef]
  22. ODNR. Huff Run Watershed Acid Mine Drainage Abatement and Treatment Plan—Prepared for Ohio DNR by Gannett Fleming. 2000. Available online: watersheddata.com (accessed on 1 November 2019).
  23. Lamborn, R.E. Geology of Tuscarawas County; Division of Geological Survey: Columbus, OH, USA, 1956; Volume 55. [Google Scholar]
  24. Wise, M. Huff Run Watershed Plan; Huff Run Watershed Restoration Partnership, Inc.: Mineral City, OH, USA, 2005. [Google Scholar]
  25. Singer, D.; Herndon, E.; Zemanek, L.; Cole, K.; Sanda, T.; Senko, J.; Perdrial, N. Biogeochemical Controls on the Potential for Long-Term Contaminant Leaching from Soils Developing on Historic Coal Mine Spoil. Soil Syst. 2021, 5, 3. [Google Scholar] [CrossRef]
  26. Yazbek, L.D.; Cole, K.A.; Shedleski, A.; Singer, D.; Herndon, E.M. Hydrogeochemical Processes Limiting Aqueous and Colloidal Fe Export in a Headwater Stream Impaired by Acid Mine Drainage. ACS EST Water 2020, 1, 68–78. [Google Scholar] [CrossRef]
  27. Herndon, E.; Yarger, B.; Frederick, H.; Singer, D.M. Iron and Manganese Biogeochemistry in Forested Coal Mine Spoil. Soil Syst. 2019, 3, 13. [Google Scholar] [CrossRef] [Green Version]
  28. Chowdhury, M.A.R.; Singer, D.M.; Herndon, E. Colloidal metal transport in soils developing on historic coal mine spoil. Appl. Geochem. 2021, 128, 104933. [Google Scholar] [CrossRef]
  29. ISO. Soil Quality—Determination of Dry Bulk Density; Croatian Standards Institute: Zagreb, Croatia, 2017. [Google Scholar]
  30. Dean, W.E. Determination of carbonate and organic matter in calcareous sediments and sedimentary rocks by loss on ignition; comparison with other methods. J. Sediment. Res. 1974, 44, 242–248. [Google Scholar]
  31. Konen, M.E.; Jacobs, P.M.; Burras, C.L.; Talaga, B.J.; Mason, J.A. Equations for predicting soil organic carbon using loss-on-ignition for north central US soils. Soil Sci. Soc. Am. J. 2002, 66, 1878–1881. [Google Scholar] [CrossRef]
  32. Yang, X.; Lee, J.; Barker, D.E.; Wang, X.; Zhang, Y. Comparison of six particle size distribution models on the goodness-of-fit to particulate matter sampled from animal buildings. J. Air Waste Manag. Assoc. 2012, 62, 725–735. [Google Scholar] [CrossRef]
  33. Anderson, D. Early stages of soil formation on glacial till mine spoils in a semi-arid climate. Geoderma 1977, 19, 11–19. [Google Scholar] [CrossRef]
  34. Brantley, S.L.; White, A.F. Approaches to modeling weathered regolith. Rev. Mineral. Geochem. 2009, 70, 435–484. [Google Scholar] [CrossRef]
  35. Phillips, J.D. The robustness of chronosequences. Ecol. Modell. 2015, 298, 16–23. [Google Scholar] [CrossRef]
  36. Roberts, J.; Daniels, W.; Burger, J.; Bell, J. Early stages of mine soil genesis in a southwest Virginia spoil lithosequence. Soil Sci. Soc. Am. J. 1988, 52, 716–723. [Google Scholar] [CrossRef]
  37. Haering, K.C.; Daniels, W.L.; Roberts, J.A. Changes in mine soil properties resulting from overburden weathering. J. Environ. Qual. 1993, 22, 194–200. [Google Scholar] [CrossRef]
  38. Zhao, Z.; Shahrour, I.; Bai, Z.; Fan, W.; Feng, L.; Li, H. Soils development in opencast coal mine spoils reclaimed for 1–13 years in the West-Northern Loess Plateau of China. Eur. J. Soil Biol. 2013, 55, 40–46. [Google Scholar] [CrossRef]
  39. Leguédois, S.; Séré, G.; Auclerc, A.; Cortet, J.; Huot, H.; Ouvrard, S.; Watteau, F.; Schwartz, C.; Morel, J.L. Modelling pedogenesis of Technosols. Geoderma 2016, 262, 199–212. [Google Scholar] [CrossRef]
  40. Mukhopadhyay, S.; Masto, R.E.; Tripathi, R.C.; Srivastava, N.K. Chapter 14—Application of Soil Quality Indicators for the Phytorestoration of Mine Spoil Dumps. In Phytomanagement of Polluted Sites; Pandey, V.C., Bauddh, K., Eds.; Elsevier: Amsterdam, The Netherlands, 2019; pp. 361–388. [Google Scholar]
  41. Mobilian, C.; Craft, C.B. Wetland Soils: Physical and Chemical Properties and Biogeochemical Processes. In Encyclopedia of Inland Waters, 2nd ed.; Mehner, T., Tockner, K., Eds.; Elsevier: Oxford, UK, 2022; pp. 157–168. [Google Scholar]
  42. Filcheva, E.; Noustorova, M.; Gentcheva-Kostadinova, S.; Haigh, M. Organic accumulation and microbial action in surface coal-mine spoils, Pernik, Bulgaria. Ecol. Eng. 2000, 15, 1–15. [Google Scholar] [CrossRef]
  43. Nyenda, T.; Gwenzi, W.; Jacobs, S. Changes in physicochemical properties on a chronosequence of gold mine tailings. Geoderma 2021, 395, 115037. [Google Scholar] [CrossRef]
  44. Six, J.; Guggenberger, G.; Paustian, K.; Haumaier, L.; Elliott, E.T.; Zech, W. Sources and composition of soil organic matter fractions between and within soil aggregates. Eur. J. Soil Sci. 2001, 52, 607–618. [Google Scholar] [CrossRef]
  45. Jangorzo, N.S.; Watteau, F.; Hajos, D.; Schwartz, C. Nondestructive monitoring of the effect of biological activity on the pedogenesis of a Technosol. J. Soils Sediments 2015, 15, 1705–1715. [Google Scholar] [CrossRef]
  46. Bojko, O.; Kabała, C. Loss-on-ignition as an estimate of total organic carbon in the mountain soils. Pol. J. Soil Sci. 2014, 47, 72–79. [Google Scholar] [CrossRef]
  47. Keller, T.; Håkansson, I. Estimation of reference bulk density from soil particle size distribution and soil organic matter content. Geoderma 2010, 154, 398–406. [Google Scholar] [CrossRef]
  48. Ganjegunte, G.K.; Wick, A.F.; Stahl, P.D.; Vance, G.F. Accumulation and composition of total organic carbon in reclaimed coal mine lands. Land Degrad. Dev. 2009, 20, 156–175. [Google Scholar] [CrossRef]
  49. Insam, H.; Domsch, K. Relationship between soil organic carbon and microbial biomass on chronosequences of reclamation sites. Microb. Ecol. 1988, 15, 177–188. [Google Scholar] [CrossRef]
  50. Chittleborough, D.; Walker, P.; Oades, J. Textural differentiation in chronosequences from eastern Australia, II. Evidence from particle-size distributions. Geoderma 1984, 32, 203–226. [Google Scholar] [CrossRef]
  51. Price, J.R.; Velbel, M.A.; Patino, L.C. Rates and time scales of clay-mineral formation by weathering in saprolitic regoliths of the southern Appalachians from geochemical mass balance. GSA Bull. 2005, 117, 783–794. [Google Scholar] [CrossRef]
  52. Jambor, J.; Weisener, C. The geochemistry of acid mine drainage. Environ. Geochem. 2005, 9, 149. [Google Scholar]
  53. Bini, C.; Gaballo, S. Pedogenic trends in anthrosols developed in sulfidic mine spoils: A case study in the Temperino mine archaeological area (Campiglia Marittima, Tuscany, Italy). Quat. Int. 2006, 156, 70–78. [Google Scholar] [CrossRef]
  54. Singer, D.M.; Herndon, E.; Cole, K.; Burkey, M.; Morisson, S.; Cahill, M.; Bartucci, M.A. Micron-scale distribution controls metal(loid) release during simulated weathering of a Pennsylvanian coal shale. Geochim. Cosmochim. Acta 2020, 269, 117–135. [Google Scholar] [CrossRef]
  55. Sánchez España, J. Chapter 7—The Behavior of Iron and Aluminum in Acid Mine Drainage: Speciation, Mineralogy, and Environmental Significance. In Thermodynamics, Solubility and Environmental Issues; Letcher, T.M., Ed.; Elsevier: Amsterdam, The Netherlands, 2007; pp. 137–150. [Google Scholar]
  56. Kim, H.-J.; Kim, Y. Schwertmannite transformation to goethite and the related mobility of trace metals in acid mine drainage. Chemosphere 2021, 269, 128720. [Google Scholar] [CrossRef]
  57. Fitzpatrick, R.W.; Mosley, L.M.; Raven, M.D.; Shand, P. Schwertmannite formation and properties in acidic drain environments following exposure and oxidation of acid sulfate soils in irrigation areas during extreme drought. Geoderma 2017, 308, 235–251. [Google Scholar] [CrossRef]
  58. Bigham, J.; Schwertmann, U.; Traina, S.; Winland, R.; Wolf, M. Schwertmannite and the chemical modeling of iron in acid sulfate waters. Geochim. Cosmochim. Acta 1996, 60, 2111–2121. [Google Scholar] [CrossRef]
  59. Wood, D.L.; Cole, K.A.; Herndon, E.M.; Singer, D.M. Lime slurry treatment of soils developing on abandoned coal mine spoil: Linking contaminant transport from the micrometer to pedon-scale. Appl. Geochem. 2023, 151, 105617. [Google Scholar] [CrossRef]
  60. Chowdhury, M.A.R.; Singer, D.M. Trace Metal Enrichment in the Colloidal Fraction in Soils Developing on Abandoned Mine Spoils. Minerals 2022, 12, 1290. [Google Scholar] [CrossRef]
  61. Huminicki, D.M.C.; Rimstidt, J.D. Iron oxyhydroxide coating of pyrite for acid mine drainage control. Appl. Geochem. 2009, 24, 1626–1634. [Google Scholar] [CrossRef]
  62. Gu, X.; Heaney, P.J.; Reis, F.D.A.A.; Brantley, S.L. Deep abiotic weathering of pyrite. Science 2020, 370, eabb8092. [Google Scholar] [CrossRef]
  63. Buerge-Weirich, D.; Hari, R.; Xue, H.; Behra, P.; Sigg, L. Adsorption of Cu, Cd, and Ni on goethite in the presence of natural groundwater ligands. Environ. Sci. Technol. 2002, 36, 328–336. [Google Scholar] [CrossRef]
  64. Karapınar, N. Removal of heavy metal ions by ferrihydrite: An opportunity to the treatment of acid mine drainage. Water Air Soil Pollut. 2016, 227, 193. [Google Scholar] [CrossRef]
  65. Dang, Z.; Liu, C.; Haigh, M.J. Mobility of heavy metals associated with the natural weathering of coal mine spoils. Environ. Pollut. 2002, 118, 419–426. [Google Scholar] [CrossRef]
  66. Yin, X.; Gao, B.; Ma, L.Q.; Saha, U.K.; Sun, H.; Wang, G. Colloid-facilitated Pb transport in two shooting-range soils in Florida. J. Hazard. Mater. 2010, 177, 620–625. [Google Scholar] [CrossRef]
  67. Carbone, C.; Dinelli, E.; Marescotti, P.; Gasparotto, G.; Lucchetti, G. The role of AMD secondary minerals in controlling environmental pollution: Indications from bulk leaching tests. J. Geochem. Explor. 2013, 132, 188–200. [Google Scholar] [CrossRef]
  68. Marescotti, P.; Carbone, C.; Comodi, P.; Frondini, F.; Lucchetti, G. Mineralogical and chemical evolution of ochreous precipitates from the Libiola Fe–Cu-sulfide mine (Eastern Liguria, Italy). Appl. Geochem. 2012, 27, 577–589. [Google Scholar] [CrossRef]
  69. Silva, S.H.G.; Hartemink, A.E.; Teixeira, A.F.D.S.; Inda, A.V.; Guilherme, L.R.G.; Curi, N. Soil weathering analysis using a portable X-ray fluorescence (PXRF) spectrometer in an Inceptisol from the Brazilian Cerrado. Appl. Clay Sci. 2018, 162, 27–37. [Google Scholar] [CrossRef]
  70. Larsen, D.; Mann, R. Origin of high manganese concentrations in coal mine drainage, eastern Tennessee. J. Geochem. Explor. 2005, 86, 143–163. [Google Scholar] [CrossRef]
  71. Chaput, D.L.; Hansel, C.M.; Burgos, W.D.; Santelli, C.M. Profiling Microbial Communities in Manganese Remediation Systems Treating Coal Mine Drainage. Appl. Environ. Microbiol. 2015, 81, 2189–2198. [Google Scholar] [CrossRef] [PubMed] [Green Version]
  72. Roberts, D.R.; Ford, R.; Sparks, D.L. Kinetics and mechanisms of Zn complexation on metal oxides using EXAFS spectroscopy. J. Colloid Interface Sci. 2003, 263, 364–376. [Google Scholar] [CrossRef] [PubMed]
  73. Voegelin, A.; Jacquat, O.; Pfister, S.; Barmettler, K.; Scheinost, A.C.; Kretzschmar, R. Time-Dependent Changes of Zinc Speciation in Four Soils Contaminated with Zincite or Sphalerite. Environ. Sci. Technol. 2010, 45, 255–261. [Google Scholar] [CrossRef] [PubMed]
  74. Manceau, A.; Tommaseo, C.; Rihs, S.; Geoffroy, N.; Chateigner, D.; Schlegel, M.; Tisserand, D.; Marcus, M.A.; Tamura, N.; Chen, Z.-S. Natural speciation of Mn, Ni, and Zn at the micrometer scale in a clayey paddy soil using X-ray fluorescence, absorption, and diffraction. Geochim. Cosmochim. Acta 2005, 69, 4007–4034. [Google Scholar] [CrossRef] [Green Version]
  75. Chittleborough, D. Indices of weathering for soils and palaeosols formed on silicate rocks. Aust. J. Earth Sci. 1991, 38, 115–120. [Google Scholar] [CrossRef]
  76. Horváth, T.; Szilágyi, V.; Hartyáni, Z. Characterization of trace element distributions in soils. Microchem. J. 2000, 67, 53–56. [Google Scholar] [CrossRef]
  77. Griffith, M.B.; Norton, S.B.; Alexander, L.C.; Pollard, A.I.; LeDuc, S.D. The effects of mountaintop mines and valley fills on the physicochemical quality of stream ecosystems in the central Appalachians: A review. Sci. Total Environ. 2012, 417–418, 1–12. [Google Scholar] [CrossRef]
Figure 1. (A) Location of the Huff Run Watershed (in red), with Ohio coal counties shown in light gray and known abandoned coal mines in dark gray (ODNR, 2014); (B) watershed map (ODNR, 2000) showing location of subwatershed HR-25 (in yellow); (C) sample location map produced in Google Earth where yellow pins indicate spoil pile sample locations, with the location of the HR-25 tributary and Huff Run outlined in blue; and (D) sample location elevation (in meters) as a function sampling location.
Soilsystems 07 00059 g001
Figure 2. (A) Bulk density values (g cm−3) for each of the dried spoil pile samples (pile number nine (open symbol) was not included in the statistical analysis, as the proper sampling technique was not possible). (B) Loss on ignition values for the spoil piles, given as percent of mass lost through combustion at 550 °C. Error bars represent the sample standard deviation of two replicate samples. Rho and p-values are shown for the regressions (dashed lines).
Soilsystems 07 00059 g002
Figure 3. (A) Particle size distribution of spoil samples, where sand is defined as 2 mm to 63 µm, silt as 63 µm to 2 µm, and clay as less than 2 µm. (B) Bulk mineralogical composition of the spoil pile soils; feldspars is the sum of albite, anorthite, and microcline.
Soilsystems 07 00059 g003
Figure 4. Bulk elemental composition data presented in groupings based on correlations identified in Figure 5. Concentration values over the spoil pile transect are presented in weight percent (wt.%) or parts per million (ppm) as identified on y-axis. Dashed lines represent average shale parent material concentrations as published in previous study [5]; if no dashed line is present, then this element was not reported.
Soilsystems 07 00059 g004
Figure 5. Correlation matrix showing positive (blue) and negative (red) correlations among soil parameters, where dark shading represents a strong positive (x > 0.5, dark blue) or negative correlation (x < −0.5, dark red), and light shading (light blue and light red) represents weak correlations (0.5 > x > −0.5). White squares fall below a significance level of 0.05. Positive correlation clusters are numbered in black.
Soilsystems 07 00059 g005
Figure 6. Conceptual model showing the major trends in properties observed in the mine soil with respect to elevation, age of mine spoil, and changes in vegetation over time.
Soilsystems 07 00059 g006
Disclaimer/Publisher’s Note: The statements, opinions and data contained in all publications are solely those of the individual author(s) and contributor(s) and not of MDPI and/or the editor(s). MDPI and/or the editor(s) disclaim responsibility for any injury to people or property resulting from any ideas, methods, instructions or products referred to in the content.

