Article

Characterization of Phosphate Compounds along a Catena from Arable and Wetland Soil to Sediments in a Baltic Sea lagoon

1
Soil Science, Faculty of Agricultural and Environmental Science, University of Rostock, Justus-von-Liebig-Weg 6, 18059 Rostock, Germany
2
Department of Applied Ecology, Institute of Biological Sciences, University of Rostock, Albert-Einstein-Straße 3, 18059 Rostock, Germany
3
Synchrotron Light Research Institute, Muang District, 111 University Avenue, Nakhon Ratchasima 3000, Thailand
4
Department of Life, Light and Matter, Interdisciplinary Faculty, University of Rostock, Albert-Einstein-Straße 25, 18051 Rostock, Germany
*
Author to whom correspondence should be addressed.
Soil Syst. 2023, 7(1), 15; https://doi.org/10.3390/soilsystems7010015
Submission received: 10 January 2023 / Revised: 31 January 2023 / Accepted: 3 February 2023 / Published: 7 February 2023

Abstract

:
Phosphorus (P) is an indispensable nutrient for arable crops, but at the same time, contributes to excessive eutrophication in aquatic ecosystems. Knowledge about P is essential to assess the possible risks of P being transported towards vulnerable aquatic ecosystems. Our objective was to characterize P along a catena from arable and wetland soils towards aquatic sediments of a shallow lagoon of the Baltic Sea. The characterization of P in soil and sediment samples included a modified sequential P fractionation and P K-edge X-ray absorption near edge structure (XANES) spectroscopy. The concentrations of total P ranged between 390 and 430 mg kg−1 in the arable soils, between 728 and 2258 mg kg−1 in wetland soils and between 132 and 602 mg kg−1 in lagoon sediments. Generally, two sinks for P were revealed along the catena. The wetland soil trapped moderately stable P, Al-P and molybdate-unreactive P (MUP), which are most likely organically bound phosphates. Sediments at the deepest position of the catena acted as a sink for, MUP compounds among the lagoon sediments. Thus, wetlands formed by reed belts can help to prevent the direct transfer of P from arable soils to adjacent waters and deeper basins and help to avoid excessive eutrophication in shallow aquatic ecosystems.

1. Introduction

Coastal wetlands, as open systems, link terrestrial and aquatic ecosystems and play an important role in the environment as habitats for fish and birds, for erosion protection and for the biogeochemical cycling of nutrients in nearby coastal sites or adjacent land [1,2,3]. Phosphorus (P) is an essential element for all living organisms, in coastal wetlands as well as in terrestrial ecosystems, as it contributes to crop yields in arable farming, but at the same time, it has been identified as one of the major factors responsible for eutrophication in wetlands and aquatic ecosystems [3,4]. Eutrophication causes various negative environmental impacts, such as excessive algal blooms, water oxygen depletion and the release of hazardous toxins [4,5]. As P from agricultural fertilization is primarily conserved in soils and can be transported from terrestrial to aquatic ecosystems [6], it is important to develop sustainable agricultural practices and similarly ensure the protection of the environment [7].
The German coast of the Baltic Sea is characterized by large coastal wetlands, adjoining arable soils on one side and aquatic lagoon systems on the other side [8]. Thus, there is a high probability of nutrients, and particularly P, from fertilized arable soils being transported into the adjacent wetland soils, water bodies and sediments, but these expected transfer processes have not been disclosed in detail. Generally, the speciation of P affects the risk of P transportation to surface waters [9], as well as P availability for plant uptake. Thus, knowledge about the P speciation in soils and its transformation processes towards the coast are essential to assess the possible risks of P transportation into aquatic ecosystems and to develop measures to prevent excessive P inputs into vulnerable water bodies.
Many previous studies have investigated chemical P composition in agricultural soils (e.g., [10,11,12]), sediments (e.g., [13,14,15]) and P in the water column (e.g., [16,17,18]). Nonetheless, in-depth knowledge at the molecular level about P speciation and the transport of P species from soils to sediments is scarce [19]. Furthermore, few studies have investigated the P speciation of samples at the fluent boundaries between terrestrial soils and sediments in aquatic environments along sequences. For instance, accumulations of organic P (Po) in muck soils and fractions of inorganic P (Pi) in adjacent river/lake sediments have been reported from Ontario, Canada [20]. Another investigation of a transect from arable soils in northern Germany towards sediments of the central Baltic Sea revealed a similar distribution of Pi and Po fractions in the soils and sediments [21]. Furthermore, an increase in the proportion of stable P fractions (i.e., H2SO4-P and residual-P) compared to iron-associated P with increasing distances was reported in the same study, which covered a transect from the coastline to central Baltic Sea sediments with a length of about 600,000 m [21]. However, it is unknown which P transformation processes occur at a smaller scale from coastal arable and wetland soils to adjacent sediments from a shallow Bodden of the Baltic Sea with a transect length of about 700 m.
The aim of this study was to characterize the P compounds along a sequence from arable and wetland soils towards aquatic sediments from a shallow lagoon of the Baltic Sea to fill in the knowledge gap in the course of medium-scale (hundreds of meters) spatial expansion. We want to test whether the previously disclosed transition of labile Al- and Fe-associated P species in terrestrial soils to more stable and Ca-bound P in aquatic sediments along a large-scale transect towards the Central Baltic Sea [21] also applies to the specific geomorphological setting of a medium-scale transect. The overall objective of the research is to disclose the general pathways of P species transformations along moisture gradients from land to waters, irrespective of the scale of the study area.

2. Materials and Methods

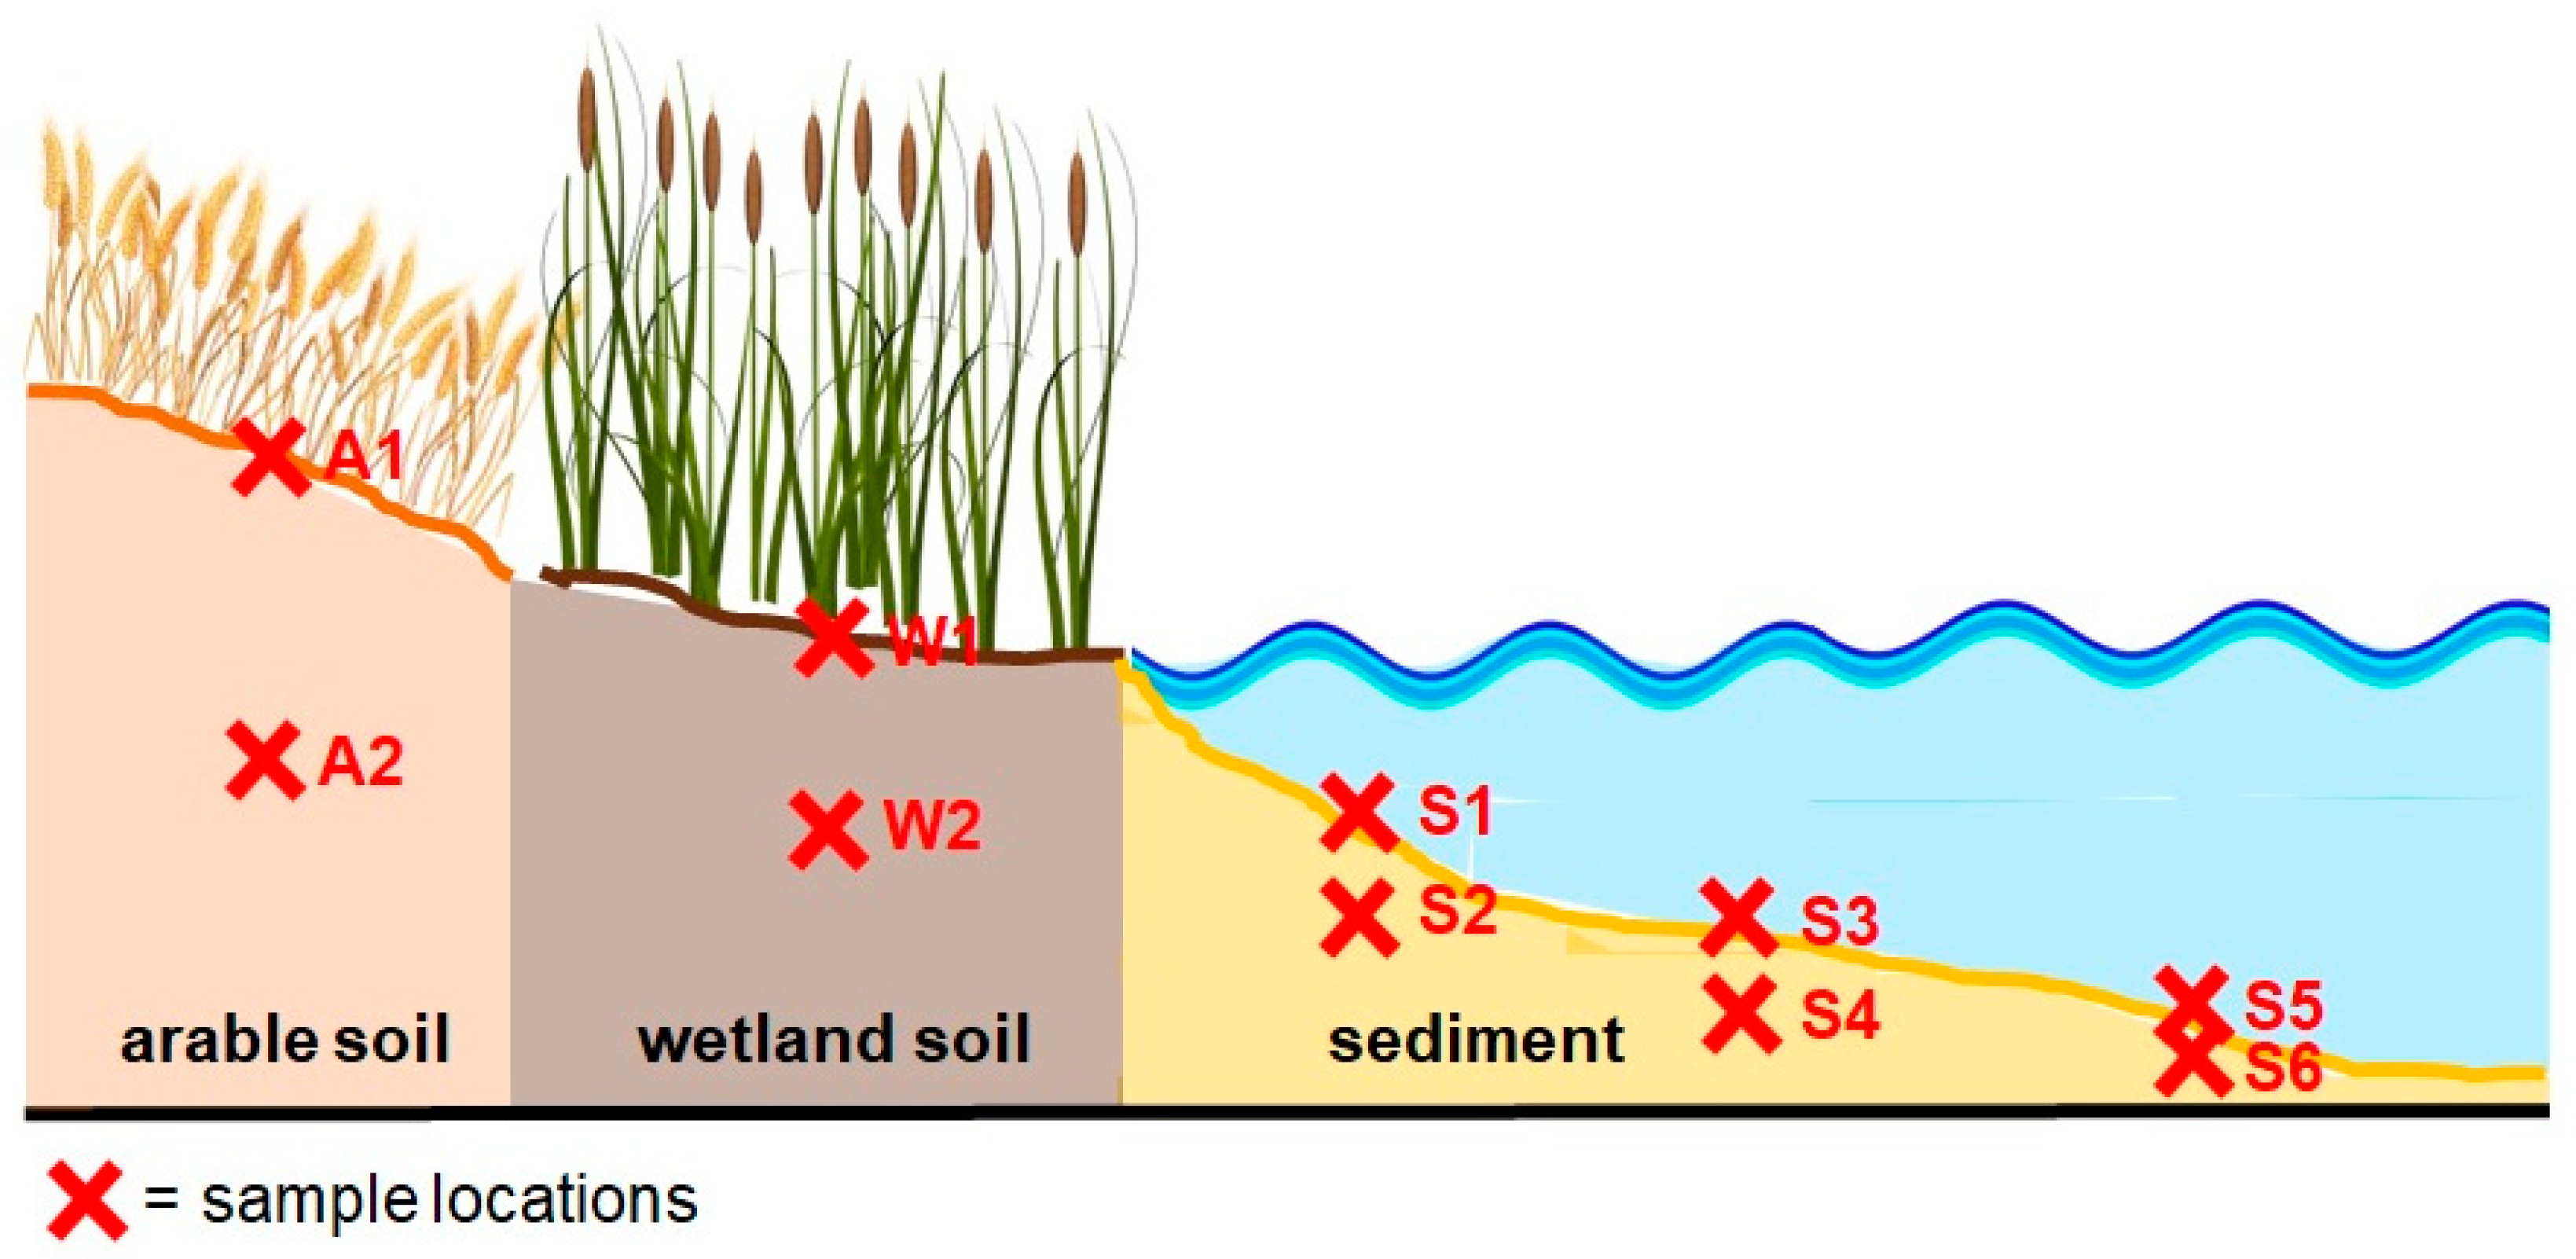
2.1. Sampling Area, Soil and Sediment Collection

Sampling of the soils and sediments took place in summer 2018 near the village Dabitz in Mecklenburg-Western Pomerania in the area of Darss-Zingst Bodden Chain, a lagoon system at the Southern Baltic Sea in Germany. The transect expands from N54°22′08.00″ E12°48′08.00″ to N54°22′09.31″ E12°48′33.50″. The study area includes three ecologically different sites: (1) an arable field cropped with barley; (2) an adjoining coastal wetland covered by Phragmites australis; and (3) a shallow water body with a mean water depth of 2 m. For more details, such as a description of the vegetation, water and sediment characteristics of the wetland, see an earlier investigation [22].
The soil samples and sediment cores were taken at two depths along a transect from an arable field (A1, A2) continued to the directly bordering wetland (W1, W2) and the adjacent Bodden sediments at three different water depths (S1, S2; S3, S4; and S5, S6). The study area and the sampling sites along the transect are visualized in Supplemental Figure S1. The sample description and labeling are compiled in Table 1, and Figure 1 shows a schematic drawing of the sampling strategy. The total distance between the first and the terminal sample of the transect is approximately 700 m. Two or three single subsamples per depth (decided according to visual agreement/disagreement in sample color/structure) were taken at an area of approximately one m2 and merged to one mixed sample for each soil and sediment sample location and depth. This merging was conducted if samples showed almost similar results for the basic parameters, such as water content (differing by 0 to 3% (w/w) except for two outliers with 13 and 17% (w/w) for samples W1 and W2), pH (differing by 0.1 to 0.8 pH-units), and C, N and S contents (differing by 0 to 1% (w/w), except for one outlier with 8% difference in C-content (sample W1)). In this way, we reduced the effects of small-scale heterogeneity and, at the same time, limited the number of samples to be analyzed. Furthermore, in a recent study examining sample pretreatments of soils and sediments, we concluded that an identical pretreatment of the soils and sediments resulted in no fundamental changes to their P speciation [23]. For this reason, all of the soil and sediment samples of the present investigation were dried at 40 °C, sieved <2 mm and finely ground in a mortar mill prior to further analyses.
The soil texture of the cropland at the study site was characterized as loamy sand [22] and the sediment textures of the adjacent Bodden sediments were fine to medium sands [24].

2.2. Determination of Water Contents and the Total Concentrations of C, N, S, CaCO3, P, Ca, Mg, Al, Fe

The water contents were determined by sample weighing before and after drying at 105 °C to constant weight. The contents of total carbon (C), nitrogen (N) and sulphur (S) were obtained through the dry combustion of finely ground soil and sediment material using an elemental analyzer (VARIO EL, Elementar Analysensysteme GmbH, Hanau, Germany). The percentages of soil and sediment calcium carbonate (CaCO3) were determined using a Scheibler calcimeter, by calculating the carbon dioxide (CO2) volume resulting from the reaction of hydrochloric acid (HCl) with the sample CaCO3. The elemental concentrations of total P (Pt), calcium (Ca), magnesium (Mg), aluminum (Al), iron (Fe) and zinc (Zn) were determined by microwave-assisted digestion (Mars Xpress CEM GmbH Kamp-Linfort, Germany) of ≤50 mg soil or sediment with aqua regia consisting of 2 mL nitric acid (HNO3) and 6 mL HCl (ISO standard 11466). The element concentrations in the digests were determined with an inductively coupled plasma-optical emission spectrometer (ICP-OES) at wavelengths of 214.914 nm for P, 317.933 nm for Ca, 258.213 nm for Mg, 396.153 nm for Al and 238.204 nm for Fe.

2.3. Sequential P Fractionation

A slightly modified sequential P-fractionation method was used to extract different P fractions from soil and sediment [25,26]. Approximately 0.42 g finely-ground soil or sediment was weighed into 50 mL centrifuge tubes. The samples were shaken for 18 h at room temperature, followed by centrifugation at 4000× g for 20 min, and decanted. The chemical P fractionation included the following extraction steps: (1) H2O; (2) anion resin strips (55,164 2S, BDH Laboratory Supplies, Poole, England); (3) 0.5 M NaHCO3; (4) 0.1 M NaOH; (5) 1 M H2SO4. In the second extraction step, P was removed from the resin using 1 M HCl. The P fractions were interpreted as follows: water (H2O-P) and resin P (resin-P) representing the easily exchangeable and mobile P, molybdate-reactive (NaHCO3-Pmr) and molybdate-unreactive (NaHCO3-Pmu) bicarbonate P representing labile Pmr and Pmu weakly adsorbed to mineral surfaces as well as microbial P, molybdate-reactive (NaOH-Pmr) and molybdate-unreactive (NaOH-Pmu) sodium hydroxide P representing moderately labile Pmr and Pmu adsorbed to Al- and Fe-oxide minerals and P in humic substances, eventually also associated with Fe and Al. The H2SO4-P fraction represents the insoluble P, associated with Ca and Mg minerals and apatite [25]. The Pt in the different extracts was measured in the decanted supernatants using an ICP-OES, while the remaining sediment pellet was used for the next extraction step. The molybdate-reactive P (Pmr) concentrations in the extracts were determined colorimetrically with the molybdate blue method [27]. The concentration of the molybdate-unreactive P (Pmu) was estimated by subtracting Pmr from Pt. The concentration of the non-extracted P (Residual-P) was calculated as the difference between the sum of the P fractions and the Pt concentration determined after digestion with aqua regia.
The application of the fractionation scheme, which was originally developed for estimating the plant availability of P in amended soils, to sediments is a challenge, as different fractionation schemes have been developed and applied for sediments (e.g., [28]). In the sediment method, samples are sequentially extracted with NH4Cl, dithionite-citrate-bicarbonate, NaOH and HCl. It is similar to the soil fractionation in starting with mild extractant to remove loosely sorbed P (NH4Cl vs. H2O and anion exchange resin), P bound in humic substances (NaOH) and finalizing with the removal of relatively stable Ca-bound P by strong mineral acid (concentrated HCl or H2SO4). The major difference is the reduction in the Fe-oxides by dithionite-citrate-bicarbonate in the sediment fractionation, which is not involved in soil fractionation. Thus, the latter fractionation does not allow for estimating the amount of Fe-bound P; however, this can be derived from P K-edge XANES in a multimethod approach. Thus, in summary, the P fractionation schemes for soils and sediments are expected to yield similar results for the proportions of the most labile and most stable P fractions, and may be replaced by each other in this respect.

2.4. P K-Edge XANES Analysis

The P K-edge XANES spectra were recorded at the Synchrotron Light Research Institute (SLRI) in Nakhon 65 Ratchasima, Thailand, on the beamline 8 (BL8) of the electron storage ring with a covering photon energy from 1.25 to 10 KeV, electron energy operated at 1.2 GeV and a beam current of 80–150 mA [29]. The XANES data were collected from dry and finely-ground samples, thinly spread on P-free kapton tape (Lanmar Inc., Northbrook, IL, USA) and attached to a plastic sample holder. The data collection was operated in standard conditions with energy calibration by standard elemental P and allocating the reference energy (E0) at 2145.5 eV using the maximum peak of the first derivative spectrum. All of the spectra were recorded at photon energies between 2045.5 and 2495.5 eV in step sizes of 5 eV (2045.5 to 2105.5 eV and 2245.5 to 2495.5 eV), 1 eV (2105.5 to 2135.5 eV and 2195.5 to 2245.5 eV) and 0.25 eV (2135.5 to 2195.5 eV) with a 13-channel germanium detector in fluorescence mode. Two to four scans were collected and averaged for each sample.
All of the P K-edge XANES spectra were normalized, and the replicates were merged. Linear combination fitting (LCF) was performed using the ATHENA software package [30] in the energy range between −20 eV and +30 eV of E0. The XANES spectral data were baseline corrected in the pre-edge region between 2115 and 2145 eV and normalized in the post-edge region of 2190–2215 eV. The same ranges were used for the reference P K-edge XANES spectra to achieve consistency in the following fitting analysis [31]. To achieve the best compatible set of references with each specified sample spectrum, LCF analysis was performed using the combinatorics function of the ATHENA software to attain all of the possible binary to quaternary combinations between all 19 P reference spectra, in which the share of each compound was ≥10%. The following set of reference P K-edge XANES spectra, all recorded in SLRI under the same adjustments [31,32], were used for fitting and calculations: Ca, Al and Fe phytate, noncrystalline and crystalline AlPO4, noncrystalline and crystalline FePO4·2H2O, Ca 5-hydroxyapatite (Ca5(OH)(PO4)3), inositol hexakisphosphate/phytate (IHP), ferrihydrite–IHP, montmorillonite–Al–IHP, soil organic matter (OM) Al–IHP (SOM–Al–IHP), ferrihydrite–orthophosphate, montmorillonite–Al–orthophosphate, SOM–Al–orthophosphate, boehmite–IHP, boehmite–10 orthophosphate, CaHPO4, Ca(H2PO4)2 and MgHPO4. The R-factor values were used as goodness-of-fit criteria and significant differences between fits were evaluated using the Hamilton test (p < 0.05) [33], with the number of independent data points calculated by ATHENA and estimated as the data range divided by the core-hole lifetime broadening. The best fits of the P reference compound combinations were considered as the most probable P species in the material. If the R factors of the fits with the same number of reference compounds were not significantly different from each other according to the Hamilton test, the fit proportions were averaged. For this reason, the averaged proportions of some reference compounds can be ≤10%.

2.5. Statistical Analysis

The data analysis was performed using the open-source statistical software R (version 3.6.3). The R package agricolae was used for the Tukey’s honest significant difference (HSD) test, which enables multiple comparisons (significance level 0.05). The Tukey’s HSD test was used to find differences in the elemental concentrations and the results of the sequential P fractionation between sampling sites and depths.

3. Results

3.1. Soil and Sediment Characteristics

The water contents of the arable and wetland soils and sediments differed greatly. The arable soil samples A1 and A2 contained less than 10% (w/w) water, while the wetland soils W1 and W2 contained up to 62% (w/w) water. The sediments S1 to S4 had about 20% (w/w) water and maximum water contents of up to 75% were measured in the sediments S5 and S6 (Table 2). CaCO3 was found in the arable soil samples A1 (6%) and A2 (14%). The wetland soil and the sediments did not contain measurable amounts of CaCO3.
The concentrations of the total C ranged between 14,500 and 136,900 mg kg−1 in the soil and between 2500 and 67,000 mg kg−1 in the sediment samples (Table 2). Whereas the C contents were extremely low in the sediments S1 to S4, there were much higher contents in the sediments S5 and S6 from a water depth of 230 cm. The average C percentages were more than two times higher in the arable and wetland soils compared to the sediments. The maximum N concentrations were determined in the soil W1 (12,500 mg kg−1) and in the sediments S5 (7500 mg kg−1) and S6 (6200 mg kg−1). The average N concentrations were, again, about two times higher in the soils compared to the sediments. The highest S concentrations were present in the sediments S5 (15,600 mg kg−1) and S6 (14,700 mg kg−1), while all of the other sediment and soil samples had <4000 mg kg−1 S.
The order of the concentrations of P agreed with the C and N concentrations of the soils and sediments (Table 2). The soil W1 had the maximum concentration, of 2258 mg P kg−1. Minimum concentrations of 130 to 140 mg P kg−1 were present in the sediments S1 to S4, with no significant differences, whereas sediments S5 and S6 again had higher P concentrations, of 602 and 551 mg kg−1. On average, the P concentrations were more than three times higher in the arable and wetland soils than in the sediments. The highest Ca concentration was present in the soil A2 and, overall, the average Ca concentrations were about 14 times higher in the soils compared to the sediments. For the concentrations of the elements Mg, Al and Fe, there were also differences between the soils and sediments, but not as clear as for Ca. The arable and wetland soils contained, on average, about 1.8 to 3.3 times more Mg, Al and Fe than the sediments.

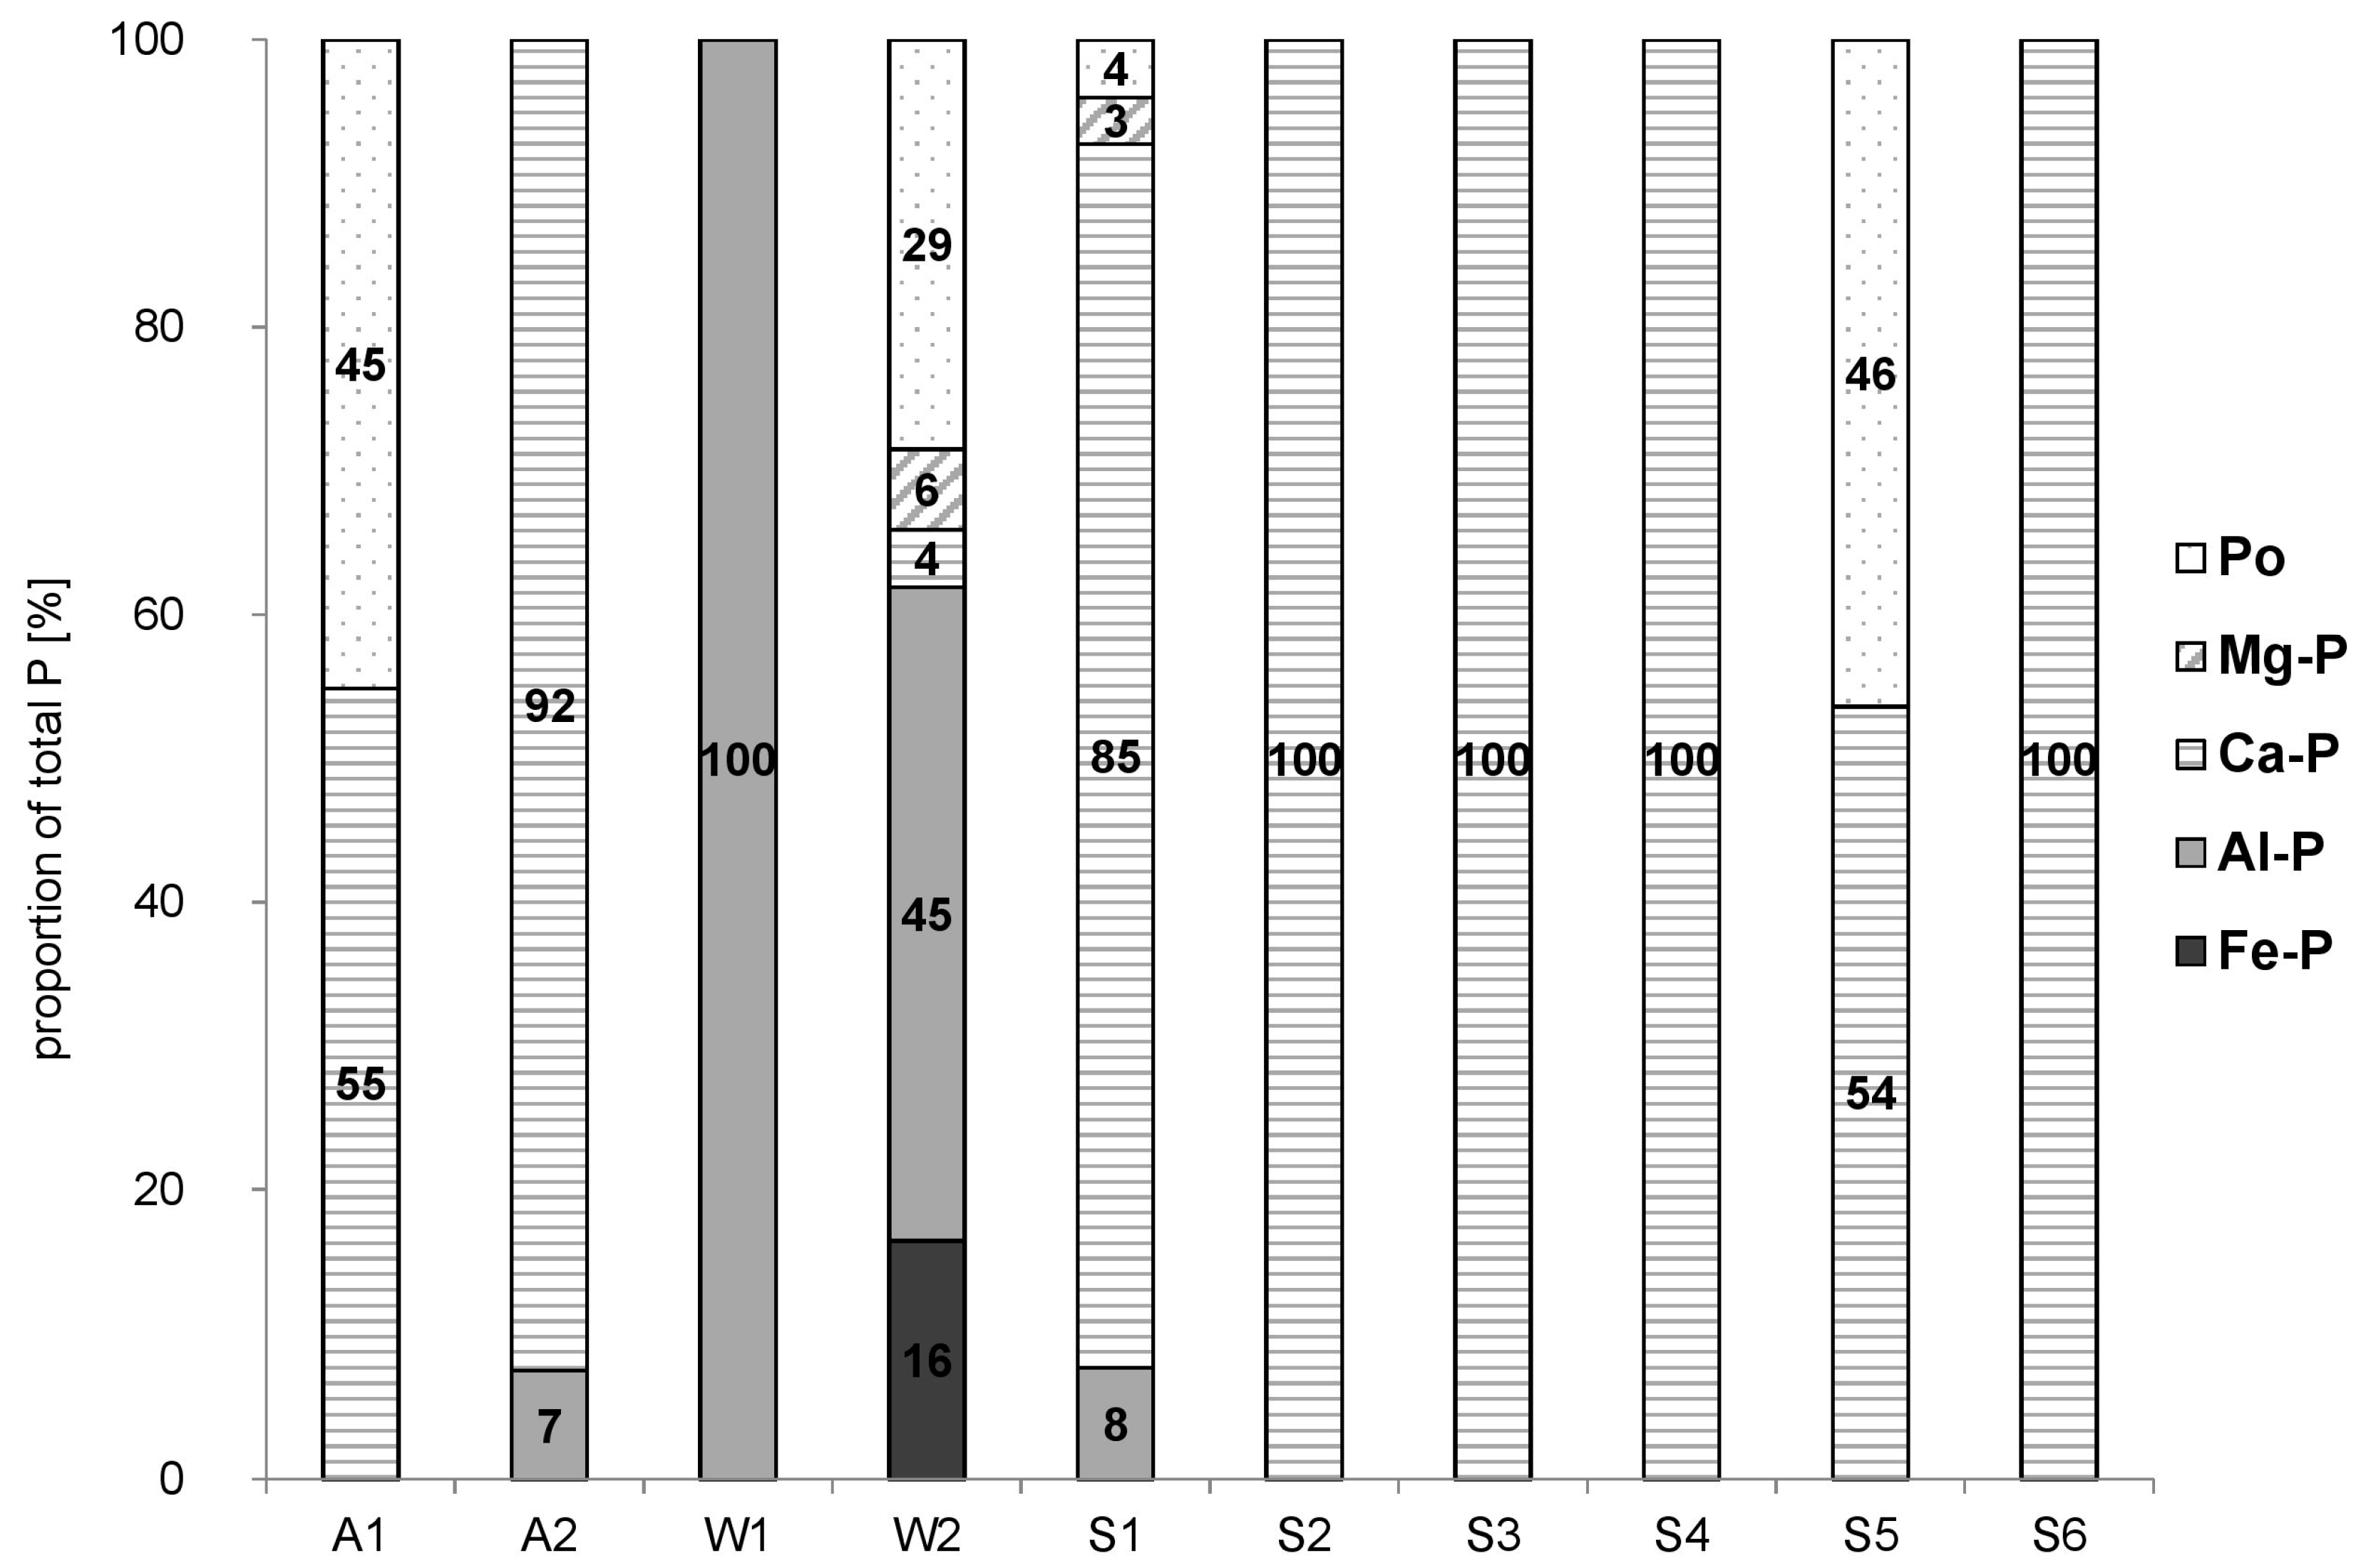
3.2. Sequentially Extracted P Fractions

The sequential chemical fractionation extracted, on average, 89% of the Pt across all of the samples (Table 3). With the exception of W1, H2SO4-Pmr was generally the largest fraction, ranging between 25% and 67% of Pt in the soil and sediment samples. The maximum amount of P in the wetland soil W1 was present in the residual-P fraction. In most of the sequentially extracted fractions, the proportions of Pmr were higher than Pmu, except for the sediments S5 and S6 in the fractions of NaHCO3 and NaOH, and for the soil W2 in the fraction of NaOH, where Pmu was predominant. Furthermore, it is noticeable that, although the absolute concentrations of P in the easily exchangeable and plant-available fractions of H2O-P and resin-P were rather low in the sediments S1 to S4, their relative amounts of 7% to 24% of Pt were higher than in the soils and deeper sediments. There were no significant differences among the concentrations of NaHCO3-Pmr among the soils and sediments, except for W1, in which the maximum concentration of 275 mg P kg−1 was determined. In the fraction of NaOH-Pmr there were also few significant differences between the samples. Exclusively the upper and lower wetland soil samples W1 and W2 contained significantly more NaOH-Pmr than the other soils and sediments.

3.3. Bulk P K-Edge XANES Spectra

All XANES spectra and R factors from LCF of XANES analyses are compiled in Supplementary Materials. The XANES spectra were all characterized by an intense white line peak at around 2152 eV and varying pre- and post-edge features. The R factors from the LCF were 0.0033 to 0.0161 for the soil samples and 0.0022 to 0.0095 for the sediment samples (all R factors are compiled in Table S1 of Supplementary Materials). The P speciation of all the samples, based on the XANES spectra and LCF, are displayed in Figure 2 (corresponding XANES spectra in Figure S2 of Supplementary Materials). The proportions of the specific Fe-, Al- and Ca-P compounds were grouped to Fe-P, Al-P, Ca-P, Mg-P and Po. The average proportions of the summed Ca-P compounds were lower in the arable and wetland soils (38%) compared to the sediments (89%). All of the arable soil and sediment samples were dominated by Ca-associated P compounds. In the upper wetland soil, W1, exclusively Al-P compounds were assigned by the XANES spectroscopy, and in the corresponding subsoil sample W2, Al-, Fe-P and Po compounds were predominant. The proportions of Po compounds were exclusively present in A1, W2 and S5 in considerable amounts.

4. Discussion

4.1. Elemental Characteristics

The wetland is located near the ground- and surface-water, whereas the arable soil is situated at a higher altitude, further away from these water sources, and simultaneously located on a slope, which is affected by runoff at the surface, erosion and subsurface drainage (Figure 1). Furthermore, the sampling took place in early summer, after a long dry period, so the arable soil had not received any precipitation for several weeks. The origin of the 6% CaCO3 in A1 and 14% in A2 most likely originates from the underlying parent material glacial till at the arable field, which may have been partially incorporated into the soil profile by tillage. As the arable field has a relatively high elevation and a sloping relief towards the coast (Figure 1), erosion during rain fall events can transport solid matter into the wetland [22]. Thus, the topsoil material may have been transported away from the slope by erosion and, thus, the CaCO3-containing underlying parent material may have been incorporated into the remaining topsoil by agricultural tillage. This explains the higher proportion of CaCO3 at a depth of 30–60 cm compared to 0–30 cm of the arable soil (Table 2), although regular liming may have added some CaCO3 to the tilled soil layer.
With the exception of Ca, the hypothesized effect of erosion is reflected by the concentrations of all of the elements determined. We measured higher concentrations of P, Mg, Al and Fe in W1, the upper sample of wetland soil, than in the arable soil samples A1 and A2 (Table 2). The amount of Ca is significantly higher in the arable soil compared to the wetland soil because of the entry of CaCO3 from the underlying parent material into the tilled soil, as already mentioned above.
The concentrations of Pt were significantly higher in the topsoil of the wetland (2258 mg kg−1) compared to the topsoil at the arable site (430 mg kg−1) (Table 2); this indicates an accumulation of P compounds in the wetland. While P can be consumed by crops on the agricultural soil and transported away from the location with the harvest and by erosion due to the sloping relief, there is no cultivation with harvest and less sloping at the wetland soil, and restricted organic matter oxidation. Together, these factors facilitate an accumulation of organic matter as peat and of P stored in that substrate. The arable field has been used for farming since approximately 1945 [22]. At present, the field crops oil seed rape, wheat and barley, with high fertilizer demands, are cultivated [22]. Thus, it is likely that fertilizer P, in particular, is present in the arable soil and transported towards the wetland soil, although since the year 2000, only cow manure has been applied, rather than mineral P fertilizers [22]. This manure P seems to not or only little be transported beyond the wetland soil into the directly adjacent Bodden sediments, because the P concentrations in S1 to S4 were in a very low range, between 132 and 140 mg kg −1 (Table 2). Thus, most of the nutrients, and particularly P, were transported from the arable soil towards the wetland soil and seem to be accumulated there for a longer time period. Similar relationships between the samples have been observed for the sediments S1 to S6. The amounts of P, Ca, Mg, Al and Fe were significantly higher in the sediments S5 and S6 from a greater water depth compared to most of the sediments from more shallow areas (S1 to S4) (Table 2).

4.2. Sequential Chemical P Fractionation

The concentrations of Pt in the soils and sediments were in a similar range of Pt contents in sediments from shallow lakes in the Yangtze River area in China [34] and, except for W1 and W2, they were below the Pt contents, between 740 and 1230 mg P kg−1, in bottom sediments of eutrophic lakes in central and western Poland [35]. The mean concentrations of Pt were higher in the investigated soils compared to the adjacent sediments, agreeing with a study of transitional agricultural ecotones in Southern Germany, where concentrations of Pt of the site average were also significantly higher than in the corresponding streambed sediment [36]. As the summed amounts of Pmu were clearly higher in W1 and W2 compared to A1 and A2 (Table 2), this accumulation of Pmu in the wetland soil can be attributed to an uptake of mainly Pmr by the Phragmites spp. plants, its transformation to Pmu, likely primarily bound in organic matter, and its disposal as constituent of the wetland peat [37]. Furthermore, some Pmu may have been transported from the arable site into the wetland, accumulating there. Although organic soils are known to have lower capacities for retaining excess P from fertilization and thus pose an increased risk of P loss to aquatic environments [38,39], the amounts of P were not particularly high in the directly adjacent sediments, S1 to S4 (Table 3). This could be due to high concentrations of stable fractions such as H2SO4-P and residual-P in the wetland, restricting processes of P mobilization at this site. Furthermore, a dilution of transported P within the Bodden water and/or sediments is possible or, alternatively, transferred P could have been mobilized immediately and accumulated by aquatic plant and animal organisms.
The proportions of H2O-P and resin-P, characterized as labile P in soils [26] and P immediately available for uptake by phytoplankton [40], were lower in the arable and wetland soils (0–4%) compared to the sediments (0–24%) (Table 3). This pool of loosely bound P, similarly derived from a sediment-specific P-fractionation scheme after Psenner [28], is known to be seasonally variable in sediments, as well as being affected by enhanced sedimentation and intensive degradation of OM during high summer temperatures [34,41]. Therefore, comparably large proportions in sediments are not implausible. The fraction of NH4Cl-P, also characterized as mobile, exchangeable P, but determined with the sediment P fractionation method [28], included between 1 and 20% of Pt in different sediments from eutrophic lakes in Poland [35]. Therefore, this fraction was in a similar range as the proportions of H2O-P and resin-P fractions of the present study, pointing to the quantitation of similar pools sizes, irrespective of the differences in the fractionation schemes developed for soils and sediments.
Within the soil P fractionation scheme, P extracted by NaOH is interpreted as being predominantly associated with Al and Fe oxide minerals, which eventually combine with humic substances [25,26], whereas Fe-P compounds are separately estimated in the sediment-P-methods [28]. Particularly in the fractions of NaOH-Pmr and NaOH-Pmu, higher P concentrations were measured in the wetland soil W1 and W2 than in the arable soil A1 and A2, and in the sediments S5 and S6 than in the other sediments from the Bodden (Table 3). Thus, the wetland soil and the sediments at the end of the transect at a water depth of 230 cm seem to be sinks for metal bound P and P in humic substances, which are likely combined with each other [42].
Acid extractable Pmr accounted for the greatest proportion of Pt in the sediments (up to 45%), which is in agreement with an investigation of lake sediments from [40]. This P fraction is known as stable, Ca-bound P [26], and is not readily available to phytoplankton [43]. An investigation of sediments from several eutrophic lakes in Poland also resulted in up to 45% acid extractable P (HCl-P) of Pt [35], and in surface sediments of the Mediterranean Sea, 37% P of Pt were determined in the fraction of Ca-bound P [44] with sediment fractionation methods [28]. The relative proportions of H2SO4-P were also very high in the arable soil compared to the wetland soil (Table 3). The available amounts of CaCO3 in A1 and A2 (Table 2) can facilitate the formation of Ca-bound P at the location of the eroded arable slope compared to the wetland soil.
The statement that residual-P can constitute a significant proportion of Pt from P fractionation in soils [45] is supported by the present study, as up to 22% of the Pt in the soil samples was residual-P (Table 3). However, in the sediments, no residual-P was determined in S1 to S4, and approximately 20% was determined in the last two sediments, S5 and S6. The Phosphorus in the residual fraction was characterized as stable complexes with metal ions, pedogenic oxides or organic materials, such as lignin [39,46]. The sediments from more shallow areas contained more labile P and the sediments from a water depth of 230 cm, at the end of the transect under study, contained higher amounts of stable P, which is associated with Ca instead of metal ions, pedogenic oxides or complex organic materials (Table 3). In contrast to labile P fractions, such as resin-P and NaHCO3-P, the very stable P compounds within the fraction of residual-P pose a lower risk of P loss to the aquatic environment [47]. Thus, P can accumulate and be conserved in deep sediments at the end of the investigated transect.

4.3. P XANES Spectroscopy

The majority of the results of the P XANES spectroscopy agree with the determined sequential P fractions. In particular, both of the arable soils, A1 and A2, and the sediments S1 to S4 were clearly dominated by Ca-P compounds, according to the XANES spectroscopy (Figure 2). In compliance with this, in these samples, H2SO4-Pmr accounted for the greatest proportion of Pt in the sequential fractionation and this P fraction has previously been characterized as stable, Ca-bound P [26]. The dominant occurrence of Ca-P in sediments from the Baltic Sea [21] or nearshore sediments [48] is not uncommon. The percentages of the Ca-P compounds in the agricultural soils with different fertilization treatments ranged between 0% and 21% [10]; however, due to the elevated amounts of CaCO3 in A1 and A2 (Table 2), most likely from liming, and the underlying glacial till, the formation of Ca-bound P in these soils could have been promoted, reaching proportions of up to 92% (Figure 2).
The organic P compounds were assigned in A1, W2 and S5, in significant proportions, by the XANES spectroscopy (Figure 2). The summed proportions of Pmu from the sequential fractionation were also high in A1 and W2 among the soil samples and, thereby, agreed with the results of the XANES spectroscopy (Table 3 and Figure 2). Recently, the importance of Po compounds for sustainable agriculture has been emphasized [49]. The absolute Pmu concentrations were highest in S5 and S6 among the sediments determined with sequential fractionation (Table 3), but this could only be confirmed for S5 by XANES spectroscopy because it ascertained 46% Po compounds in S5 and 0% Po in S6. An underestimation of Po compounds by XANES spectroscopy is likely because the XANES spectra of phytic acid are known to lack strong and distinguishing features [50].
The wetland soils act as sinks for P compounds, particularly Al- and Fe-P and Po compounds (Figure 2), in the first part of the transect, including the arable and wetland soils. In agreement with an earlier study about P forms along a continuum from agricultural fields to lake sediments, which reported significant P losses from field soils but only small amounts of P in the nearshore lake sediment [48], the samples S5 and S6 at the end of the investigated transect at a water depth of 230 cm can also accomplish a sink function for Po compounds (Figure 2 and Table 3) among the Bodden sediments. This also agrees with an earlier study, in which lost P from agriculture either became available to biota or was deposited in deeper portions of a lake system [48].
Thus, both the wetland soil and the sediments S5 and S6 at the end of the transect can act as sinks for P, with a lower probability of P mobilization into the above water column. Generally, the investigated transect of soils and sediments can be divided into two separated systems. The first system consists of arable soils, followed by wetland soil. Phosphorus compounds are transported from agricultural fields into the wetland by processes such as runoff and soil erosion, they accumulate, and can be conserved in the latter. The second system comprises the Bodden sediments with a similar sink function for P compounds in deeper sediments at the end of the investigated transect. The results from the sequential P fractionation and XANES spectroscopy suggest no great transfer processes of P species from the first system towards the second.

5. Conclusions

In a sample set along a transect from arable and wetland soils to aquatic sediments, the methods of sequential P fractionation and P XANES spectroscopy similarly determined a dominance of Ca associated P at the arable soils and Bodden sediments, and high proportions of Pmu/Po at the surface arable soil (A1) and subsurface wetland soil (W2). Thus, both methods complemented each other in delivering comprehensive results concerning the P characterization and sink functions of sample locations along this transect.
The investigation revealed two sinks along the transect from the arable land to adjacent aquatic lagoon sediments. As the wetland soil acts as a semiterrestrial trap for moderately stable P, Al-P and Pmu/Po compounds, it can help to prevent direct transfer of P, e.g., by leaching or runoff during erosion events from the agricultural field to the adjacent Bodden. An intact Phragmites wetland can therefore protect the aquatic ecosystem from further eutrophication. Consequently, it is reasonable to preserve existing buffer strips such as Phragmites that stand along water bodies or to potentially create new ones in areas where they are not yet abundant. Among the aquatic sediments, we detected Pmu/Po compounds and stable P fractions accumulating at the deepest sample location compared to the sediments from more shallow positions, closer to the coast. Thus, it is likely that deeper basins in the investigated Bodden system act as sinks for stable P forms, which are not directly consumed by aquatic organisms. If this concept can also be applied to aquatic ecosystems that are different from the coastal lagoons in the Baltic Sea, it has to be investigated, if measures such as the deepening of shallow aquatic areas can help to reduce pollution and eutrophication by trapping P in the sediment of deeper basins. As an important new insight, we can conclude that a gradual transformation of redox-sensitive Al/Fe-bound P into redox-insensitive and, thus, more stable Ca-P compounds with increasing moisture impact, seems to be a general process in North-east German lowlands, irrespective of the observation scale from small- [23,51] over medium-scale (the present study) to large-scale transects [21]. The P-sink formed by stable Ca P-compounds reduces the eutrophication risk for immediately adjacent waters, such as rivers, lakes and the Baltic Sea lagoon systems.

Supplementary Materials

The following supporting information can be downloaded at: https://www.mdpi.com/article/10.3390/soilsystems7010015/s1, Figure S1: Map of the location of investigated arable (A) and wetland (W) soils and sediments (S); Figure S2: P K-edge XANES spectra of soil (A, W) and sediment (S) samples Table S1: R factors of the results of linear combination fitting from P K-edge XANES analyses of soil (A, W) and sediment (S) samples.

Author Contributions

Conceptualization, J.P. and P.L.; methodology, J.P., R.S. and W.K.; software, J.P. and W.K.; validation, P.L. and W.K.; formal analysis, J.P. and R.S.; investigation, J.P. and P.L.; resources, J.P.; data curation, J.P.; writing—original draft preparation, J.P.; writing—review and editing, J.P. and P.L.; visualization, J.P.; supervision, P.L.; project administration, P.L.; funding acquisition, P.L. All authors have read and agreed to the published version of the manuscript.

Funding

This research was funded by the Leibniz Association within the scope of the Leibniz ScienceCampus “Phosphorus Research Rostock”.

Institutional Review Board Statement

Not applicable.

Informed Consent Statement

Not applicable.

Data Availability Statement

The data that support the findings of this study are available from the corresponding author upon reasonable request.

Acknowledgments

The authors thank Elena Heilmann and Britta Balz (Soil Science, University of Rostock) for analytical help concerning P fractionation and ICP measurement. Furthermore, we would like to thank Volker Reiff (Applied Ecology and Phycology, University of Rostock), who was a great support during the sediment sampling. Finally, we are grateful to Jörg Prietzel (Department of Soil Science, Technical University of Munich) for providing the P XANES reference spectra and to the technical staff at BL8 of the SLRI, Thailand for their support during XANES research.

Conflicts of Interest

The authors declare no conflict of interest.

References

  1. Andreu, V.; Gimeno-García, E.; Pascual, J.A.; Vazquez-Roig, P.; Picó, Y. Presence of pharmaceuticals and heavy metals in the waters of a Mediterranean coastal wetland: Potential interactions and the influence of the environment. Sci. Total Environ. 2016, 540, 278–286. [Google Scholar] [CrossRef]
  2. Perillo, G.M.E.; Wolanski, E.; Cahoon, D.; Brinson, M. Coastal Wetlands: An Integrated Ecosystem Approach; Elsevier: Amsterdam, The Netherlands, 2009. [Google Scholar]
  3. Reddy, K.R.; Kadlec, R.H.; Flaig, E.; Gale, P.M. Phosphorus retention in streams and wetlands: A review. Crit. Rev. Environ. Sci. Technol. 1999, 29, 83–146. [Google Scholar] [CrossRef]
  4. Correll, D.L. Role of phosphorus in the eutrophication of receiving waters: A review. J. Environ. Qual. 1998, 27, 261–267. [Google Scholar] [CrossRef]
  5. Bonsdorff, E.; Blomqvist, E.M.; Mattila, J.; Norkko, A. Coastal eutrophication: Causes, consequences and perspectives in the archipelago areas of the Northern Baltic Sea. Estuar. Coast. Shelf Sci. 1997, 44, 63–72. [Google Scholar] [CrossRef]
  6. Hansen, N.C.; Daniel, T.C.; Sharpley, A.N.; Lemunyon, J.L. The fate and transport of phosphorus in agricultural systems. J. Soil Water Conserv. 2002, 57, 408–417. [Google Scholar]
  7. Sims, J.T.; Pierzynski, G.M. Chemistry of phosphorus in soils. In Chemical Processes in Soils; Tabatabai, M.A., Sparks, D.L., Eds.; SSSA Book Series; Soil Science Society of America, Inc.: Madison, WI, USA, 2005. [Google Scholar]
  8. Karstens, S.; Buczko, U.; Glatzel, S. Phosphorus storage and mobilization in coastal Phragmites wetlands: Influence of local-scale hydrodynamics. Estuar. Coastatl Shelf Sci. 2015, 164, 124–133. [Google Scholar] [CrossRef]
  9. Weyers, E.; Strawn, D.G.; Peak, D.; Moore, A.D.; Baker, L.L.; Cade-Menun, B. Phosphorus speciation in calcareous soils following annual dairy manure amendments. Soil Sci. Am. J. 2016, 80, 1531–1542. [Google Scholar] [CrossRef]
  10. Koch, M.; Kruse, J.; Eichler-Löbermann, B.; Zimmer, D.; Wilbold, S.; Leinweber, P.; Siebers, N. Phosphorus stocks and speciation in soil profiles of a long-term fertilizer experiment: Evidence from sequential fractionation, P K-edge XANES, and 31P NMR spectroscopy. Geoderma 2018, 316, 115–126. [Google Scholar] [CrossRef]
  11. Schmieder, F.; Gustafsson, J.P.; Klysubun, W.; Zehetner, F.; Riddle, M.; Kirchmann, H.; Bergström, L. Phosphorus speciation in cultivated organic soils revealed by P K-edge XANES spectroscopy. J. Plant Nutr. Soil Sci. 2020, 183, 367–381. [Google Scholar] [CrossRef]
  12. Turner, B.L. Soil organic phosphorus in tropical forests: An assessment of the NaOH-EDTA extraction procedure for quantitative analysis by solution 31P NMR spectroscopy. Eur. J. Soil Sci. 2008, 59, 453–466. [Google Scholar] [CrossRef]
  13. Frankowski, L.; Bolałek, J.; Szostek, A. Phosphorus in bottom sediments of Pomeranian Bay (Southern Baltic—Poland). Estuar. Coast. Shelf Sci. 2002, 54, 1027–1038. [Google Scholar] [CrossRef]
  14. Kraal, P.; Slomp, C.P. Rapid and extensive alteration of phosphorus speciation during oxic storage of wet sediment samples. PLoS ONE 2014, 9, e96859. [Google Scholar] [CrossRef]
  15. Łukawska-Matuszewska, K.; Bolałek, J. Spatial distribution of phosphorus forms in seduments in the Gulf of Gdańsk (southern Baltic Sea). Cont. Shelf Res. 2008, 28, 977–990. [Google Scholar] [CrossRef]
  16. Gunnars, A.; Blomqvist, S. Phosphate exchange across the sediment-water interface when shifting from anoxic to oxic conditions—An experimental comparison of freshwater and brackish-marine systems. Biogeochemistry 1997, 37, 203–226. [Google Scholar] [CrossRef]
  17. Xie, L.Q.; Xie, P.; Tang, H.J. Enhancement of dissolved phosphorus release from sediment to lake water by Microcystis blooms—An enclosure experiment in a hyper-eutrophic, subtropical Chinese lake. Environ. Pollut. 2003, 122, 391–399. [Google Scholar] [CrossRef]
  18. Zwolsman, J.J.G. Seasonal variability and biogeochemistry of Phosphorus in the Scheldt Estuary, South-west Netherlands. Estuar. Coast. Shelf Sci. 1994, 39, 227–248. [Google Scholar] [CrossRef]
  19. Iglesias, M.L.; Devesa-Rey, R.; Pérez-Moreira, R.; Díaz-Fierros, F.; Barrai, M.T. Phosphorus transfer across boundaries: From basin soils to river bed sediments. J. Soils Sediments 2011, 11, 1125–1134. [Google Scholar] [CrossRef]
  20. Audette, Y.; O’Halloran, I.P.; Nowell, P.M.; Dyer, R.; Kelly, R.; Voroney, R.P. Speciation of phosphorus from agricultural muck soils to stream and lake sediments. J. Environ. Qual. 2018, 47, 884–892. [Google Scholar] [CrossRef]
  21. Prüter, J.; Leipe, T.; Michalik, D.; Klysubun, W.; Leinweber, P. Phosphorus speciation in sediments from the Baltic Sea, evaluated by a multi-method approach. J. Soils Sediments 2020, 20, 1676–1691. [Google Scholar] [CrossRef]
  22. Karstens, S.; Buczko, U.; Jurasinski, G.; Peticzka, R.; Glatzel, S. Impact of adjacent land use on coastal wetland sediments. Sci. Total Environ. 2016, 550, 337–348. [Google Scholar] [CrossRef]
  23. Prüter, J.; Hu, Y.; Leinweber, P. Influence of sample pretreatment on P speciation in sediments evaluated with sequential fractionation and P K-edge XANES spectroscopy. Commun. Soil Sci. Plant Anal. 2022, 53, 1712–1730. [Google Scholar] [CrossRef]
  24. Bitschofsky, F.; Forster, S.; Powillait, M.; Gebhardt, C. Role of macrofrauna for the exchange processes between sediment and water column in an inner coastal water of southern Baltic Sea (Darss-Zingst Bodden Chain, Grabow). Rostock. Meeresbiol. Beiträge 2015, 25, 27–39. [Google Scholar]
  25. Hedley, M.J.; Stewart, J.W.B.; Chauhan, B.S. Changes in Inorganic and Organic Soil Phosphorus Fractions Induced by Cultivation Practices and by Laboratory Incubations. Soil Sci. Soc. Am. J. 1982, 46, 970. [Google Scholar] [CrossRef]
  26. Tiessen, H.; Moir, J.O. Characterization of available P by sequential extraction. In Soil Sampling and Methods of Analysis; Carter, M.R., Ed.; Lewis Publishers: Boca Raton, FL, USA, 1993; pp. 75–86. [Google Scholar]
  27. Murphy, J.; Riley, J.P. A modified single solution method for the determination of phosphate in natural waters. Anal. Chim. Acta 1962, 27, 31–36. [Google Scholar] [CrossRef]
  28. Psenner, R. Fractionation of phosphorus in suspended matter and sediment. Ergeb. Limnol. 1988, 30, 98–113. [Google Scholar]
  29. Klysubun, W.; Sombunchoo, P.; Deenan, W.; Kongmark, C. Performance and status of beamline BL8 at SLRI for X-ray absorption spectroscopy. J. Synchrotron Radiat. 2012, 19, 930–936. [Google Scholar] [CrossRef] [PubMed]
  30. Ravel, B.; Newville, M. ATHENA, ARTEMIS, HEPHAESTUS: Data analysis for X-ray absorption spectroscopy using IFEFFIT. J. Synchrotron Radiat. 2005, 12, 537–541. [Google Scholar] [CrossRef]
  31. Prietzel, J.; Harrington, G.; Häusler, W.; Heister, K.; Werner, F.; Klysubun, W. Reference spectra of important adsorbed organic and inorganic phosphate binding forms for soil P speciation using synchrotron-based K-edge XANES spectroscopy. J. Synchrotron Radiat. 2016, 23, 532–544. [Google Scholar] [CrossRef] [PubMed]
  32. Werner, F.; Prietzel, J. Standard protocol and quality assessment of soil phosphorus speciation by P K-edge XANES spectroscopy. Environ. Sci. Technol. 2015, 49, 10521–10528. [Google Scholar] [CrossRef]
  33. Calivn, S. XAFS for Everyone; CRC Press: Boca Raton, FL, USA, 2013; p. 427. [Google Scholar]
  34. Wang, S.; Jin, X.; Zhao, H.; Wu, F. Phosphorus fractions and ist release in the sediments from the shallow lakes in the middle and lower reaches of Yangtze River area in China. Colloids Surf. A Physicochem. Eng. Asp. 2006, 273, 109–116. [Google Scholar] [CrossRef]
  35. Bryl, Ł.; Sobczyński, T. Phosphorus and its fractionation in bottom sediments of selected lakes of Wielkopolskie Lakeland in Central and Western Poland. Middle Pomeranian Sci. Soc. Environ. Prot. 2019, 21, 1515–1532. [Google Scholar]
  36. Neidhardt, H.; Achten, F.; Kern, S.; Schwientek, M.; Oelmann, Y. Phosphorus pool composition in soils and sediments of transitional ecotones under the influence of agriculture. J. Environ. Qual. 2019, 48, 1325–1335. [Google Scholar] [CrossRef]
  37. Negassa, W.; Michalik, D.; Klysubun, W.; Leinweber, P. Phosphorus speciation in long-term drained and rewetted peatlands of Northern Germany. Soil Syst. 2020, 4, 11. [Google Scholar] [CrossRef]
  38. Daly, K.; Jeffrey, D.; Tunney, H. The effect of soil type on phosphorus sorption capacity and desorption dynamics in Irish grassland soils. Soil Use Manag. 2001, 17, 12–20. [Google Scholar] [CrossRef]
  39. González Jiménez, J.L.; Healy, M.G.; Daly, K. Effects of fertiliser on phosphorus pools in soils with contrasting organic matter content: A fractionation and path analysis study. Geoderma 2019, 338, 128–135. [Google Scholar] [CrossRef]
  40. Zhu, Y.; Wu, F.; He, Z.; Guo, J.; Qu, X.; Xie, F.; Giesy, J.P.; Liao, H.; Guo, F. Characterization of organic phosphorus in lake sediments by sequential fractionation and enzymatic hydrolysis. Environ. Sci. Technol. 2013, 47, 7679–7687. [Google Scholar] [CrossRef]
  41. Kisand, A. Distribution of sediment phosphorus fractions in hypertrophic strongly straified Lake Verevi. Hydrobiology 2005, 547, 33–39. [Google Scholar] [CrossRef]
  42. Gerke, J. The acquisition of phosphate by higher plants: Effect of carboxylate release by the roots. A critical review. J. Plant Nutr. Soil Sci. 2015, 178, 351–364. [Google Scholar] [CrossRef]
  43. Zhu, Y.; Zhang, R.; Wu, F.; Qu, X.; Xie, F.; Fu, Z. Phosphorus fractions and bioavailability in relation to particle size characteristics in sediments from Lake Hongfeng, Southwest China. Environ. Earth Sci. 2013, 68, 1041–1052. [Google Scholar] [CrossRef]
  44. Akçay, İ.; Yücel, M. Distinct patterns of sedimentary phosphorus fractionation and mobilization in the seafloor of the Black Sea, Marmar Sea and Mediterranean Sea. Sci. Total Environ. 2023, 863, 160936. [Google Scholar] [CrossRef] [PubMed]
  45. Condron, L.M.; Newman, S. Revisiting the fundamentals of phosphorus fractionation of sediments and soils. J. Soils Sediments 2011, 11, 830–840. [Google Scholar] [CrossRef]
  46. Schlichting, A.; Leinweber, P.; Meer, R.; Alterman, M. Sequentially extracted phosphorus fractions in peat-derived soils. J. Plant Nutr. Soil Sci. 2002, 165, 290–298. [Google Scholar] [CrossRef]
  47. Negassa, W.; Leinweber, P. How does the Hedley sequential phsophorus fractionation reflect impacts of land use and management on soil phosphorus: A review. J. Plant Nutr. Soil Sci. 2009, 172, 305–325. [Google Scholar] [CrossRef]
  48. Noll, M.R.; Szatkowski, A.E.; Magee, E.A. Phosphorus fractionation in soil and sediments along a continuum from agricultural fields to nearshore lake sediments: Potential ecologial impacts. J. Great Lakes Res. 2009, 35, 56–63. [Google Scholar] [CrossRef]
  49. Sulieman, S.; Mühling, K.H. Utilization of soil organic phosphorus as a strategic approach for sustainable agriculture. J. Plant Nutr. Soil Sci. 2021, 184, 311–319. [Google Scholar] [CrossRef]
  50. Ajiboye, B.; Akinremi, O.O.; Hu, Y.; Jürgensen, A. XANES speciation of phosphorus in organically amended and fertilized vertisol and mollisol. Soil Sci. Soc. Am. J. 2008, 72, 1256. [Google Scholar] [CrossRef]
  51. Prüter, J.; McLaren, T.I.; Pätzig, M.; Hu, Y.; Leinweber, P. Phosphorus speciation along a soil to kettle hole transect: Sequential P fractionation, P XANES, and 31P NMR spectroscopy. Geoderma 2023, 429, 116215. [Google Scholar] [CrossRef]
Figure 1. Schematic illustration of the soil and sediment sampling spots at the study site in Dabitz.
Soilsystems 07 00015 g001
Figure 2. Proportions of P compounds as obtained by linear combination fitting (LCF) on P K-edge XANES spectra of upper and lower arable soil (A), wetland soil (W) and sediment samples (S).
Soilsystems 07 00015 g002
Table 1. Label, sample type, origin, sampling depth and coordinates of the collected soil and sediment samples.
LabelSample TypeOriginSampling Depth in cmCoordinates
A1Soilarable field0–30N 54°22′08.00″
A2Soilarable field30–60E 12°48′08.00″
W1SoilWetland0–10N 54°22′08.30″
W2SoilWetland30–50E 12°48′12.60″
S1Sedimentwater depth 52 cm0–5N 54°22′09.00″
S2Sedimentwater depth 52 cm5–10E 12°48′17.60″
S3Sedimentwater depth 63 cm0–5N 54°22′09.20″
S4Sedimentwater depth 63 cm5–10E 12°48′20.00″
S5Sedimentwater depth 230 cm0–5N 54°22′09.31″
S6Sedimentwater depth 230 cm5–10E 12°48′33.50″
Table 2. Average proportions of water in % and elemental concentrations of carbon (C), nitrogen (N) and sulphur (S), n = 2; and of phosphorus (P), calcium (Ca), magnesium (Mg), aluminum (Al), and iron (Fe) in mg kg−1 and their ratios (C/P, P/Ca, P/Mg, P/Al, P/Fe) determined by ICP-OES; n = 3 in the upper and lower soil and sediment samples. Significant differences at 5% probability level between samples are designated by different letters (a, b, c, d, e, f).
SampleWater ContentCaCO3CNSPCaP/CaMgP/MgAlP/AlFeP/Fe
%%mg kg−1mg kg−1 mg kg−1 mg kg−1 mg kg−1
A105614,583842375430 e27,835 b0.022974 c0.1410,982 bx0.0413,738 e0.03
A2091424,400272327390 e72,935 a0.014134 b0.0910,768 bc0.0413,603 e0.03
W1620136,91712,58036482258 a6944 c0.334869 a0.4618,380 ax0.1234,382 a0.07
W246048,68345781963728 b3589 d0.203002 c0.2411,344 bx0.0615,056 d0.05
S12002600345525140 f909 e0.15325 d0.43737 dx0.19861 f0.16
S22002900375560137 f1173 e0.12404 d0.34913 dx0.151104 f0.12
S32102550340475132 f639 e0.21289 d0.46681 dx0.19847 f0.16
S42002450315450135 f445 e0.30285 d0.47750 dx0.181018 f0.13
S565067,050747515,650602 c4839 d0.124830 a0.129940 cx0.0617,637 c0.03
S675059,550619014,740551 d3652 d0.154751 a0.1210,489 bc0.0518,452 b0.03
Table 3. Concentrations (mg kg−1) and percentages (%) of the sequentially extracted molybdate-reactive (Pmr) and molybdate-unreactive (Pmu) P fractions H2O-P, resin-P, NaHCO3-P, NaOH-P, H2SO4-P, and residual-P, of total P (Pt) and the sums of Pmr and Pmu determined in the soil and sediment samples. Significant differences at 5% probability level between samples are designated by different letters (a, b, c, d, e, f), n = 3.
SampleH2O-PmrH2O-PmuResin-PmrResin-PmuNaHCO3-PmrNaHCO3-PmuNaOH-PmrNaOH-PmuH2SO4-PmrH2SO4-PmuResidual-PPtSum PmrSum Pmu
mg kg−1(%)mg kg−1(%)mg kg−1(%)mg kg−1(%)mg kg−1(%)mg kg−1(%)mg kg−1(%)mg kg−1(%)mg kg−1(%)mg kg−1(%)mg kg−1(%)mg kg−1mg kg−1(%)mg kg−1(%)
A113 c(3)2 cx(0)18 dex(4)1 a(0)15 b(3)13 de(3)12 c(3)14 bx(3)222 bx(52)37 ab(9)83 bcd(19)430 e280(65)67(16)
A29 c(2)0 cx(0)11 exx(3)0 a(0)47 b(12)2 ex(1)9 c(2)0 bx(0)261 bx(67)29 ab(7)22 cdx(6)390 e337(86)31(8)
W126 a(1)23 ax(1)143 axx(6)6 a(0)275 a(12)162 ax(7)443 a(20)156 ax(7)401 ax(18)116 ax(5)505 axx(22)2258 a1288(57)464(21)
W226 a(4)8 bc(1)40 bcd(5)0 a(0)50 b(7)51 bx(7)75 b(10)92 ab(13)183 bc(25)55 ab(8)149 bxx(20)728 b374(51)206(28)
S114 c(10)7 bc(5)26 cde(18)6 a(4)20 b(14)1 ex(1)9 c(6)0 bx(0)49 cd(35)14 bx(10)0 dxx(0)140 f118(81)28(19)
S213 c(9)10 bc(7)33 cde(24)4 a(3)15 b(11)1 ex(1)9 c(6)0 bx(0)53 cd(39)15 bx(11)0 dxx(0)137 f122(81)29(19)
S327 a(21)16 ab(12)18 dex(14)0 a(0)7 b(5)1 ex(1)9 c(7)0 bx(0)44 dx(34)10 bx(8)0 dxx(0)132 f105(79)28(21)
S419 b(14)10 bc(7)17 dex(13)0 a(0)15 b(11)1 ex(1)11 c(8)0 bx(0)60 cd(45)11 bx(8)0 dxx(0)135 f123(85)22(15)
S520 b(3)15 ab(2)57 bxx(9)4 a(1)8 b(1)42 bc(7)18 c(3)57 ab(9)265 bx(44)0 bx(0)115 bcx(19)602 c368(61)119(20)
S620 b(4)17 ab(3)47 bcx(9)3 a(1)3 b(1)27 cd(5)12 c(2)35 bx(6)199 bx(36)77 ab(14)111 bcd(20)551 d282(51)158(29)
Disclaimer/Publisher’s Note: The statements, opinions and data contained in all publications are solely those of the individual author(s) and contributor(s) and not of MDPI and/or the editor(s). MDPI and/or the editor(s) disclaim responsibility for any injury to people or property resulting from any ideas, methods, instructions or products referred to in the content.

