Article

Impacts of Landfill Leachate on the Surrounding Environment: A Case Study on Amin Bazar Landfill, Dhaka (Bangladesh)

by
Rysul Hasan Hredoy
1,
Md. Abu Bakar Siddique
2,
Md. Ahedul Akbor
2,*,
Md. Aftab Ali Shaikh
2,3 and
Md. Mostafizur Rahman
1,4,*
1
Department of Environmental Science, Bangladesh University of Professionals, Mirpur Cantonment, Dhaka 1216, Bangladesh
2
Institute of National Analytical Research and Service (INARS), Bangladesh Council of Scientific and Industrial Research (BCSIR), Dhanmondi, Dhaka 1205, Bangladesh
3
Department of Chemistry, University of Dhaka, Dhaka 1000, Bangladesh
4
Laboratory of Environmental Health and Ecotoxicology, Department of Environmental Sciences, Jahangirnagar University, Dhaka 1342, Bangladesh
*
Authors to whom correspondence should be addressed.
Soil Syst. 2022, 6(4), 90; https://doi.org/10.3390/soilsystems6040090
Submission received: 15 October 2022 / Revised: 20 November 2022 / Accepted: 23 November 2022 / Published: 29 November 2022

Abstract

:
Currently, a total of about 15,000 tons/day of waste is generated in the entire Dhaka city with an average per capita waste generation of 0.641 kg/day. Only 37% of this waste is collected and dumped into the two sanitary landfill sites, which is the only waste management system in Dhaka. To investigate the impact of landfill leachate of Amin Bazar landfill on the environmental compartments, a total of 14 composite samples (two leachates, three surface water, three groundwater, three soil, and three plants) were collected and analyzed for physicochemical parameters and heavy metal(loid)s concentration. Based on the result of physicochemical parameters, all results were found higher in the leachate samples than the permissible limit. The heavy metal(loid)s in leachate samples have a value of high levels of contamination. Surface water, groundwater, soil, and vegetation are all polluted as a result of high levels of metal contamination. Although the Water Quality Index values of the samples based on heavy metal(loid)s concentrations were within the acceptable range, heavy metal concentrations in the soil and plants were quite high. The concentrations of lead (Pb—8 mg/kg), cadmium (Cd—0.4 mg/kg), chromium (Cr—2.26 mg/kg), and cobalt (Co—1.72 mg/kg) in all plant samples were found to be higher than the allowable limit. The individual concentration of arsenic (As—0.021 mg/L) in the leachate was higher than the maximum allowed limit. Inverse Distance Weighted analysis through ArcGIS showed that landfill leachate has the maximum probability of contaminating the surrounding environment with heavy metal(loid)s. Results showed that samples collected near the landfill have higher concentrations of heavy metal(loid)s than others, which establishes the contribution of landfill leachate in contaminating the environment with heavy metal(loid)s. The improper leachate management of landfill has a high impact on the environment.

Graphical Abstract

1. Introduction

Landfill leachate is the liquid residuals of a landfill resulting from a combination of the physical, chemical, and biological processes that transfer pollutants from the waste materials [1]. Landfill leachate pollution creates alarming stress for developing countries due to rapid and improper urbanization and industrialization.
The capital of Bangladesh, Dhaka, is one of the most populous cities in the world with a total of about 15,000 tons per day of waste generation, and it is increasing rapidly [2,3]. The average per capita waste generation of Dhaka North City Corporation (DNCC) is 0.641 Kg/day [4]. Only 37% of this total waste is collected and dumped into the Amin Bazar and Matuail sanitary landfill sites, which is the only solid waste management system currently running in Dhaka [5]. The waste management system of Dhaka city had been working on its improvement with the technical aid of the Japan International Cooperation Agency since 2000 [6]. Leachate collection and gas venting systems, improved surface drainage, daily covering of waste disposal facilities, slope reformation, working roadways, weighbridge operation, and car washing facilities are all included in the Matuail and Amin Bazar sanitary landfill project [7]. Waste dumped in this process undergoes slow anaerobic decomposition for 30 to 50 years, which produces a considerable amount of leachate along with heavy metals and the hazardous chemical compounds, which can seep from the landfill and contaminate the nearby water body along with the groundwater through percolation, soil, and plants through bioaccumulation [8].
Landfill leachate is an unavoidable substance, and the management of leachate is one of the major difficulties [9]. Leachate has a negative impact on groundwater, surface water, soil, and plants [10,11]. Landfill leachate alters the physicochemical parameters and heavy metal concentration in surface water, groundwater, soil, and plants [8,12]. Therefore, faulty management of landfill leachate could have an adverse effect on the environment as well as human health. Water samples with lower depth (30 ft) and distance (1 km) from the landfill had greater concentrations of chemical oxygen demand (COD), chloride (Cl-), sodium (Na), and potassium (K) which were (128 mg/L), (115 mg/L), (98 mg/L), and (42.2 mg/L), respectively, in the Chandigarh, Mohali, and Panchkula landfill sites in India [10]. Leachate from the Matuail landfill site has a high concentration of total dissolved solids (734 mg/L), COD (1631 mg/L), ammonium (1253 mg/L), hydrogen carbonate (27,962 mg/L), and some heavy metals such as Ni (1.05 mg/L) and Cr (0.74 mg/L), and it has a significant potential for polluting groundwater and surface water [8]. Haque et al. [5] conducted a study on the Aminbazar landfill area on seasonal effects on heavy metal concentration in leachate and converted soil, which is our study area. Kamal et al. [2] conducted a study in the same area on the bioaccumulation of trace metals in plants. Both of these studies found high concentrations of heavy metals in soil and plants which are considered to be polluted.
Altering the natural quality of soil, surface water, and groundwater has a major impact on the environment as well as on human health [9,13,14]. Therefore, leachate pollution is an alarming concern for the environment and has become one of the major concerns for the current age. Leachate is an unavoidable substance of a landfill, but its impact on the environment can be avoided. The assessment of possible risks from the landfill leachate is crucial for sustainable environmental management [15]. The study on all four components of the environment (surface water, groundwater, soil, and plants) is essential to understand the impact of landfill leachate on the environment. Thus, this study aims to investigate the environmental impact occurring from the landfill leachate by analyzing some physical and chemical parameters such as electrical conductivity (EC), total dissolved solids (TDS), dissolved oxygen (DO), pH, turbidity, salinity, temperature, total hardness, lead (Pb), nickel (Ni), chromium (Cr), cadmium (Cd), cobalt (Co), and arsenic (As) in leachate, surface water (SW), groundwater (GW), surrounding soil, and plants. To determine the contribution of landfill leachate in heavy metal(loid)s concentration in soil, water, and plants, Inverse Distance Weighted (IDW) analysis in GIS was performed.

2. Materials and Methods
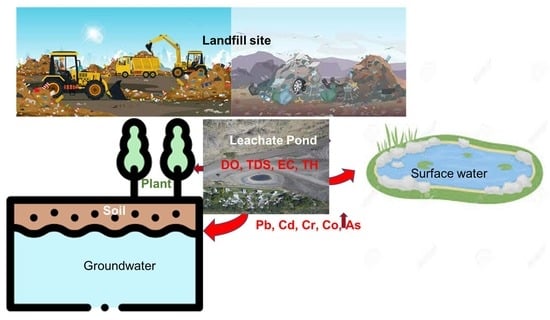
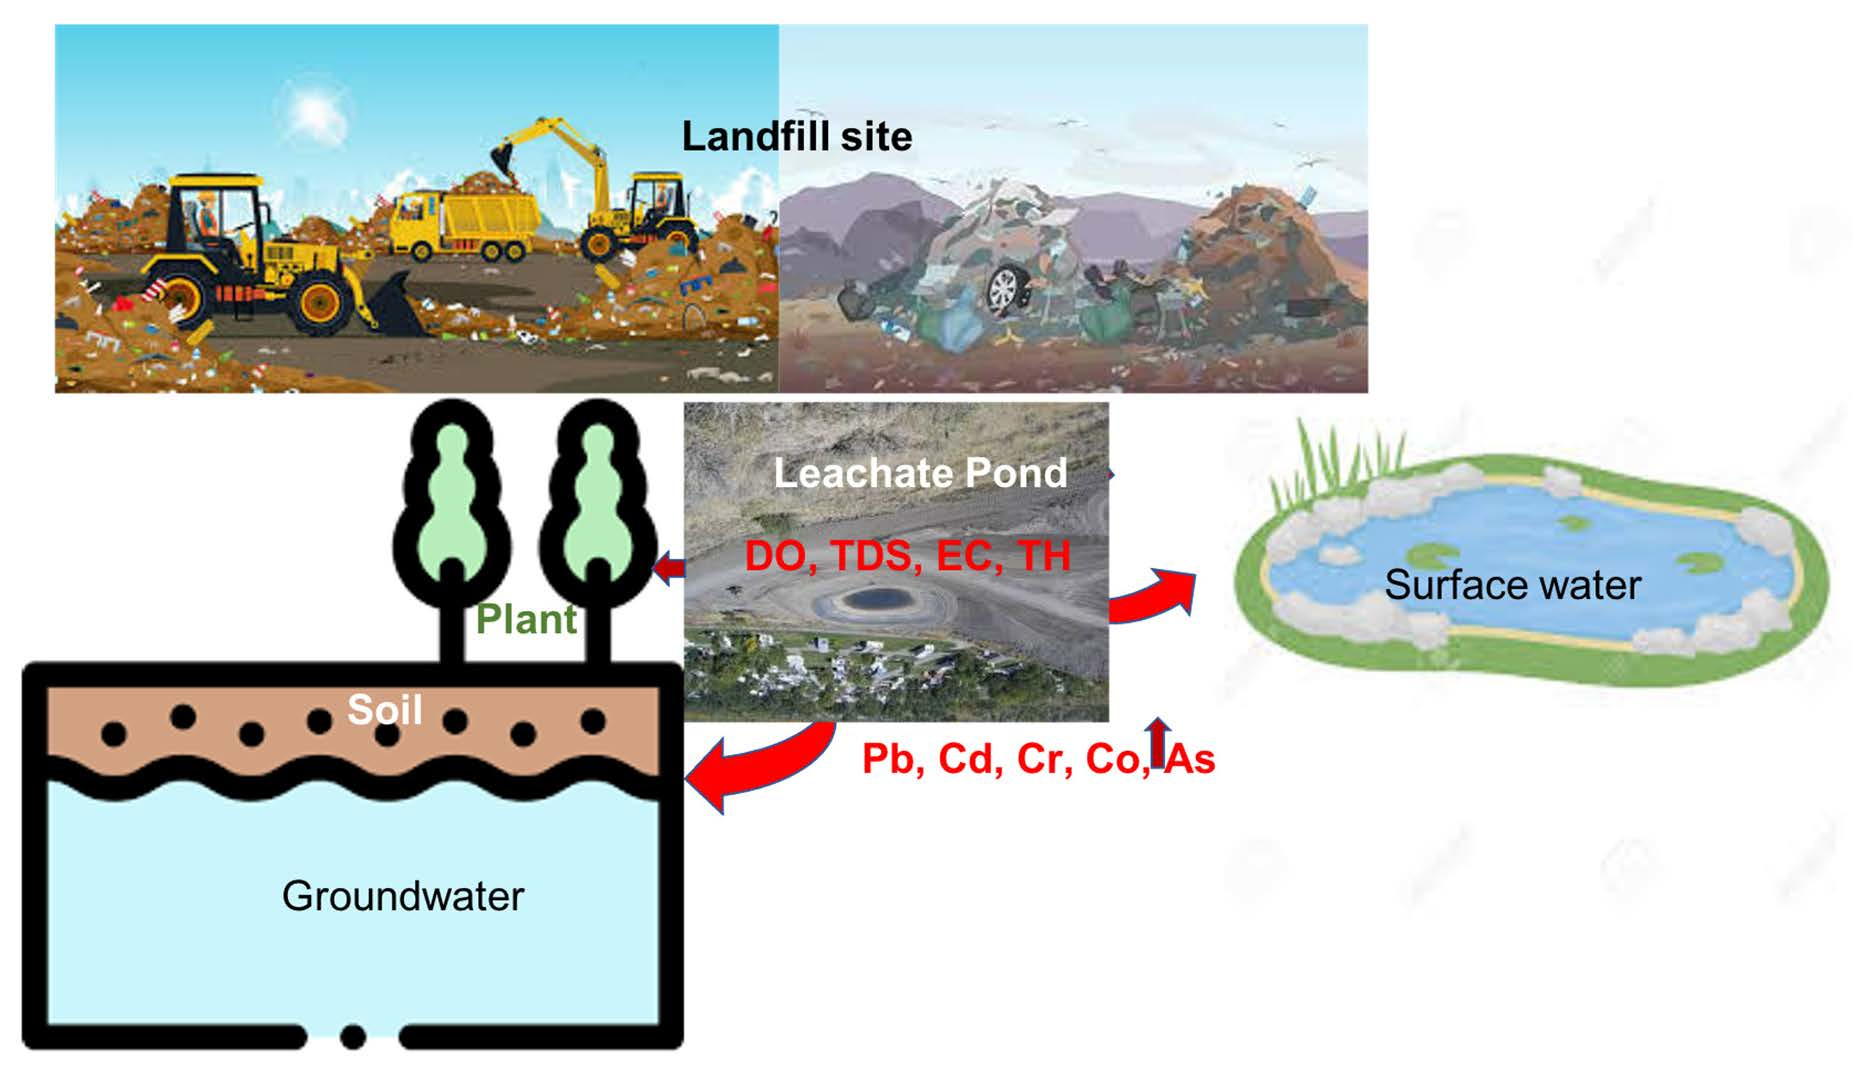
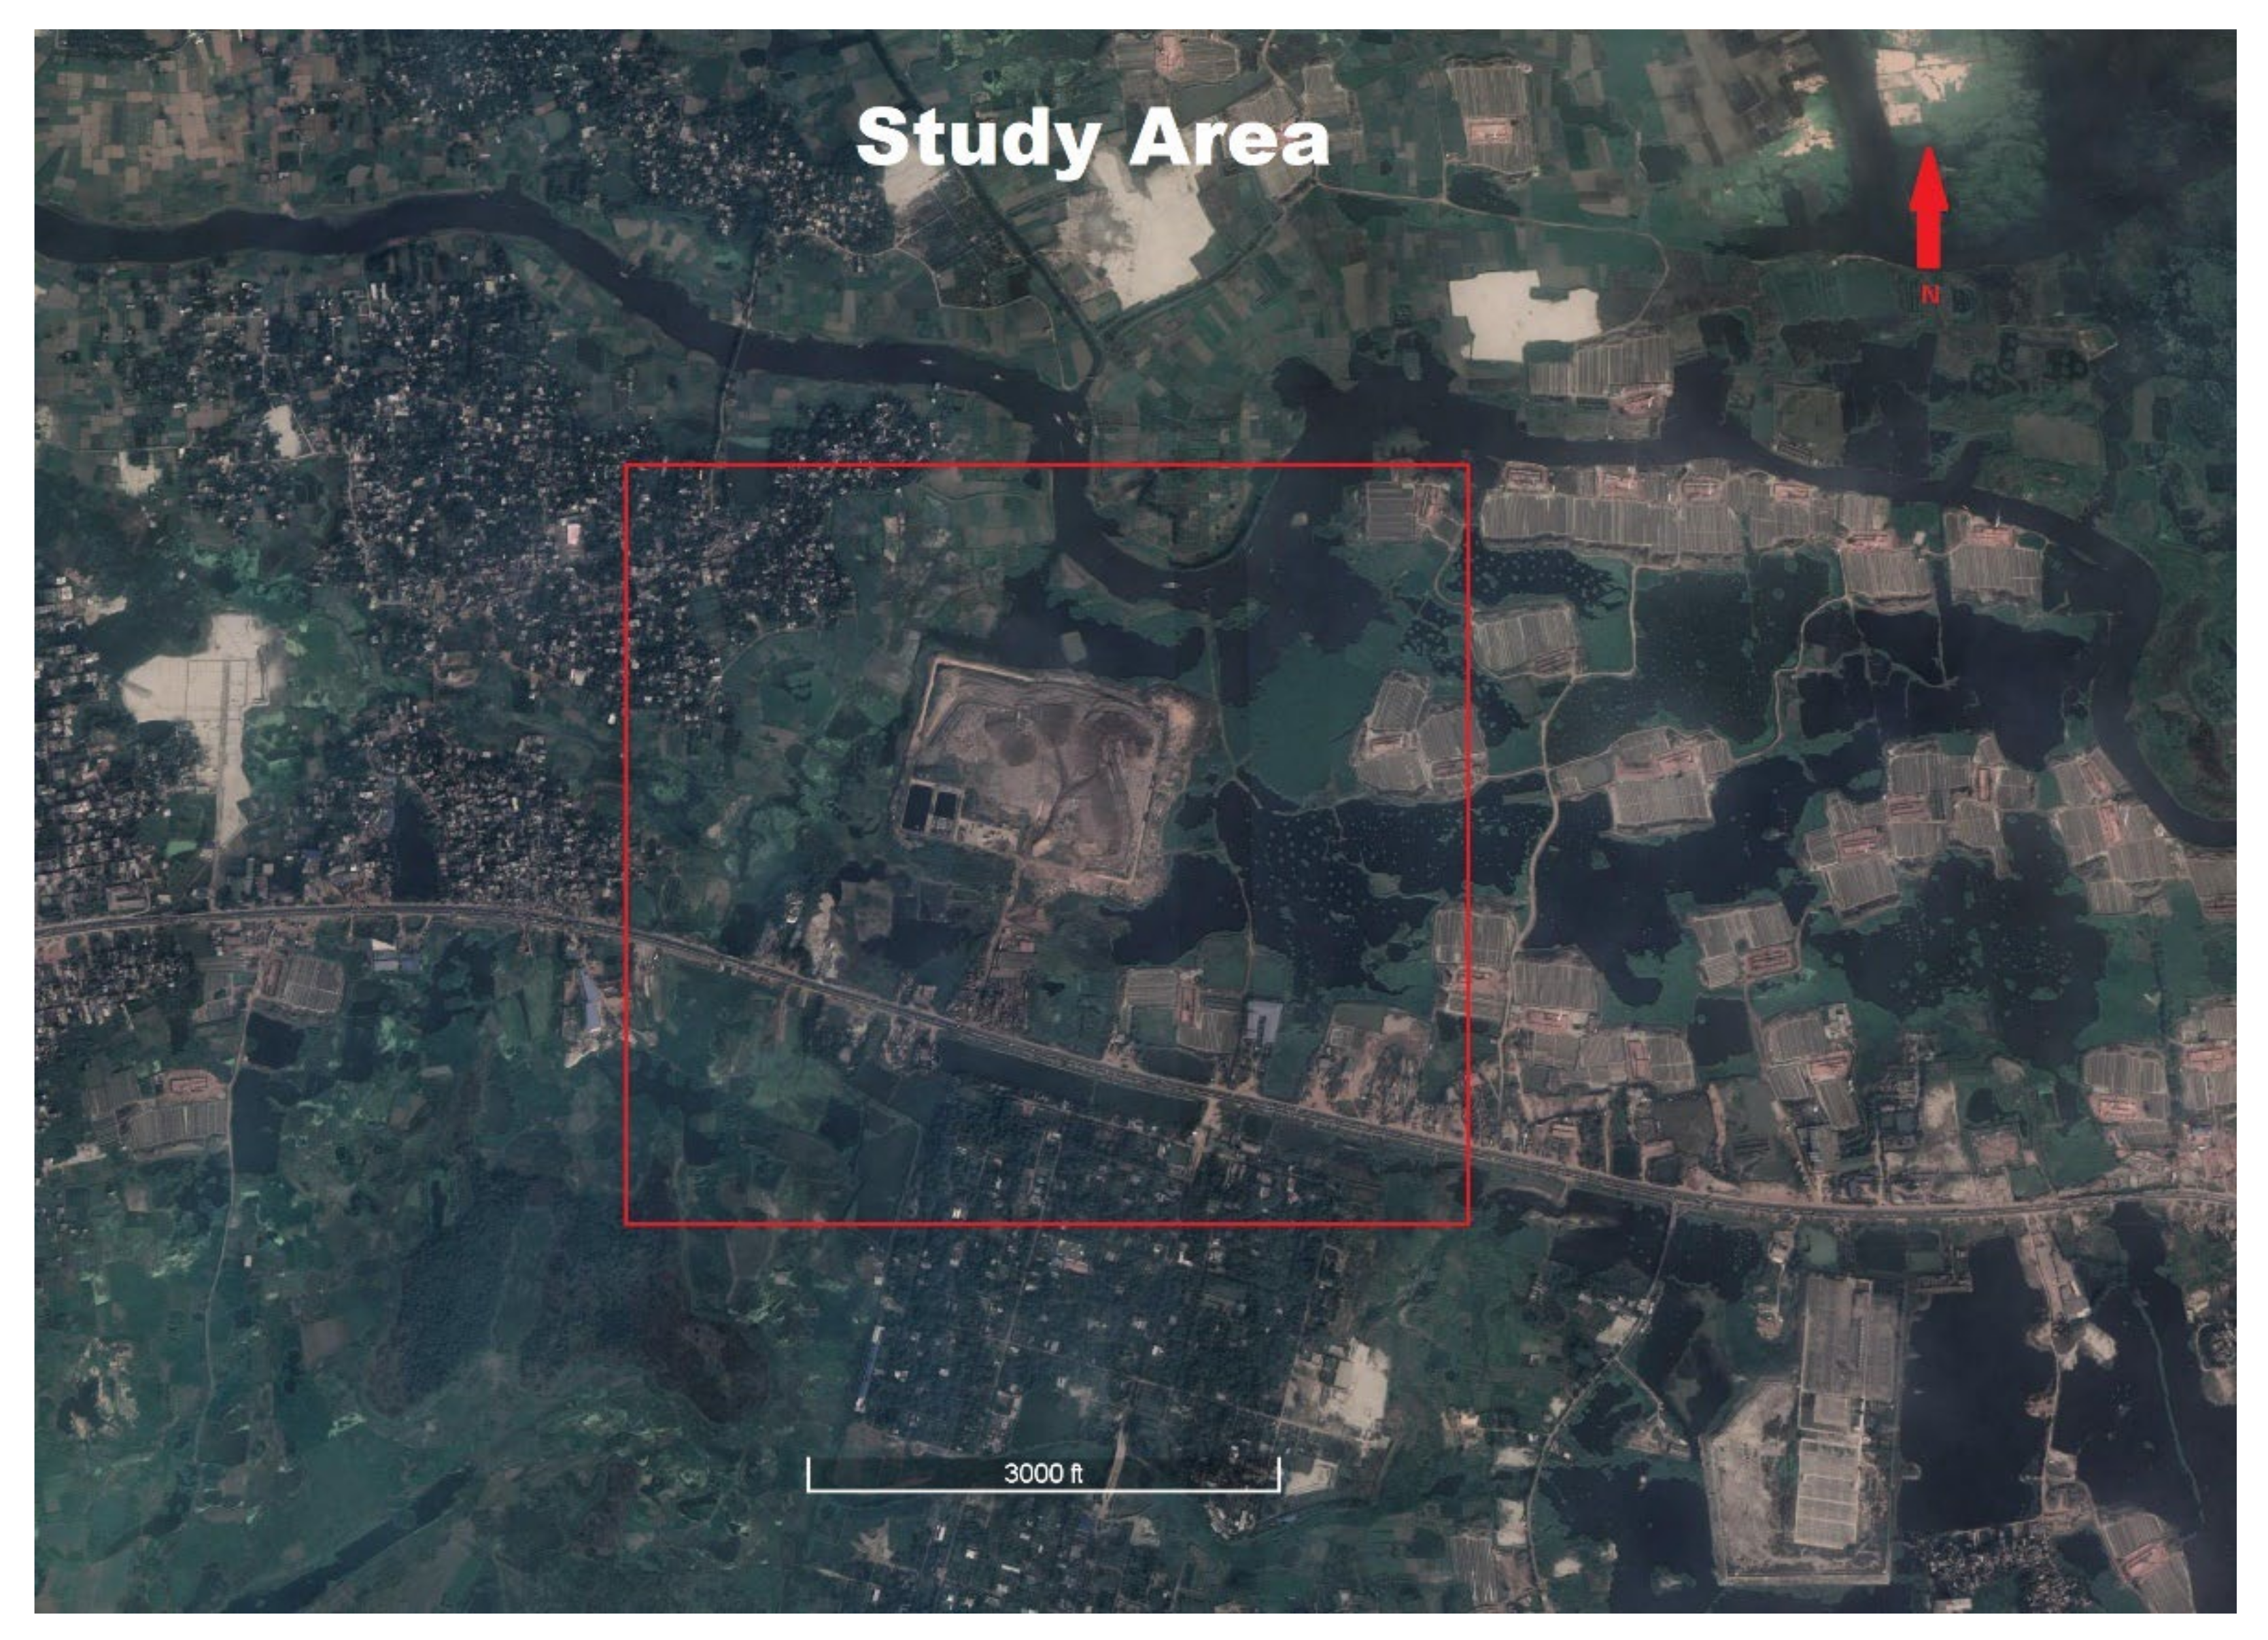
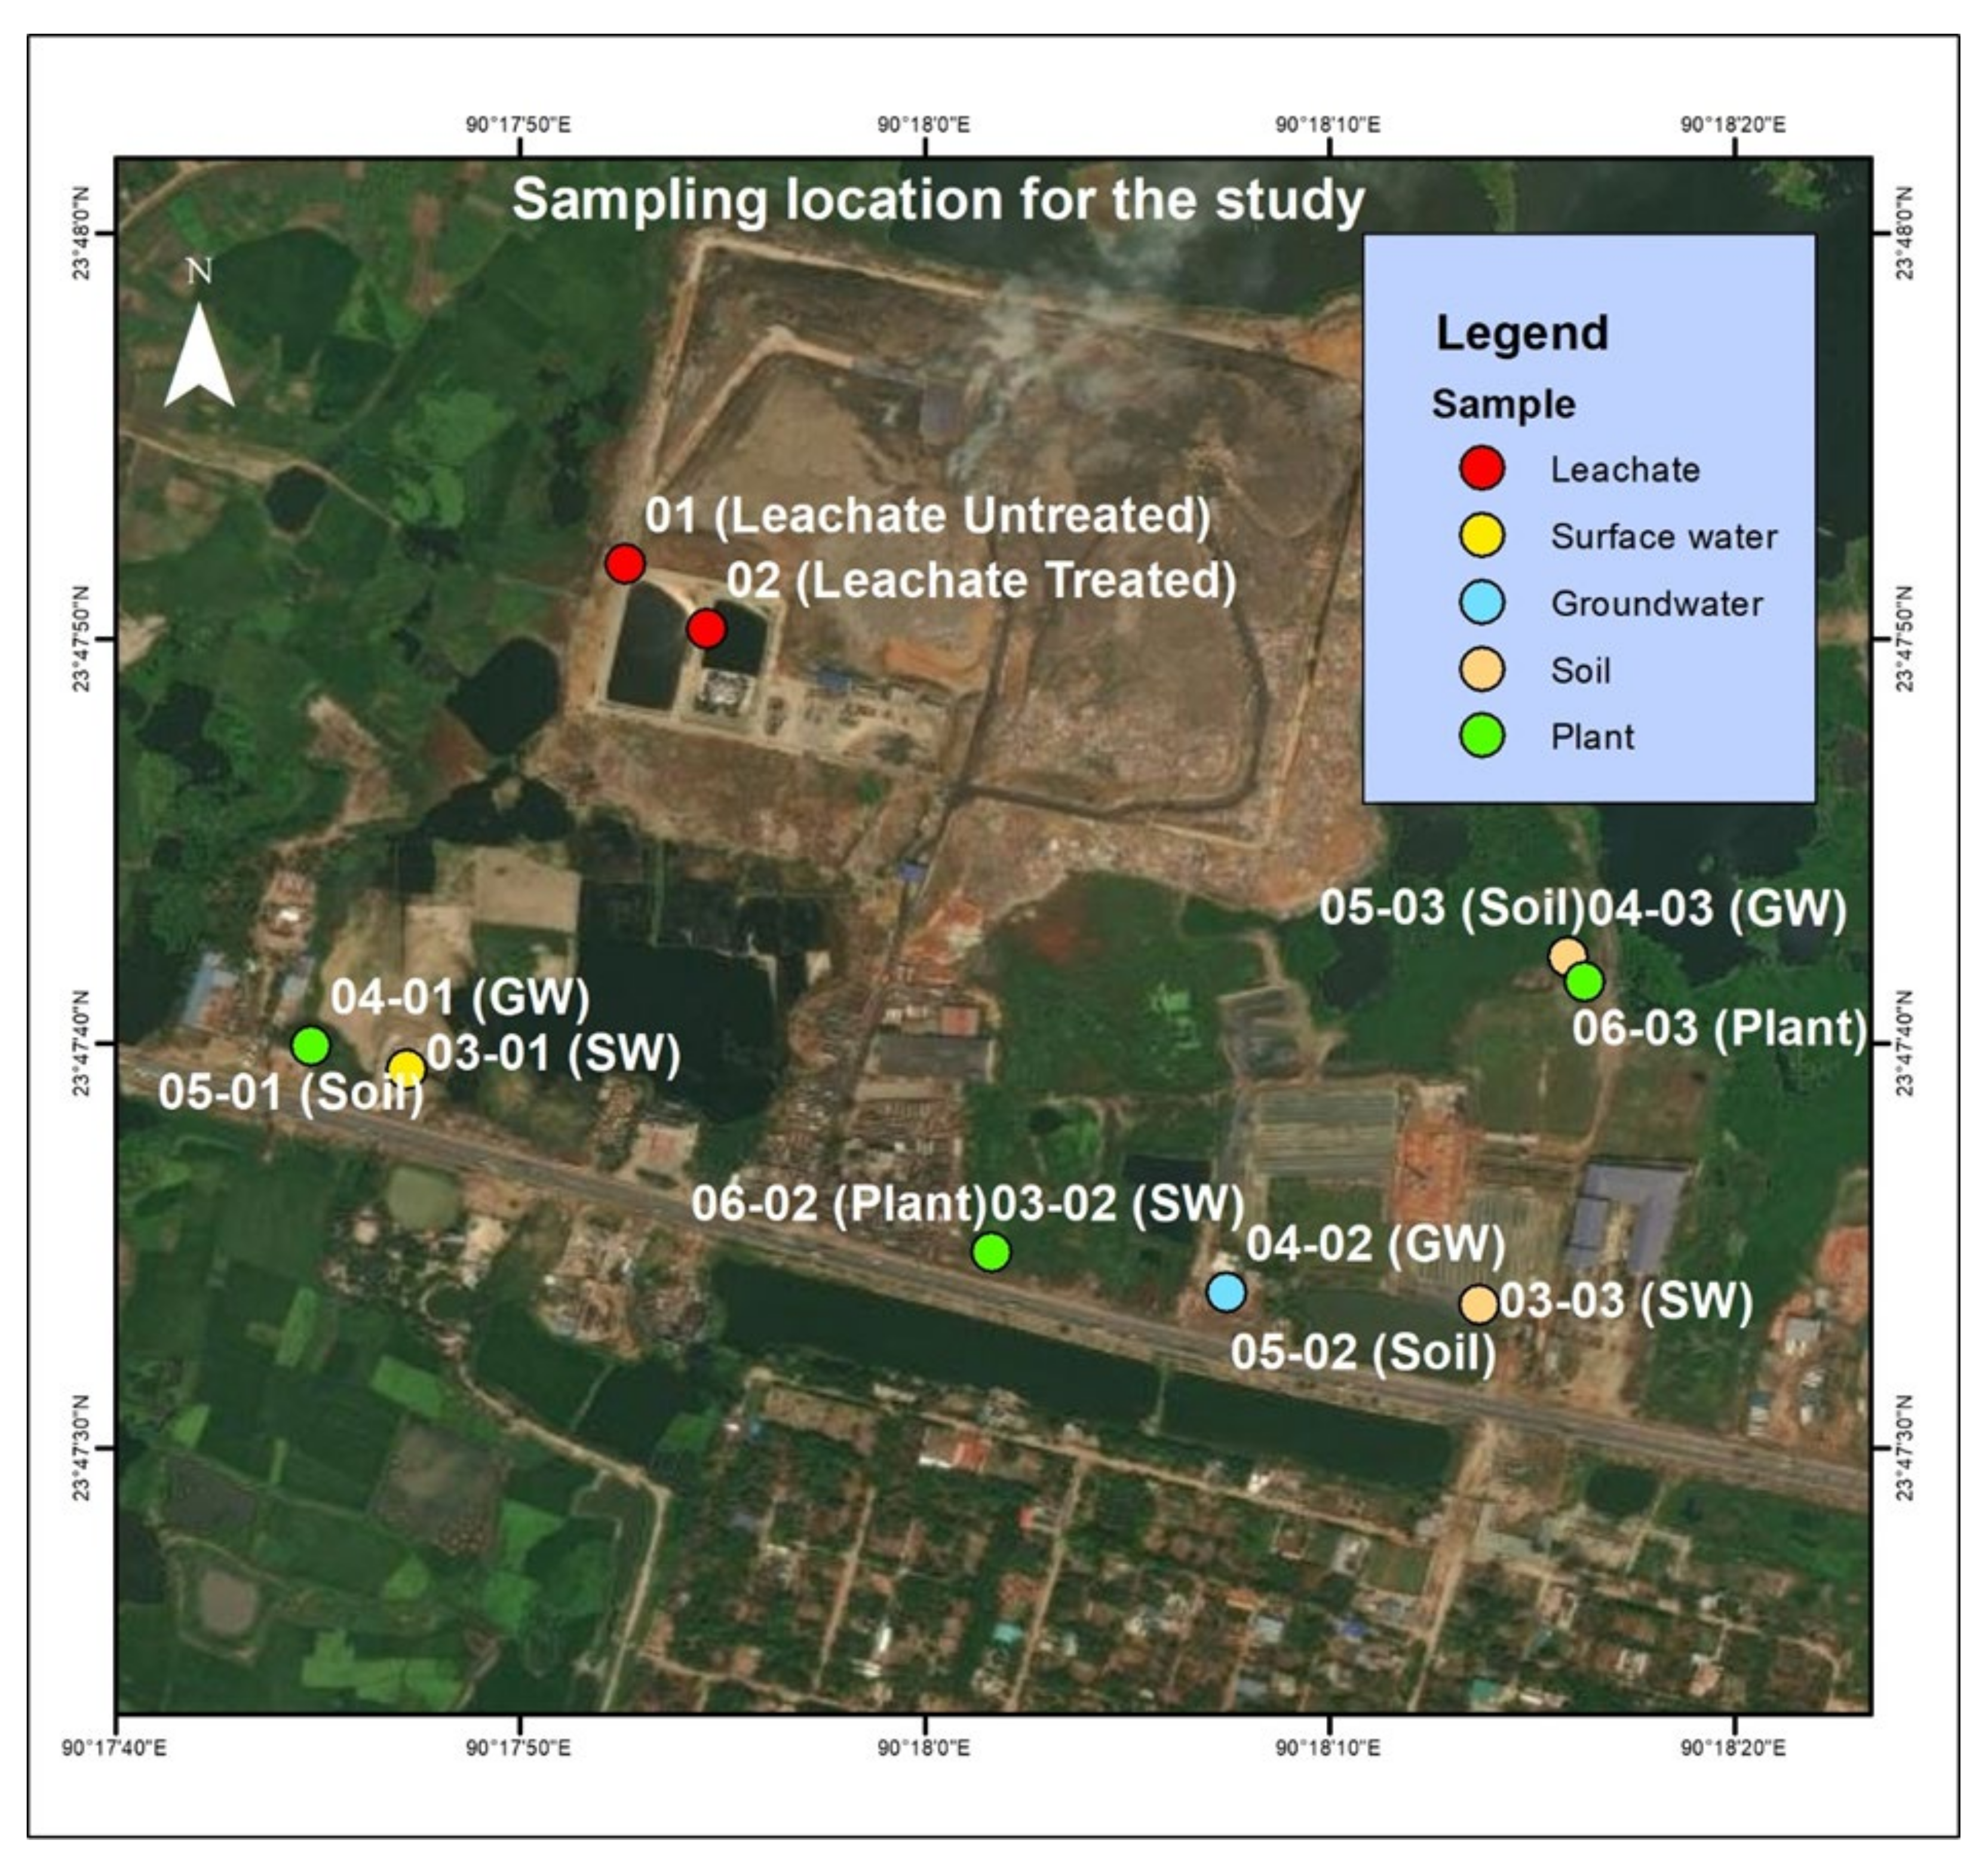
2.1. Study Area

Our study area, the sanitary landfill at Amin Bazar, is located at Savar Upazilla in Dhaka, Bangladesh, near the low-lying floodplain of the Karnatali River. The landfill lies between the latitude 23°48′0.86″ and 23°47′44.33″ N, and longitude 90°17′51.03″ and 90°18′12.03″ E. Since 2007, the location has been used as a dumpsite, with the first phase of its operation being an open dumpsite (Figure 1). Currently, this facility is a semi-aerobic sanitary landfill site with a total size of roughly 20.23 hectares that operates with the fast breakdown of wastes. Between June and October of the year, the region is submerged during every rainstorm [16].

2.2. Sample Collection

To collect the samples, the study area was selected within a 1 km of radius from the center of the landfill. A total of 42 samples were collected from the landfill site of Amin Bazar and the surrounding area within a radius of 1 Km following Ahsan et al. [17] and Siddique et al. [18]. A total of 5 types of samples were collected from the study area which includes 2 leachate samples, 3 surface water samples, 3 groundwater samples, 3 soil samples, and 3 plant samples. The details of the collected plant samples are given in Table 1.
For each type of sample, triplicate samples (n = 3) were collected to obtain a total of 42 samples (14 × 3 = 42). However, the collected triplicate samples from each type of sample of the study area were mixed together and homogenized well to obtain a total of 14 composite samples (42/3 = 14) from the study area. The samples were collected randomly from different locations within the study region, which can be addressed as cluster area sampling (Figure 2).

2.3. Sample Preparation

For the preparation of leachate, surface water, and groundwater samples, 50 mL of each liquid sample was taken into a 250 mL beaker, and 2–3 mL of concentrated nitric acid (HNO3, 65%) was added into it [17,18]. The mixture was then heated at 90 °C in a hot plate until the volume of the solution reach around 3 to 5 mL after evaporation. After that, the solution was cooled and filtered into a volumetric flask with Whatman 42 filter paper rinsing the sample beaker with deionized water to make the final solution volume of 50 mL. The collected soil and plant samples were dried at 60 °C in an oven for 24 h. After that, samples were grounded to powder using a hand grinder and stored in a zip-lock plastic bag. The digestion of the soil sample was performed following Siddique et al. [18] and Hasan et al. [19]. About 5 gm of powdered sample was taken into a 250 mL beaker and 10 mL of conc. HNO3 and 5 mL of conc. HClO4 was added to it. The mixture was then heated in a hot plate at 90 °C for 3–4 h. The solution becomes almost transparent, and then, it was cooled and filtered into a 50 mL volumetric flask as mentioned above. The plant samples were prepared following Nasrin et al. [20]. In summary, a muffle furnace was used to gradually heat 5 g of powdered plant sample to 600 °C, and that temperature was maintained for 6 h. Then, the ash sample was treated with concentrated HNO3 and HClO4 (ratio: 2:1) and boiled on a hot plate at approximately 150 °C to produce a colorless clear solution after cooling. In a volumetric flask, the solution was prepared to a final volume of 50 mL using deionized water. Until analysis in the lab, the entire prepared sample solution was stored in plastic bottles at 4 °C.

2.4. Sample Analysis

All samples were analyzed following the methods described by American Public Health Association [21] along with the in-house laboratory methods. Physiochemical parameters of water samples such as temperature, electrical conductivity (EC), total dissolved solids (TDS), pH, salinity, and dissolved oxygen (DO) were measured in the field using a multi-parameter meter (Hanna HI-9829). Total hardness (TH) was measured by the conventional titration method. The concentrations of several trace metal(loid)s such as Co, Cd, Ni, Pb, As, and Cr was measured using an Atomic Absorption Spectrophotometer (AAS) (Model: AA240FS, Varian, Agilent, Victoria, Australia; Software: SpectrAA version 5.1). The details of the analytical procedure and quality control to produce reliable data in AAS are reported earlier [17,18,19]. In brief, the concentration of trace metal(loid)s was measured against a prepared calibration curve using certified reference materials (CRM, Fluka Analytical, Sigma-Aldrich, Darmstadt, Germany) for individual elements. The accuracy and precision of the analysis were checked through triplicate analysis of the CRM and samples. To ensure further analytical quality, the CRM, method blank, and sample blank were analyzed sequentially. The detection limit for the analyzed trace metal(loid)s viz., Co, Cd, Ni, Pb, As, and Cr were 2.13, 0.29, 2.17, 1.20, 0.16, and 0.41 ppb, respectively. The spike recovery in the analysis was within 94–104%. All samples, standards, and blanks were measured three times, and mean results were taken into consideration.

2.5. Statistical Analysis and Spatial Distribution of Metal(loid)s

The results of metal(loid)s concentrations were analyzed statistically for principal component and Pearson’s correlation analysis using SPSS software (version 25) to identify the source of pollutants through their associations. Inverse Distance Weighted (IDW) through ArcGIS has been performed to identify the spatial distribution of the elemental concentration [22]. IDW is an interpolation tool of ArcGIS which is used for a better understanding of the surface grid and predicting the values of cells at locations that lack sampled points. ArcMap 10.3 has been used to analyze the spatial distribution.

2.6. Indices for Water Quality, Pollution, and Feasibility Assessment

There are several indices that are widely used in different water research (surface water, groundwater, drinking water) to assess the water quality, water suitability, and pollution degree to various extents [23,24,25,26,27]. In this work, the water quality index (WQI) [28], degree of contamination (CD) [29], heavy metals evaluation index (HEI) [30], and heavy metal pollution index (HPI) [31,32] were used to evaluate the water quality and the level of water pollution in the study area. The indices were calculated using the following equations.
WQI = [   W Wi × Ci Si × 100 ]
CD = i = 1 n Cn
HEI = i = 1 n Mi Si
HPI = WiQi Wi
Here, assigned weights were according to their relative significance (W), relative weight (Wi), the concentration of each variable (Ci), standard values (Si), contamination factor (Cn), measured value (Mi), and Sub-index (Qi). The required parameters for the calculation methods of various indices are given in Table 2.

3. Results and Discussion

3.1. Physicochemical Characterization of Leachate and Water Samples

The results of the physicochemical parameters of leachate, surface water, and groundwater samples of the study area are summarized in Table 3. The pH values of all samples are found within the standard limit. The mean pH value found in the leachate sample was 7.85, which refers to a mature landfill leachate based on the study of Tchobanoglous et al. (1993) [39]. The study showed that the pH value for new landfills normally varies from 4.5 to 7.5, and for mature landfills, it varies from 6.6 to 7.5. It is important to note that landfill leachate may raise the pH of drinking water and may help in producing trihalomethane (THM), which is a chemical that is hazardous to humans [40]. The DO level in leachate samples is found to be very low, suggesting a significant link with EC, which also shown to be at high levels in landfill leachates, reflecting a high presence of inorganic components [13]. However, in the water samples, the level of DO is found within the standard limit. The mean turbidity of groundwater samples was found far lower than the leachate and surface water, which is plausible. The salinity of the leachate sample was extremely higher than the surface water and groundwater. This highly saline leachate can contribute to increasing the salinity of surface water and groundwater. This is corroborated by the discharge of domestic waste in landfill. The mean TDS and EC values of the leachate samples are found to be much higher than the water samples for which the values are within the standard limit. Extremely high conductivity values are caused by an abundance of cations and anions. The intensity and overall pollutant load of the leachate are further reflected in the total mineral content. The leachate contains salt because it contains potassium, sodium, chloride, nitrate, sulfate, ammonia, and other chemicals [13]. The mean temperature of leachate, surface water, and groundwater was 33.12, 28.87, and 28.8 °C, which was higher than the recommended value of EU. The mean values of the total hardness of leachate are also found to be much higher than the surface and groundwater. The total hardness of all the samples was found to be more than the permissible limit recommended by the ECR and WHO [35,38].

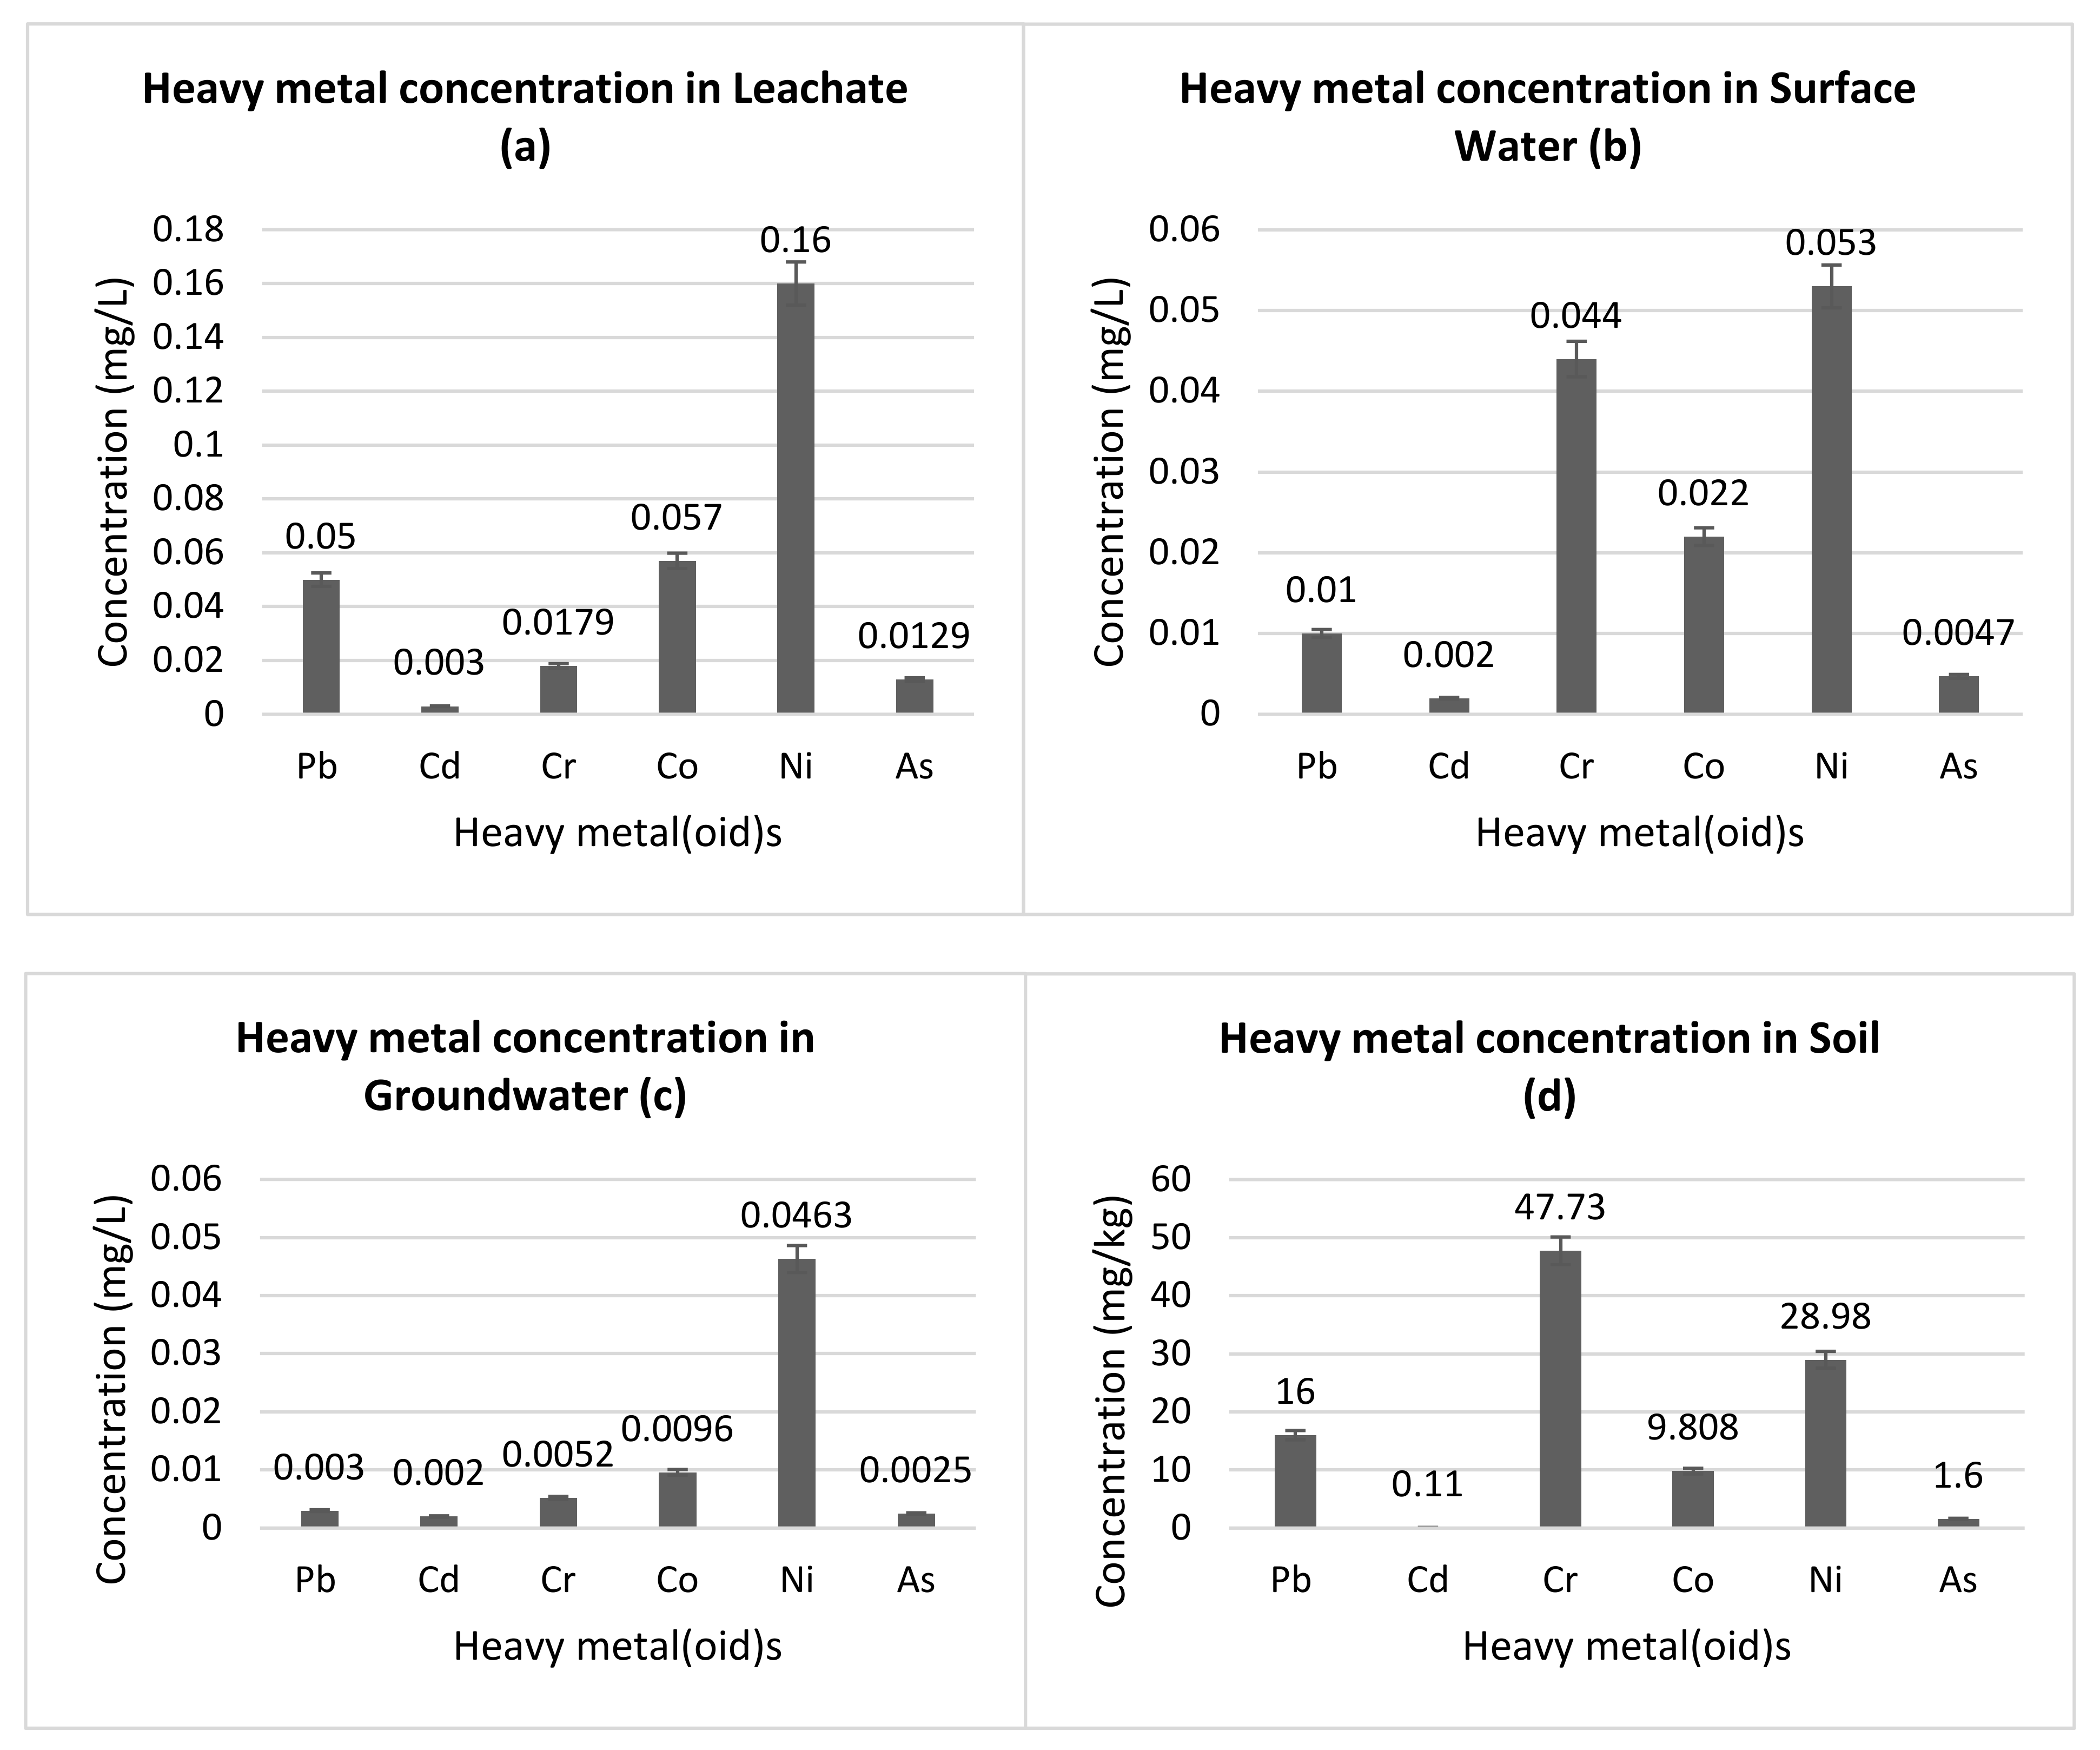
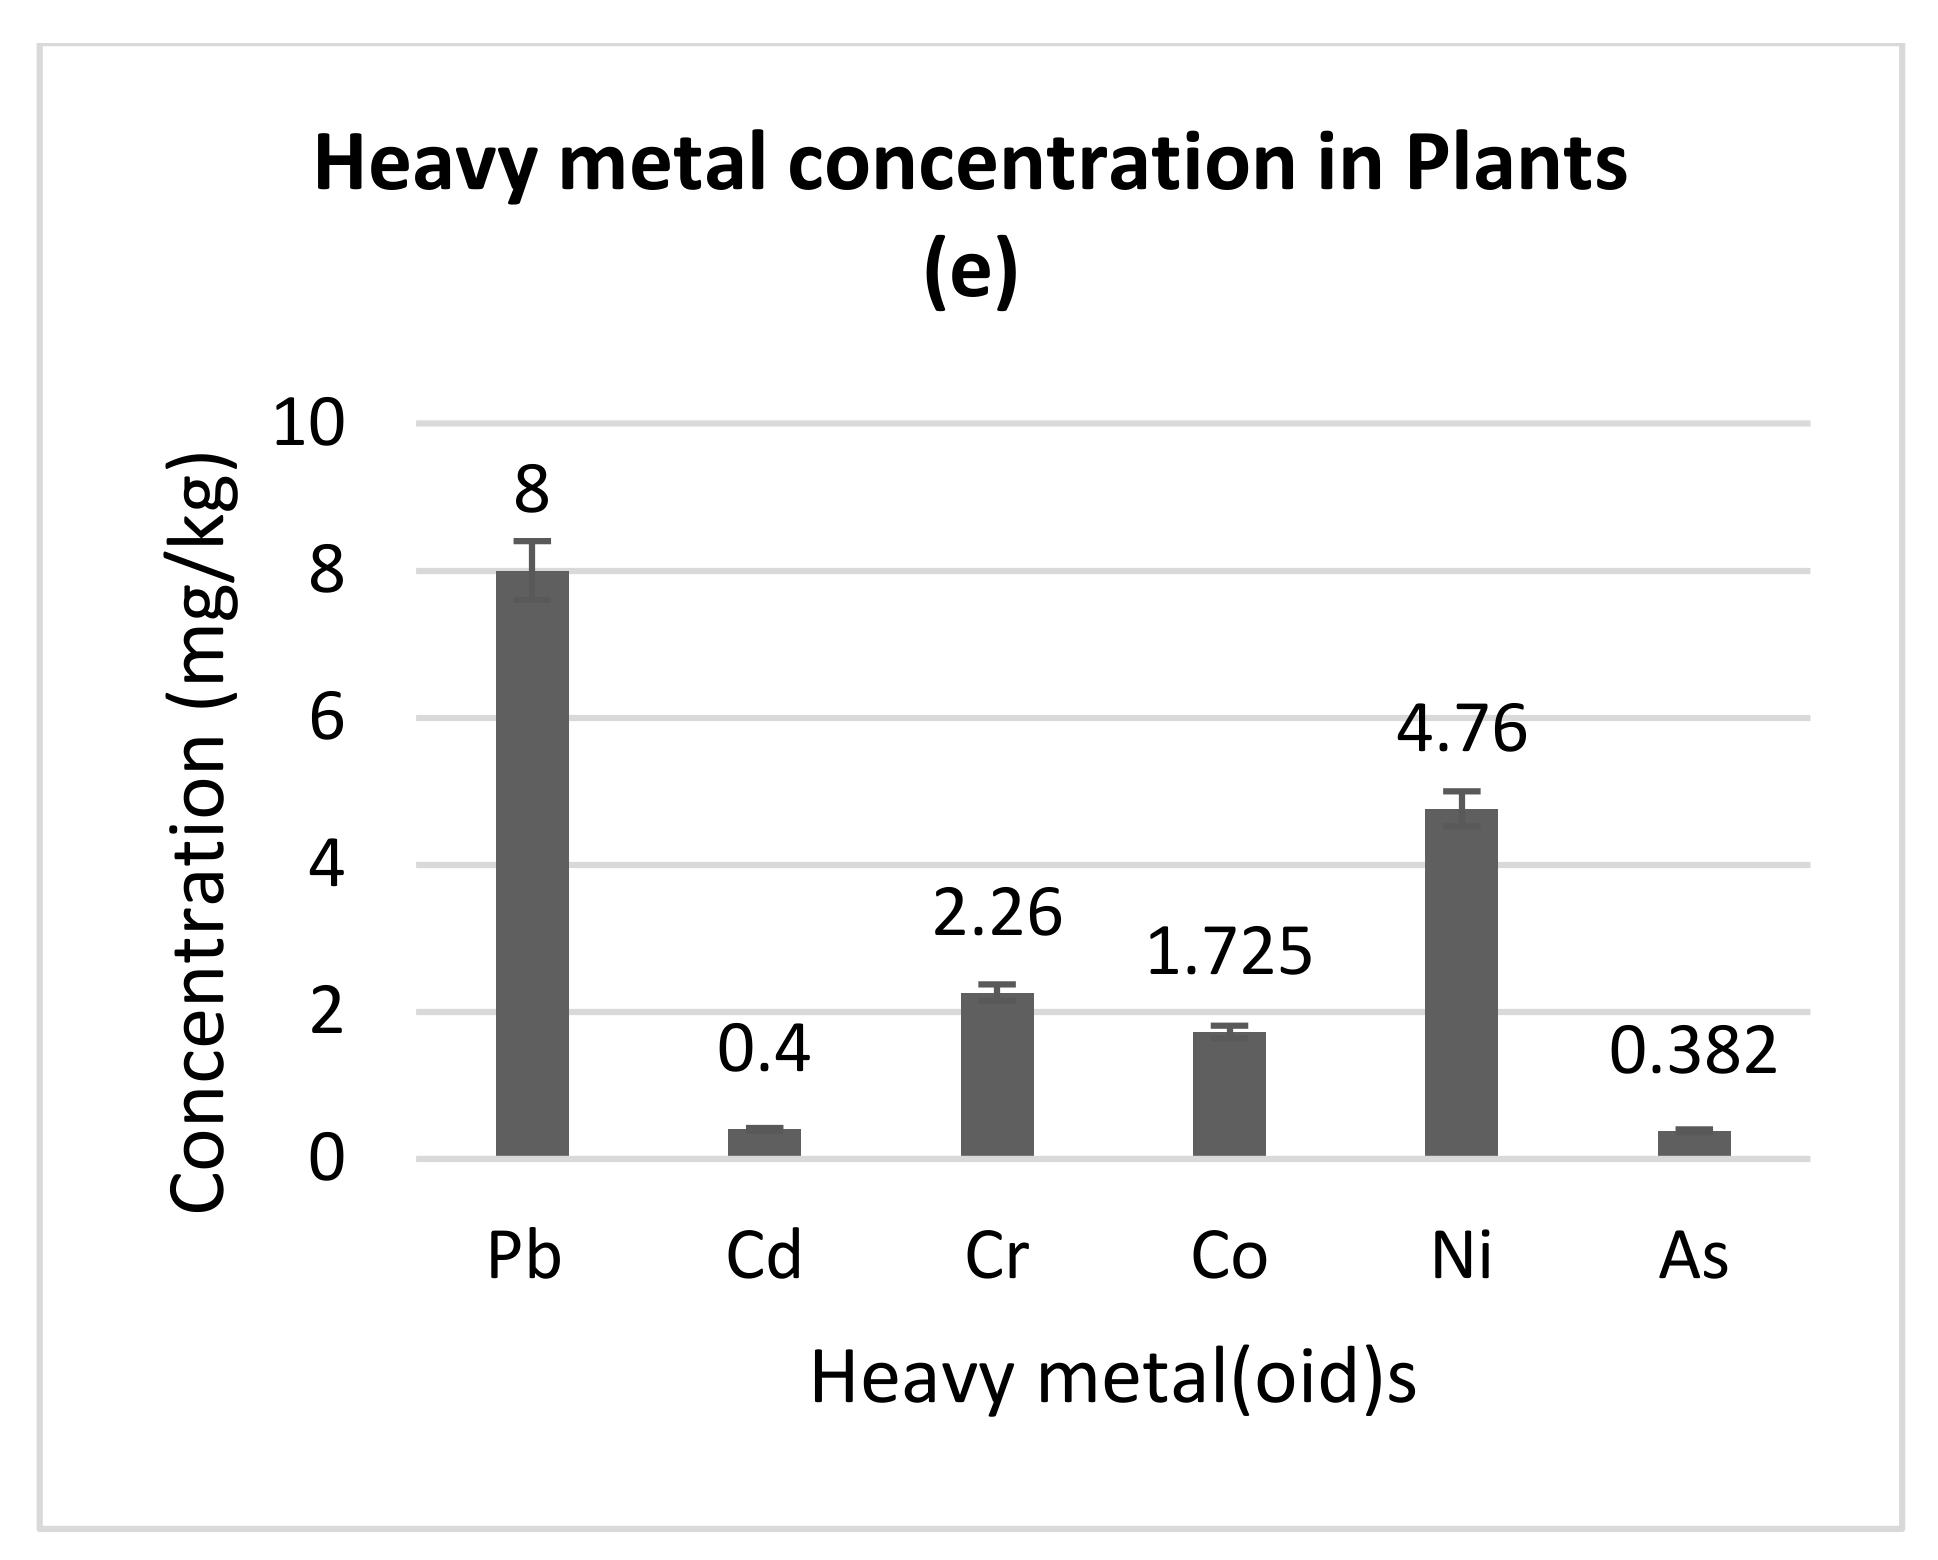
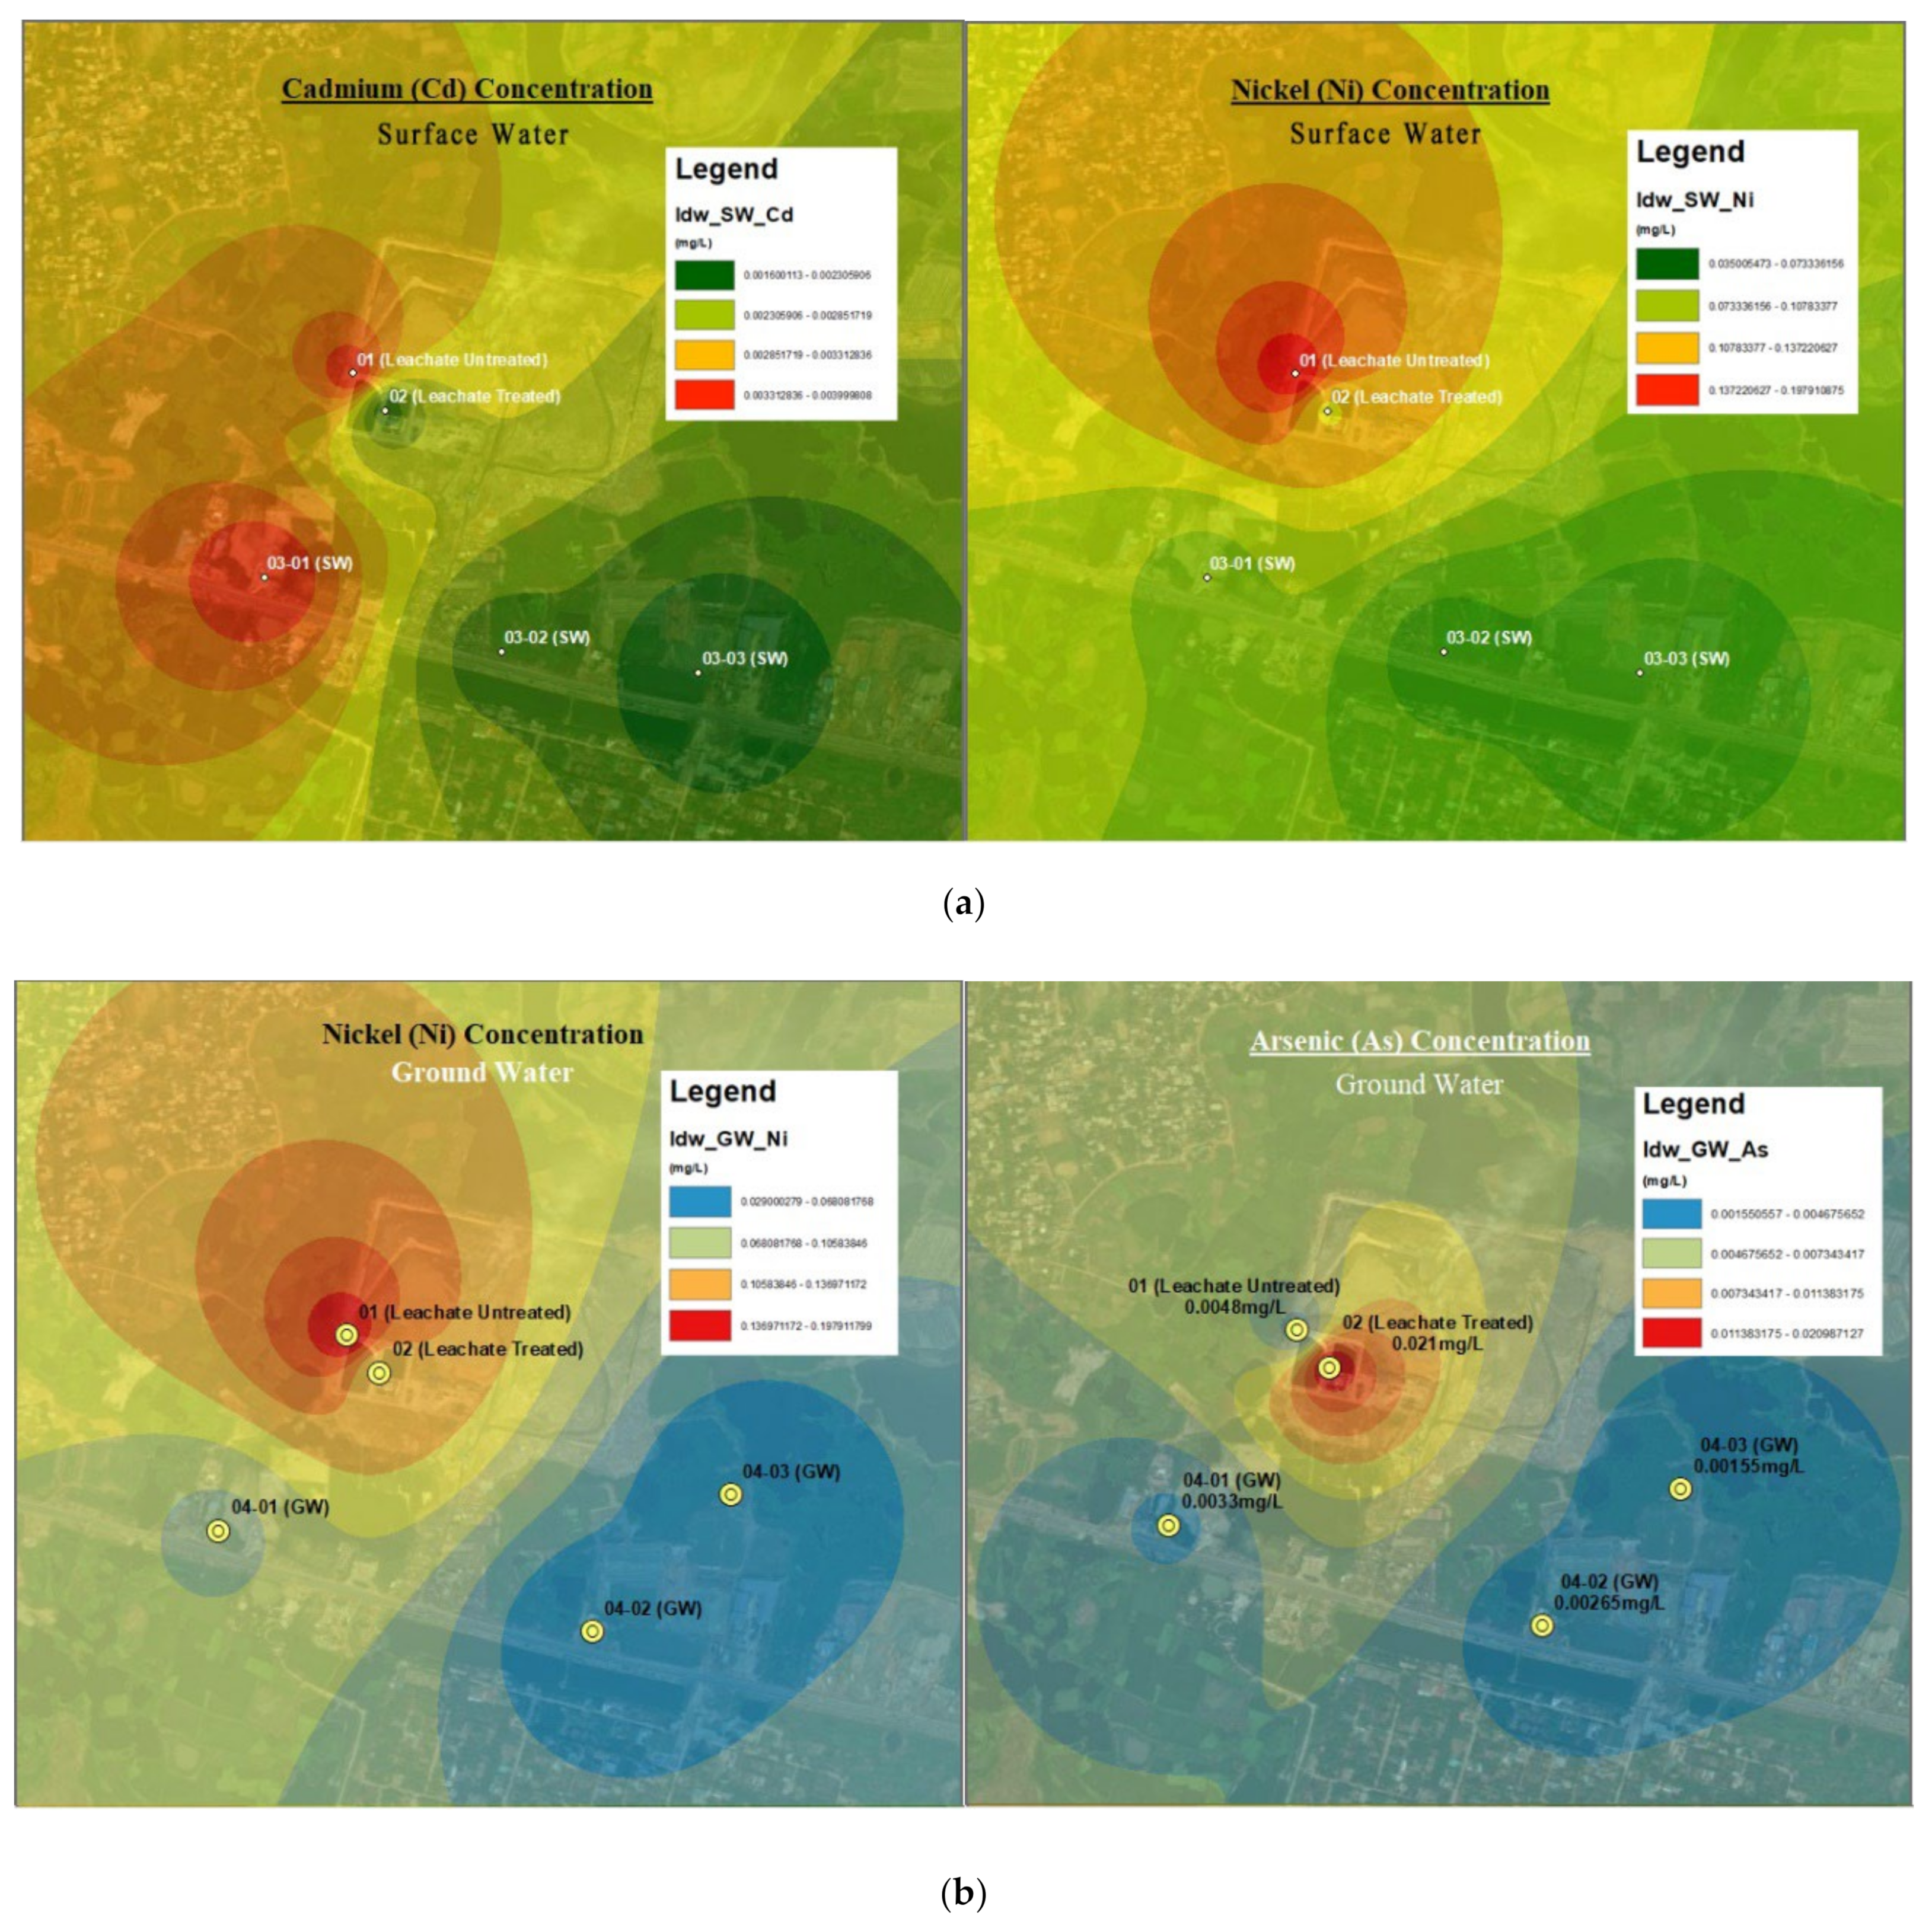
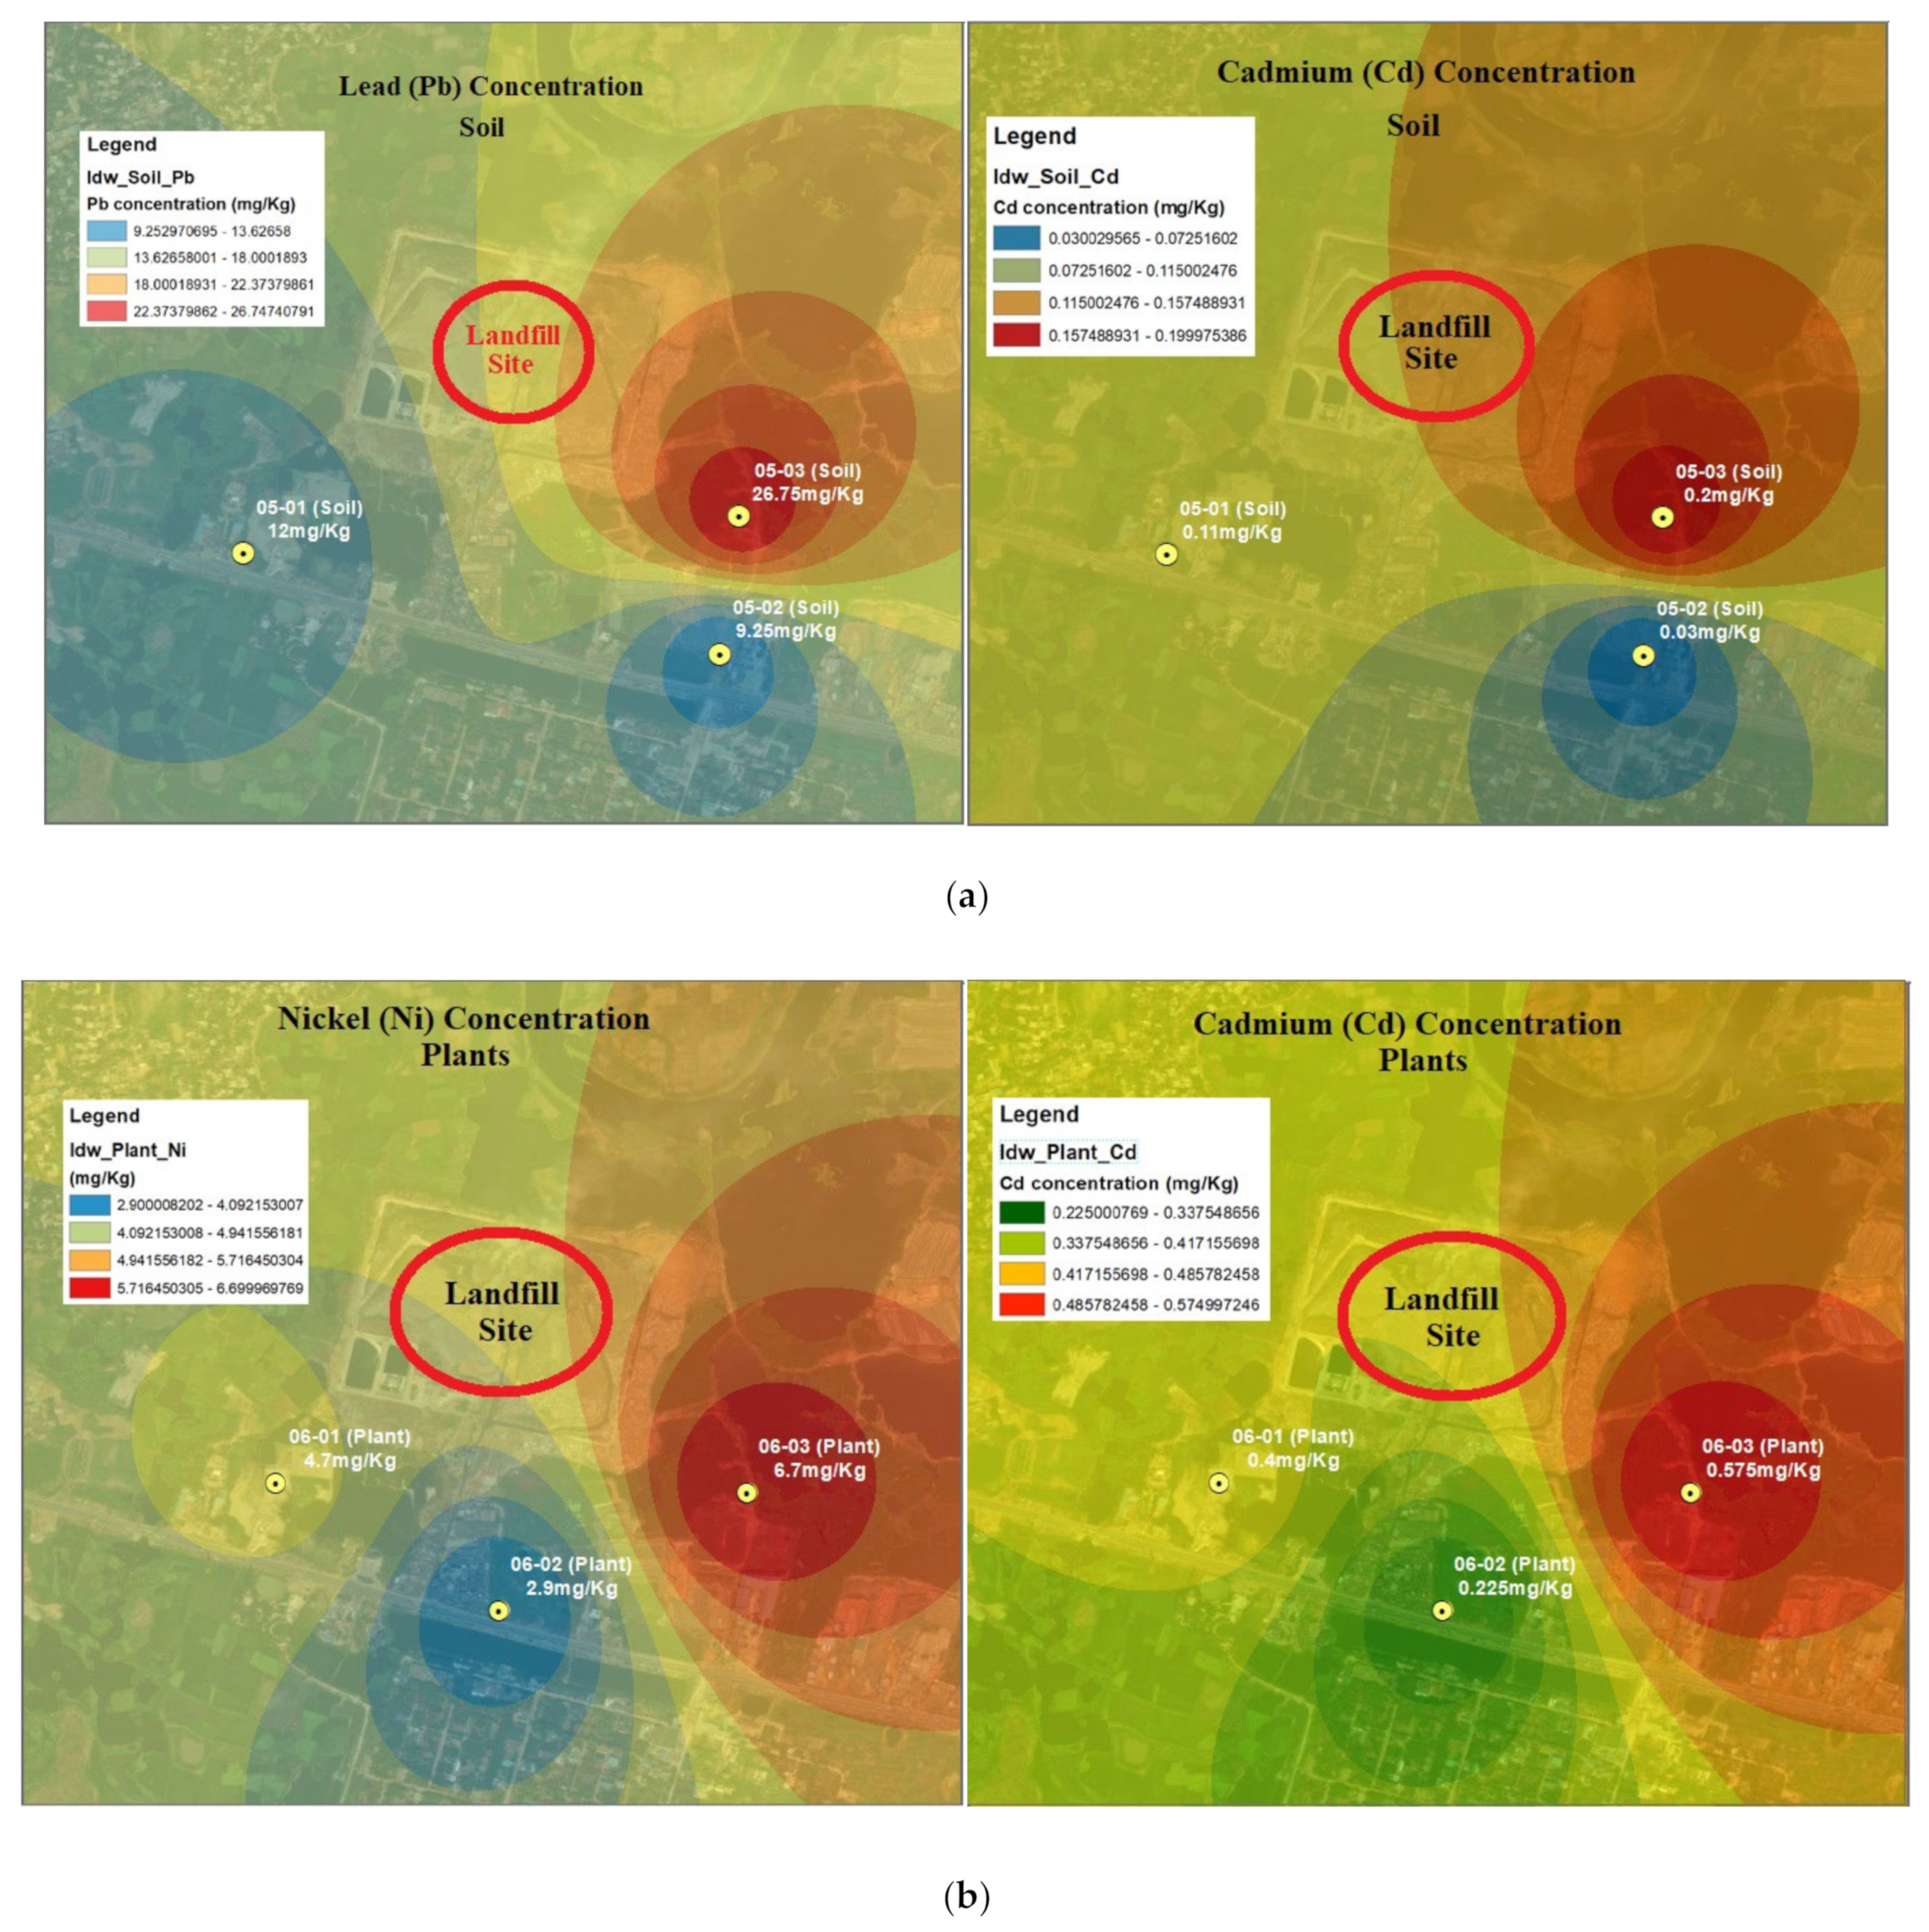
3.2. Concentration of Metal(loid)s in Leachate, Water, Soil, and Plants Samples

The results of heavy metal(loid)s concentration of leachate, surface water, and groundwater samples of the study area are summarized in Supplementary Table S1. The mean concentration of Pb in leachate, surface water, groundwater, soil, and plants were 0.05 mg/L, 0.01 mg/L, 0.003 mg/L, 16 mg/kg, and 8 mg/kg, respectively. The concentration of Pb found in previous studies on various landfills’ leachate was ranging from 0.01 to 0.45 mg/L [41]. Alam et al. (2020) detected a high concentration of Pb in surface water, ground water and soil around a landfill site in Sylhet, Bangladesh [42]. Although the usefulness of lead in human physiology is unknown [43], prolonged exposure at high levels could harm vital organs and systems such as the nervous, digestive, hematopoietic, cardiovascular, reproductive, and immune systems, as well as the skeleton and kidneys [44]. In contrast, the mean concentration of Cd was 0.003 mg/L, 0.002 mg/L, 0.002 mg/L, 0.11 mg/kg, and 0.4 mg/kg, respectively. The concentration of Pb and Cd in plants was higher than the maximum permissible limit set by the WHO but in the water and soil, the concentration was within the standard limits. The mean concentration of Cr in leachate, surface water, groundwater, soil, and plants were 0.0179 mg/L, 0.044 mg/L, 0.0052 mg/L, 47.73 mg/kg, and 2.26 mg/kg, respectively. These trace elements are considered as potentially harmful pollutants. Because they may make strong metallic bonds with several functional macromolecules at once, leading to clump development, they can interfere with a cell’s basic functioning in a biological system. Pb is harmful even at low doses and can induce anemia, brain damage, anorexia, mental deficit, vomiting, and even death in people [13]. The Co concentrations in all these samples were 0.057 mg/L, 0.022 mg/L, 0.0096 mg/L, 9.808 mg/kg, and 1.725 mg/kg, respectively. The concentration of Cr and Co were higher than the maximum permissible limit in plant samples set by the WHO, but in the water and soil samples, the concentration was within the limits. The Cr concentration detected in previous studies on various landfills ranged from 0.005 to 2 mg/L [41]. Since Cr does not significantly affect plant metabolism, growth, or productivity, it is found that Cr accumulation in plants is highly toxic [45]. Long-term Cr accumulation in the soil lowers agricultural production and crop quality [46]. The mean concentration of Ni in leachate, surface water, groundwater, soil, and plants was 0.16 mg/L, 0.053 mg/L, 0.0463 mg/L, 28.98 mg/kg, and 4.76 mg/kg, respectively. In contrast, the concentration of As in all these samples was 0.0129 mg/L, 0.0047 mg/L, 0.0025 mg/L, 1.6 mg/kg, and 0.382 mg/kg, respectively. The leaching of As, Cr, and Cu from wood wastes such as building and demolition projects, utility poles, furniture, landscape structures, and wood products industries, which is often treated with chromated copper arsenate (CCA) preservatives, may result in higher metal levels in wood [47]. The Ni concentration in leachate was above the maximum permissible limit, but in the rest of the samples, the concentration was within the permissible limit. On the other hand, the concentrations of As were slightly above the permissible limit in the leachate. The concentration of As in treated leachate was found higher than in untreated leachate. This may be occurring because of the aerobic treatment of leachate, which may result in oxidative dissolution [48]. The concentration of all the analyzed heavy metal(loid)s has been graphically represented in Figure 3.

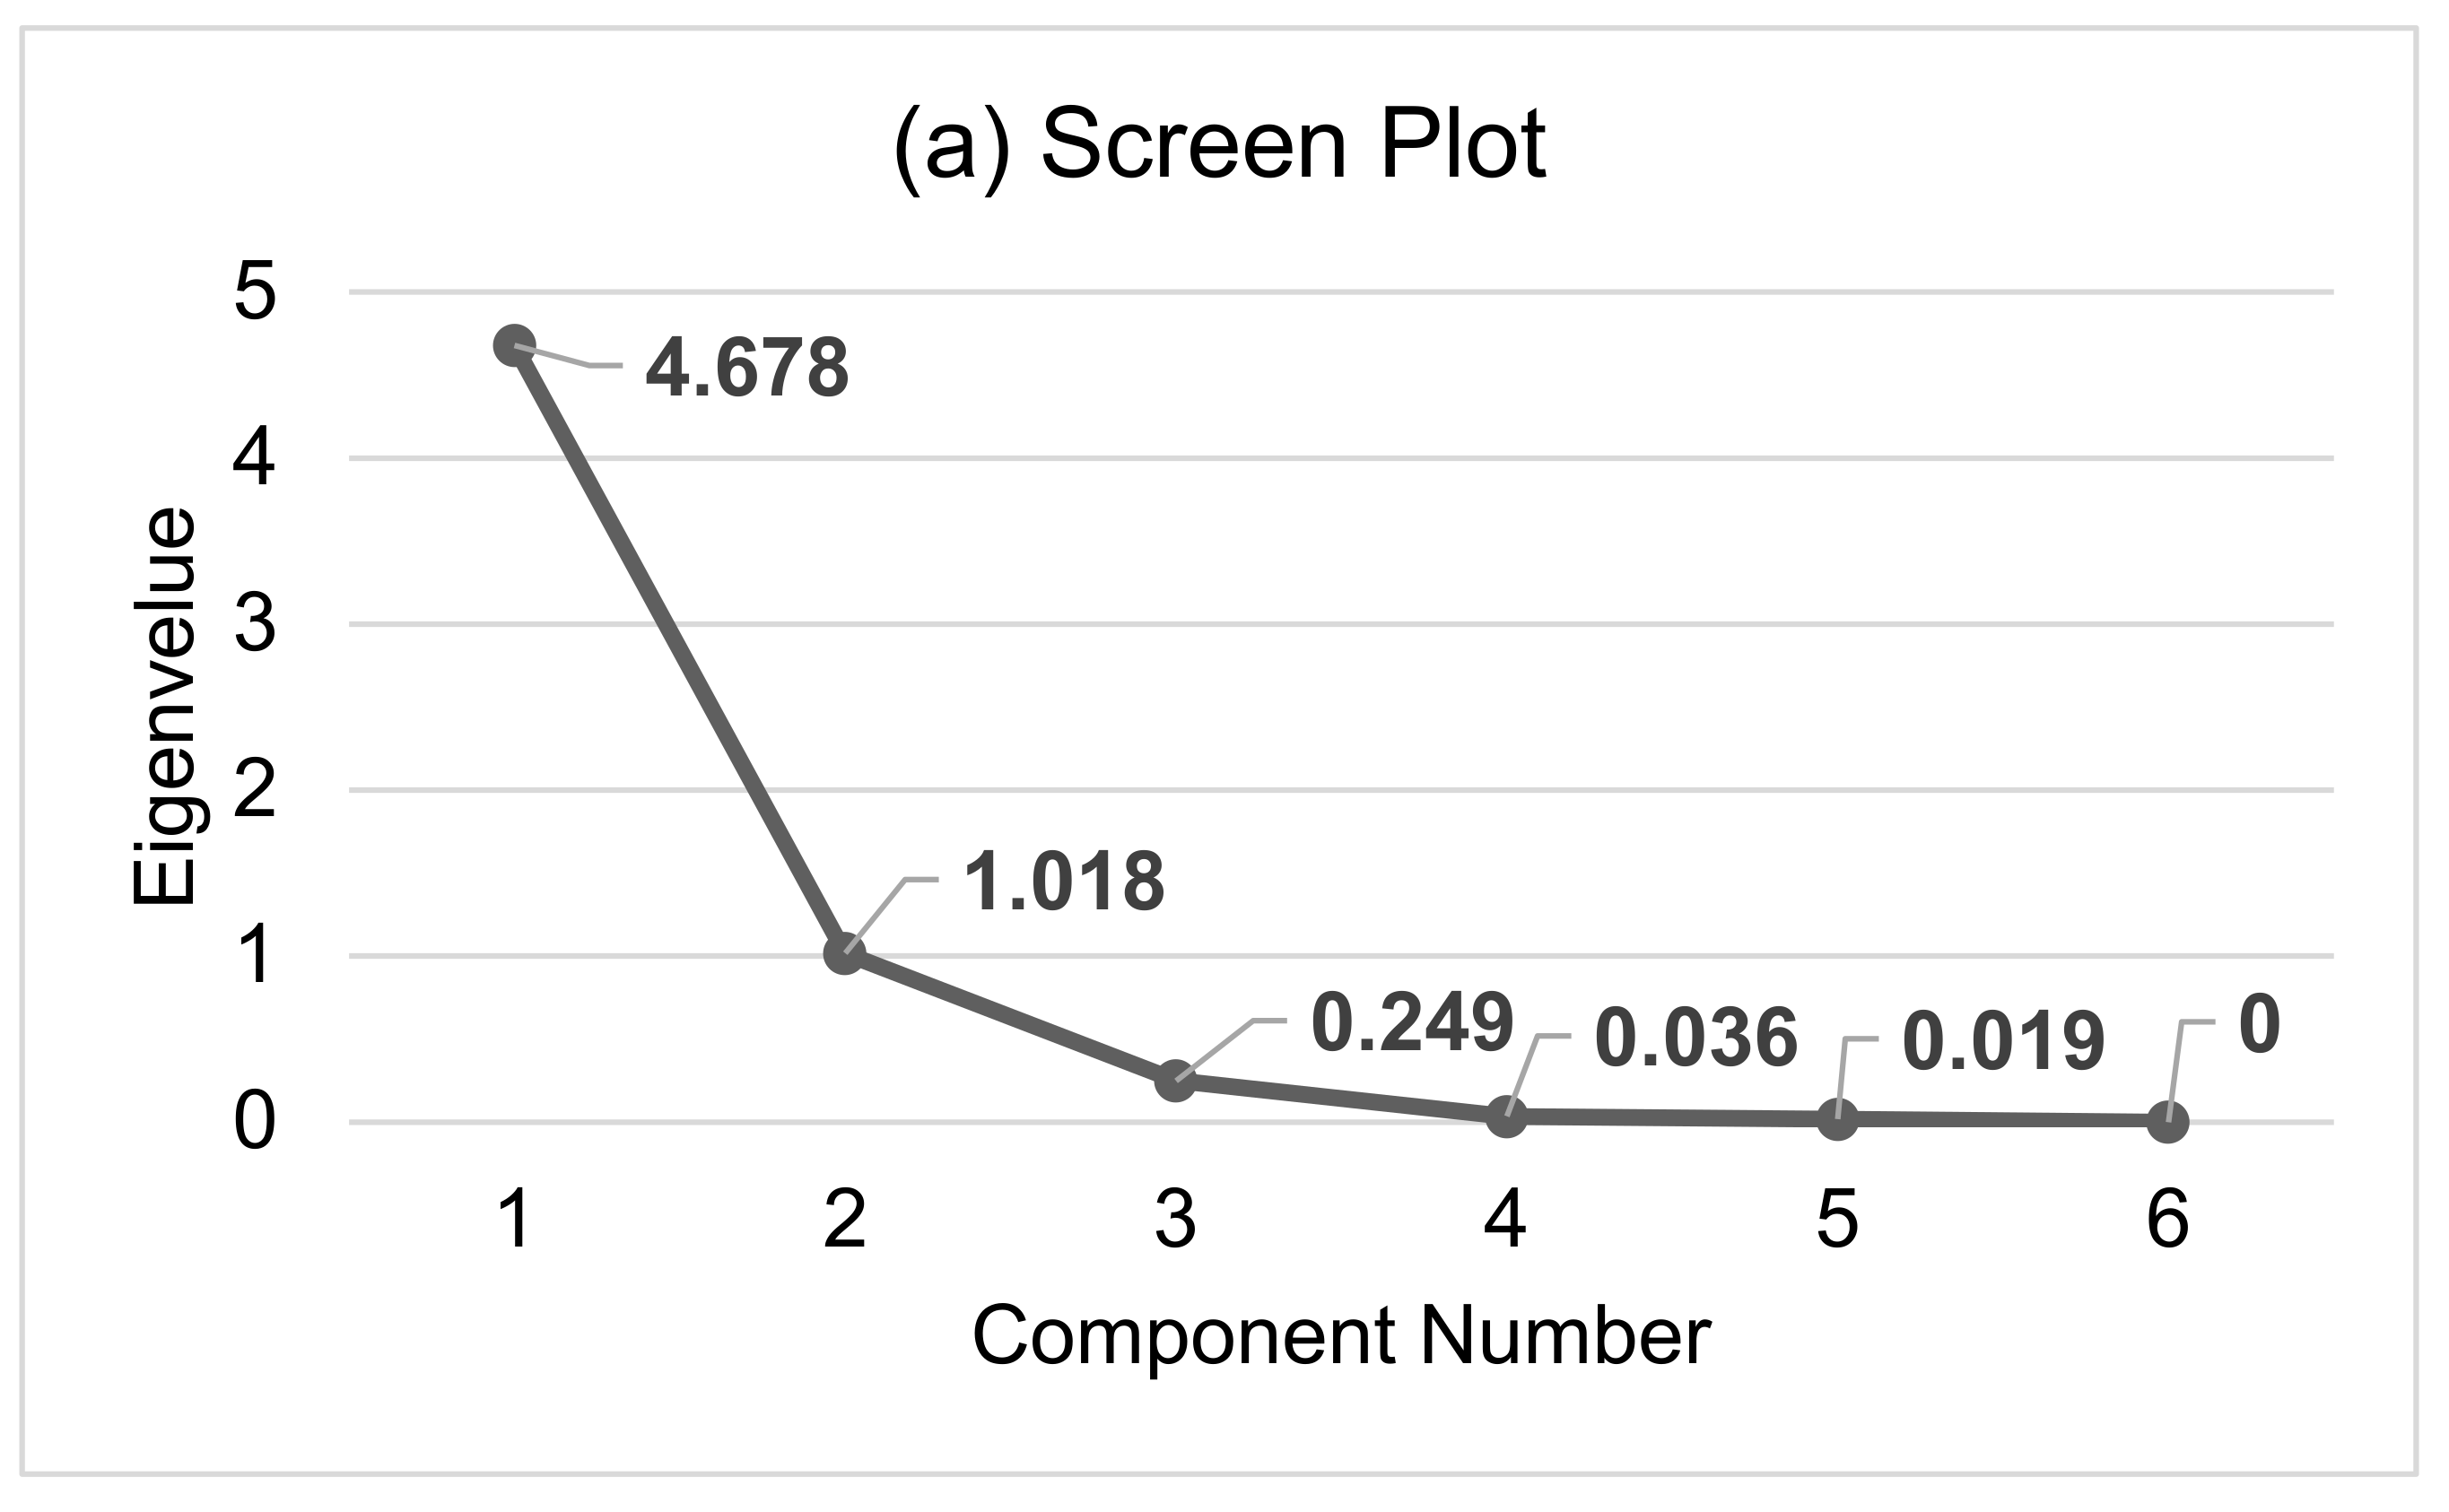
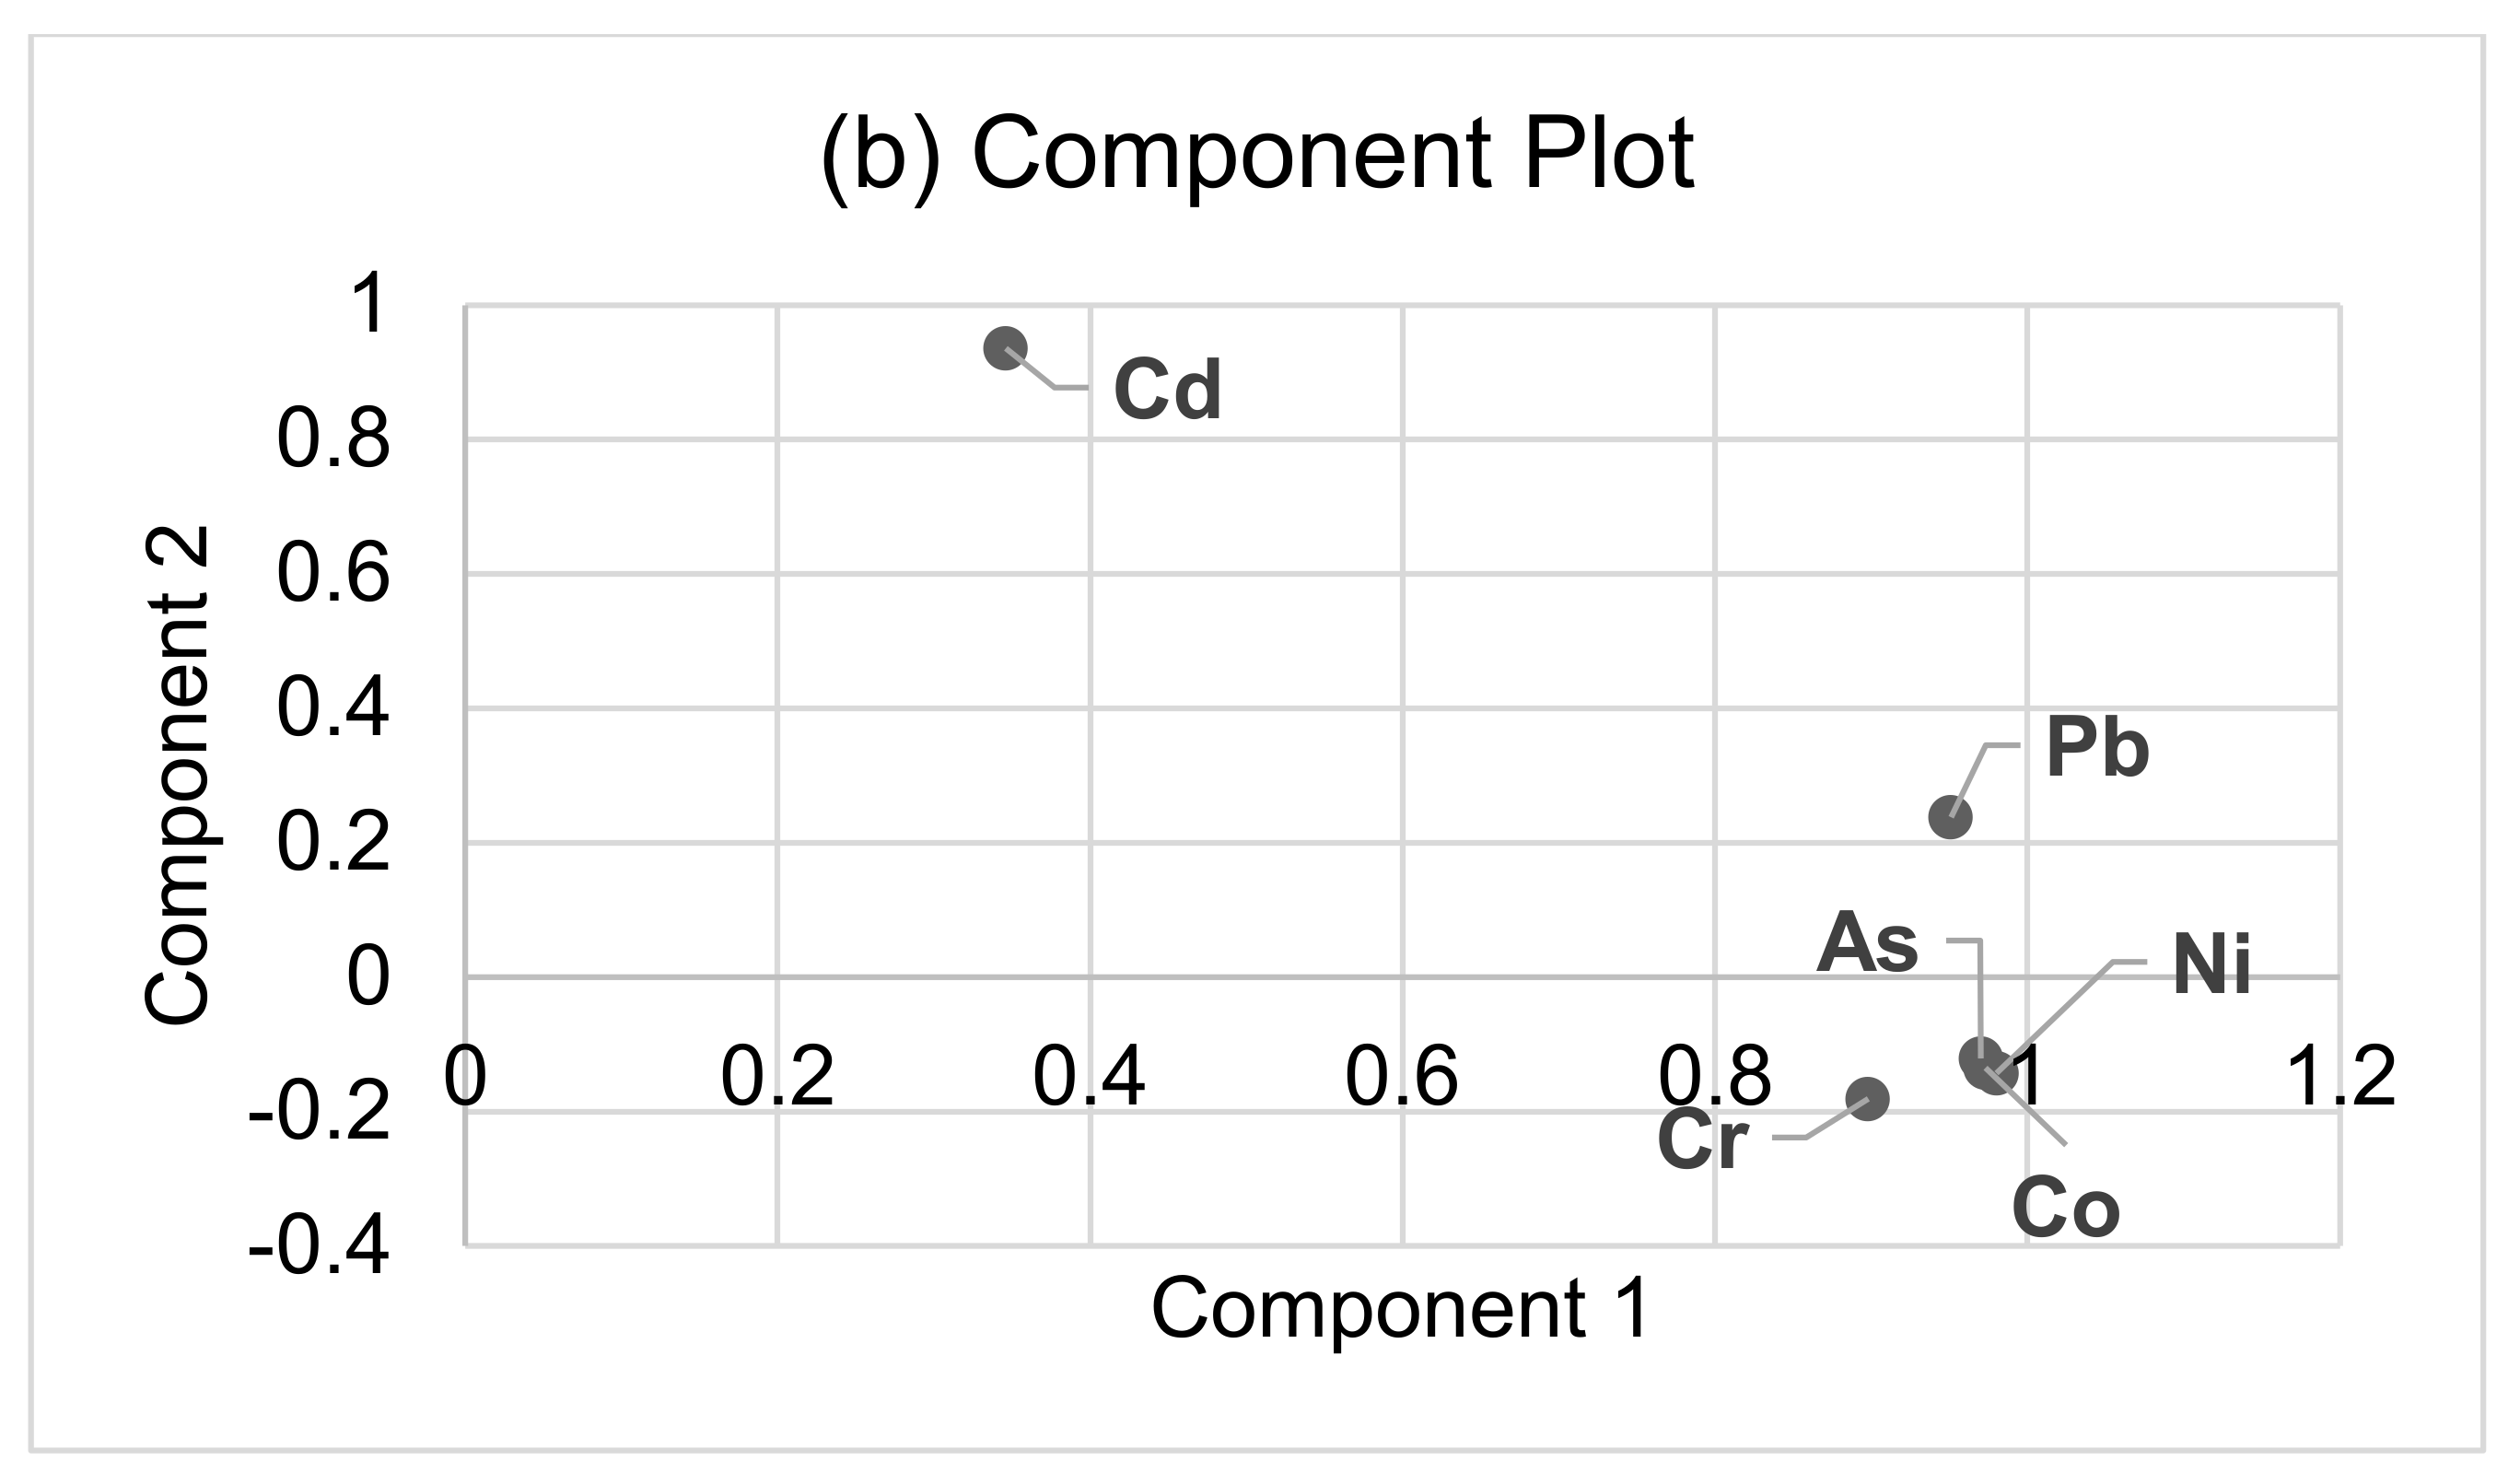
3.3. Principal Component Analysis

The principal components that have the maximum probability of polluting the environment by being present were analyzed by principal component analysis (PCA). The PCA extracted two controlling factors from the analytical data set of heavy metal(loid)s concentration with eigenvalues >1 (Figure 4). The extracted two factors contain about 95% of the total variance, which is explained by whole factors. Component 1 (PC1) comprises about 78% of the total variance with strong positive loadings of the factors due to lead (Pb) only. PC2 accounted for 17% of the total variance, which represented the strong positive loading of Cadmium (Cd). Therefore, analyzing these two components will be enough to acquire 95% of all these metals’ analyses.

3.4. Pearson’s Correlation Analysis

According to the correlation matrix of physicochemical parameters of leachate, surface water, and groundwater in Table 4, the pH has the maximum positive proportional relation with all the other parameters, except for turbidity. In contrast, DO has an inversely proportional relation among turbidity, TDS, EC, and TH.
According to Pearson’s correlation matrix of heavy metal(loid)s concentration (Table 5), Pb has a positive proportional relation with all the other parameters. On the other hand, Cd does not comply with any positive proportional relation with other metals except for Pb. This also complies with the PCA result where Pb is the first component comprising 78% of total variance, as it has the maximum positive correlation with all the other metals except Cd, which as a result becomes the second component of PCA.

3.5. Water Quality and Pollution Assessment

According to the determined values listed in Table 6, the WQI value of leachate is higher than that of both surface and groundwater. Although the WQI of leachate shows that they are of good quality, the CD value of leachate shows that the leachate is heavily contaminated. The obtained value of WQI of the leachate sample was 50.01, which is not in the excellent range [49,50], and the CD value of treated leachate was 4.663, which denoted that the leachate was heavily contaminated according to the pollution level [29].

3.6. Spatial Comparison of Heavy Metal(loid)s Concentration and Distance from Landfill Site

As the results revealed, landfill leachate has the maximum concentration of the analyzed heavy metal(loid)s than other water samples. Water, soil, and plant samples also have a higher concentration of contaminants than the permissible limit. It was essential to analyze whether the surrounding environment had been contaminated because of the landfill leachate or if there were other reasons. According to the IDW analysis, sample 03-01 of surface water was the closest to the leachate pond, which was followed by sample 03-02 and sample 03-03. The cadmium concentration in sample 03-01 was the highest (0.004 mg/L), which was followed by sample 03-02 (0.002 mg/L) and sample 03-03 (0.0016 mg/L). Therefore, the Cd concentration in the surface water is inversely proportional to the distance from the landfill site. The smaller the distance, the higher the concentration. The same goes for Ni in surface water, as shown in Figure 5. In Figure 5, the color from green to red denotes the concentration from lower to higher. The concentration of Ni and As in groundwater is highest in samples 04-01, which was at the nearest distance from the landfill site. In Figure 5, the color from blue to red denotes the lower to higher concentration of Ni and As in groundwater.
The same goes for the Pb and Cd in the soil and plant samples (Figure 6). The concentration of Pb, Cd, and Ni shows the most acceptable result based on IDW. Sample 06-01 and sample 06-03 were closer to the landfill site and sample 06-02 was farther. Therefore, the concentration of all these heavy metal(loid)s was higher in samples 06-01 and 06-03. More GIS analysis of soil and plant has been added in Supplementary Figure S1.

4. Conclusions

This study has been conducted focusing on the impacts of Amin Bazar landfill, Dhaka, Bangladesh on the surrounding environment. To assess the impact of landfill leachate on the quality of the environmental compartments, physical and chemical characterization of the leachate and its surrounding environmental samples including the surface water, groundwater, soil, and plants were carried out. From the investigations, it can be concluded that the leachate (both treated and untreated) from the landfill site has a higher degree of contamination with respect to the analyzed parameters, which contribute to the surrounding environmental components including the surface water, groundwater, soil, and plants by polluting them adversely. Although the WQI of the samples based on the heavy metal(loid)s concentration was found within the standard limit, the concentration of heavy metal(loid)s in the soil and plants was found to be very high. This indicates a considerable deposition and accumulation of heavy metal(loid)s in soil and plants, respectively. Thus, all the plant samples have been found to accumulate with a higher concentration of Pb, Cd, Cr, and Co than the permissible limit. Again, the individual concentration of As was higher than the maximum permissible limit in the leachate. According to the Inverse Distance Weighted (IDW) analysis, landfill leachate has the maximum probability to contaminate the surrounding environment with heavy metal(loid)s. The results of this study support the need for continuous monitoring of the environmental components around the Amin Bazar landfill along with the landfill management system. The investigation also showed that despite being treated with conventional aeration, the quality of the leachate sample in this area does not meet Bangladesh’s inland surface water quality criteria. As a result, mitigation measures are critical for preventing soil and water contamination. Solid waste should be converted to reusable items by solid waste adjustment and cementing for cost-effective management. The findings of this flow study can be used to supplement the next stage of research, which will investigate the feasibility of getting involved in the development of a waste management system as well as ensuring ideal environmental standards for municipal solid waste and balancing environmental quality.

Supplementary Materials

The following supporting information can be downloaded at: https://www.mdpi.com/article/10.3390/soilsystems6040090/s1, Table S1: Heavy metal(loid)s concentration in all samples; Figure S1: IWD of (a) Cr concentration in soil samples and (b) Pb concentration in plant samples.

Author Contributions

R.H.H.: Conceptualization, methodology, Investigation, Software, Writing—original draft preparation. M.A.B.S.: Methodology, Validation, Formal analysis, Investigation, Data curation, Writing—original draft preparation, Writing—reviewing and editing, Visualization. M.A.A.: Methodology, Resources, Writing—reviewing and editing, Supervision. M.A.A.S.: Resources, Writing—reviewing and editing. M.M.R.: Conceptualization, Investigation, Resources, Writing—reviewing and editing, Supervision. All authors have read and agreed to the published version of the manuscript.

Funding

This research received no external funding.

Institutional Review Board Statement

Not applicable.

Informed Consent Statement

Not applicable.

Data Availability Statement

All the data are included in this manuscript.

Conflicts of Interest

The authors declare no conflict of interest.

References

  1. Christensen, T.H.; Kjeldsen, P. Basic biochemical processes in landfills. In Sanitary Landfilling: Process, Technology and Environmental Impact; Christensen, T.C., Ed.; Academic Press: London, UK, 1989; p. 29. [Google Scholar]
  2. Kamal, A.K.I.; Islam, R.; Hassan, M.; Ahmed, F.; Rahman, M.A.T.M.T.; Moniruzzaman, M. Bioaccumulation of Trace Metals in Selected Plants within Amin Bazar Landfill Site, Dhaka, Bangladesh. Environ. Process. 2016, 3, 179–194. [Google Scholar] [CrossRef]
  3. Mukti, S.A. Solid Waste Management in Dhaka City: Problems and Prospects. Int. J. Innov. Res. Dev. 2015, 2, 33–37. [Google Scholar]
  4. DNCC. Waste Report; Dhaka North City Corporation: Dhaka, Bangladesh, 2020. [Google Scholar]
  5. Hoque, M.A.; Haque, M.A.; Mondal, M.S.A. Seasonal Effects on Heavy Metal Concentration in Decomposed Solid Waste of DNCC and DSCC Landfill Sites. Civ. Eng. Arch. 2014, 2, 52–56. [Google Scholar] [CrossRef]
  6. Kabir, M.R. Municipal solid waste management system: A study on Dhaka north and South City corporations. Bangladesh Inst. Plan 2015, 2075, 9363. [Google Scholar]
  7. Yousuf, T.B.; Rahman, M. Monitoring quantity and characteristics of municipal solid waste in Dhaka City. Environ. Monit. Assess 2007, 135, 3–11. [Google Scholar] [CrossRef] [PubMed]
  8. Azim, M.D.; Rahman, M.M.; Khan, R.H.; Kamal, A. Characteristics of Leachate Generated at Landfill Sites and Probable Risks of Surface and Groundwater Pollution in The Surrounding Areas: A Case Study of Matuail Landfill Site, Dhaka. J. Bangladesh Acad. Sci. 1970, 35, 153–160. [Google Scholar] [CrossRef] [Green Version]
  9. Gavrilescu, M.; Schiopu, A.-M.; Robu, B.M.; Apostol, I. Impact of landfill leachate on soil quality in Iasi county. Environ. Eng. Manag. J. 2009, 8, 1155–1164. [Google Scholar] [CrossRef]
  10. Negi, P.; Mor, S.; Ravindra, K. Impact of landfill leachate on the groundwater quality in three cities of North India and health risk assessment. Environ. Dev. Sustain. 2018, 22, 1455–1474. [Google Scholar] [CrossRef]
  11. Jahan, E.; Nessa, A.; Hossain, F.; Parveen, Z. Characteristics of municipal landfill leachate and its impact on surrounding agricultural land. Bangladesh J. Sci. Res. 2016, 29, 31–39. [Google Scholar] [CrossRef] [Green Version]
  12. El-Salam, M.M.A.; Abu-Zuid, G.I. Impact of landfill leachate on the groundwater quality: A case study in Egypt. J. Adv. Res. 2014, 6, 579–586. [Google Scholar] [CrossRef]
  13. Naveen, B.; Mahapatra, D.M.; Sitharam, T.; Sivapullaiah, P.; Ramachandra, T. Physico-chemical and biological characterization of urban municipal landfill leachate. Environ. Pollut. 2017, 220, 1–12. [Google Scholar] [CrossRef]
  14. Adhikari, B.; Khanal, S.N.; Manandhar, D.R. Study of leachate and waste composition at different landfill sites of Nepal. Kathmandu Univ. J. Sci. Eng. Technol. 2013, 9, 15–21. [Google Scholar]
  15. Chang, A.C.; Page, A.L. Trace elements slowly accumulating, depleting in soils. Calif. Agric. 2000, 54, 49–55. [Google Scholar] [CrossRef]
  16. Alam, H. Second Modern Sanitary Landfill at Amin Bazar Awaits Green Signal. The Daily Star. 2008. Available online: http://archive.thedailystar.net/newDesign/news-details.php?nid=52541 (accessed on 20 December 2021).
  17. Ahsan, A.; Satter, F.; Siddique, A.B.; Akbor, A.; Ahmed, S.; Shajahan, M.; Khan, R. Chemical and physicochemical characterization of effluents from the tanning and textile industries in Bangladesh with multivariate statistical approach. Environ. Monit. Assess. 2019, 191, 575. [Google Scholar] [CrossRef]
  18. Siddique, A.B.; Alam, K.; Islam, S.; Diganta, M.T.M.; Akbor, A.; Bithi, U.H.; Chowdhury, A.I.; Ullah, A.K.M.A. Apportionment of some chemical elements in soils around the coal mining area in northern Bangladesh and associated health risk assessment. Environ. Nanotechnol. Monit. Manag. 2020, 14, 100366. [Google Scholar] [CrossRef]
  19. Hasan, A.B.; Reza, A.H.M.S.; Kabir, S.; Siddique, A.B.; Ahsan, A.; Akbor, A. Accumulation and distribution of heavy metals in soil and food crops around the ship breaking area in southern Bangladesh and associated health risk assessment. SN Appl. Sci. 2020, 2, 155. [Google Scholar] [CrossRef] [Green Version]
  20. Nasrin, S.; Islam, M.N.; Abu Tayab, M.; Nasrin, M.S.; Siddique, A.B.; Bin Emran, T.; Reza, A.A. Chemical profiles and pharmacological insights of Anisomeles indica Kuntze: An experimental chemico-biological interaction. Biomed. Pharmacother. 2022, 149, 112842. [Google Scholar] [CrossRef]
  21. APHA (American Public Health Association). Standard Methods for the Examination of Water and Wastewater, 23rd ed.; Baird, R.B., Eaton, A.D., Rice, E.W., Eds.; American Public Health Association, American Water Works Association, Water Environment Federation: Washington, DC, USA, 2017; Available online: https://secure.apha.org/imis/ItemDetail?iProductCode=978-087553-2875&CATEGORY=BK (accessed on 20 December 2021).
  22. Childs, C. Interpolating surfaces in ArcGIS spatial analyst. ArcUser 2004, 3235, 32–35. [Google Scholar]
  23. Gao, B.; Gao, L.; Gao, J.; Xu, D.; Wang, Q.; Sun, K. Simultaneous evaluations of occurrence and probabilistic human health risk associated with trace elements in typical drinking water sources from major river basins in China. Sci. Total Environ. 2019, 666, 139–146. [Google Scholar] [CrossRef]
  24. Rahman, M.A.T.M.T.; Paul, M.; Bhoumik, N.; Hassan, M.; Alam, K.; Aktar, Z. Heavy metal pollution assessment in the groundwater of the Meghna Ghat industrial area, Bangladesh, by using water pollution indices approach. Appl. Water Sci. 2020, 10, 186. [Google Scholar] [CrossRef]
  25. Abrahim, G.M.S.; Parker, R.J. Assessment of heavy metal enrichment factors and the degree of contamination in marine sediments from Tamaki Estuary, Auckland, New Zealand. Environ. Monit. Assess. 2007, 136, 227–238. [Google Scholar] [CrossRef] [PubMed]
  26. Sharmin, S.; Mia, J.; Miah, M.S.; Zakir, H. Hydrogeochemistry and heavy metal contamination in groundwaters of Dhaka metropolitan city, Bangladesh: Assessment of human health impact. J. Hydro-Environ. Res. 2020, 3, 106–117. [Google Scholar] [CrossRef]
  27. Doza, B.; Islam, S.D.-U.; Rume, T.; Quraishi, S.B.; Rahman, M.S.; Bhuiyan, M.A.H. Groundwater quality and human health risk assessment for safe and sustainable water supply of Dhaka City dwellers in Bangladesh. Groundw. Sustain. Dev. 2020, 10, 100374. [Google Scholar] [CrossRef]
  28. Islam, A.R.M.T.; Islam, H.T.; Mia, U.; Khan, R.; Habib, A.; Doza, B.; Siddique, A.B.; Chu, R. Co-distribution, possible origins, status and potential health risk of trace elements in surface water sources from six major river basins, Bangladesh. Chemosphere 2020, 249, 126180. [Google Scholar] [CrossRef] [PubMed]
  29. Backman, B.; Bodiš, D.; Lahermo, P.; Rapant, S.; Tarvainen, T. Application of a groundwater contamination index in Finland and Slovakia. Environ. Geol. 1998, 36, 55–64. [Google Scholar] [CrossRef]
  30. Edet, A.E.; Offiong, O.E. Evaluation of water quality pollution indices for heavy metal contamination monitoring. A study case from Akpabuyo-Odukpani area, Lower Cross River Basin (Southeastern Nigeria). GeoJournal 2002, 57, 295–304. [Google Scholar] [CrossRef]
  31. Horton, R.K. An index system for rating water quality. J. Water Pollut. Control Ed. 1965, 37, 300–306. [Google Scholar]
  32. Mohan, S.V.; Nithila, P.; Reddy, S.J. Estimation of heavy metals in drinking water and development of heavy metal pollution index. J. Environ. Sci. Health Part A Environ. Sci. Eng. Toxicol. 1996, 31, 283–289. [Google Scholar] [CrossRef]
  33. Xiao, J.; Wang, L.; Deng, L.; Jin, Z. Characteristics, sources, water quality and health risk assessment of trace elements in river water and well water in the Chinese Loess Plateau. Sci. Total. Environ. 2018, 650, 2004–2012. [Google Scholar] [CrossRef]
  34. WHO (World Health Organization). Guidelines for Drinking Water Quality, Library Cataloguing-in-Publication Data, 4th ed.; NLM classification: WA 675; World Health Organization: Geneva, Switzerland, 2011. [Google Scholar]
  35. ECR (The Environment Conservation Rules); Government of the People’s Republic of Bangladesh, Ministry of Environment and Forest: Dhaka, Bangladesh, 1997.
  36. USEPA. US Environmental Protection Agency. Risk Assessment Guidance for Superfund Volume I: Human Health Evaluation Manual (part E, Supplemental Guidance for Dermal Risk Assessment) Final; EPA/540/R/99/005 OSWER 9285.702EP PB99-963312 July 2004; Office of Super fund Remediation and Technology Innovation: Washington, DC, USA, 2004. [Google Scholar]
  37. WHO (World Health Organization). Guidelines for Drinking Water Quality, Library Cataloguing in Publication Data, 3rd ed.; NLM classification: WA 675; World Health Organization: Geneva, Switzerland, 2004. [Google Scholar]
  38. World Health Organization. Guidelines for Drinking-Water Quality: Fourth Edition Incorporating the First Addendum; World Health Organization: Geneva, Switzerland, 2017; ISBN 9789241549950. [Google Scholar]
  39. Tchobanoglous, G.; Theisen, H.; Vigil, S.A. Integrated Solid Waste Management: Engineering Principles and Management Issues; McGraw-Hill: New York, NY, USA, 1993. [Google Scholar] [CrossRef]
  40. Kumar, D.; Alappat, B.J. Analysis of leachate pollution index and formulation of sub-leachate pollution indices. Waste Manag. Res. 2005, 23, 230–239. [Google Scholar] [CrossRef]
  41. Parvin, F.; Tareq, S.M. Impact of landfill leachate contamination on surface and groundwater of Bangladesh: A systematic review and possible public health risks assessment. Appl. Water Sci. 2021, 11, 100. [Google Scholar] [CrossRef]
  42. Alam, R.; Ahmed, Z.; Howladar, M.F. Evaluation of heavy metal contamination in water, soil and plant around the open landfill site Mogla Bazar in Sylhet, Bangladesh. Groundw. Sustain. Dev. 2019, 10, 100311. [Google Scholar] [CrossRef]
  43. Raviraja, A.; Babu, G.; Bijoor, A.; Menezes, G.; Venkatesh, T. Lead Toxicity in a Family as a Result of Occupational Exposure. Arch. Ind. Hyg. Toxicol. 2008, 59, 127–133. [Google Scholar] [CrossRef] [Green Version]
  44. Riess, M.L.; Halm, J.K. Lead poisoning in an adult: Lead mobilization by pregnancy? J. Gen. Intern. Med. 2007, 22, 1212–1215. [Google Scholar] [CrossRef]
  45. Prasad, S.; Yadav, K.K.; Kumar, S.; Gupta, N.; Cabral-Pinto, M.M.; Rezania, S.; Radwan, N.; Alam, J. Chromium contamination and effect on environmental health and its remediation: A sustainable approaches. J. Environ. Manag. 2021, 285, 112174. [Google Scholar] [CrossRef]
  46. Wakeel, A.; Xu, M. Chromium Morpho-Phytotoxicity. Plants 2020, 9, 564. [Google Scholar] [CrossRef]
  47. Hussein, M.; Yoneda, K.; Mohd-Zaki, Z.; Amir, A.; Othman, N. Heavy Metals in Leachate, Impacted Soils and Natural Soils of Different Landfills in Malaysia: An Alarming Threat. Chemosphere 2020, 128874. [Google Scholar] [CrossRef] [PubMed]
  48. Battistel, M.; Stolze, L.; Muniruzzaman, M.; Rolle, M. Arsenic release and transport during oxidative dissolution of spatially-distributed sulfide minerals. J. Hazard. Mater. 2020, 409, 124651. [Google Scholar] [CrossRef]
  49. Tandel, B.N.; Macwan, J.E.M.; Soni, C.K. Assessment of water quality index of small lake in south Gujarath region, India. In Proceedings of the ISEM-2011, Bangkok, Thailand, 23–24 December 2011. [Google Scholar]
  50. Siddique, A.B.; Islam, A.R.M.T.; Hossain, S.; Khan, R.; Akbor, A.; Hasanuzzaman; Sajid, W.M.; Mia, Y.; Mallick, J.; Rahman, M.S.; et al. Multivariate statistics and entropy theory for irrigation water quality and entropy-weighted index development in a subtropical urban river, Bangladesh. Environ. Sci. Pollut. Res. 2021, 29, 8577–8596. [Google Scholar] [CrossRef]
Figure 1. Satellite map of the study area.
Soilsystems 06 00090 g001
Figure 2. Sampling locations of the study area.
Soilsystems 06 00090 g002
Figure 3. Heavy metal(loid)s concentration in (a) leachate, (b) surface water, (c) groundwater, (d) soil, and (e) plant sample.
Soilsystems 06 00090 g003aSoilsystems 06 00090 g003b
Figure 4. Principal component analysis of the analyzed heavy metal concentration by (a) scree plot and (b) component plot.
Soilsystems 06 00090 g004aSoilsystems 06 00090 g004b
Figure 5. IDW of (a) Cd and Ni concentration in surface water and (b) Ni and As concentration in groundwater.
Soilsystems 06 00090 g005
Figure 6. IWD of (a) Pb and Cd concentration in soil samples and (b) Ni and Cd concentration in plant samples.
Soilsystems 06 00090 g006
Table 1. Details of collected samples.
SampleSample TypeLocationDetails of Sample
LatitudeLongitude
01Untreated leachate 23°47′51.842″90°17′52.571″Collected from the leachate pond.
02Treated leachate23°47′51.842″90°17′52.576″Collected from the leachate pond.
03-01Surface water23°47′39.361″90°17′47.176″Collected from the open lake exposed to the landfill at a depth of 50 cm.
03-02Surface water23°47′34.842″90°18′01.633″Collected from a pond at a depth of 50 cm.
03-03Surface water23°47′33.541″90°18′13.691″Collected from a pond at a depth of 50 cm.
04-01Groundwater23°47′39.947″90°17′44.797″At a depth of 70 ft (21.3 m).
04-02Groundwater23°47′33.844″90°18′07.443″At a depth of 280 ft (85.3 m).
04-03Groundwater23°47′42.151″90°18′15.884″At a depth of 400 ft (121.9 m).
05-01Soil23°47′39.947″90°17′44.797″Collected from 10 cm beneath the surface.
05-02Soil23°47′33.547″90°18′13.691″Collected from 10 cm beneath the surface.
05-03Soil23°47′42.153″90°18′15.882″Collected from 10 cm beneath the surface.
06-01Plant23°47′39.947″90°17′44.797″
  • Artocarpus heterophyllus (Jackfruit), collected raw leaves from the plant.
  • Carica papaya (Papaya plant), collected raw leaves from the plant.
  • Musa acuminate (Banana plant), collected raw leaves from the plant.
06-02Plant23°47′34.845″90°18′01.631″
  • Ipomoea aquatica (Water spinach) collected raw leaves from the plants.
  • Ocimum tenuiflorum (Tulsi) collected raw leaves from the plants.
06-03Plant23°47′33.545″90°18′13.694″
  • Ocimum tenuiflorum (Tulsi) collected raw leaves from the plants.
Table 2. Several standard values used to calculate different indices of water.
MAC
(µg/L)
CNi
(µg/L)
Ii
(µg/L)
Si
(µg/L)
Wi
(µg/L)
References
Pb101.510500.02[33,34]
Cd33350.20[34,35]
Cr5050501000.01[34,36]
Co10001000501000.01[34,36]
Ni702020700.01[33,37,38]
As101010500.02[33,35]
Note. Maximum admissible concentration (MAC), Upper permissible concentration (CNi), Ideal concentration value for the ith parameter (Ii), Standard concentration value for the ith parameter (Si), and Unit weight (Wi).
Table 3. Physicochemical parameters of leachate and water samples.
Sample IDSample TypepHDO
(mg/L)
Turbidity
(FNU)
Salinity
(mg/L)
TDS
(mg/L)
EC
(µS/cm)
Temperature
(°C)
TH
(mg/L)
01Leachate7.851.476.5810.4584711,69433.872805.6
02Leachate7.851.263.1919.92980596032.381132.3
Mean7.851.364.8815.24413.5882733.121968.9
SD0.000.152.406.722027.34054.61.05836.7
03-01SW7.8515.50.3719.738577031.38501
03-02SW7.053.507.300.2223145827.63498
03-03SW7.114.203.400.1718237027.62492
Mean7.337.733.696.70266532.728.87497
SD0.445.493.4711.3105.9210.22.163.74
04-01GW7.3815.30.141.0114929730.85330
04-02GW7.304.500.400.1617134227.74288
04-03GW7.084.602.100.3132665327.82316
Mean7.258.130.880.49215.3430.728.80311.5
SD0.155.061.060.4596.47193.91.7717.6
ECR, 1997 [28]6.5–8.5610-100035020–30-
WHO, 2017 [30]6.5–8.04–65-500250--
Note. SD = Standard Deviation.
Table 4. Pearson’s correlation matrix among the physicochemical parameters of leachate, surface water, and groundwater.
ParameterspHDOTurbiditySalinityTDSECTemperatureTH
pH1
DO0.1251
Turbidity−0.069−0.6671
Salinity0.9060.107−0.0581
TDS0.672−0.4790.5200.4731
EC0.672−0.4790.5200.47311
Temperature0.9220.0890.1000.7530.7970.7971
TH0.613−0.4370.5830.3930.9800.9800.7561
Note. Bold values refer to significant correlation.
Table 5. Pearson’s correlation among the heavy metal(loid)s.
ParametersPbCdCrCoNiAs
Pb1
Cd0.5331
Cr0.8580.1461
Co0.8310.1880.8231
Ni0.8610.1800.8540.9951
As0.8300.1780.8220.9780.9831
Note. Bold values refer to significant correlation.
Table 6. Water quality index (WQI) and pollution indices including degree of contamination (CD), heavy metals evaluation index (HEI), and heavy metal pollution index (HPI) for leachate, surface water (SW), and groundwater (GW).
Sample IDSample TypesWQICDHEIHPI
01Leachate untreated50.013.3179.31716.445
02Leachate treated28.414.66310.663−5.159
Mean39.213.9909.9905.643
03-01SW43.63−2.0613.93810.059
03-02SW25.330.1626.162−8.232
03-03SW17.82−4.0751.924−15.750
Mean23.56−2.2043.795−10.002
04-01GW29.15−2.9663.033−4.421
04-02GW31.41−3.8782.121−2.158
04-03GW33.25−3.9802.019−0.312
Mean21.89−4.0081.991−11.677
Publisher’s Note: MDPI stays neutral with regard to jurisdictional claims in published maps and institutional affiliations.

