Article

Deep Drainage Lowers Methane and Nitrous Oxide Emissions from Rice Fields in a Semi-Arid Environment in Rwanda

by
Olive Tuyishime
1,2,*,
Monika Strömgren
2,
Abraham Joel
2,
Ingmar Messing
2,
Francois Xavier Naramabuye
1 and
Ingrid Wesström
2
1
College of Agriculture, Animal Sciences and Veterinary Medicine, University of Rwanda, Musanze P.O. Box 210, Rwanda
2
Department of Soil and Environment, Swedish University of Agricultural Sciences, P.O. Box 7014, SE-75007 Uppsala, Sweden
*
Author to whom correspondence should be addressed.
Soil Syst. 2022, 6(4), 84; https://doi.org/10.3390/soilsystems6040084
Submission received: 12 September 2022 / Revised: 28 October 2022 / Accepted: 11 November 2022 / Published: 15 November 2022

Abstract

:
Few studies have explored greenhouse gas (GHG) emissions from arable land in sub-Saharan Africa (SSA), and particularly from rice paddy fields, which can be a major source of methane (CH4) and nitrous oxide (N2O) emissions. This study examined the effect of drainage on CH4 and N2O emissions from rice fields in Rwanda under shallow drainage to 0.6 m, with the drain weir open four times per week, and deep drainage to 1.2 m with the weir open four times or two times per week. CH4 and N2O fluxes from the soil surface were measured on nine occasions during rice flowering and ripening, using a closed chamber method. Measured fluxes made only a minor contribution to total GHG emissions from rice fields. However, drainage depth had significant effects on CH4 emissions, with shallow drainage treatment giving significantly higher emissions (~0.8 kg ha−1 or ~26 kg CO2-equivalents ha−1) than deep drainage (0.0 kg) over the 44-day measurement period. No treatment effect was observed for N2O fluxes, which ranged from low uptake to low release, and were generally not significantly different from zero, probably due to low nitrogen (N) availability in soil resulting from low N fertilization rate (in the region). Overall, the results suggest that deep drainage can mitigate CH4 emissions compared with traditional shallow drainage, while not simultaneously increasing N2O emissions.

1. Introduction

Around 20–25% of total greenhouse gas (GHG) emissions from all human activities derive from food production and related land use change [1]. Methane (CH4) and nitrous oxide (N2O) are two of the most important GHGs emitted from agriculture, with global warming potential (GWP) of 34 and 298 CO2-equivalents, respectively, in a 100-year time horizon [2]. Rice fields are responsible for approximately 11% of global anthropogenic CH4 emissions, and rice has the highest GHG emissions of all staple food crops [3,4]. Nutrient management, tillage practices and water management are the main factors influencing rice yield and GHG emissions. Increases and decreases in CH4 and N2O emissions have been reported with increasing rice yield [5,6,7]. Studies have shown that climate change benefits in terms of reducing CH4 emissions can be offset if there is an associated increase in emissions of N2O, because N2O has higher GWP than CH4 [8].
Methane is produced in anaerobic environments by obligate anaerobic microorganisms, through CO2 reduction or transmethylation [9], while N2O is produced via nitrification under aerobic conditions and through denitrification under anaerobic conditions [10,11]. The microbial processes by which these gases are produced are influenced by soil moisture content and water management [12,13]. Reviews have shown that there may be some consumption of N2O (i.e., flux from atmosphere to soil), usually in association with low mineral nitrogen (N) content and high moisture content in the soil [14,15]. Field drainage is one way to reduce CH4 emissions from fields [16], but N2O production is enhanced by aeration of paddy field soil through drainage [17]. Therefore, when using drainage as a GHG mitigation strategy, it is necessary to find a compromise between CH4 and N2O emissions [17]. Decisions on drainage depth should aim to maximize rice yield while mitigating GHG emissions [18], but there are contradictory findings on the effect of deep drainage on GHG production and rice yield. Some studies have observed no effect of deep drainage in reducing GHG emissions or increasing rice yield compared with shallow drainage [19], while others have found that deep drainage can enhance rice grain yield in a semi-arid environment [20].
Controlled drainage, i.e., regulating groundwater levels and reducing the percolation rate, could be a feasible option to reduce GHG emissions from rice fields [21,22]. Fluctuations in groundwater level affect the oxygen content in paddy soil, vertical migration of chemicals, and microbial activity [23,24]. However, controlled drainage has been found to have inconsistent effects on GHG emissions, including possibly N2O release through denitrification due to periods with higher soil water content [25].
Emissions of CH4 and N2O are affected by fertilizer and crop residue management, and by variations in soil pH and soil salinity. The effect of fertilizer on N2O emissions depends on the dose [26,27]. High rates of N fertilizer increase emissions by stimulating CH4 production from rice fields, increasing rice plant growth and thereby the carbon supply for methanogenic bacteria [28,29]. Addition of crop residues, such rice straw to paddy soils, increases CH4 emissions [30,31], with the magnitude of increase depending on straw application rate and timing and weather conditions [31,32]. Methanogenic bacteria are very sensitive to variations in soil pH, with the highest CH4 production rates at neutral pH and with small changes in soil pH sharply lowering CH4 production [33]. High soil salt content decreases CH4 emissions, through suppressing the activities of soil microbes, including methanogens [34,35]. The reported effects of soil salinity on N2O emission are inconsistent (increase, decrease or no response) [36,37]. Overall, the available data suggest that soil salinity-induced GHG emissions can influence global GHG dynamics, but GHG emission responses to soil salinity have not been fully identified [34].
Agricultural production intensity and associated agricultural GHG emissions are relatively low in sub-Saharan Africa (SSA) compared with other parts of the world [38]. However, GHG emissions released in SSA play an important role in the global GHG budget [39,40,41]. Further, food production in SSA will need to increase in the coming decades to match the strongly growing demand for food, and therefore GHG emissions from agriculture can be expected to increase in the region [42]. However, there is great uncertainty regarding the GHG emissions originating from agriculture, forestry, and land use change in Africa, and therefore GHG flux measurements need to be performed throughout Africa [43].
Very few studies have explored GHG emissions from arable land in SSA and particularly from rice production systems. Previously reported contributions of rice fields in SSA to global CH4 and N2O emissions are mainly estimates based on very few measurements, and there is a risk of this very important source of GHG emissions being overlooked [44].
Rice is grown on around 36,000 ha in Rwanda (2017 data) [45]. Assuming an emission factor of 70 kg CH4 ha−1, total emissions of CH4 from Rwandan rice production are around 22 × 105 kg, or 464 × 105 kg CO2-equivalents [45]. In order to identify mitigation measures and other climate-smart interventions for Rwanda and for the SSA region in general, it is important to quantify baseline GHG emissions and assess the impacts of different management strategies on these emissions [46].
This study examined the effect of varying drainage depth and frequency on soil-surface fluxes of CH4 and N2O in paddy rice cultivation in a marshland area in Rwanda. The hypothesis tested was that groundwater lowering through deeper drainage and more frequent opening of drain weirs reduces CH4 emissions, but increases N2O emissions, compared with deeper drainage and less frequently opened drain weirs or conventional shallow drainage.

2. Materials and Methods

2.1. Study Site

The study was performed at an experimental site in a rice production marshland in north-eastern Rwanda (1°17′33.0′′ S 30°18′48.2′′ E, 1513 m above sea level). The region has a semi-arid climate, with mean annual temperature of 20 °C and mean annual rainfall of 827 mm (Nyagatare station, 1984–2013). Annual potential evapotranspiration exceeds 1400 mm [47,48]. Rainfall is distributed over two rainy seasons (mid-February to May, September to mid-December), with precipitation peaks in April and November.
According to the FAO soil classification system [49], the soil at the study site is a former Vertisol changed to a Vertic-Fluvic-Gleysol due to the continuous deposition of alluvial and colluvial materials and waterlogged conditions. Analysis of samples collected from 0–80 cm depth showed that the soil at the site has a high pH (7.1–7.6), medium total N content (0.26–0.28%), and medium soil organic matter content (7.7–9.0%), with C/N ratio ranging between 16 and 19. The soil texture is sandy loam to sandy clay loam, with dry bulk density of 1.31–1.43 g cm−3 [20]. Based on the FAO system [50], the soil is moderately saline.

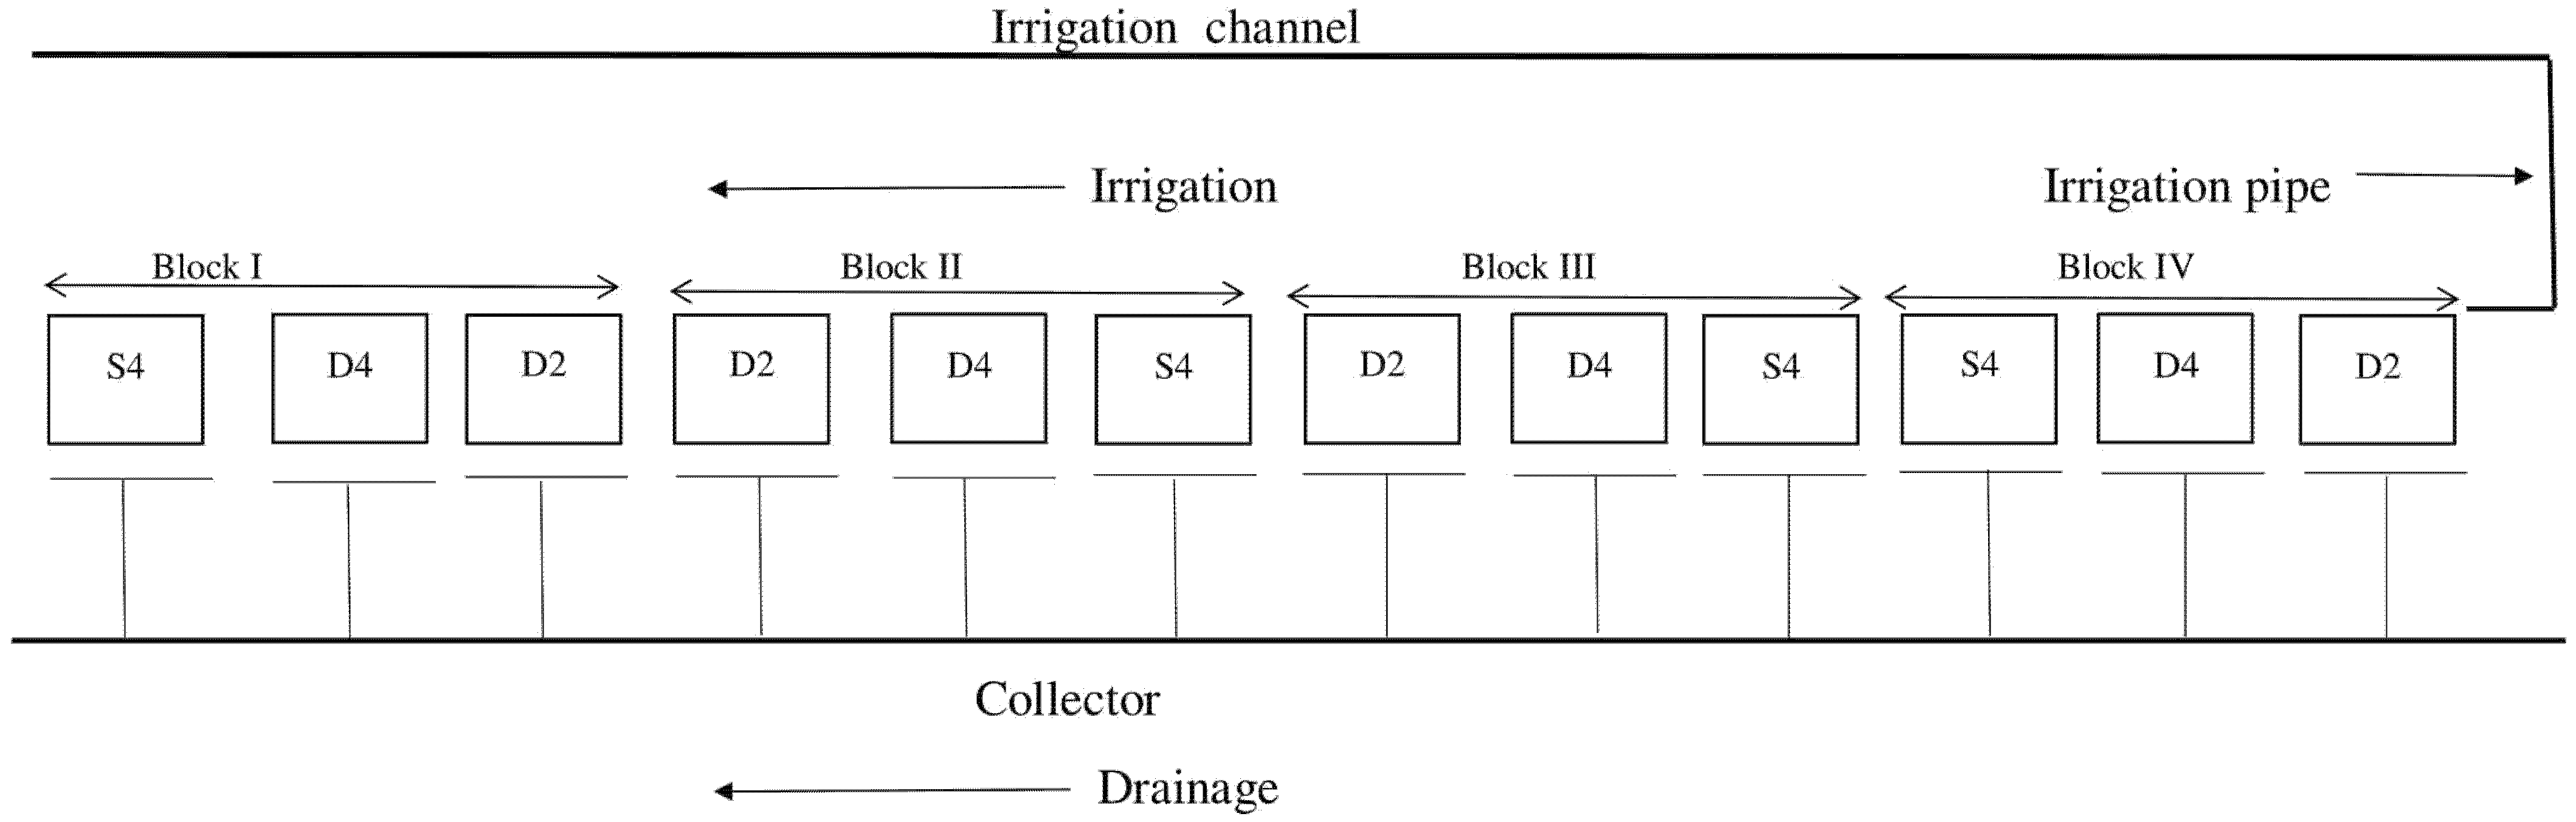
2.2. Experimental Design

The field experiment comprised four blocks of three treatments (plots) arranged in a randomized complete block design (Figure 1). The area of individual plots was 8 m × 8 m, and a 4 m wide zone separated adjacent plots and blocks. The treatments were: shallow drainage to 0.6 m depth, with drain weir open four times per week (S4) and deep drainage to 1.2 m depth with drain weir open four times per week (D4) or two times per week (D2). The shallow drainage depth corresponds to the traditional drainage system in the area, while the deep drainage treatments correspond to conventional (D4) and controlled drainage (D2). During the experiment, the drain weirs were opened for one hour for outflow measurements and then kept closed until the next scheduled opening time.

2.3. Experimental Procedure

Rice (Oryza sativa) seedlings were transferred from the nursery to the experimental plots after three weeks, and planted with 0.2 m spacing between rows and 0.2 m between plants within rows. Fertilizer was applied according to the Rwandan fertilization regime for irrigated rice [51], with a total of 80 kg N ha−1 applied (Table 1). Pests were controlled according to recommendations [52] and weeds were controlled manually by hoeing.

2.4. Irrigation and Drainage Management

Water from a nearby river (the Muvumba) was used for irrigation. The irrigation system consisted of a main pipeline, that conducted water from an existing irrigation channel to a surface drainage system with open ditches in the experimental area. Laterals connected to the main pipeline supplied water to each plot. The actual amount of irrigation water applied was recorded using water meters. Irrigation was scheduled so that the plots were irrigated three times per week until a standing water layer developed on the soil surface. The system consisted of a sub-drain for each experimental plot, an outlet, and a main collector channel. Weirs made of wood were installed in the sub-drains to regulate drainage depth. During the rice cropping season, the weirs were open or closed depending on drainage treatment. Vertically positioned polythene black plastic sheeting (0.5 mm thick) was installed to 1 m depth on three sides of the plots, to prevent lateral water movement from one plot to another and to the surroundings. The fourth side of each plot was open to the collector channel via the plot ditch. There were generally, no irrigation events on the days of GHG sampling days.

2.5. Fluxes of CH4 and N2O from Soil

Fluxes of CH4 and N2O from the soil surface were measured by the closed chamber method at one point in the center of each plot on nine occasions from 24 May to 8 July 2018 (rice flowering to ripening). For these flux measurements, a collar (diameter 18.7 cm) was installed to 2 cm depth before rice transplanting, and two seedlings were planted inside the collar. The collars were left permanently at the same spot during the whole measurement period. Wooden walk boards were installed in each plot to prevent disturbance by trampling.
During each GHG flux measurement, a dark PVC chamber (diameter 18.7 cm, height 16 cm) was fitted on the pre-installed collar, which was equipped with a rubber gasket to keep the joint airtight. The height of the chamber varied from 24 to 67 cm, depending on crop height, i.e., chambers of lower height were used at the start of the study. One chamber was deployed in each rice plot and six plots (i.e., two blocks) were measured at the same time. After closing the chamber, the air between chamber and vial was circulated for 60 s using a pump with capacity ~0.5 L min−1 and then an air sample was collected in a 22 mL glass vial. Three more samples were taken in the same manner, with one measurement every 24 min. The CH4 and N2O concentrations in the air samples were analyzed using a gas chromatograph (Clarus 500, PerkinElmer Inc., Shelton, CT, USA), equipped with an automatic head-space injector (TurboMatrix 110, PerkinElmer Inc., USA), a flame ion detector (FID) for CH4 analysis, and an electron capture device (ECD) for N2O analysis. Linear regression was used to estimate the CH4 and N2O fluxes [53], based on linear slope of concentration against time using all gas samples analyzed (except a few with obvious errors linked to leaking vials). The flux values were corrected for air pressure, air temperature, and chamber volume.
Measurement of fluxes in all plots was performed within a 160 min session from morning to midday (generally 10:00 to 12:40), to minimize possible effects of diurnal variation in fluxes. The diurnal pattern of GHG fluxes was assessed during one day (30 June 2018) in which measurements were performed at 6, 9, 12, and 15 h.
Previous tests of the chambers against a known flux have revealed that the flux is slightly overestimated (7%) when calculated by linear fit [54]. To eliminate the effects of disturbance from ebullition caused by chamber deployment, measurements with initial concentration above 2.4 ppm CH4 or 0.5 ppm N2O were discarded. To eliminate effects of other disturbances caused by, e.g., leaky vials, measurements were also discarded if the standard deviation of the residual between the concentration estimated from the linear relationship and the measured concentration exceeded 0.2 ppm CH4 or 0.1 ppm N2O. In total, 10 and two measurements of CH4 and N2O, respectively, out of a total of 144 measurements, were discarded.

2.6. Groundwater Level and Temperature Measurements

Groundwater level and soil temperature (10 cm depth) were measured on all GHG measurement occasions. The groundwater level was monitored before each GHG measurement in a 60 cm deep pipe permanently installed in the center of each plot. Measurements of soil temperature at 10 cm depth were performed with a portable EC probe (Testrs® 11 series).

2.7. Data Analysis

The distribution of the data was checked for normality and homoscedasticity. One extremely high flux value out of 134 values for CH4 and two extremely high values out of 142 values for N2O failed to meet the requirements, and were excluded from the statistical analysis. Effects of drainage treatment on CH4 and N2O fluxes over the whole period were tested by mixed model analysis of variance (ANOVA) in SAS Statistical software (v9.4, SAS Institute, Cary, NC, USA), with drainage treatment as a fixed effect in the model. Since the measurements were made in the same plots on every occasion, they could not be assumed to be independent of time, so “measurement date” was used as a repeated measure. If treatment was found to be significant in ANOVA, pair-wise comparisons were used to identify significant (p ≤ 0.05) differences between treatments. Testing for the presence of a diurnal pattern of CH4 and N2O fluxes was performed using a mixed model in which treatment and time of day were used as fixed effects.
The total flux of CH4 and N2O over the study period was estimated for each treatment using the mean flux from the measurement occasion closest in time. Hence, for measurements on day 0 and day 10, the mean of day 0 was used for the first five days and the mean of day 10 for the next five days. Total flux was transformed into CO2-equivalents using a GWP factor of 34 for CH4 and 298 for N2O [2].

3. Results

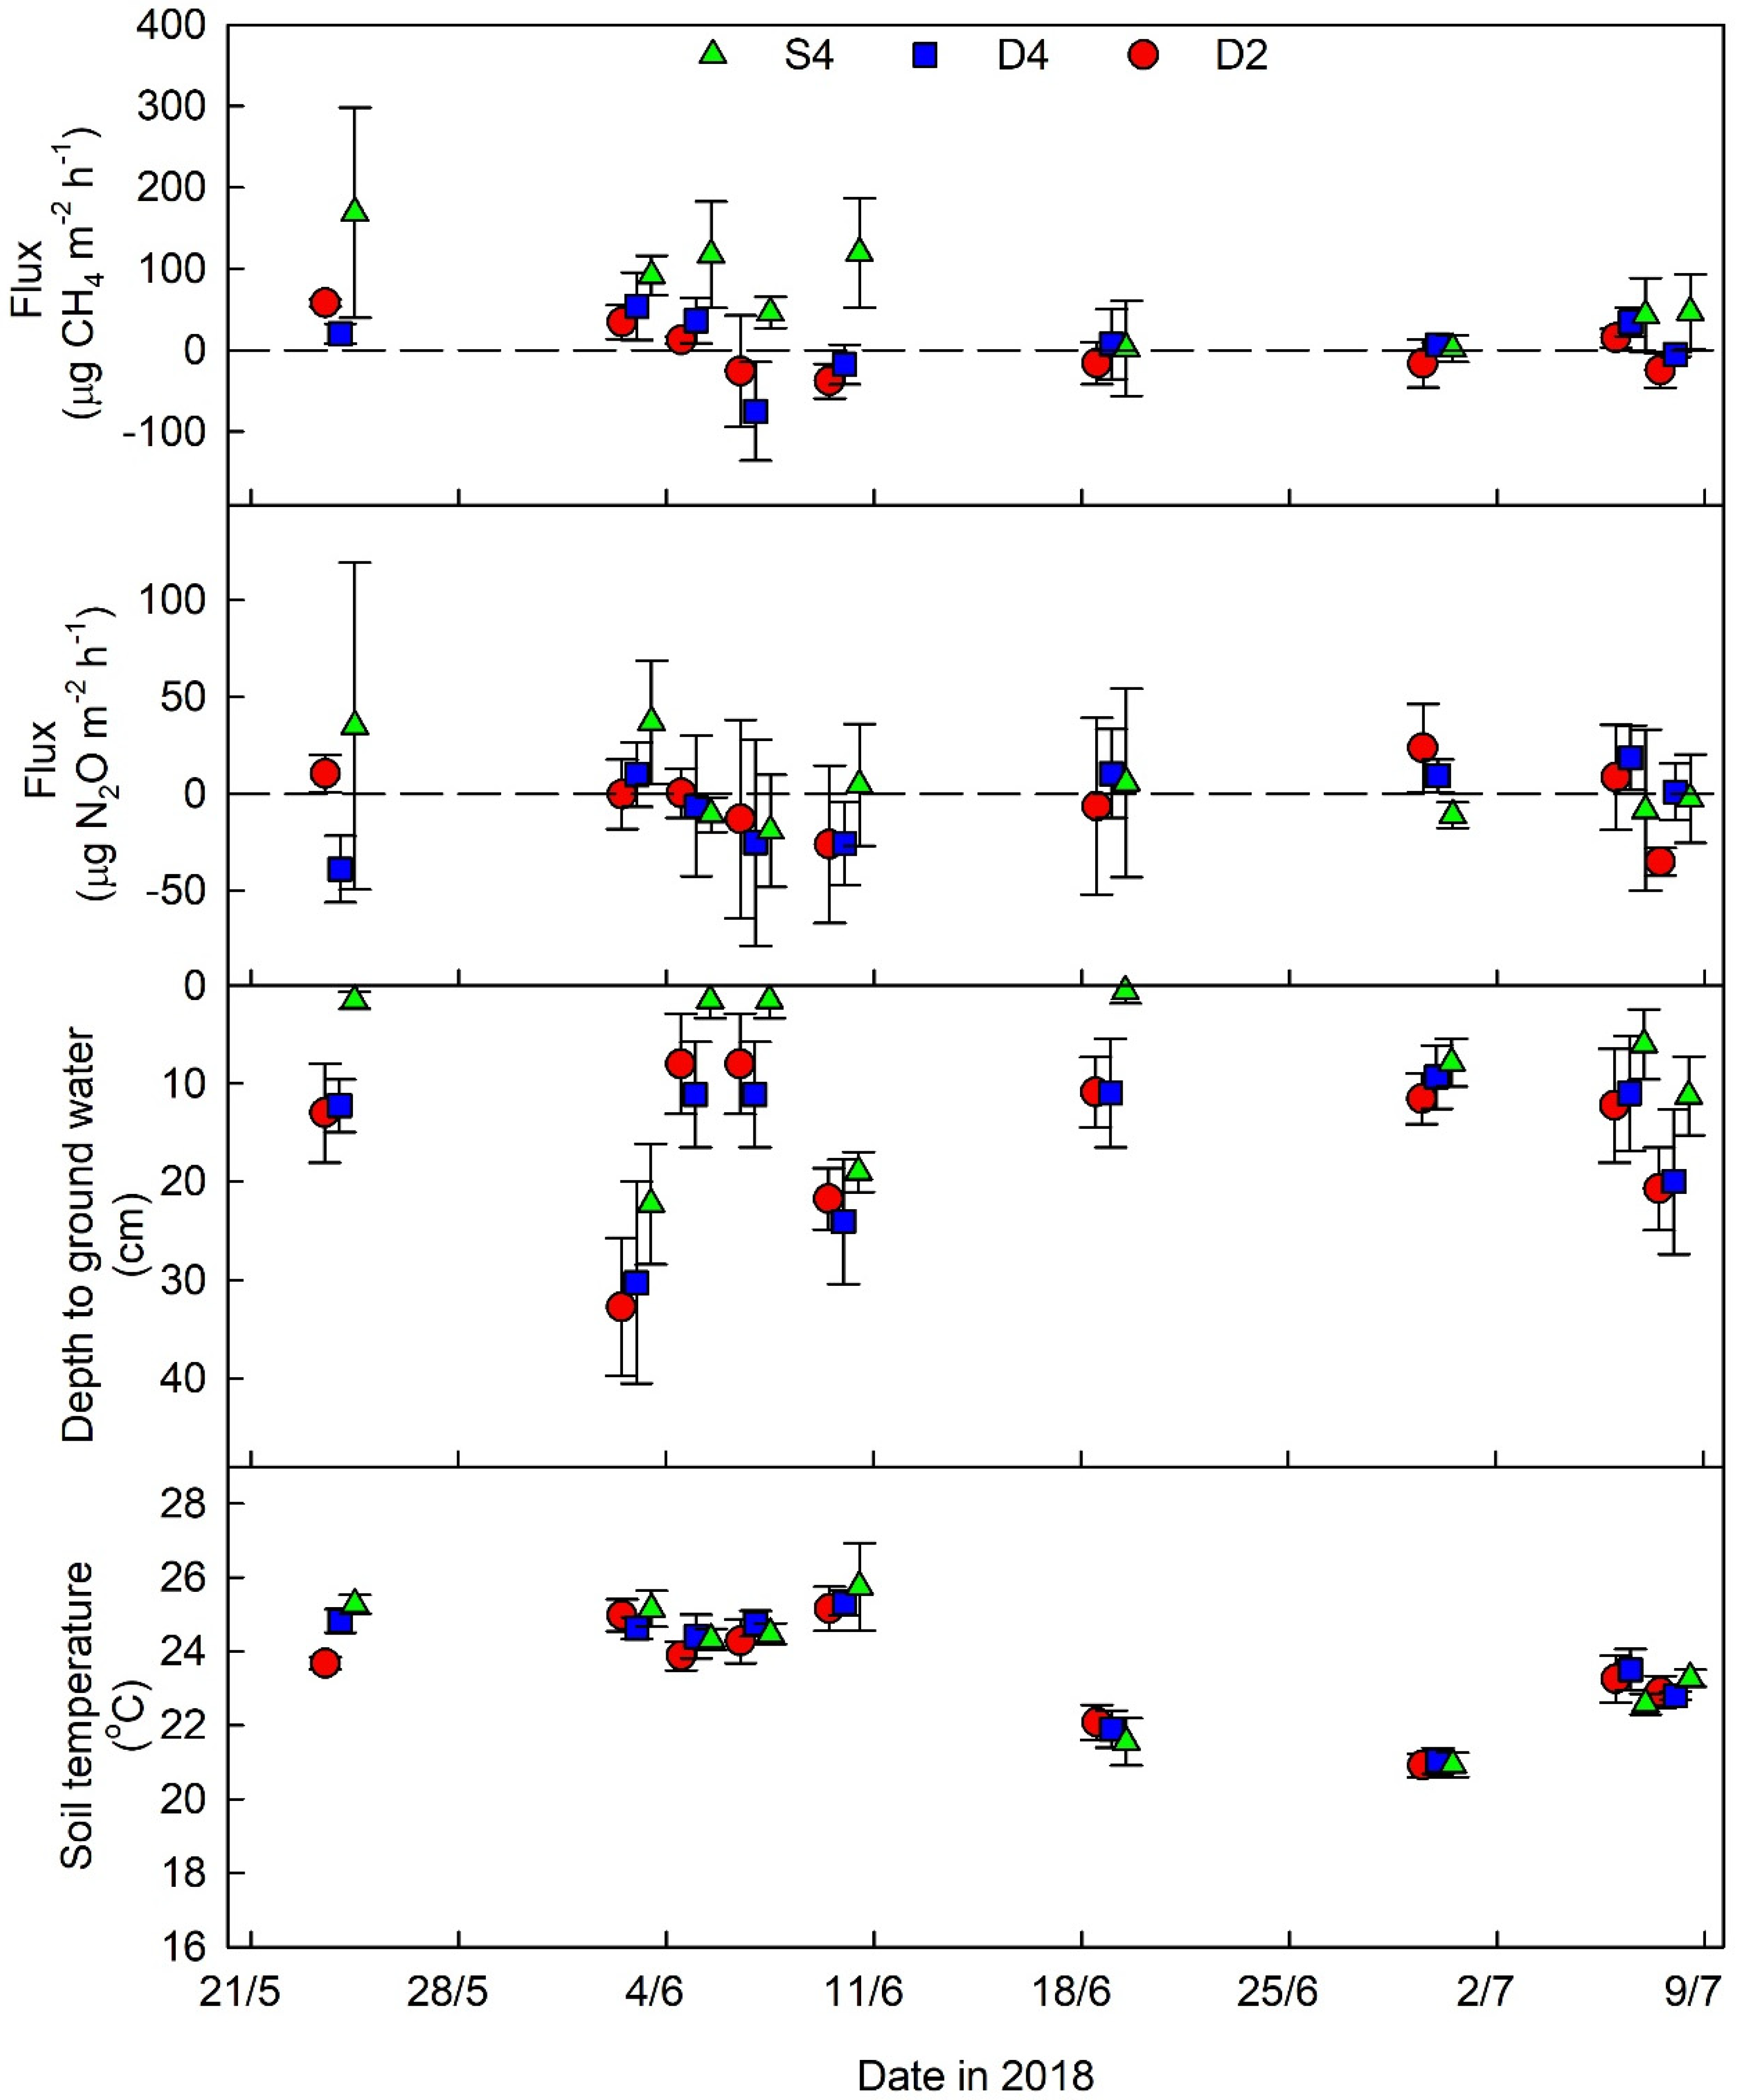
3.1. Treatment Effects on Groundwater Level

Groundwater depth in the treatment plots varied from 0 to around 35 cm during the study period (Figure 2). The ANOVA results showed that drainage treatment was a significant fixed effect (p = 0.03) for ground water level (Table 2). Significantly higher groundwater level was observed with shallow drainage than deep drainage, but there was no difference between the two deep drainage treatments. In shallow drainage plots, the groundwater was close to the soil surface on several measurement occasions.

3.2. Soil Temperature

Mean soil temperature at 10 cm depth did not vary greatly between treatments or between GHG measurement occasions (Figure 2). The measured values ranged between 20.9 °C (30 June 2018) and 25.8 °C (10 June 2018). Soil temperature was slightly higher in the first part of the season (May to mid-June) than in the second part (mid-June to mid-July).

3.3. Treatment Effects on CH4 and N2O Fluxes

Mean CH4 flux varied from uptake of around 80 µg m−2 h−1 to release of around 170 µg m−2 h−1, depending on treatment and occasion (Figure 2). Significant treatment effects on CH4 flux were observed (Table 2), with shallow drainage giving significantly higher CH4 emissions (p = 0.03) than both deep drainage treatments. The N2O flux was generally low, with small uptake or release, for all days and treatments and there was no significant treatment effect.

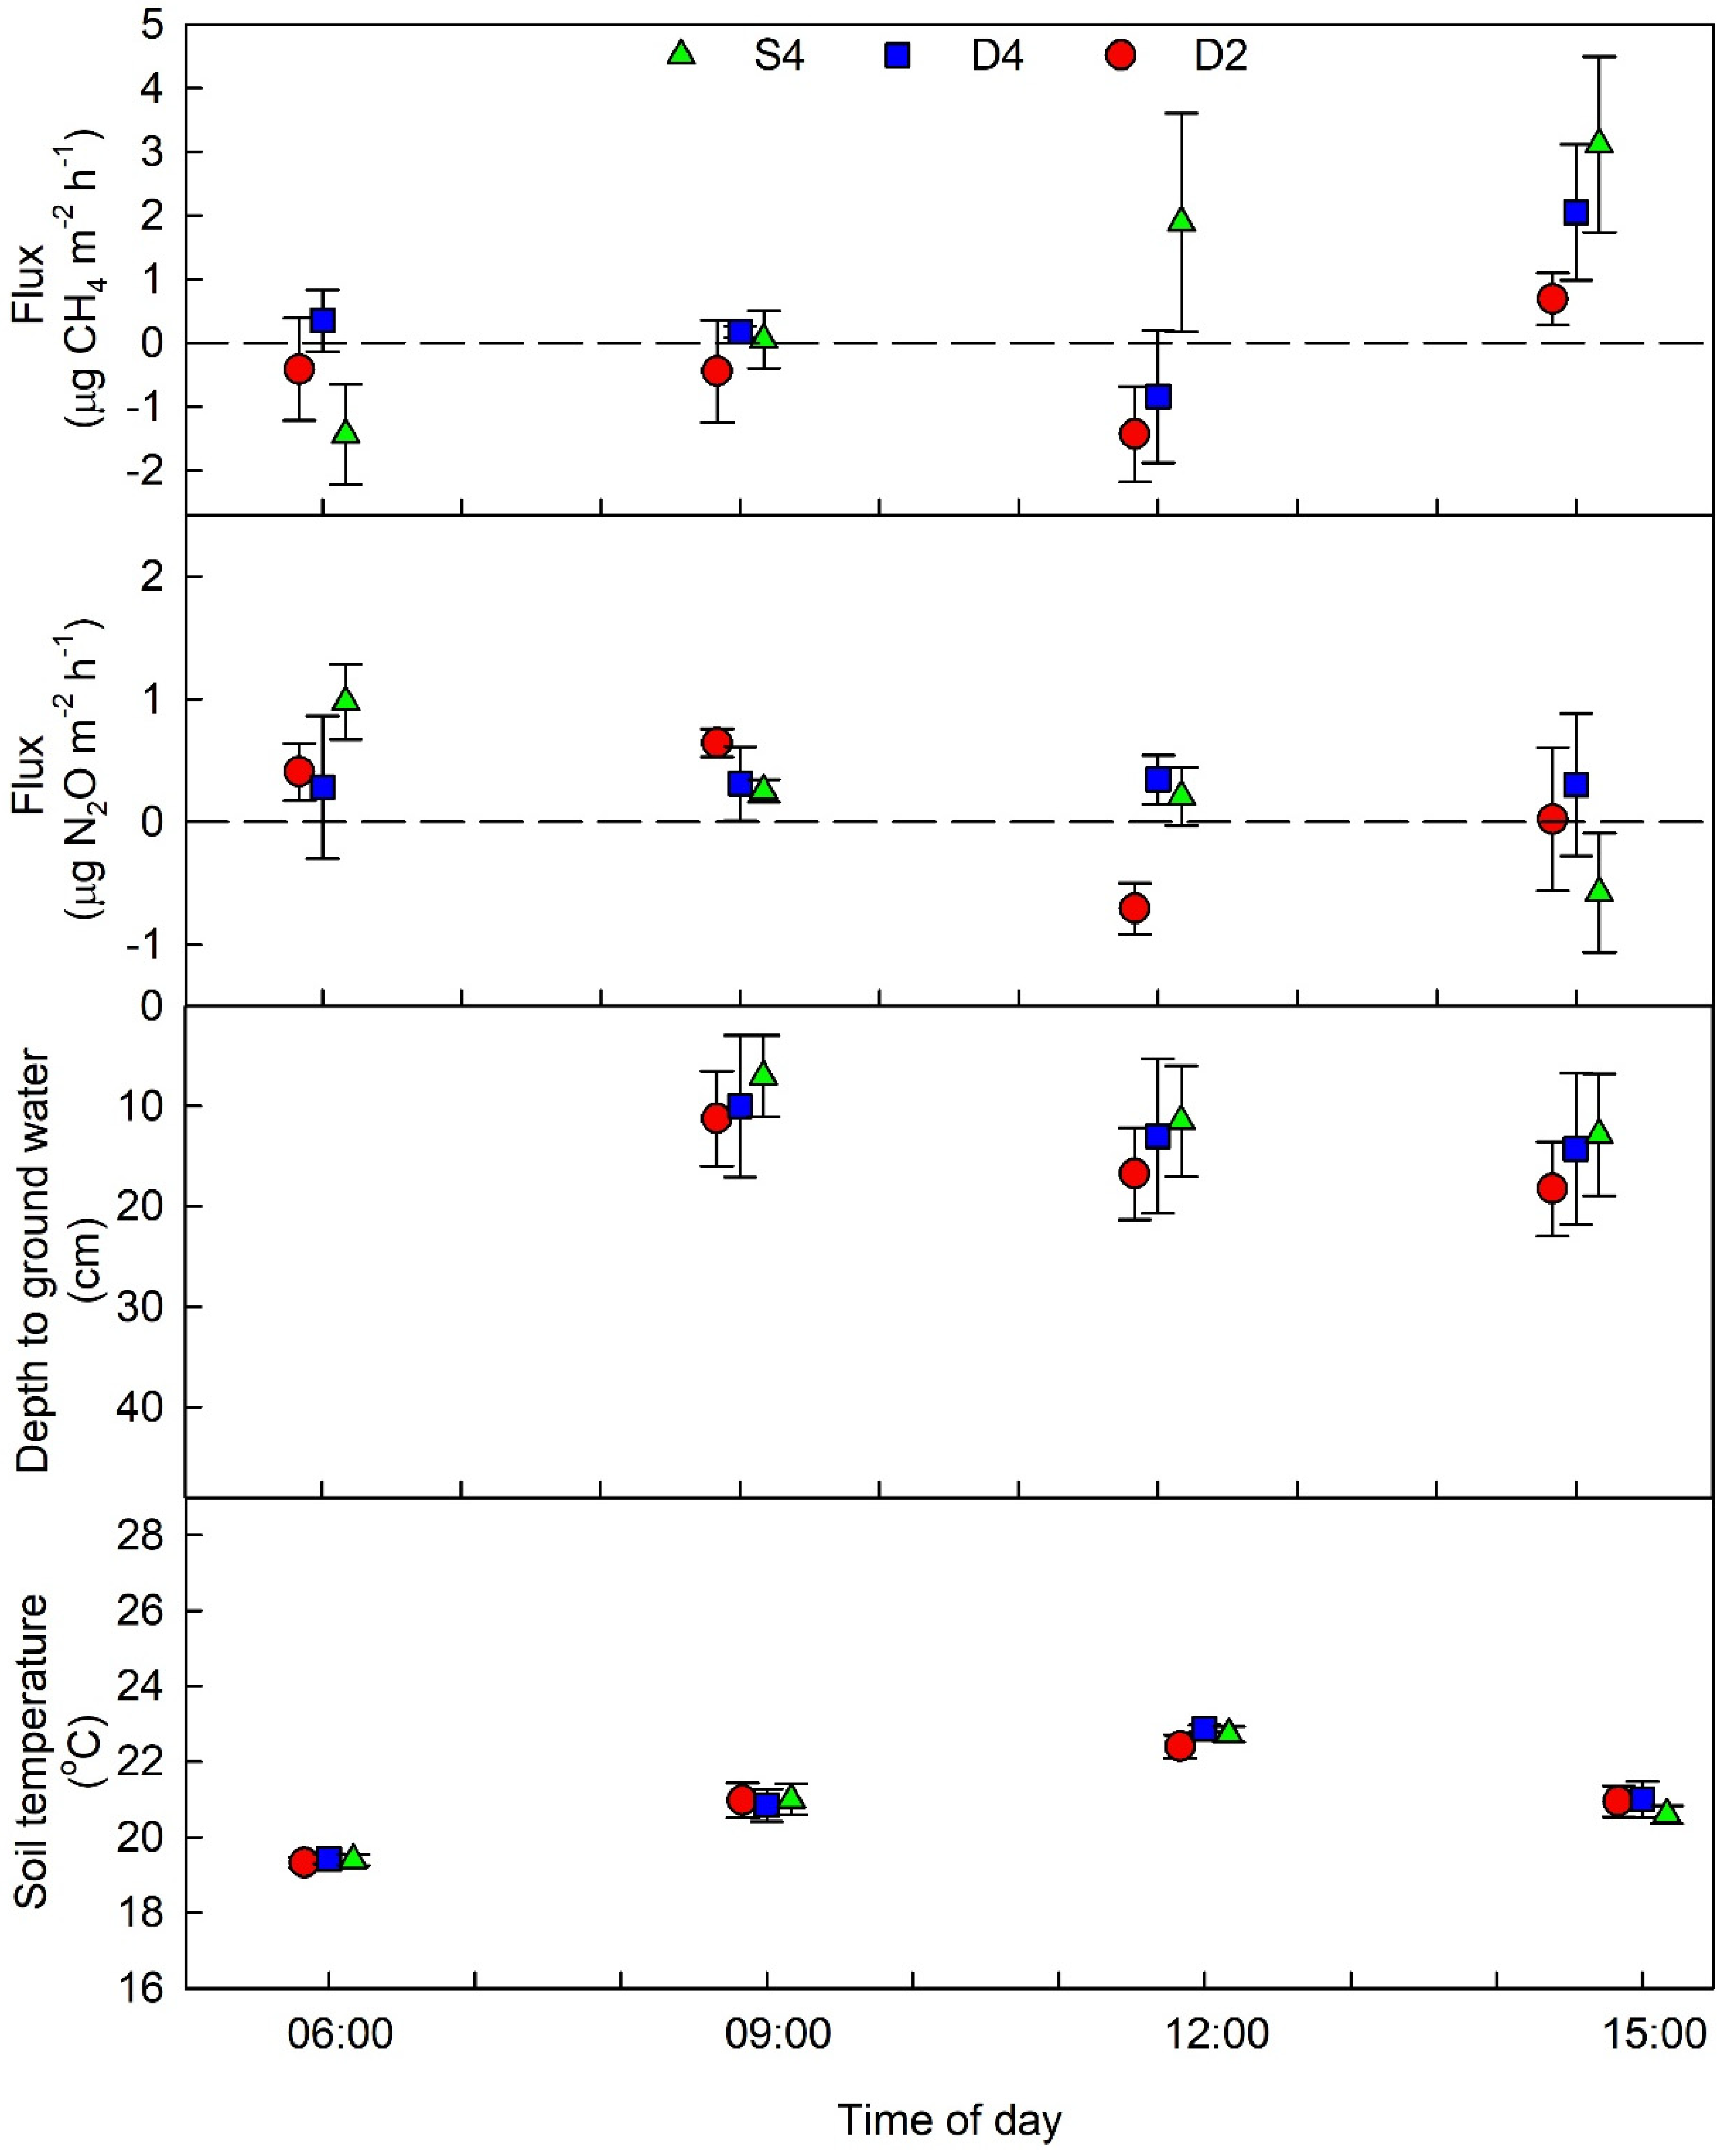
3.4. No Significant Diurnal Pattern in CH4 and N2O Fluxes

Test for presence of a possible diurnal pattern in GHG emissions revealed a significant diurnal pattern in soil temperature with the lowest values at 6 am (19.4 °C) and the highest at noon (22.7 °C) (Figure 3). The CH4 and N2O fluxes remained low throughout the day (Figure 3) and mixed model ANOVA test revealed no significant effect of time of day or drainage treatment on either CH4 or N2O flux (Table 3). However, there was a tendency for CH4 flux to be higher in the afternoon than at other times of the day (Figure 3).

3.5. Accumulated GHG Fluxes

Accumulated CH4 emissions from the deep drainage treatments were close to 0.0 kg ha−1 throughout the 44-day measurement period (Table 4). Accumulated CH4 emissions from the shallow drainage treatment were estimated to be around 0.8 kg ha−1, corresponding to approximately 26 kg CO2-equivalents ha−1.
Accumulated N2O emissions were not significant (Table 4). In absolute terms, uptake of 0.06 kg ha−1 to release of 0.04 kg ha−1 was observed, depending on treatment, corresponding to uptake of 17 kg CO2-equivalents ha−1 to emissions of 11 kg CO2-equivalents ha−1 for the period.

4. Discussion

4.1. Drain Depth and CH4 Emissions

Deep drainage lowered the groundwater level more and therefore reduced CH4 emissions compared with shallow drainage, partially confirming the starting hypothesis. The treatment with shallow drainage (representing traditional practice in the study region) had significantly higher CH4 emissions and the shallowest groundwater level of all treatments. Previous studies have found that drainage strongly reduces CH4 emissions from rice paddy fields compared with poorly drained fields, indicating that improved water management can be an important strategy for reducing CH4 emissions from rice paddy fields [55]. In an earlier study at the study site, we found that the deep drainage treatments also increased yield [20].
However, there were no differences in CH4 emissions, or in groundwater level, between the two deep drainage treatments with different weir opening frequency (D4 and D2). This was probably because all plots were irrigated three times per week, so opening the weir two or four times per week did not result in considerable differences in groundwater level, or in soil water content [20].
Estimated CH4 emissions (0–0.8 kg ha−1) were low compared with those reported in other studies [56,57]. One probable explanation for the low CH4 emissions was that the groundwater level was below the soil surface on all measurement occasions in our study. Another possible explanation is depletion of soil organic carbon and total N at the experimental site, because of the local practice of not returning crop residues to the soil. In addition, the soil at the study site is moderately saline and studies on paddy fields have found that soil salinity affects CH4 emissions through suppressing the activities of soil microbes, including methanogens [34,35]. However, the soil salinity conditions were improved prior the present study and the soil salinity effect was probably limited.
The IPCC [58] emissions factor for CH4 emissions from rice fields is 1.3 kg ha−1 day−1, while in statistics on CH4 emissions from rice cultivation compiled by FAO [45], an emissions factor equivalent to 0.19 kg CH4 ha−1 day−1 is used for Rwanda. These values would correspond to CH4 emissions of 57 and 8.4 kg ha−1 during a 44-day period, which is much greater than the observed flux of 0.0–0.8 kg CH4 ha−1 at our study site. The difference between estimates obtained using the IPCC factor and the FAO factor demonstrates the uncertainty in estimating CH4 emissions and the need for empirical measurements at a range of sites. Empirical studies of GHG emissions from African rice fields are rare. In the only case reported in the literature, in Zimbabwe, the field studied emitted 12.5 kg CH4 ha−1 during a growing period of 150 days [44], which would equate to 3.7 kg CH4 ha−1 for a 44-day period. This is much lower than the IPCC estimate and half the FAO estimate, but still exceeds the emissions observed in our study.

4.2. Groundwater Level and N2O Emissions

The hypothesis that deep drainage and more frequent weir opening (D4) lowers the groundwater level more, and therefore increases N2O emissions, compared with shallow or less frequently opened deep drains was not supported by the results. There are several possible reasons for this. One is that groundwater level was not very much deeper numerically in the deep drainage treatments than with shallow drainage (although the difference was significant), and no obvious effect on N2O was observed even when the groundwater was at its lowest level (30 cm). A previous study on the effect of groundwater level on N2O emissions observed, an increase in emissions at deep groundwater level (40 cm) compared with shallow (10 cm) [59].
Apart from soil moisture, soil N2O emissions flux is affected by use of nitrogen fertilizers as this acts as a substrate for nitrifying and denitrifying microorganisms [19]. Considering the nutrient-poor soil at our study site and the low amount of added N (80 kg N ha−1 per season), there was probably insufficient ammonium and nitrate available for denitrification and nitrification (cf. [29,60]), resulting in the soil being a poor source of N2O in all drainage treatments.
The fifth IPCC report [8] considers N2O emissions from flooded land to be negligible unless there is significant input of organic or inorganic nitrogen [61]. A review has shown that the lowest yield-scaled N2O emissions occur with N application rates ranging between 100 and 150 kg ha−1 [43], and the N application rate used in our study was below that lower threshold. The small uptake of N2O we observed in the present study may also be explained by low N availability [14,15].
It should be noted that our first GHG measurement took place on day 17 after fertilization and that peak N2O flux tends to coincide with fertilization [58]. Later N2O emissions may occur episodically [62], associated with initial stage of growth and fertilization occasion [63]. In all, this implies that the N2O emissions were underestimated in this study. However, the values were consistent with those reported in other studies on African paddy fields [43,44], although lower than the estimated value of 0.6 kg N2O ha−1 when using the IPCC-recommended emissions factor for a dry climate of 0.5% [64]. In comparison, emissions of 4.4 kg N2O ha−1 have been reported at a fertilizer rate of 276 kg N ha−1 for rice fields in China, which is close to the recommended N rate (300 kg N ha−1) for paddy rice in China [65]. To meet increasing future demand for food in SSA, intensive farming with high fertilization rates will be required [42]. Increasing N fertilizer application could have an important impact on future N2O gas emissions creating a need to find sound management strategies for reducing the agricultural emissions impact in the region.

5. Conclusions

This field study on the effect of varying drainage depth and frequency on soil-surface fluxes of CH4 and N2O from paddy rice cultivation in Rwanda revealed that traditional shallow drainage (0.6 m) gave higher CH4 emissions than the two deep drainage systems (1.2 m), with no associated effect on N2O emissions. There were no differences between conventional and controlled deep drainage treatments. Thus, deep drainage can mitigate CH4 emissions from Rwandan paddy fields without increasing the associated N2O emissions through greater aeration of soil. Prior investigations at the site showed that deep drainage treatments also increased rice yield.
The contribution of CH4 and N2O fluxes to total GHG emissions from the moderately saline soil at study site was generally minor. The observed fluxes were much lower than potential fluxes calculated using emission or reported fluxes in other parts of the world. This indicates that applying standard emission factors to saline soils with low N fertilizer inputs in SSA may overestimate actual emissions. To reduce the uncertainty in GHG estimates for the region, future studies should include measurements that fully capture seasonal variations during the rice-growing period.

Author Contributions

Conceptualization, O.T., I.W., A.J., I.M. and F.X.N.; methodology, O.T., I.W., A.J., I.M. and F.X.N.; validation, I.W., A.J., M.S. and F.X.N.; formal analysis, O.T. and M.S.; investigation, O.T.; resources, A.J. and I.W.; data curation, O.T. and M.S.; writing—review and editing, O.T., M.S., I.W., A.J., I.M. and F.X.N.; visualization, M.S.; supervision, I.W., A.J., I.M., M.S. and F.X.N. All authors have read and agreed to the published version of the manuscript.

Funding

This research was funded by the Swedish International Development Cooperation Agency (SIDA) within the “UR-Sweden programme for Research, Higher Education and Institutional Advancement”, contribution numbers 51160027 and 51160059.

Institutional Review Board Statement

Not applicable.

Informed Consent Statement

Not applicable.

Acknowledgments

The authors would like to thank Örjan Berglund and Sabine Jordan for fruitful discussions about GHG measurements and assistance with field operations, and Jan Fiedler for valuable help with gas analysis. Thanks to the Muvumba P8 rice growers cooperative for providing the experimental site. We also thank Mary McAfee for English corrections.

Conflicts of Interest

The authors declare no conflict of interest. The funders had no role in the design of the study; in the collection, analyses, or interpretation of data; in the writing of the manuscript; or in the decision to publish the results.

Abbreviations

ANOVAAnalysis of variance
CH4Methane
CO2Carbon dioxide
D4:1.2 m deep drain, weir open four times per week
D21.2 m deep drain, weir open two times per week
FAOFood and Agriculture Organization
GHGGreenhouse gas
GWPGlobal warming potential
IPCCIntergovernmental Panel on Climate Change
KPotassium
NNitrogen
N2ONitrous oxide
PPhosphorus
SSAsub-Saharan Africa
S40.6 m deep drain, weir open four times per week

References

  1. IPCC, S.P. Climate change and land: An IPCC special report on climate change, desertification, land degradation, sustainable land management, food security, and greenhouse gas fluxes in terrestrial ecosystems. In International Consensus Regarding Land System Impacts of Climate Change as of 2019; Shukla, P.R., Ed.; IPCC: Geneva, Switzerland, 2019. [Google Scholar]
  2. Myhre, G.; Shindell, D.; Bréon, F.-M.; Collins, W.; Fuglestvedt, J.; Huang, J.; Koch, D.; Lamarque, J.-F.; Lee, D.; Mendoza, B.; et al. Anthropogenic and Natural Radiative Forcing; 1107415322; Cambridge University Press: Cambridge, UK, 2013; Available online: http://www.climatechange2013.org/images/report/WG1AR5_Chapter08_FINAL.pdf (accessed on 11 September 2022).
  3. Carlson, K.M.; Gerber, J.S.; Mueller, N.D.; Herrero, M.; MacDonald, G.K.; Brauman, K.A.; Havlik, P.; O’Connell, C.S.; Johnson, J.A.; Saatchi, S. Greenhouse gas emissions intensity of global croplands. Nat. Clim. Chang. 2017, 7, 63–68. [Google Scholar] [CrossRef]
  4. Win, E.P.; Win, K.K.; Bellingrath-Kimura, S.D.; Oo, A.Z. Greenhouse gas emissions, grain yield and water productivity: A paddy rice field case study based in Myanmar. Greenh. Gases Sci. Technol. 2020, 10, 884–897. [Google Scholar] [CrossRef]
  5. Fagodiya, R.; Pathak, H.; Kumar, A.; Bhatia, A.; Jain, N. Global temperature change potential of nitrogen use in agriculture: A 50-year assessment. Sci. Rep. 2017, 7, 44928. [Google Scholar] [CrossRef] [PubMed] [Green Version]
  6. Liu, X.; Zhou, T.; Liu, Y.; Zhang, X.; Li, L.; Pan, G. Effect of mid-season drainage on CH4 and N2O emission and grain yield in rice ecosystem: A meta-analysis. Agric. Water Manag. 2019, 213, 1028–1035. [Google Scholar] [CrossRef]
  7. Shang, Z.; Abdalla, M.; Xia, L.; Zhou, F.; Sun, W.; Smith, P. Can cropland management practices lower net greenhouse emissions without compromising yield? Glob. Chang. Biol. 2021, 27, 4657–4670. [Google Scholar] [CrossRef] [PubMed]
  8. IPCC. Synthesis Report. Contribution of Working Groups I, II and III to the Fifth Assessment Report of the Intergovernmental Panel on Climate Change. In Climate Change; C.W. Team, Pachauri, R.K., Meyer, L.A., Eds.; IPCC: Geneva, Switzerland, 2013; p. 151. [Google Scholar]
  9. Conrad, R. Methane production in soil environments—Anaerobic biogeochemistry and microbial life between flooding and desiccation. Microorganisms 2020, 8, 881. [Google Scholar] [CrossRef]
  10. Wang, C.; Amon, B.; Schulz, K.; Mehdi, B. Factors that influence nitrous oxide emissions from agricultural soils as well as their representation in simulation models: A Review. Agronomy 2021, 11, 770. [Google Scholar] [CrossRef]
  11. Li, Z.; Qi, Z.; Jiang, Q.; Sima, N. An economic analysis software for evaluating best management practices to mitigate greenhouse gas emissions from cropland. Agric. Syst. 2021, 186, 102950. [Google Scholar] [CrossRef]
  12. Luo, G.; Kiese, R.; Wolf, B.; Butterbach-Bahl, K. Effects of soil temperature and moisture on methane uptake and nitrous oxide emissions across three different ecosystem types. Biogeosciences 2013, 10, 3205. [Google Scholar] [CrossRef] [Green Version]
  13. Nishimura, S.; Sawamoto, T.; Akiyama, H.; Sudo, S.; Yagi, K. Methane and nitrous oxide emissions from a paddy field with Japanese conventional water management and fertilizer application. Glob. Biogeochem. Cycles 2004, 18, 1–10. [Google Scholar] [CrossRef]
  14. Majumdar, D. Biogeochemistry of N2O uptake and consumption in submerged soils and rice fields and implications in climate change. Crit. Rev. Environ. Sci. Technol. 2013, 43, 2653–2684. [Google Scholar] [CrossRef]
  15. Chapuis-Lardy, L.; Wrage, N.; Metay, A.; Chotte, J.L.; Bernoux, M. Soils, a sink for N2O? A review. Glob. Chang. Biol. 2007, 13, 1–17. [Google Scholar] [CrossRef]
  16. Yan, X.; Yagi, K.; Akiyama, H.; Akimoto, H. Statistical analysis of the major variables controlling methane emission from rice fields. Glob. Chang. Biol. 2005, 11, 1131–1141. [Google Scholar] [CrossRef]
  17. Butterbach-Bahl, K.; Baggs, E.M.; Dannenmann, M.; Kiese, R.; Zechmeister-Boltenstern, S. Nitrous oxide emissions from soils: How well do we understand the processes and their controls? Philos. Trans. R. Soc. B Biol. Sci. 2013, 368, 20130122. [Google Scholar] [CrossRef]
  18. Wu, Q.; He, Y.; Qi, Z.; Jiang, Q. Drainage in paddy systems maintains rice yield and reduces total greenhouse gas emissions on the global scale. J. Clean. Prod. 2022, 370, 133515. [Google Scholar] [CrossRef]
  19. He, H.; Li, D.; Pan, F.; Wu, Z.; Wang, F.; Wu, D.; Wu, S.; Yang, S.; Ma, Y. Effects of Drainage on Greenhouse Gas Emissions and Yields of Lowland Rice—Wheat Rotation System in East China. Agronomy 2022, 12, 1932. [Google Scholar] [CrossRef]
  20. Tuyishime, O.; Joel, A.; Messing, I.; Naramabuye, F.; Sankaranarayanan, M.; Wesström, I. Effects of drainage intensity on water and nitrogen use efficiency and rice grain yield in a semi-arid marshland in Rwanda. Acta Agric. Scand. Sect. B—Soil Plant Sci. 2020, 70, 578–593. [Google Scholar] [CrossRef]
  21. Yang, S.; Peng, S.; Hou, H.; Xu, J. Controlled irrigation and drainage of a rice paddy field reduced global warming potential of its gas emissions. Arch. Agron. Soil Sci. 2014, 60, 151–161. [Google Scholar] [CrossRef]
  22. Jiang, Y.; Carrijo, D.; Huang, S.; Chen, J.; Balaine, N.; Zhang, W.; van Groenigen, K.J.; Linquist, B. Water management to mitigate the global warming potential of rice systems: A global meta-analysis. Field Crop. Res. 2019, 234, 47–54. [Google Scholar] [CrossRef]
  23. Watanabe, T.; Wang, G.; Taki, K.; Ohashi, Y.; Kimura, M.; Asakawa, S. Vertical changes in bacterial and archaeal communities with soil depth in Japanese paddy fields. Soil Sci. Plant Nutr. 2010, 56, 705–715. [Google Scholar] [CrossRef]
  24. Xiao, M.; Yu, S.e.; Zhang, Y. Changes of nitrogen concentration for surface and groundwater in flooding paddy field under controlled drainage. Trans. Chin. Soc. Agric. Eng. 2011, 27, 180–186. [Google Scholar]
  25. Jiang, Q.; Qi, Z.; Madramootoo, C.A.; Crézé, C. Mitigating greenhouse gas emissions in subsurface-drained field using RZWQM2. Sci. Total Environ. 2019, 646, 377–389. [Google Scholar] [CrossRef] [PubMed]
  26. Dubey, S. Microbial ecology of methane emission in rice agroecosystem: A review. Appl. Ecol. Environ. Res. 2005, 3, 1–27. [Google Scholar]
  27. Velthof, G.; Rietra, R. Nitrous Oxide Emission From Agricultural Soils. 1566-7197; Wageningen Environmental Research: Wageningen, The Netherlands, 2018; 62p. [Google Scholar]
  28. Gagnon, B.; Ziadi, N.; Rochette, P.; Chantigny, M.H.; Angers, D.A. Fertilizer source influenced nitrous oxide emissions from a clay soil under corn. Soil Sci. Soc. Am. J. 2011, 75, 595–604. [Google Scholar] [CrossRef]
  29. Wang, C.; Lai, D.Y.; Sardans, J.; Wang, W.; Zeng, C.; Penuelas, J. Factors related with CH4 and N2O emissions from a paddy field: Clues for management implications. PLoS ONE 2017, 12, e0169254. [Google Scholar] [CrossRef] [Green Version]
  30. Yuan, Q.; Pump, J.; Conrad, R. Straw application in paddy soil enhances methane production also from other carbon sources. Biogeosciences 2014, 11, 237–246. [Google Scholar] [CrossRef] [Green Version]
  31. Allen, J.; Pascual, K.S.; Romasanta, R.R.; Trinh, M.V.; Thach, T.V.; Hung, N.V.; Sander, B.O.; Chivenge, P. Rice straw management effects on greenhouse gas emissions and mitigation options. In Sustainable Rice Straw Management; Springer: Cham, Switzerland, 2020; pp. 145–159. [Google Scholar] [CrossRef] [Green Version]
  32. Naser, H.M.; Nagata, O.; Tamura, S.; Hatano, R. Methane emissions from five paddy fields with different amounts of rice straw application in central Hokkaido, Japan. Soil Sci. Plant Nutr. 2007, 53, 95–101. [Google Scholar] [CrossRef] [Green Version]
  33. Jain, N.; Pathak, H.; Mitra, S.; Bhatia, A. Emission of methane from rice fields—A review. J. Sci. Ind. Res. 2004, 63, 101–115. [Google Scholar]
  34. Haj-Amor, Z.; Araya, T.; Kim, D.-G.; Bouri, S.; Lee, J.; Ghiloufi, W.; Yang, Y.; Kang, H.; Jhariya, M.K.; Banerjee, A.; et al. Soil salinity and its associated effects on soil microorganisms, greenhouse gas emissions, crop yield, biodiversity and desertification: A review. Sci. Total Environ. 2022, 843, 156946. [Google Scholar] [CrossRef]
  35. Shahariar, S.; Farrell, R.; Soolanayakanahally, R.; Bedard-Haughn, A. Elevated salinity and water table drawdown significantly affect greenhouse gas emissions in soils from contrasting land-use practices in the prairie pothole region. Biogeochemistry 2021, 155, 127–146. [Google Scholar] [CrossRef]
  36. Thapa, R.; Chatterjee, A.; Abbey, W.; Butcher, K. Carbon dioxide and nitrous oxide emissions from naturally occurring sulfate-based saline soils at different moisture contents. Pedosphere 2017, 27, 868–876. [Google Scholar] [CrossRef]
  37. Yu, Y.; Zhao, C.; Zheng, N.; Jia, H.; Yao, H. Interactive effects of soil texture and salinity on nitrous oxide emissions following crop residue amendment. Geoderma 2019, 337, 1146–1154. [Google Scholar] [CrossRef]
  38. Hijbeek, R.; Loon, M.V.; Ittersum, M.V.; Berge, H.t. Benchmarking crop nitrogen requirements, nitrogen-use efficiencies and associated greenhouse gas mitigation potential: Methodology exploration for cereal production in sub-Saharan Africa. CCAFS Work. Pap. 2020. [Google Scholar]
  39. Hickman, J.E.; Havlikova, M.; Kroeze, C.; Palm, C.A. Current and future nitrous oxide emissions from African agriculture. Curr. Opin. Environ. Sustain. 2011, 3, 370–378. [Google Scholar] [CrossRef]
  40. Valentini, R.; Arneth, A.; Bombelli, A.; Castaldi, S.; Cazzolla Gatti, R.; Chevallier, F.; Ciais, P.; Grieco, E.; Hartmann, J.; Henry, M. A full greenhouse gases budget of Africa: Synthesis, uncertainties, and vulnerabilities. Biogeosciences 2014, 11, 381–407. [Google Scholar] [CrossRef] [Green Version]
  41. Ciais, P.; Bombelli, A.; Williams, M.; Piao, S.; Chave, J.; Ryan, C.; Henry, M.; Brender, P.; Valentini, R. The carbon balance of Africa: Synthesis of recent research studies. Philos. Trans. R. Soc. A Math. Phys. Eng. Sci. 2011, 369, 2038–2057. [Google Scholar] [CrossRef]
  42. Van Loon, M.P.; Hijbeek, R.; Ten Berge, H.F.; De Sy, V.; Ten Broeke, G.A.; Solomon, D.; van Ittersum, M.K. Impacts of intensifying or expanding cereal cropping in sub-Saharan Africa on greenhouse gas emissions and food security. Glob. Chang. Biol. 2019, 25, 3720–3730. [Google Scholar] [CrossRef] [PubMed] [Green Version]
  43. Kim, D.-G.; Thomas, A.; Pelster, D.; Rosenstock, T.S.; Sanz-Cobena, A. Greenhouse gas emissions from natural ecosystems and agricultural lands in sub-Saharan Africa: Synthesis of available data and suggestions for further research. Biogeosciences 2016, 13, 4789–4809. [Google Scholar] [CrossRef] [Green Version]
  44. Nyamadzawo, G.; Wuta, M.; Chirinda, N.; Mujuru, L.; Smith, J.L. Greenhouse gas emissions from intermittently flooded (dambo) rice under different tillage practices in chiota smallholder farming area of Zimbabwe. Atmos. Clim. Sci. 2013, 3, 13–20. [Google Scholar] [CrossRef] [Green Version]
  45. FAO. FAOSTAT Online Data Base Rom; FAO: Rome, Italy, 2020. [Google Scholar]
  46. Palm, C.A.; Smukler, S.M.; Sullivan, C.C.; Mutuo, P.K.; Nyadzi, G.I.; Walsh, M.G. Identifying potential synergies and trade-offs for meeting food security and climate change objectives in sub-Saharan Africa. Proc. Natl. Acad. Sci. USA 2010, 107, 19661–19666. [Google Scholar] [CrossRef] [PubMed] [Green Version]
  47. RIWSP. Review of the National Hydrological Service in Rwanda, in RIWSP-No. 2.2.1/02; Venneker, R., Wenninger, J., Eds.; Rwanda Integrated Water Security Program: Kigali, Rwanda, 2012. [Google Scholar]
  48. Abimbola, O.P.; Wenninger, J.; Venneker, R.; Mittelstet, A.R. The assessment of water resources in ungauged catchments in Rwanda. J. Hydrol. Reg. Stud. 2017, 13, 274–289. [Google Scholar] [CrossRef]
  49. FAO/IUSS. World Reference Base For Soil Resources 2014, Update 2015: International Soil Classification System For Naming Soils And Creating Legends For Soil Maps; Fao Rome: Rome, Italy, 2015. [Google Scholar]
  50. Omuto, C.; Vargas, R.; El Mobarak, A.; Mohamed, N.; Viatkin, K.; Yigini, Y. Mapping of Salt-Affected Soils: Technical Manual; FAO: Rome, Italy, 2020. [Google Scholar]
  51. Cyamweshi, A.R.; Kayumba, J.; Nabahungu, N.L. Optimizing Fertilizer Use Within The Context Of Integrated Soil Fertility Management in Rwanda; Wortmann, C.S., Sones, K., Eds.; CAB International: Wallingford, UK, 2017. [Google Scholar]
  52. Rukazambuga-Ntirushwa, D. Land-husbandry, Water-harvesting and Hillside-irrigation (LWH) project: Pest Management Plan (PMP) and Arrangement for LWH (E2741 V3). In Land-Husbandry, Water-Harvesting and Hillside-Irrigation (Lwh) Project: Pest Management Plan (Pmp) and Arrangement For Lwh (E2741 V3); CAB International: Wallingford, UK, 2009; pp. 1–117. [Google Scholar]
  53. Parkin, T.; Venterea, R. Chamber-Based Trace Gas Flux Measurements Sampling Protocols ed RF Follett Chapter 3. In GRACEnet Sampling Protocols; Follett, R., Ed.; Agricultural Research Service, United States Department of Agriculture: Washington, DC, USA, 2010; pp. 1–39. [Google Scholar]
  54. Pihlatie, M.K.; Christiansen, J.R.; Aaltonen, H.; Korhonen, J.F.J.; Nordbo, A.; Rasilo, T.; Benanti, G.; Giebels, M.; Helmy, M.; Sheehy, J.; et al. Comparison of static chambers to measure CH4 emissions from soils. Agric. For. Meteorol. 2013, 171–172, 124–136. [Google Scholar] [CrossRef] [Green Version]
  55. Yagi, K.; Tsuruta, H.; Kanda, K.i.; Minami, K. Effect of water management on methane emission from a Japanese rice paddy field: Automated methane monitoring. Glob. Biogeochem. Cycles 1996, 10, 255–267. [Google Scholar] [CrossRef]
  56. Naser, H.M.; Nagata, O.; Sultana, S.; Hatano, R. Impact of management practices on methane emissions from paddy grown on mineral soil over peat in Central Hokkaido, Japan. Atmosphere 2018, 9, 212. [Google Scholar] [CrossRef]
  57. Tariq, A.; Vu, Q.D.; Jensen, L.S.; de Tourdonnet, S.; Sander, B.O.; Wassmann, R.; Van Mai, T.; de Neergaard, A. Mitigating CH4 and N2O emissions from intensive rice production systems in northern Vietnam: Efficiency of drainage patterns in combination with rice residue incorporation. Agric. Ecosyst. Environ. 2017, 249, 101–111. [Google Scholar] [CrossRef]
  58. IPCC. IPCC Guidelines for National Greenhouse Gas Inventories; Eggleston, S., Ed.; National Greenhouse Gas Inventories Programme: Hayama, Japan, 2006. [Google Scholar]
  59. Zhang, S.; Liu, F.; Xiao, R.; Lian, S.; Lv, S. Effects of water level on nitrous oxide emissions from vegetated ditches. Sci. Total Environ. 2022, 811, 151419. [Google Scholar] [CrossRef] [PubMed]
  60. Hua, X.; Guangxi, X.; Cai, Z.-C.; Tsuruta, H. Nitrous oxide emissions from three rice paddy fields in China. Nutr. Cycl. Agroecosys 1997, 49, 23–28. [Google Scholar] [CrossRef]
  61. Hiraishi, T.; Krug, T.; Tanabe, K.; Srivastava, N.; Baasansuren, J.; Fukuda, M.; Troxler, T. 2013 Supplement to the 2006 IPCC Guidelines for National Greenhouse Gas Inventories: Wetlands; IPCC: Geneva, Switzerland, 2014. [Google Scholar]
  62. Towprayoon, S.; Smakgahn, K.; Poonkaew, S. Mitigation of methane and nitrous oxide emissions from drained irrigated rice fields. Chemosphere 2005, 59, 1547–1556. [Google Scholar] [CrossRef] [PubMed]
  63. Rochette, P.; Tremblay, N.; Fallon, E.; Angers, D.; Chantigny, M.; MacDonald, J.; Bertrand, N.; Parent, L.É. N2O emissions from an irrigated and non-irrigated organic soil in eastern Canada as influenced by N fertilizer addition. Eur. J. Soil Sci. 2010, 61, 186–196. [Google Scholar] [CrossRef]
  64. Hergoualc’h, K.; Akiyama, H.; Bernoux, M.; Chirinda, N.; del Prado, A.; Kasimir, Å.; MacDonald, J.D.; Ogle, S.M.; Regina, K.; Weerden, T.J.V.D. IPCC: N2O Emissions from Managed Soils, and CO2 Emissions from Lime and Urea Application. Chapter 11; In 2019 Refinement to the 2006 IPCC Guidelines for National Greenhouse Gas Inventories; IPCC: Geneva, Switzeland, 2019. [Google Scholar]
  65. Jiao, J.; Shi, K.; Li, P.; Sun, Z.; Chang, D.; Shen, X.; Wu, D.; Song, X.; Liu, M.; Li, H.; et al. Assessing of an irrigation and fertilization practice for improving rice production in the Taihu Lake region (China). Agric. Water Manag. 2018, 201, 91–98. [Google Scholar] [CrossRef]
Figure 1. Experimental set-up of blocks (I–IV) and plots within blocks with three treatments: shallow drainage to 0.6 m depth, with weir open four times per week (S4), and deep drainage to 1.2 m depth, with weir open four times per week (D4) or two times per week (D2).
Soilsystems 06 00084 g001
Figure 2. Flux of methane (CH4) and nitrous oxide (N2O), groundwater level, and soil temperature in the period May-July 2018 in treatments with: shallow drainage to 0.6 m with weir open four times per week (S4) and deep drainage to 1.2 m, with weir open four times per week (D4) or two times per week (D2). Error bars denote one standard error (n ≤ 4). The flux values represent fluxes from soil-surface including vegetation, negative values indicating uptake of CH4 or N2O.
Soilsystems 06 00084 g002
Figure 3. Diurnal pattern in methane (CH4) and nitrous oxide (N2O) fluxes, groundwater level, and soil temperature in treatments with: shallow drainage to 0.6 m with weir open four times per week (S4) and deep drainage to 1.2 m with weir open four times per week (D4) or two times per week (D2). Error bars denote one standard error (n ≤ 4). The flux values represent fluxes from the soil-surface including vegetation, with negative values indicating uptake of CH4 or N2O.
Soilsystems 06 00084 g003
Table 1. Field management practices, fertilizer type, and fertilizer application rate (N = nitrogen, P = phosphorus, K = potassium) in the experiment.
Field OperationDate
(2018)
DAT aFertilizer
Type
N
kg ha−1
P
kg ha−1
K
kg ha−1
Seeds germination8 March
Rice transplanting29 March
1st fertilizer application4 April6NPK1048
2nd fertilizer application18 April20NPK241120
3rd fertilizer application7 May39Urea46
First GHG b sampling24 May56
Last GHG b sampling8 July100
Last irrigation event15 July107
End of weir regulation16 July108
Rice harvesting1 August122
a Days after transplanting. b Greenhouse gas.
Table 2. p-values obtained from analysis of variance (ANOVA) of effects of drainage treatment on methane (CH4) flux, nitrous oxide (N2O) flux, groundwater level (GWL) and soil temperature.
Fixed EffectsCH4 FluxN2O FluxGroundwater LevelSoil Temperature
Drainage0.030.600.030.83
Table 3. p-values obtained from analysis of variance (ANOVA) of effects of drainage treatment and time of day (during 30 June 2018) on methane (CH4) flux, nitrous oxide (N2O) flux, groundwater level (GWL) and soil temperature.
Fixed EffectsCH4 FluxN2O FluxGroundwater LevelSoil Temperature
Drainage0.170.740.610.82
Time of day0.070.670.870.00
Table 4. Accumulated methane (CH4) and nitrous oxide (N2O) emissions over the 44-day period from treatments with: shallow drainage to 0.6 m with weir open four times per week (S4) and deep drainage to 1.2 m with weir open four times per week (D4) or two times per week (D2). Note that a negative value corresponds to accumulated uptake of the gas.
TreatmentCH4N2O
kg ha−1kg CO2-eq. ha−1kg ha−1kg CO2-eq. ha−1
S40.8260.0411
D40.13−0.06−17
D20.00−0.05−14
Publisher’s Note: MDPI stays neutral with regard to jurisdictional claims in published maps and institutional affiliations.

