Article

Is the Current Modelling of Litter Decomposition Rates Reliable under Limiting Environmental Conditions Induced by Ongoing Climate Change?

Department of Environmental Biology, Sapienza University of Rome, 00185 Rome, Italy
*
Author to whom correspondence should be addressed.
Soil Syst. 2022, 6(4), 81; https://doi.org/10.3390/soilsystems6040081
Submission received: 29 September 2022 / Revised: 20 October 2022 / Accepted: 23 October 2022 / Published: 25 October 2022
(This article belongs to the Special Issue Soil Metabolism and Biogenic Emissions of CO2 and N2O)

Abstract

:
Plant litter decomposition is a key process in the biogeochemical cycles of terrestrial ecosystems. The main goal of this work is to determine the impact of current climate change on the decomposition process of the litter of Palo Laziale Wood (Rome, Italy), one of the last remnants of the Tyrrhenian lowland forest. A time-dependent simulation of leaf litter decay was previously performed on a dynamic semi-empirical model based on Olson’s model (1963). It was also assumed that microbial activity depended on optimal temperature and moisture conditions simulated by Climatic Decomposition Index (CDI). The comparison between the observed and simulated leaf litter biomass reduction over time (t = −0.127, p = 0.901) highlighted the adequacy of CDI in reproducing biomass trends under limiting climatic conditions (high temperature and low precipitation). However, the decomposition model used here was not able to simulate the reduction of recalcitrant compounds (lignin) in strongly limiting conditions of water availability in the Palo Laziale Wood. These climatic conditions were attributable to climate change, which made the year 2020 representative of future years increasingly characterized by limiting climatic conditions. Therefore, it is necessary to carefully calibrate the CDI in order to consider the current and future changes in temperature and water availability in the Mediterranean area, and to, therefore, perform a better model-based foreseeing for leaf litter decomposition.

1. Introduction

Litter decomposition is a fundamental process for nutrient and carbon (C) cycling that affects plant productivity, species composition, and long-term C storage [1]. It is considered one of the essential ecosystem processes that maintains the balance of the natural dynamics in an ecosystem [2,3]. Through the action of the microorganisms, litter decomposition releases CO2 gas products, thereby performing an important role in the global CO2 balance, thus also affecting the Earth’s system models [4,5].
Many researchers have identified climatic parameters and litter quality as the key factors in the decomposition process [6,7]. The climate can affect leaf litter decomposition both directly and indirectly [8]. Considering its direct effect on that process, climate affects the activity of the decomposers, such as insects and bacteria. Meanwhile, regarding the indirect influence, it causes variations in the quality and the quantity of the litter.
The decomposition rate on a local scale is affected by different factors: changes in soil moisture [9], soil nutrients [10], ozone [11], and the community of decomposers [12]. It should be emphasized that factors such as aridity, leaf structure, and their content in deterrent substances [13] adversely affect litter decomposition. Consequently, these factors influence the variations in moisture and nutrients of the litter [14], changing the decomposition at the local scale [15]. Rainfall occurring during the wet season contributes to high rates of microbial degradation, while during the dry season the high relative humidity, fog, and dew (non-rainfall water sources) enable the humidity-enhanced microbial degradation typically during the night and early morning hours [16,17,18]. The decomposition rate grows exponentially with the soil temperature until reaching the optimum amount [19,20], increasing almost twice as much to an increment of 10 °C (Q10 of about 2) if the substrate does not limit the microbial activity [18]. It should be noted that the combined role of the main climatic factors (temperature, rainfall, humidity) and litter quality have been studied independently in the past, but little is known about the effect of the interactions between these factors on the decomposition process [21].
In most decomposition studies, the main climatic variables tested (temperature, relative humidity, and total precipitation) are treated as constants in vast areas and within the biomes [22,23]. However, the importance of topographical variability and plant coverage should be considered as factors that can potentially affect local microclimatic conditions. Considering these results, carbon stock variability, in response to climatic conditions and different vegetation types, should be considered in the modelling of future scenarios of carbon flows in terrestrial ecosystems. Considering the importance of carbon derived from the decomposition process, future studies should be given an increased emphasis on the decomposition process under climate change conditions. In the Mediterranean area, the lack of study on this topic is clear. Truly, models of litter decomposition in Mediterranean forests do not consider climate change and its influence on the process [24]. Therefore, considering the importance of these areas for their global biodiversity and the high threat level they are currently exposed to due to climate change, it is necessary to try to understand the factors and in which way they affect the decomposition process. This allows for us have the important data on which to base efficient conservation policies. In this regard, it should be emphasised that soil properties such as texture, pH, N content, and moisture have a great impact on the decomposition processes [25]. Just as an example, soil texture (quantity and type of clay) has a great influence on the stabilization of organic matter, biomass, and microbial activity and the buffer role of pH [26].
This work aims to test the actual Climatic Decomposition Index (CDI) [27] performance under highly limiting temperatures and rainfall to evaluate its performance in foreseeing the biomass loss trend of the leaf litter. The CDI treats the interaction between temperatures and water stress as a single synthetic variable, running simulations under different climatic environments. For example, soil moisture could depend on other variables, such as precipitation and potential evapotranspiration, which in turn can depend on other functions. In terms of programming, this means that a hierarchy of models is built with the dependence of different functions on others. Model hierarchy facilitates implementation and functional programming [28,29]. This work is part of the European LIFE project “Restoration, management and valorisation of PRIority habitats of MEDiterranean coastal areas—PRIMED”, which plans to conduct ecological restoration actions in the SCI T6030022 “Palo Laziale Wood”.
The analyses are carried out, considering the importance of the water availability in the soil for the leaf litter decomposition process and the need to integrate climate data with decomposition dynamics over time. For this reason, the decomposition model is built taking into consideration the water available in the soil other than the CDI. A time-dependent simulation of leaf litter decay has been performed on a dynamic semi-empirical model based on Olson’s model [30].

2. Materials and Methods

2.1. Study Area and Climatic Data

The study was conducted in the Site of Community Importance SCI T6030022 “Palo Laziale Wood” (41°56′0″ N, 12°6′9″ E) near Rome (Italy), which is one of the last remnants of the Tyrrhenian lowland forest. It was a flat area of about fifty hectares, consisting mostly of an oak floodplain forest (habitat 91M0), temporary ponds (habitat 3170*), high Mediterranean shrubland, and meadows extending for about eighteen hectares between the forest and the seashore.
The oak floodplain forest consisted of Quercus cerris (Turkey oak), Q. pubescens (Pubescent oak), Q. ilex (Holm oak), Fraxinus oxycarpa (Caucasian ash), and F. ornus (Manna ash) in the higher layer. This type of Mediterranean forest was very intricate with a high density of vegetation growing between the high and low layers, which were represented by the presence of Laurus nobilis (Bay tree) and Phillyrea angustifolia (Narrow-leaved mock privet). The high Mediterranean shrub was mainly covered by Phillyrea angustifolia. In the areas closest to the sea, the shrubland was dense and intricate due to the presence of other species, such as Phillyrea latifolia (Green olive tree) and Pistacia lentiscus (Lentisk).
Following the World Reference Base for soil resources [31], the soil was classified as Haplic and Petric Calcisols and characterized as clay-loam consisting of an average of 45% silt, 34% clay, and 21% sand. The climate of the area was Mediterranean type, characterized by precipitation during the winter and autumn seasons and prolonged periods of summer aridity. The progressive decrease in precipitation and the constant increase in temperature occurring in the last 20 years enhanced the aridity period, bringing it beyond the summer period. The weather station placed within the Palo Laziale Wood measured an average annual temperature of 16.3 °C and a precipitation value of 540 mm in 2020, far below the average values of previous years (Table S1—Supplementary Materials). In this study, all the climate data were provided by Regional Agency for Development and Innovation in Agriculture (ARSIAL), which is managing the Palo Laziale weather station.

2.2. Field Data Collection and Laboratory Analysis

The study was conducted in a forest stand characterized by the prevalence of Quercus pubescens (Pubescent oak). Sampling was carried out by collecting leaves in PVC traps. PVC traps with a systematic-geometric criterion were placed in the forest stand to estimate the annual production of litter mainly constituted by falling leaves. The surface of PVC traps was 0.25 m2 and placed at 0.5 m height [32]. Part of the senescent leaves of Quercus species remained on the tree until December [33]. The harvest of leaves that had already lost their green colour had been made during the maximum leaves fall from November to December of 2019.
The harvested leaves were dried in the air until they reached constant weight. Afterwards, dried leaves were placed inside the nylon-based litterbags (2.5 g of dry leaf material). The decomposition rates were measured using the litterbags approach [34]. Nylon bags measured 20 × 15 cm, with a mesh of 3 mm. These litterbags allowed for the penetration of the microflora, microfauna, and small mesofauna, as well as prevented the loss of litter fragments. On the other hand, they excluded the intervention of the grazing of macrofauna, avoiding the mixing of the litter with the mineral horizon of the soil [35]. This could cause an underestimation in biomass losses, but the decomposition of the litter was mainly driven by fungi and soil microorganisms [36,37], which were not hampered by meshes of this size.
Fifty-four litterbags were placed on the soil of each sampling site (three sites) in May 2020, securing them to the tree trunks with nylon threads and covered with litter already existing on the soil. In total, 3 replicas of each sampling site were then collected after 15, 23, 46, 66, 137, and 159 days (from June to October 2020). Instead, three replicas were brought back to the laboratory and dried in an oven to find the loss of dry material for handling and the initial content of lignin and cellulose at time t0.
The collected samples were dried at 50 °C for 24 h to assess dry leaf weight (g) and the litter reduction over time. Dry biomass at the time, t, was expressed as a percentage reduction of the initial biomass of the litter at the time, t0.
The determination of cellulose and lignin was made according to the Van Soest and Wine method [38,39], which was divided into two phases: the preparation of the fibre resistant to acids and detergents (ADF), and their subsequent oxidation with permanganate. The ADF was processed by using the FIWE6 fibre extractor (Velp Scientifica Srl, Usmate, Italy) and was expressed as the remaining weight (g) of litter organic matter to the initial leaf litter biomass. The structural macromolecules (cellulose, hemicellulose, lipids, sugars) had been gradually eliminated from the initial litter biomass through treatment with an acid detergent until only lignin was obtained. Further, cellulose and lignin were expressed as remaining weights (g) to the initial values.
The experimental time was imposed by the focus of the study, which was turned to demonstrate that under limiting conditions of temperature and precipitation, the functions that define the CDIs were not usable in themselves but must be modified to correctly simulate the observed reduction of the remaining leaf litter biomass.

2.3. Decomposition Model

Here, litter decomposition was characterized by different decomposition rates of its two main constituents: lignin (recalcitrant litter) and cellulose, hemicellulose, and soluble components (labile litter). Decomposition rates varied over time and as a function of climatic conditions (CDI effects). On this theoretical basis, the model was built and organized into various sub-modules that could be interconnected to explore multiple processes that interact mutually at the same time. Among the innovations was the influence of vegetation on the calculation of the Relative Soil Water Content (RSWC) as a function of the vegetation density of the area, expressed as Fractional Vegetation Cover (FVC) and calculated based on the Normalized Difference Vegetation Index (NDVI).
The model used in this study has been performed on a dynamic semi-empirical model based on Olson’s negative exponential equation (Equation (1)) [30] and developed by Vitale et al. [40], and was subsequently modified to be applied to the dynamics of the forest site of the Palo Laziale Wood.
M t = M 0 e k t
In the model, it was assumed that the initial organic matter (M0) was composed of two main substrates qualitatively different and with different decomposition rates: (k) lignin (recalcitrant pool) and cellulose, hemicelluloses, and soluble compounds (labile pool) [40]. M0 was divided in two pools (M1 and M2) defined by the initial lignin fraction (w) of the litter. M1 (Equation (2)) and M2 (Equation (3)) were calculated as follows:
M 1 = M 0 1 w
M 2 = M 0 w
The decomposition process was then simulated according to the climatic, forest structure, and edaphic characteristics (Figure 1) of the sampling sites. The model embodied several interacting modules and was integrated by ground and satellite inputs. The entire modelling system was developed in the graphic-visual language STELLA 9.0 software (Isee systems Inc., Lebanon, NH, USA).
The equations of the various modules that compose the model are described below.

2.3.1. Climatic Module

It was composed of the input climate parameters directly recorded by the Palo Laziale weather station. The considered meteorological parameters were average daily temperature (T, °C), daily cumulative precipitation (Prec, mm), daily solar radiation (RAD, MJ/m2), and the reference evapotranspiration (Et0, mm).

2.3.2. Hydrological Module

The hydrological module allowed for simulating the Relative Soil Water Content (RSWC, mm/day) in the first 30 cm depth of soil. RSWC directly affected the growth and productivity of vegetation, while it indirectly influenced the functional activities of the entire ecosystem by acting on microbial activities and the state of the soil [41].
RSWC is calculated (Equation (4)) [42] as follows:
R S W C = F V C 0.5 + 0.5 A W + 1 F V C A W  
RSWC was a function of the vegetation density, which was assessed through the satellite-based Fractional Vegetation Cover (FVC) (Equation (5)) and the soil water availability was defined by the scalar water stress index (AW) (Equation (6)) [43].
F V C = N D V I N D V I m i n N D V I m a x N D V I m i n
A W = P r e c E t 0
AW varied between 0 and 1, which corresponded to stress and non-water stress conditions, respectively.
Normalized Difference Vegetation Index (NDVI) values were extrapolated from Sentinel 2 images using the Google Earth Engine (Figure S1—Supporting Materials).

2.3.3. Decomposition Module

The decomposition module allowed for simulating the mass loss of the litter as a function of time and climatic conditions. It was calculated according to Equation (7):
M t = M 1 e k 1 C D I i t + M 2 e k 2 C D I j t
where Mt was the quantity of leaf litter biomass at time, t, and M1 and M2 were the original amounts of the labile and the recalcitrant pools (obtained by sampling), respectively. In the decomposition process, labile and recalcitrant pools (fast and slow fractions) changed over time at different rates. For this reason, two different rates, k1 and k2, (associated with the labile and the recalcitrant pools, respectively) were considered. The CDIi,j was the climate decomposition index [28], specific for each pool and adapted to local climatic conditions.
The equations describing decomposition rates for each pool (M1 and M2) were obtained by interpolation of decomposition rates (g/day), for the fast and slow fractions, and estimated from the leaf litter biomass losses during the entire experimental period (Equation (8)):
k t = ln M 0 ln M t t
where k(t) was the decomposition rate (gbiomass/day), M0 was the initial mass (g), and Mt is the mass (g) at time t (days of the year).
The empirical curves describing decomposition rates k1 (Equation (9)) and k2 (Equation (10)) over time had been obtained by the best-fitting procedure performed by CurveExpert 1.4 software (Hyams Development) and absolute values were considered, acknowledging that a reduction of biomass in time corresponded to a positive decomposition rate.
k 1 t = A B S 1 1.453 × 10 4 + 1.093 × 10 4 × t 4.956 × 10 2
k 2   a c c t = A B S ( 1.613 × 10 5 + 7.433 × 10 2 × t ( 1 + 1.365 × 10 5 × t 4.197 × 10 2 × t 2
where k1 (t) and k2 acc (t) described the observed trends of the labile and recalcitrant leaf litter biomass components both acting during the first decomposition period.
To be able to complete the development of the model and ensure the trend of slow fraction (M2) was more realistic under limiting environmental conditions, it was added the k2 deg (t) decomposition rate (Equation (11)), which described the degradation rate of the lignin when k2 acc (t) = 0. Equation (11) derived from Vitale et al. [40], after conversion to gbiomass/day, who conducted the experimental decomposition assessment under climatic conditions similar to those of the present work:
k 2   d e g t = 1.111 × 10 3 + 2.364 × 10 5 × t + 4.067 × 10 8 × t 2
Decomposition rates increased with rising humidity and temperature; however, these relationships could have been different under extreme conditions. For example, high temperature and low rainfall could have caused dryness stress, thus reducing the decomposition rates. These climate-based interactions were described here through the CDI (Equation (12)):
C D I = f R W C × f T i
The soil moisture effects f(RWC) (Equation (13)) were simulated according to Del Grosso et al. [25]:
f R W C = 5 × 0.287 + arctG π × 0.09 × R S W C 17.47 π  
Three different temperature effects f(T)i—based functions, suitable for the Mediterranean conditions, were used to simulate the effect of temperature on decomposition. The three functions affecting decomposition rates during the summer period were calculated as follows (Equations (14)–(16)):
f T a r c t a n = 0.56 + 1.46 × arctan π × 0.0309 × T s o i l 15.7 π
f T L T = 0.576 × e 308.56 × [ ( 56.02 ) 1 271 + T s o i l 227.13 1 ]  
f T l i n e a r = 0.198 + T s o i l × 0.036
The arctan function ( f T a r c t a n ) [27] was normalized to 1 when the soil temperature reached 30 °C. The Lloyd-Taylor function f T L T [44] for the Q10 demonstrated a marked sensitivity to the temperature, reaching to triple the rates of decomposition beyond 30 °C. The linear function f T l i n e a r [28] was not normalized.

3. Results

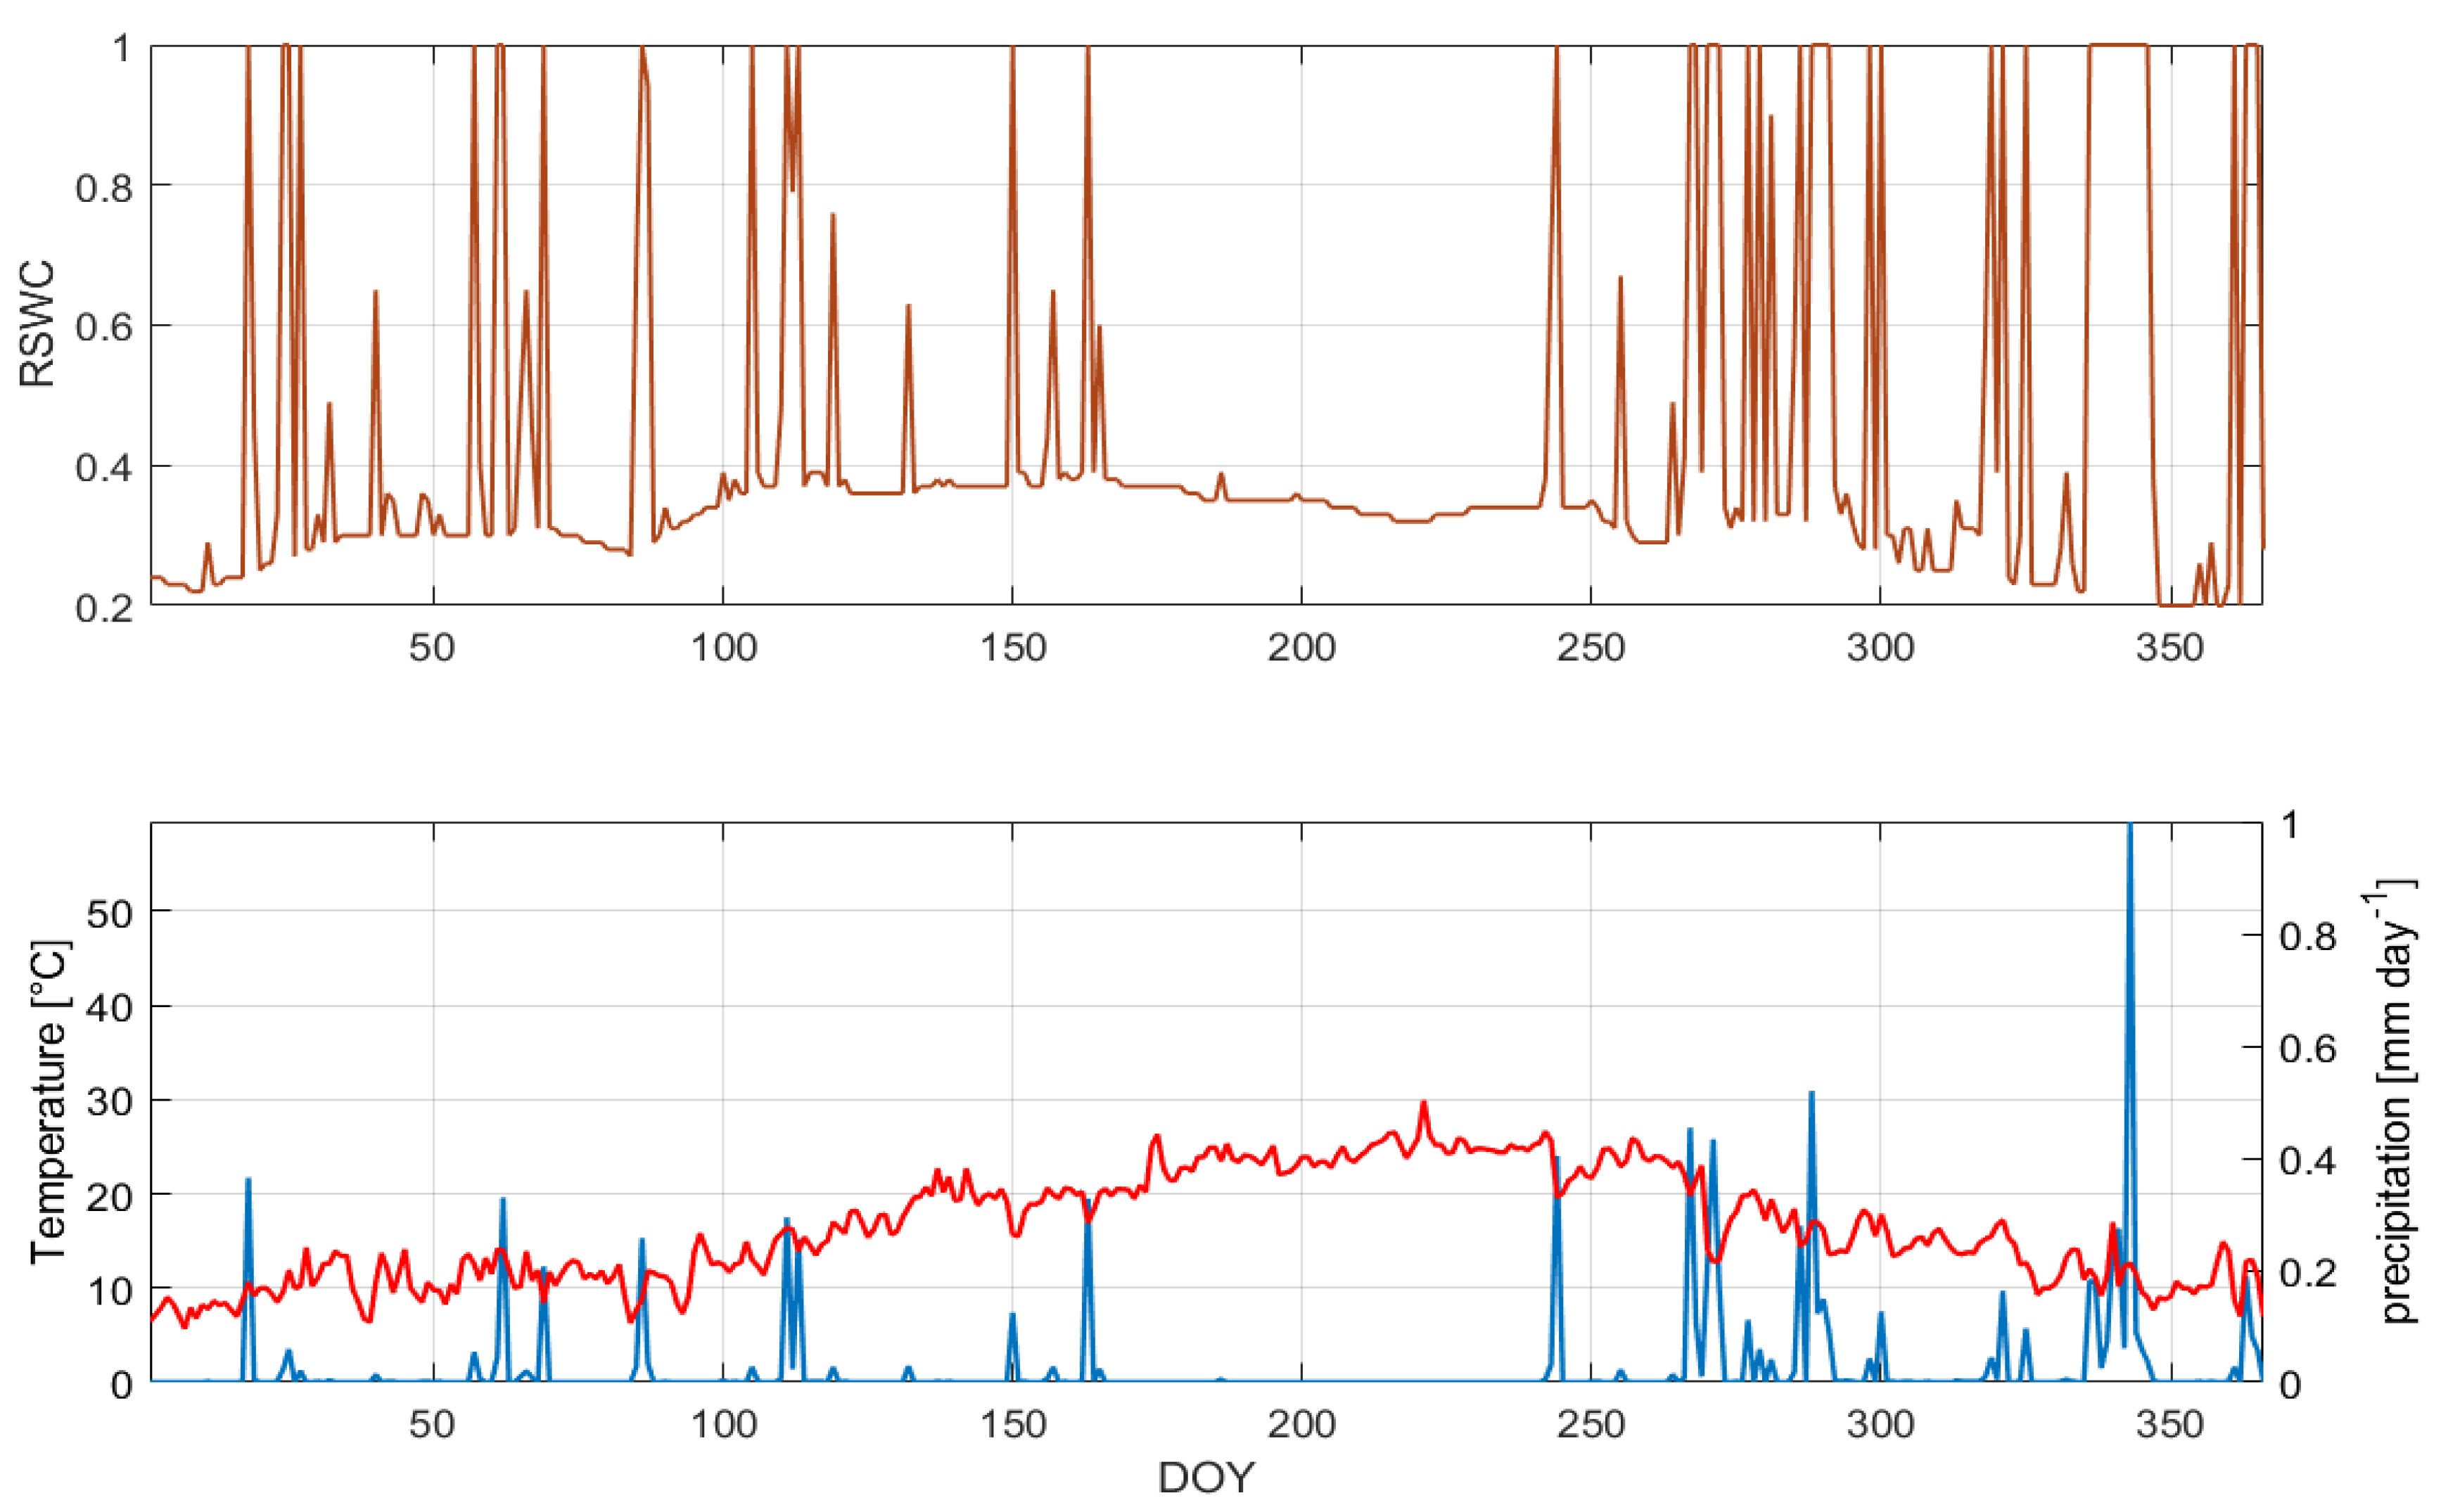
3.1. Climatic Condition and Relative Soil Water Content

The Lazio Region (Italy) in 2020 was characterized by high temperatures and low precipitation, which influenced the water availability in the soil (Figure 2). The annual average value of the RSWC was 0.42; during the summer period (21 June–21 September) the average recorded value was 0.35, while during the sampling period (14 May–23 October) the average value of the RSWC was 0.41. The cumulative precipitation measured during the sampling period was 226 mm, but 169 mm was cumulated between September and October. Instead, the average annual temperature was consistent with the last 10 years’ trend (Table S1—Supplementary Materials).

3.2. Decomposition Dynamics

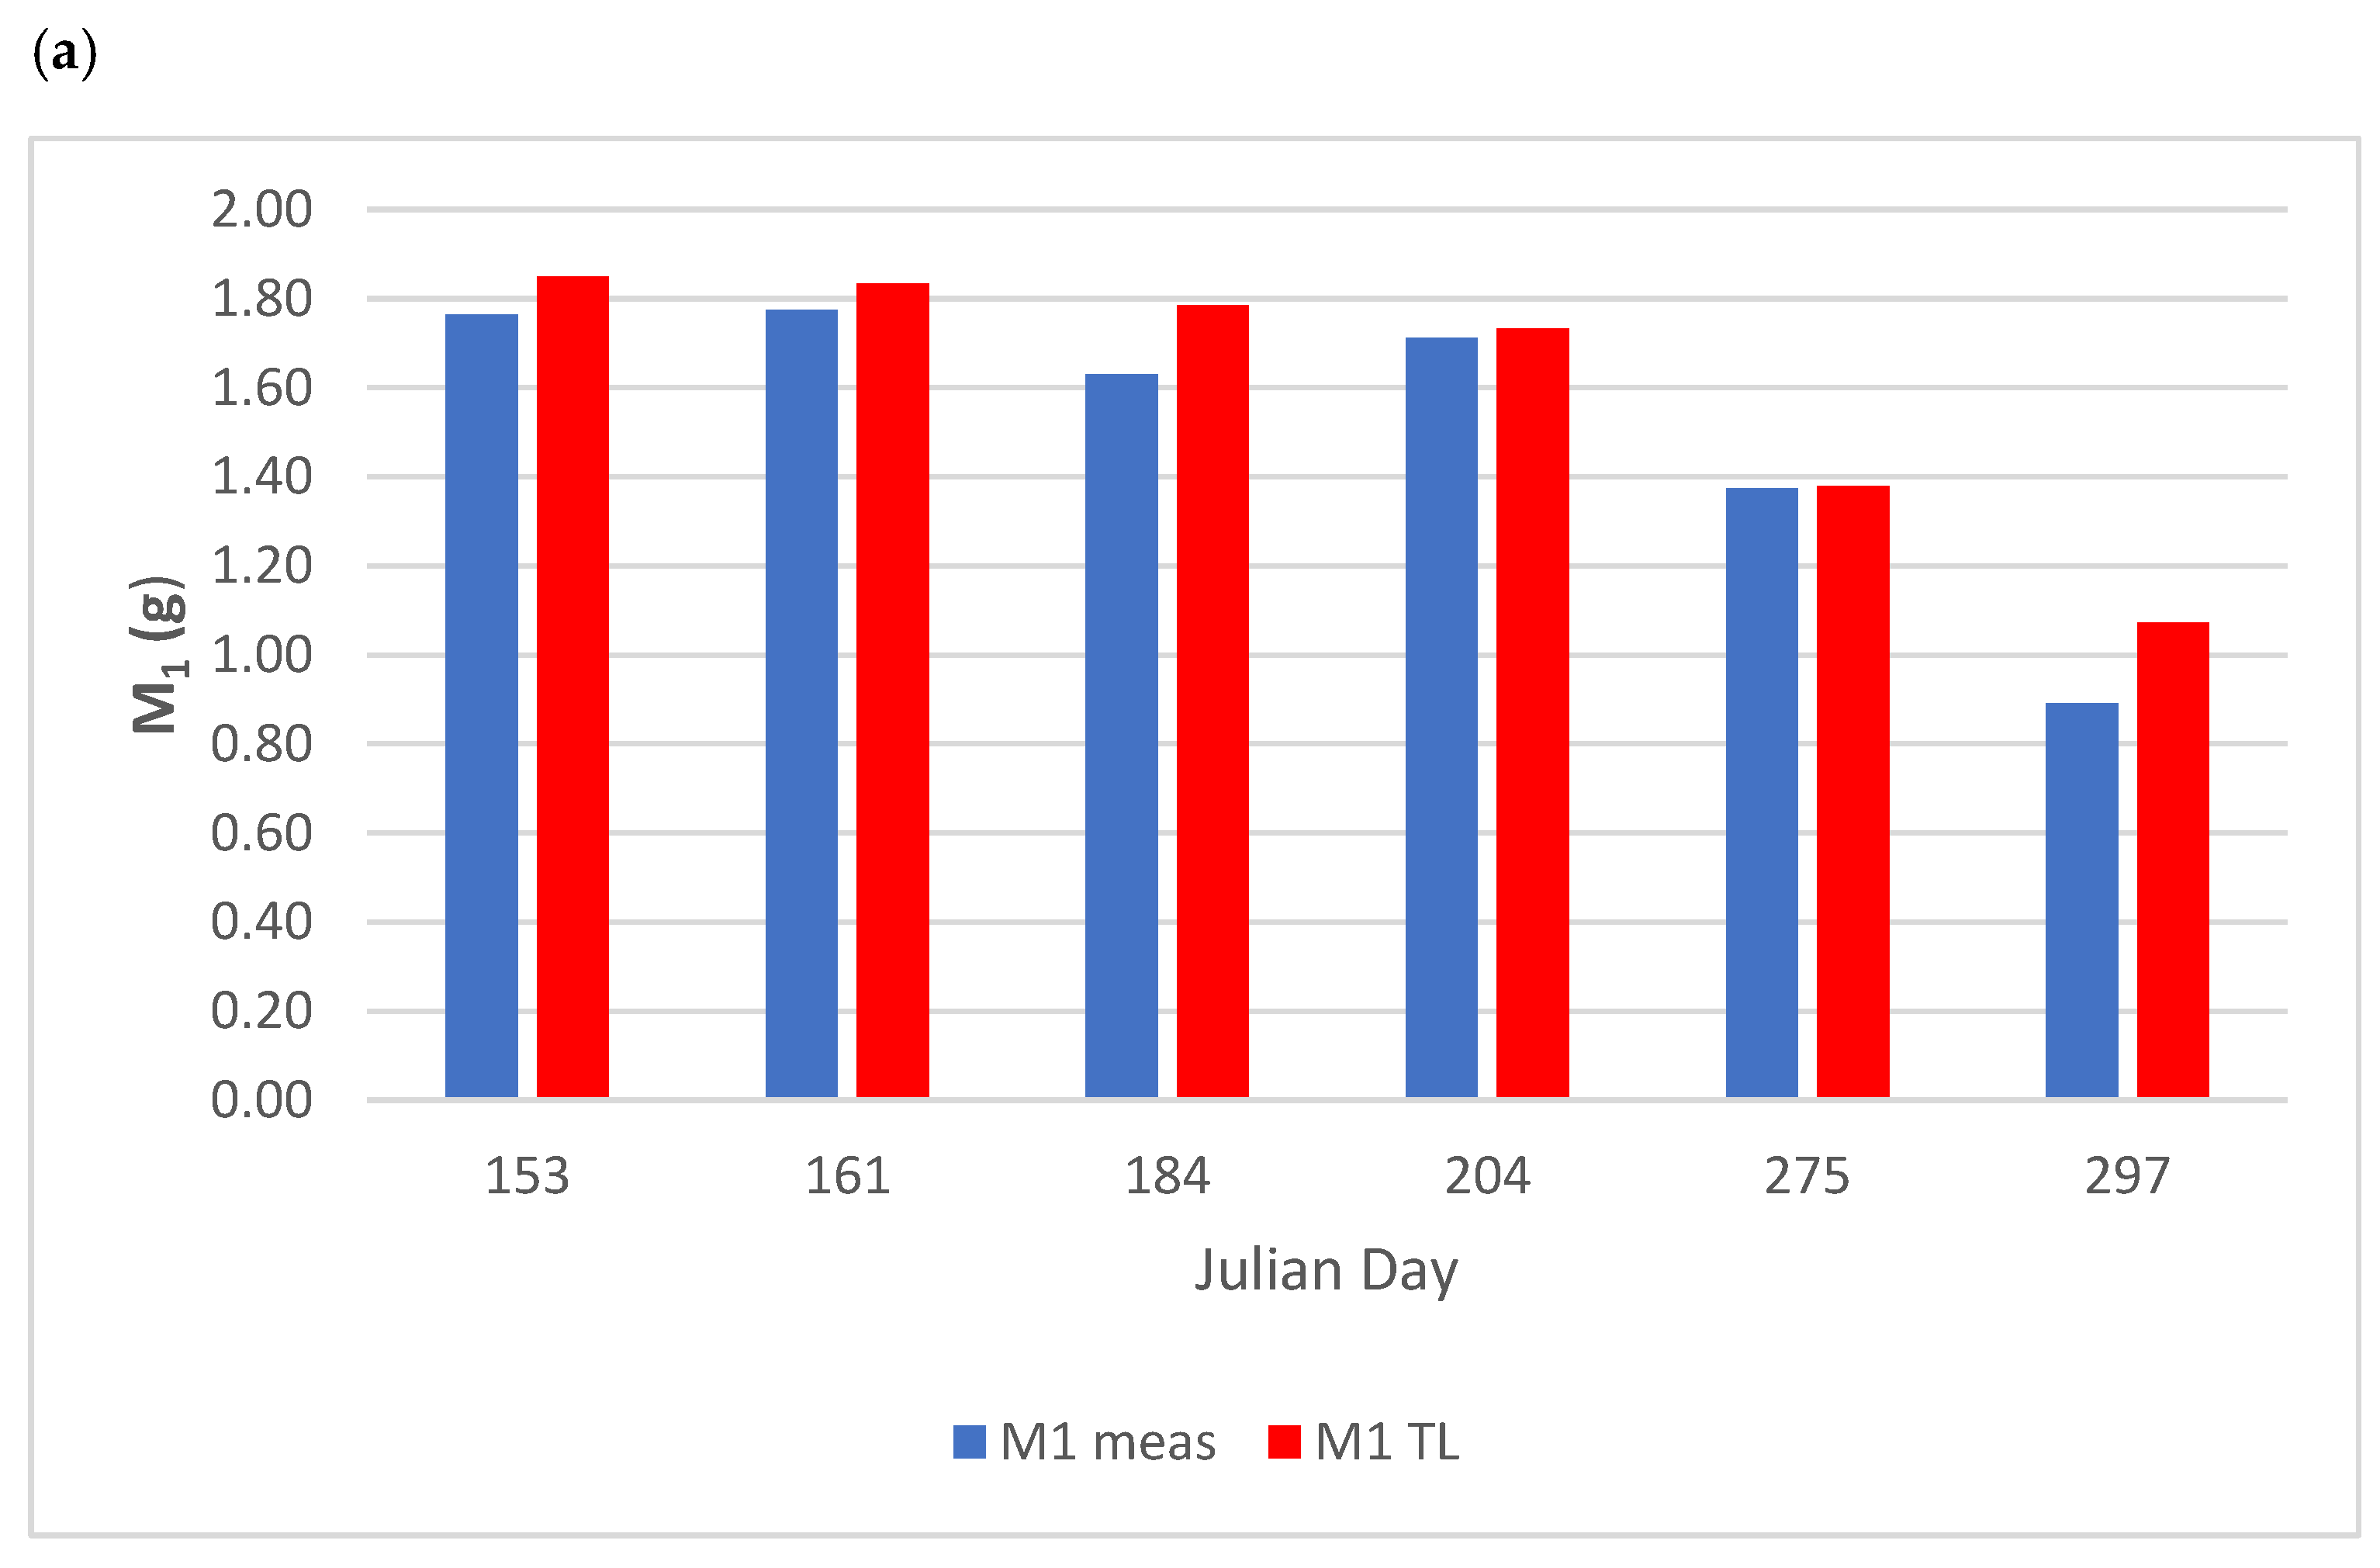
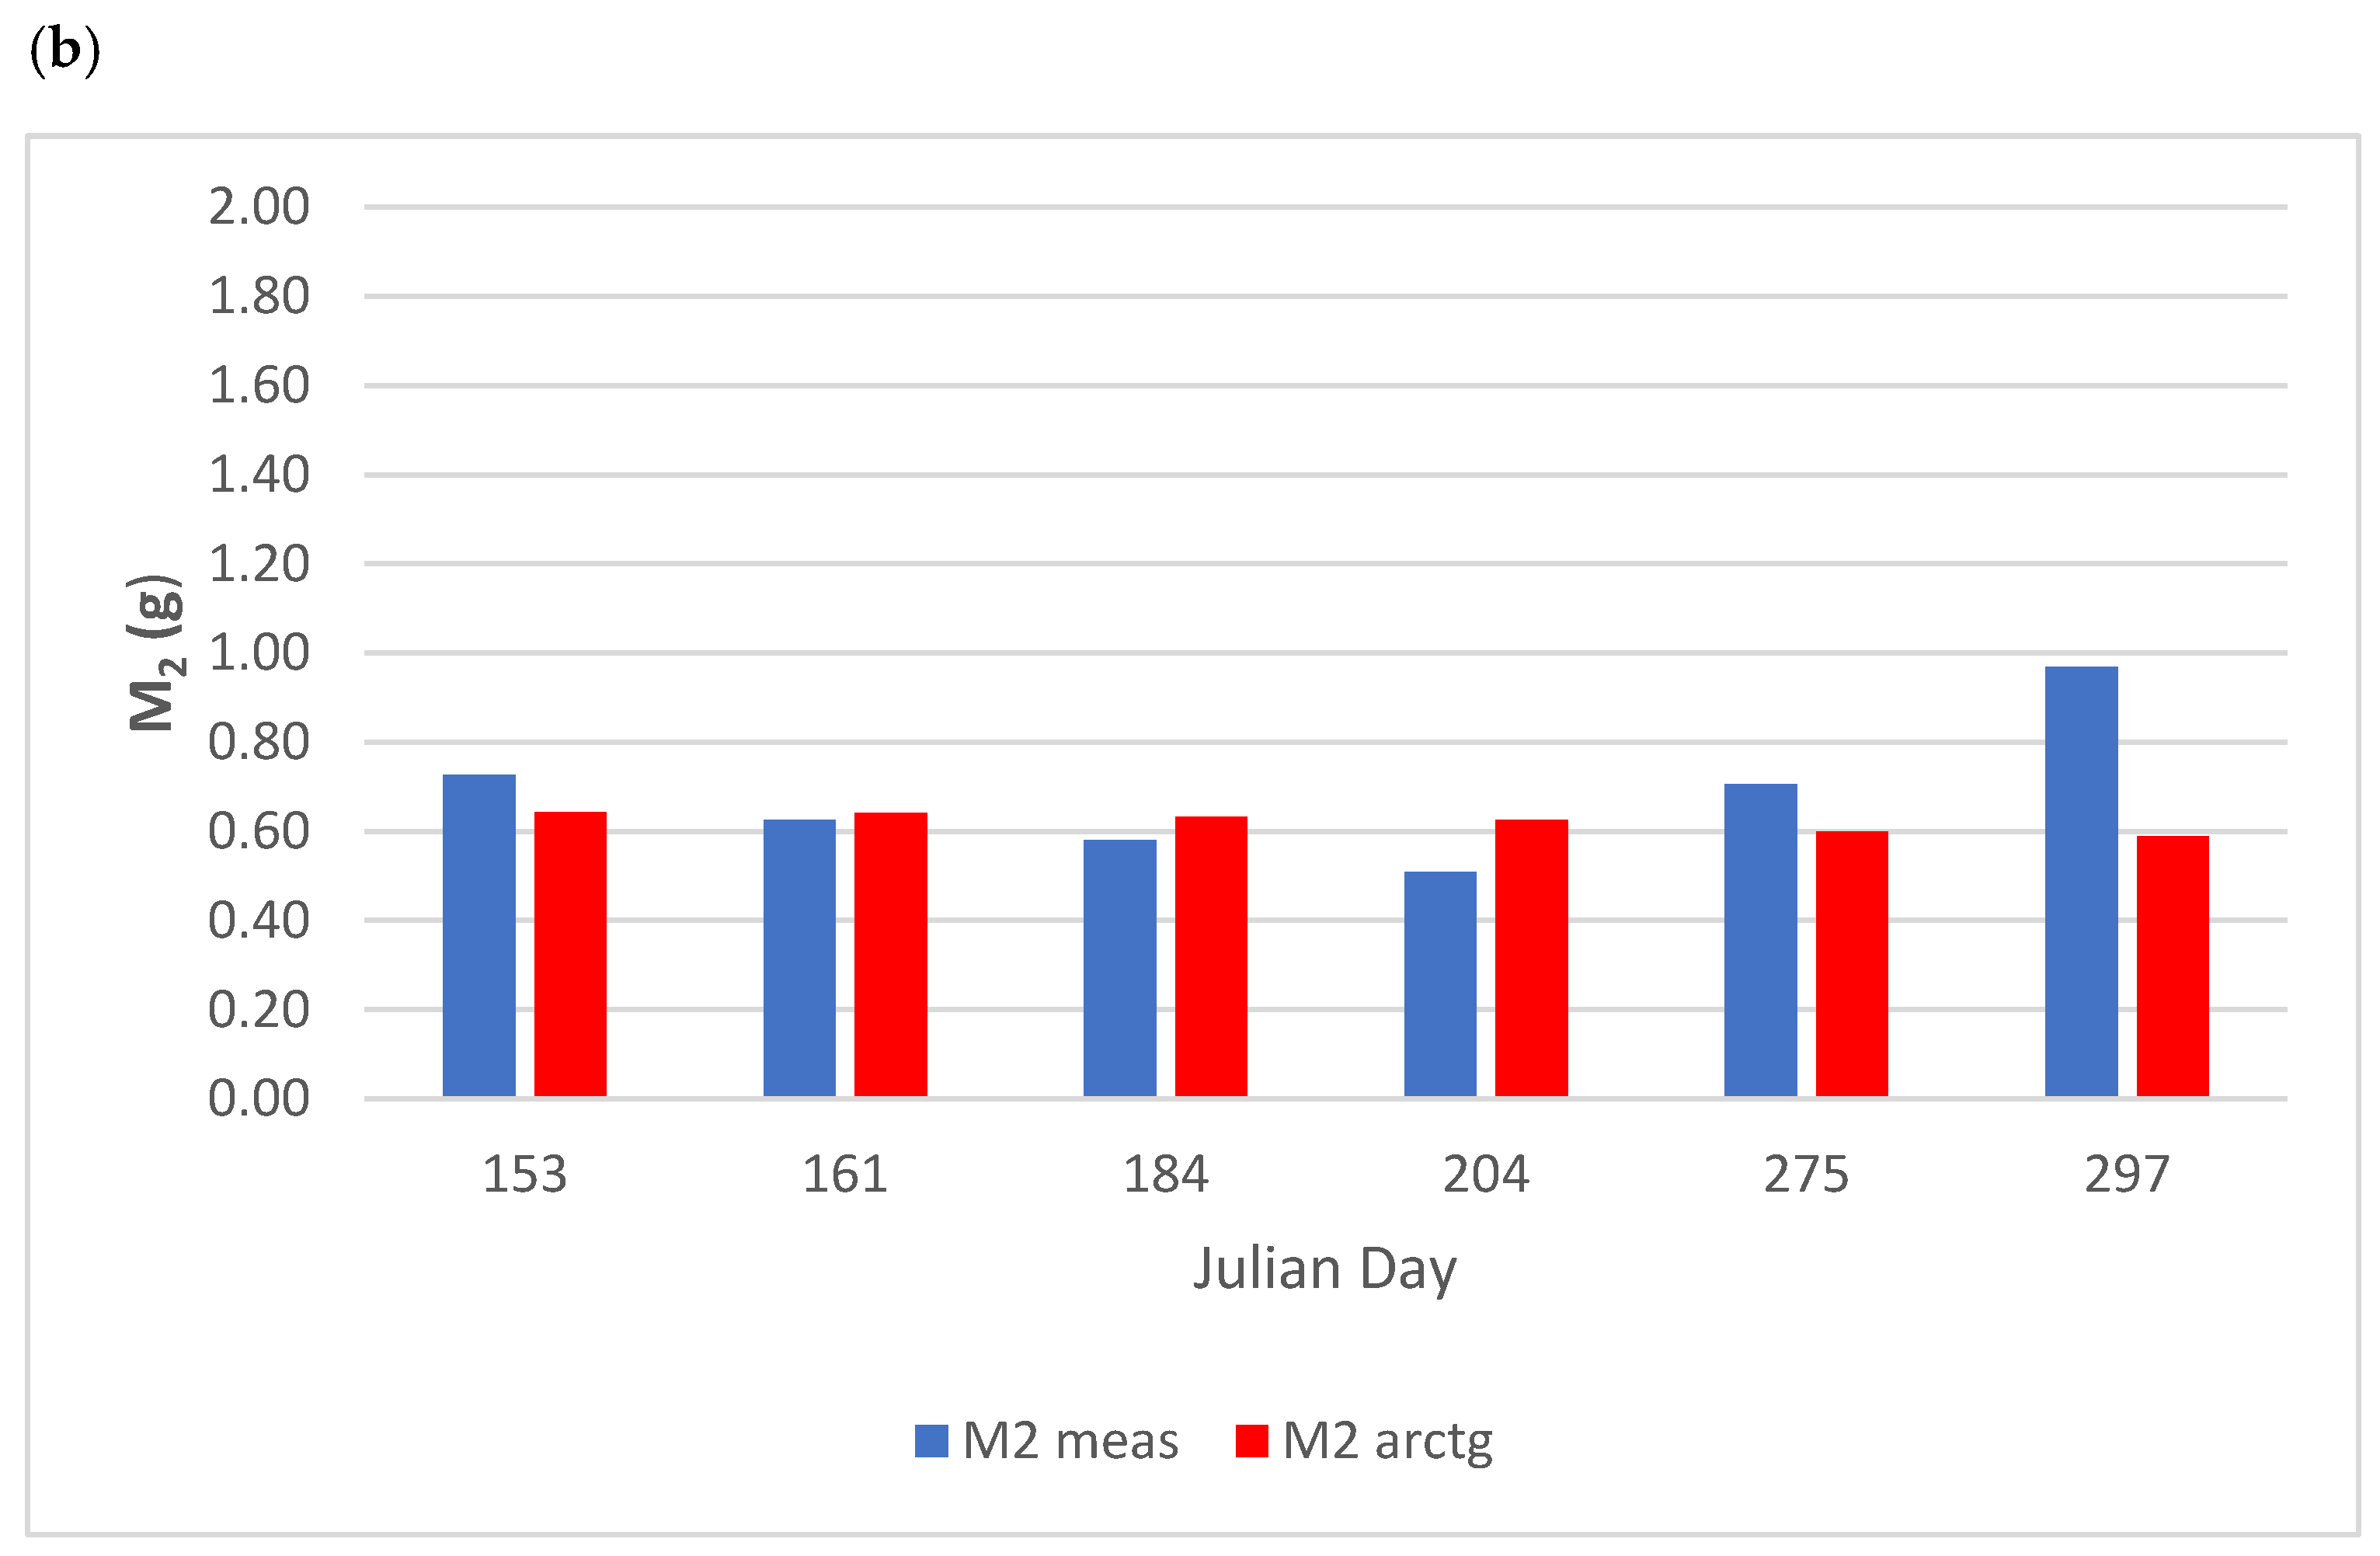
3.2.1. Biomass Variation

Table 1 reports data on the biomass losses during the experimental period (June 2020–October 2020), either in weight or as the remaining percentage calculated from the initial leaf litter biomass dry weight (2.5 g).
After 159 JDs the total leaf litter biomass loss was only 25% (Table 1). On day 153 there was a minimal loss of biomass (−0.2%). The greatest percentage variation was measured between days 275 and 297 (−8.6%).

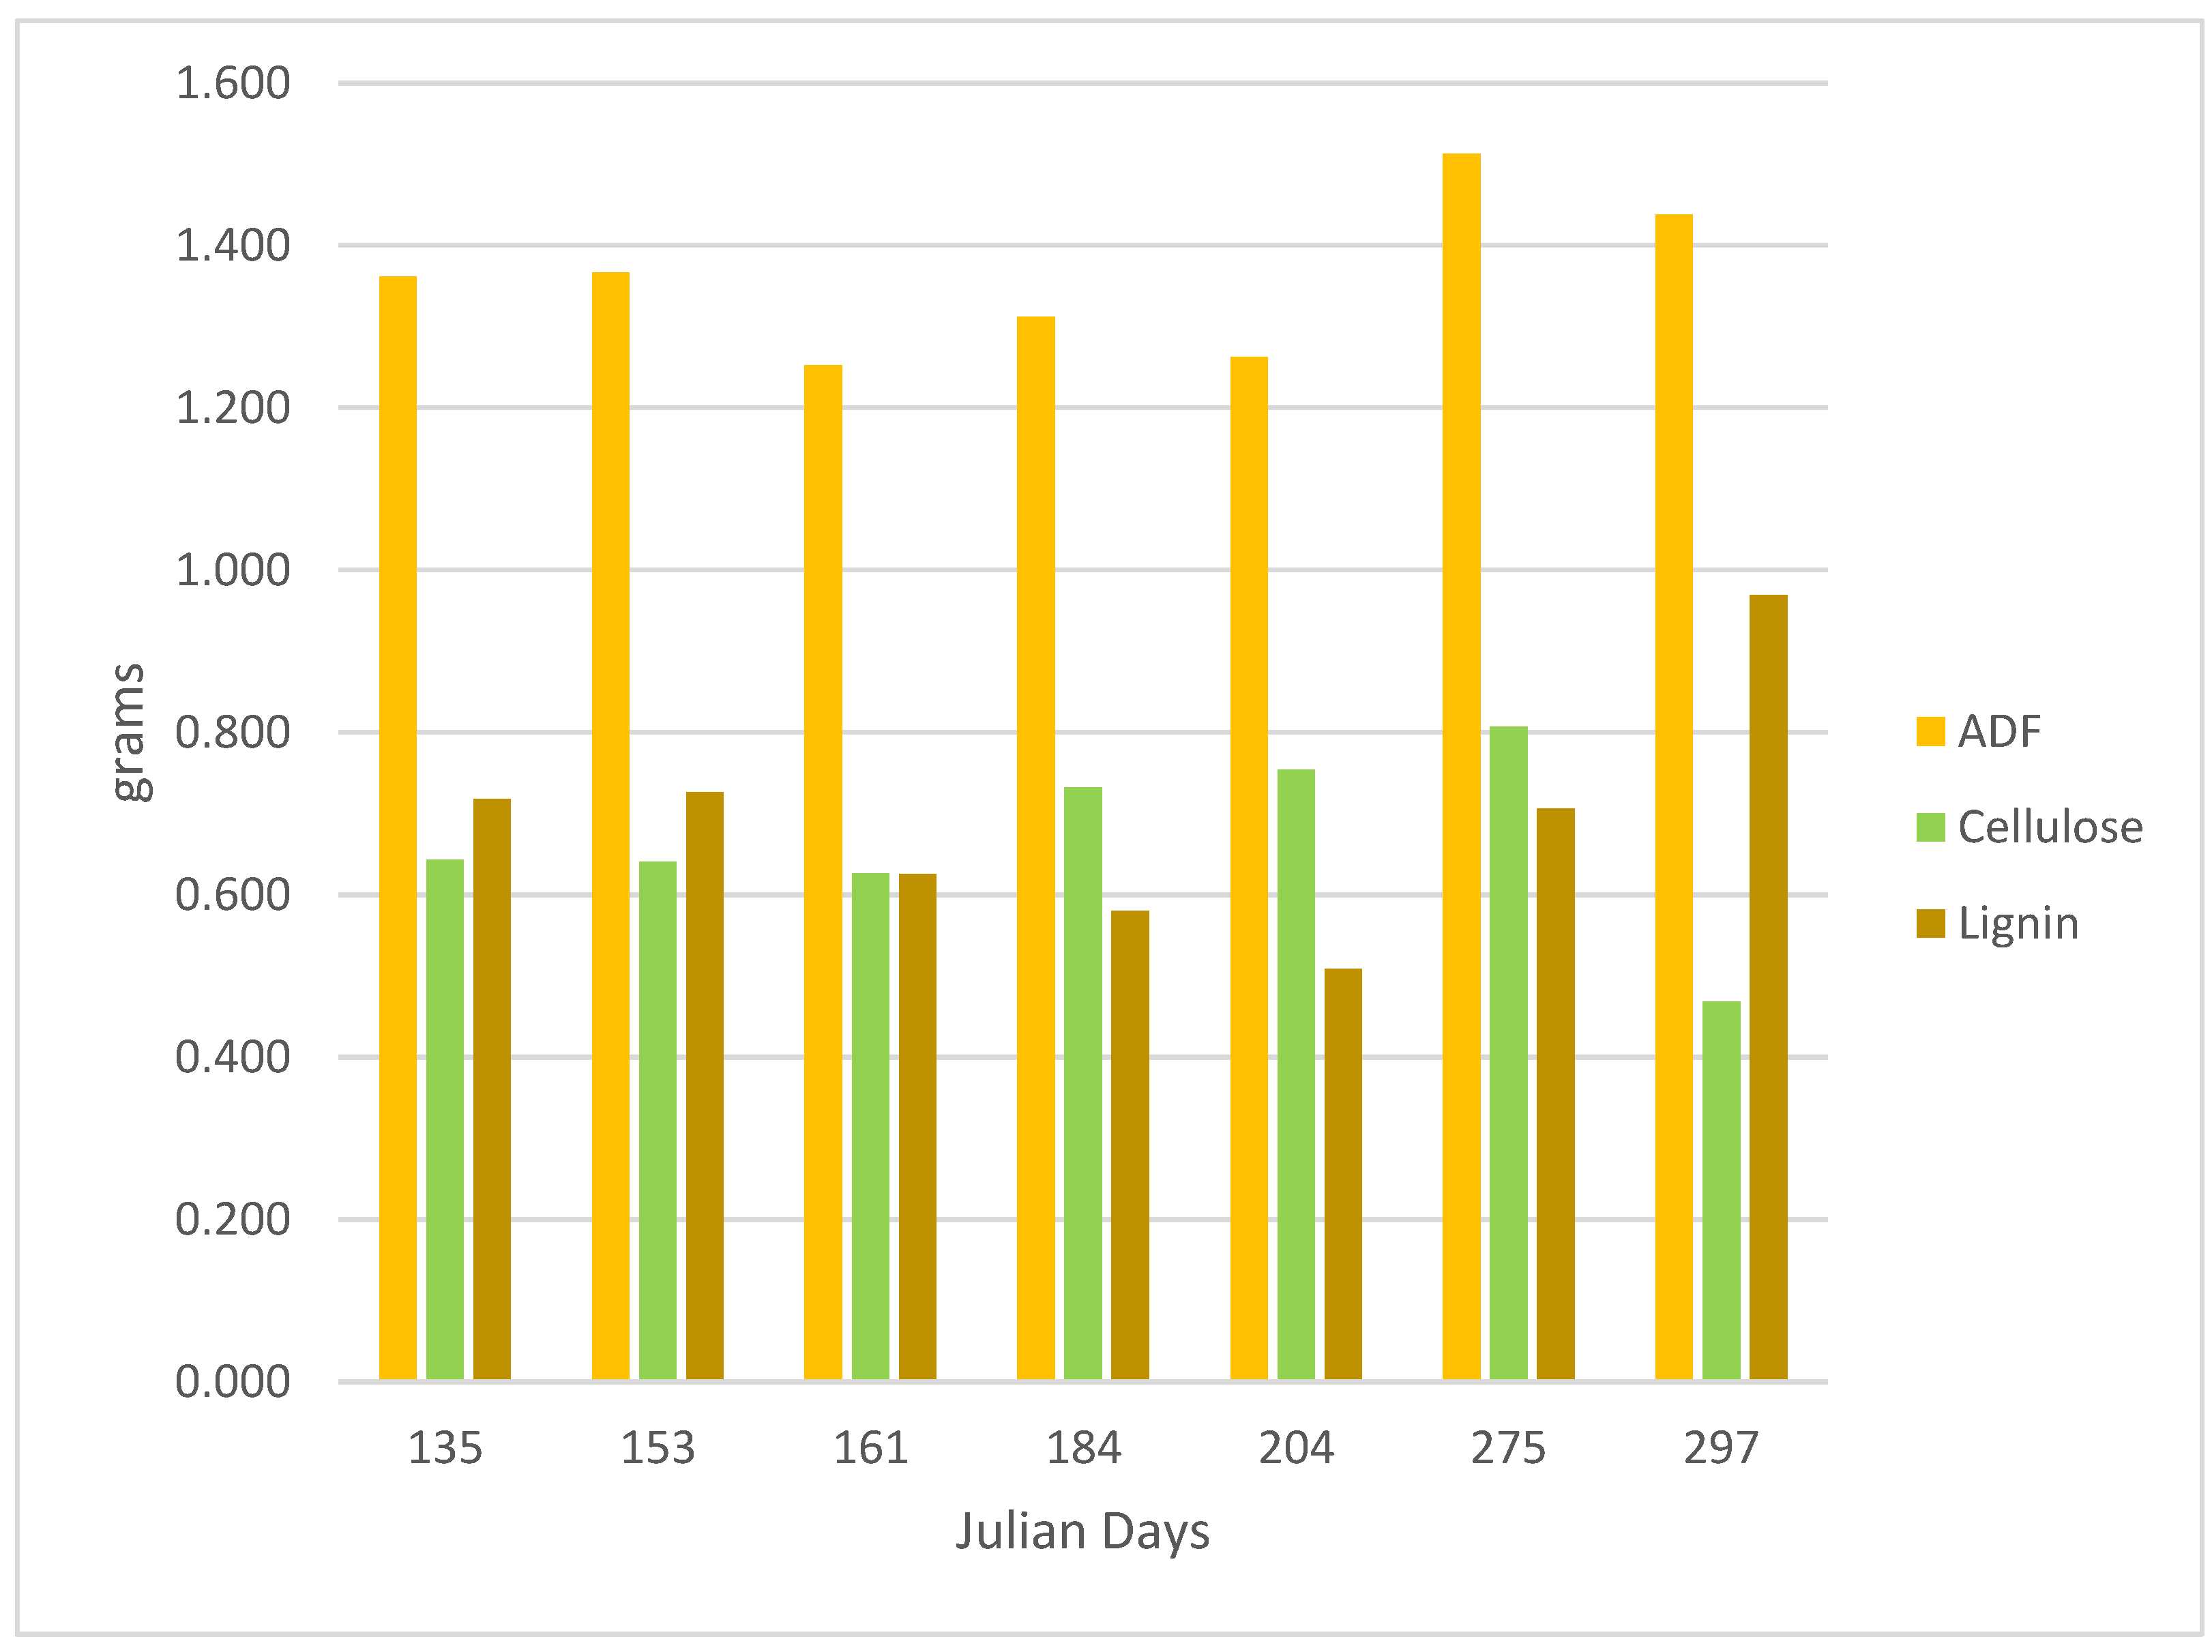
3.2.2. ADF, Cellulose, and Lignin Variations

The variation of the leaf litter biomass components found during the sampling period is shown in Figure 3.
ADF (acid-resistant fibres) followed the course of its components being the sum of cellulose and lignin. The final ADF increasing trend was not a real accumulation, due to the acid-resistant fibres rising. In fact, during the decomposition decaying labile compounds were degraded and the percentage of the acid-resistant fibres increased gradually to the initial weights of leaf litter biomass. Cellulose showed a temporal trend that highlighted constant values with a beginning of decomposition only after 144 days of exposure (275 JD), where cellulose losses were equal to 27.1% of the initial weight (Figure 3). The lignin values (referring to the amount of substance remaining in the sample after degradation of the labile leaf compounds, such as hemicellulose and soluble compounds) showed a weight-based increase only after 144 days of exposure. At the end of the sampling time, lignin showed an increase of 34.95% to the initial weight.
Decomposition rates (k) as a function of time derived from the fibres’ content. Curves of k1 and k2 had been formulated using data from the fast (M1) and slow (M2) pools. Thus, the best model describing the development of its decomposition rate (k1) for the fast decomposition compartment (M1) was shown in Figure 4.
As previously mentioned, the decomposition rate of the slow fraction (k2) was described according to two different curves. It had been used a rate that described the observed lignin trend k2 acc (Figure 5, Equation (10)) using the sampling data, while for the no observed data, it had been used as a rate describing the compounds’ degradation k2 deg (Figure 6, Equation (11)). The k2 acc simulation showed that the lignin degradation rate finished at 220 JD, when k2 acc = 0 (Figure 5), although its initial rate was high (about 0.005 g/day). The best k2 acc fitting model was not able to simulate well the decomposing rates of recalcitrant compounds under extreme arid conditions.
The k2 deg (t) simulation instead showed an increasing in the decomposition trend of recalcitrant compounds after 220 JD and reached the maximum values around 300 JD. Therefore, the use of two k2 decomposition rates noted that the first (k2 acc (t)) was simultaneously operating with k1(t), and successively k2 deg (t) should become fully operative when all non-recalcitrant compound degrade.
In the decomposition model, the CDI was multiplied by the decomposition coefficients k1 and k2, with the consequent effect of favouring or reducing the decomposition dynamics. The three functions f(T)i were simultaneously applied to the M1 and M2 pools (Table S2—Supporting Materials). Through the combination of different functions, the CDI that best simulated the trend of measured data was chosen.
The goodness of the model was based on both R2 and the mean square error (MSE); for the same R2, those with lower MSE were chosen (Table 2). For the M1 pool, the curve that best interpolated the measured data was the CDI LT (Figure 7a), while for the M2 compartment it was the CDI arctan curve (Figure 7b).
The equation that best described the decomposition process in the Palo Laziale Wood was given by Equation (17), as follows:
M t = M 1 e k 1 C D I L T t + M 2 e k 2 C D I a r c t a n t
Figure 8 reported the dynamics of the measured and simulated leaf litter biomass losses. The student t-test (t = −0.127, p = 0.901) demonstrated that this model could predict the leaf litter biomass losses over time. Furthermore, Figure 8, noting particularly the biomass losses represented by both constituents M1 and M2, highlighted that the greatest variation between the observed data and the simulated ones occurred during the period of maximum drought of the year.

4. Discussion

The first feature of the discussion is that, although the proposed model for estimating the litter decomposition for a Mediterranean forest stand could consider the exceptional conditions of temperature and low rainfall measured during the study period, the contribution of the M2 component was almost zero (Figure 7). One of the causes could be due to the soil water content, given the low values during the sampling period (0.35 median value, 10th percentile 0.32, and 90th percentile 0.71) having negatively affected the trend of the decomposition rates: k1 (extremely low decomposition rate 10−4 g day−1) for the fast fraction (M1) and k2 (10−5 g day−1) for the slow decomposition fraction (M2). The decomposition rates were extremely low when compared with bibliography data. Mixed Mediterranean forests of the Latium region (Italy) had recorded decomposition average rates equal to 10−3 g day−1 [40]. It is a fact that 2020 was a year characterized by an abnormal drought due to low rainfall when compared to the previous years’ rainfall trend. As seen above, when comparing this year with previous ones, the temperature trend was consistently increasing. While rainfall was particularly low in 2020 (540.8 mm) when compared with the previous ten years, the values recorded in 2020 were explanatory of the following years. In fact, in 2021, despite a larger amount of annual rainfall (638.4 mm), the frequency was abnormal (354.6 mm from January to October, and 200 mm in November). Partial climatic analysis (January to July) performed for the current year, (2022) showed that this year was more arid than the previous ones, thus highlighting a progressive hardening of climate towards more limiting conditions. Therefore, such dry conditions may have reduced the number of decomposing microorganisms, as reported by Walter [45]. Reduced colonization of the leaf litter through the decomposer community caused very low k1 and k2 decomposition rates.
One of the working hypotheses was based on the possibility that the litter decomposition in the Palo Laziale Wood occurred by the condensation water that would be formed within the night/day temperature range. Dew in the soil could allow for decomposing of the litter under extreme drought conditions. Several manipulation experiments have shown that the combination of high temperature and lower rainfall carried out reductions in soil water availability [46,47]. Consequently, this had effects on nutrient balance and carbon-based ecosystem processes, such as litter production and decomposition dynamics [7,48,49]. The soil texture of the sampling sites affected the soil field capacity, which had been calculated as 27.7% (on average), and, therefore, was not able to keep water in the soil for the local saprophyte communities. Local conditions could also be influenced by the plant community identity and composition, which involved moisture change and nutrients by changing decomposition at a local scale [15].
In this context, another important variable to consider was the Leaf Area Index (LAI; Figures S1 and S2—Supplementary Materials and methods reported in [50]) of the forest canopy. During the sampling period, the LAI mean value was 2.50 ± 0.32 m2/m2, and since the vegetation cover intercepted the scarce precipitations, the contribution of these to the soil water content was practically zero, contributing to slowing down the litter decomposition process. In the decomposition model, these phenomena were described by using the fRSWC parameter (see Figure 1), proving its ability to consider structural and functional factors affecting the litter decomposition process. As a result, the CDI calculations were affected by variations of the M components; during the sampling activities, the limiting water availability in the soil negatively affected the M2 component, which was represented by recalcitrant compounds.
The possibility to choose the CDI that best reproduced the trend of the measured data for each pool (M1 and M2) highlighted differences between the observed and simulated trends of the biomass loss curves. This result was attributable to the peculiar climatic conditions that occurred during the sampling year, which did not make it possible to use these indices, due to the strong leaf litter dependence on local climate conditions.
In summary, although different climatic conditions occurred in 2020 compared to previous years, this year could not be considered abnormal, but representative of the upcoming years that will be characterized by these extreme conditions [51]. As shown by the soil water content (RSWC) data, the rainfall reduction caused a significant level of drought; this was a consequence of the occurring climate change, which could not be underestimated in the development of forecasting models. The reduced biomass losses under extreme environmental conditions led to a discontinuous degradation of the organic substances with consequent repercussions on the carbon cycle of the forest stand. In the litter decomposition model, the climate decomposition index (CDI), which stimulated or reduced decomposition rates based on precipitation and temperatures [26], was applied by a combination of these to the two pools characterized by recalcitrant (lignin) and non-recalcitrant compounds (ADF and cellulose). There was a comparison between the biomass reduction over time and the simulated highlighted reduced performance of the CDI in reproducing the biomass loss of the recalcitrant compounds in the M2 pool under limiting climatic conditions and low soil field capacity.
Finally, in this study, we observed an over-estimation of simulated to measured M(t), which is caused by a reduced decomposition rate (k2) of the M2 pool; the result of these systematic deviations in the model predictions under strongly limiting conditions should be taken into consideration when decomposition modelling is applied in similar climate conditions.
To better understand the impact of climate change on the decomposition process, we strongly suggest conducting long-term studies (minimum periods of at least 2/3 years) in future investigations focused on Mediterranean-type areas.

5. Conclusions

In conclusion, the modified Olson’s model may be considered sufficiently able to predict the progress of the decomposition process, but it must be integrated with the collection of further data focused on the careful calibration of the CDIs also fulfilling the extreme climate conditions. When the CDIs will be adequately changed, the modified Olson’s model will be a solid starting point for the predictions of litter decomposition, as well as a valid support to provide useful information for possible ecological restoration actions.

Supplementary Materials

The following supporting information can be downloaded at: https://www.mdpi.com/article/10.3390/soilsystems6040081/s1, Table S1: Climate time series of Palo Laziale Forest. Figure S1: Palo Laziale daily NDVI; Table S2: M1 and M2 simulation values; Figure S2: Palo Laziale leaf area index.

Author Contributions

Conceptualization: M.R. and M.V.; methodology: D.L., M.R. and M.P.; data curation: M.P.; laboratory analysis: M.R.; modelling analysis: D.L.; writing—original draft: M.R. and M.P.; writing—review and editing: D.L. and M.V.; supervision: M.V. All authors have read and agreed to the published version of the manuscript.

Funding

This research received no external funding.

Informed Consent Statement

Not Applicable.

Data Availability Statement

Not Applicable.

Conflicts of Interest

The authors declare no conflict of interest.

References

  1. Bradford, M.A.; Wieder, W.R.; Bonan, G.B.; Fierer, N.; Raymond, P.A.; Crowther, T.W. Managing Uncertainty in Soil Carbon Feedbacks to Climate Change. Nat. Clim. Chang. 2016, 6, 751–758. [Google Scholar] [CrossRef] [Green Version]
  2. Zhang, T.; Luo, Y.; Chen, H.Y.H.; Ruan, H. Responses of Litter Decomposition and Nutrient Release to N Addition: A Meta-Analysis of Terrestrial Ecosystems. Appl. Soil Ecol. 2018, 128, 35–42. [Google Scholar] [CrossRef]
  3. Zhang, M.; Cheng, X.; Geng, Q.; Shi, Z.; Luo, Y.; Xu, X. Leaf Litter Traits Predominantly Control Litter Decomposition in Streams Worldwide. Glob. Ecol. Biogeogr. 2019, 28, 1469–1486. [Google Scholar] [CrossRef]
  4. Bonan, G.B.; Hartman, M.D.; Parton, W.J.; Wieder, W.R. Evaluating Litter Decomposition in Earth System Models with Long-Term Litterbag Experiments: An Example Using the Community Land Model Version 4 (CLM4). Glob. Chang. Biol. 2013, 19, 957–974. [Google Scholar] [CrossRef]
  5. Chapin, F.S.; Folke, C.; Kofinas, G.P. A Framework for Understanding Change. In Principles of Ecosystem Stewardship; Springer: New York, NY, USA, 2009; pp. 3–28. [Google Scholar]
  6. Cai, A.; Liang, G.; Yang, W.; Zhu, J.; Han, T.; Zhang, W.; Xu, M. Patterns and Driving Factors of Litter Decomposition across Chinese Terrestrial Ecosystems. J. Clean. Prod. 2021, 278, 123964. [Google Scholar] [CrossRef]
  7. Frøseth, R.B.; Bleken, M.A. Effect of Low Temperature and Soil Type on the Decomposition Rate of Soil Organic Carbon and Clover Leaves, and Related Priming Effect. Soil Biol. Biochem. 2015, 80, 156–166. [Google Scholar] [CrossRef]
  8. Petraglia, A.; Cacciatori, C.; Chelli, S.; Fenu, G.; Calderisi, G.; Gargano, D.; Abeli, T.; Orsenigo, S.; Carbognani, M. Litter Decomposition: Effects of Temperature Driven by Soil Moisture and Vegetation Type. Plant Soil 2019, 435, 187–200. [Google Scholar] [CrossRef]
  9. Bryant, D.M.; Holland, E.A.; Seastedt, T.R.; Walker, M.D. Analysis of Litter Decomposition in an Alpine Tundra. Can. J. Bot. 1998, 76, 1295–1304. [Google Scholar] [CrossRef]
  10. Knorr, M.; Frey, S.D.; Curtis, P.S. Nitrogen Additions and Litter Decomposition: A Meta-Analysis. Ecology 2005, 86, 3252–3257. [Google Scholar] [CrossRef] [Green Version]
  11. Vitale, M.; Amitrano, W.; Hoshika, Y.; Paoletti, E. Plant Species-Specific Litter Decomposition Rates Are Directly Affected by Tropospheric Ozone: Analysis of Trends and Modelling. Water Air Soil Pollut. 2019, 230, 311. [Google Scholar] [CrossRef]
  12. Dang, C.K.; Chauvet, E.; Gessner, M.O. Magnitude and Variability of Process Rates in Fungal Diversity-Litter Decomposition Relationships. Ecol. Lett. 2005, 8, 1129–1137. [Google Scholar] [CrossRef] [PubMed] [Green Version]
  13. Graça, M.A.; Bärlocher, F.; Gessner, M.O. Methods to Study Litter Decomposition: A Practical Guide; Springer: Cham, Switzerland, 2005. [Google Scholar]
  14. Hooper, D.U.; Vitousek, P.M. The Effects of Plant Composition and Diversity on Ecosystem Processes. Science 1997, 277, 1302–1305. [Google Scholar] [CrossRef] [Green Version]
  15. Mclaren, J.R.; Turkington, R. Plant Functional Group Identity Differentially Affects Leaf and Root Decomposition. Glob. Chang. Biol. 2010, 16, 3075–3084. [Google Scholar] [CrossRef]
  16. Dirks, I.; Navon, Y.; Kanas, D.; Dumbur, R.; Grünzweig, J.M. Atmospheric Water Vapor as Driver of Litter Decomposition in Mediterranean Shrubland and Grassland during Rainless Seasons. Glob. Chang. Biol. 2010, 16, 2799–2812. [Google Scholar] [CrossRef]
  17. Evans, S.; Todd-Brown, K.E.O.; Jacobson, K.; Jacobson, P. Non-Rainfall Moisture: A Key Driver of Microbial Respiration from Standing Litter in Arid, Semiarid, and Mesic Grasslands. Ecosystems 2020, 23, 1154–1169. [Google Scholar] [CrossRef] [Green Version]
  18. Reichstein, M.; Tenhunen, J.D.; Roupsard, O.; Ourcival, J.-M.; Rambal, S.; Dore, S.; Valentini, R. Ecosystem Respiration in Two Mediterranean Evergreen Holm Oak Forests: Drought Effects and Decomposition Dynamics. Funct. Ecol. 2002, 16, 27–39. [Google Scholar] [CrossRef] [Green Version]
  19. He, X.; Lin, Y.; Han, G.; Guo, P.; Tian, X. The effect of temperature on decomposition of leaf litter from two tropical forests by a microcosm experiment. Eur. J. Soil Biol. 2010, 46, 200–207. [Google Scholar] [CrossRef]
  20. Van Meeteren, M.J.M.; Tietema, A.; Westerveld, J.W. Regulation of microbial carbon, nitrogen, and phosphorus transformations by temperature and moisture during decomposition of Calluna vulgaris litter. Biol. Fertil. Soils 2007, 44, 103–112. [Google Scholar] [CrossRef] [Green Version]
  21. Wu, Z.; Dijkstra, P.; Kock, G.W.; Peñuelas, J.; Hungate, B.A. Responses of Terrestrial Ecosystems to Temperature and Precipitation Change: A Meta-Analysis of Experimental Manipulation. Glob. Chang. Biol. 2011, 17, 927–942. [Google Scholar] [CrossRef] [Green Version]
  22. Saccone, P.; Morin, S.; Baptist, F.; Bonneville, J.-M.; Colace, M.-P.; Domine, F.; Faure, M.; Geremia, R.; Lochet, J.; Poly, F.; et al. The Effects of Snowpack Properties and Plant Strategies on Litter Decomposition during Winter in Subalpine Meadows. Plant Soil 2013, 363, 215–229. [Google Scholar] [CrossRef]
  23. Cornwell, W.K.; Cornelissen, J.H.C.; Amatangelo, K.; Dorrepaal, E.; Eviner, V.T.; Godoy, O.; Hobbie, S.E.; Hoorens, B.; Kurokawa, H.; Pérez-Harguindeguy, N.; et al. Plant Species Traits Are the Predominant Control on Litter Decomposition Rates within Biomes Worldwide. Ecol. Lett. 2008, 11, 1065–1071. [Google Scholar] [CrossRef] [PubMed]
  24. Incerti, G.; Bonanomi, G.; Giannino, F.; Rutigliano, F.A.; Piermatteo, D.; Castaldi, S.; De Marco, A.; Fierro, A.; Fioretto, A.; Maggi, O.; et al. Litter Decomposition in Mediterranean Ecosystems: Modelling the Controlling Role of Climatic Conditions and Litter Quality. Appl. Soil Ecol. 2011, 49, 148–157. [Google Scholar] [CrossRef]
  25. Jarvis, S.C.; Stockdale, E.A.; Shepherd, M.A.; Powlson, D.S. Nitrogen Mineralization in Temperate Agricultural Soils: Processes and Measurement. Adv. Agron. 1996, 57, 187–235. [Google Scholar] [CrossRef]
  26. Xu, J.M.; Tang, C.; Chen, Z.L. Chemical Composition Controls Residue Decomposition in Soils Differing in Initial pH. Soil Biol. Biochem. 2006, 38, 544–552. [Google Scholar] [CrossRef]
  27. Del Grosso, S.J.; Parton, W.J.; Mosier, A.R.; Holland, E.A.; Pendall, E.; Schimel, D.S.; Ojima, D.S. Modeling Soil CO2 Emissions from Ecosystems. Biogeochemistry 2005, 73, 71–91. [Google Scholar] [CrossRef]
  28. Adair, E.C.; Parton, W.J.; Del Grosso, S.J.; Silver, W.L.; Harmon, M.E.; Hall, S.A.; Burke, I.C.; Hart, S.C. Simple Three-Pool Model Accurately Describes Patterns of Long-Term Litter Decomposition in Diverse Climates. Glob. Chang. Biol. 2008, 14, 2636–2660. [Google Scholar] [CrossRef]
  29. Sierra, C.A.; Müller, M.; Trumbore, S.E. Models of Soil Organic Matter Decomposition: The SoilR Package, Version 1.0. Geosci. Model Dev. 2012, 5, 1045–1060. [Google Scholar] [CrossRef] [Green Version]
  30. Olson, J.S. Energy Storage and the Balance of Producers and Decomposers in Ecological Systems. Ecology 1963, 44, 322–331. [Google Scholar] [CrossRef] [Green Version]
  31. IUSS Working Group WRB. World Reference Base for Soil Resources 2014, Update 2015. International Soil Classification System for Naming Soils and Creating Legends for Soil Maps; World Soil Resources Reports No. 106; FAO: Rome, Italy, 2015. [Google Scholar]
  32. Cutini, A. La Stima Del LAI Con Il Metodo Delle Misure Di Trasmittanza in Popolamenti Diradati e Non Diradati Di Cerro. Ann. Ist. Sper. Selv. Arezzo 1994, 23, 167–181. [Google Scholar]
  33. Gahrooe, F.R. Impacts of Elevated Atmospheric CO2 on Litter Quality, Litter Decomposability and Nitrogen Turnover Rate of Two Oak Species in a Mediterranean Forest Ecosystem. Glob. Chang. Biol. 1998, 4, 667–677. [Google Scholar] [CrossRef]
  34. Wider, R.K.; Lang, G.E. A Critique of the Analytical Methods Used in Examining Decomposition Data Obtained From Litter Bags. Ecology 1982, 63, 1636–1642. [Google Scholar] [CrossRef]
  35. Fioretto, A.; Papa, S.; Fuggi, A. Litter-Fall and Litter Decomposition in a Low Mediterranean Shrubland. Biol. Fertil. Soils 2003, 39, 37–44. [Google Scholar] [CrossRef]
  36. Hättenschwiler, S.; Tiunov, A.V.; Scheu, S. Biodiversity and Litter Decomposition in Terrestrial Ecosystems. Annu. Rev. Ecol. Evol. Syst. 2005, 36, 191–218. [Google Scholar] [CrossRef]
  37. Keiblinger, K.M.; Schneider, T.; Roschitzki, B.; Schmid, E.; Eberl, L.; Hämmerle, I.; Leitner, S.; Richter, A.; Wanek, W.; Riedel, K.; et al. Effects of Stoichiometry and Temperature Perturbations on Beech Leaf Litter Decomposition, Enzyme Activities and Protein Expression. Biogeosciences 2012, 9, 4537–4551. [Google Scholar] [CrossRef] [Green Version]
  38. Van Soest, P.J.; Wine, R.H. Determination of Lignin and Cellulose in Acid-Detergent Fiber with Permanganate. J. AOAC Int. 1968, 51, 780–785. [Google Scholar] [CrossRef]
  39. Fioretto, A.; Di Nardo, C.; Papa, S.; Fuggi, A. Lignin and Cellulose Degradation and Nitrogen Dynamics during Decomposition of Three Leaf Litter Species in a Mediterranean Ecosystem. Soil Biol. Biochem. 2005, 37, 1083–1091. [Google Scholar] [CrossRef]
  40. Vitale, M.; Savi, F.; Baldantoni, D.; Attorre, F. Modeling of Early Stage Litter Decomposition in Mediterranean Mixed Forests: Functional Aspects Affected by Local Climate. iFor.—Biogeosci. For. 2014, 8, 517–525. [Google Scholar] [CrossRef] [Green Version]
  41. Chiesi, M.; Angeli, L.; Battista, P.; Bottai, L.; Fibbi, L.; Gardin, L.; Gozzini, B.; Rapi, B.; Romani, M.; Sabatini, F.; et al. Bilancio Idrico Multiscala Di Aree Forestali e Agricole. In Sistemi Integrati per il Monitoraggio Ambientale e il Supporto alla Gestione delle Risorse. Componenti, Procedure e Prospettive; Raschi, A., Conese, C., Battista, P., Eds.; CNR-IBIMET: Florence, Italy, 2016; pp. 131–138. [Google Scholar]
  42. Gardin, L.; Chiesi, M.; Fibbi, L.; Angeli, L.; Rapi, B.; Battista, P.; Maselli, F. Simulation of Soil Water Content through the Combination of Meteorological and Satellite Data. Geoderma 2021, 393, 115003. [Google Scholar] [CrossRef]
  43. Maselli, F.; Papale, D.; Chiesi, M.; Matteucci, G.; Angeli, L.; Raschi, A.; Seufert, G. Operational Monitoring of Daily Evapotranspiration by the Combination of MODIS NDVI and Ground Meteorological Data: Application and Evaluation in Central Italy. Remote Sens. Environ. 2014, 152, 279–290. [Google Scholar] [CrossRef]
  44. Lloyd, J.; Taylor, J.A. On the Temperature Dependence of Soil Respiration. Funct. Ecol. 1994, 8, 315–323. [Google Scholar] [CrossRef]
  45. Walter, J. Effects of Changes in Soil Moisture and Precipitation Patterns on Plant-Mediated Biotic Interactions in Terrestrial Ecosystems. Plant Ecol. 2018, 219, 1449–1462. [Google Scholar] [CrossRef]
  46. León-Sánchez, L.; Nicolás, E.; Nortes, P.A.; Maestre, F.T.; Querejeta, J.I. Photosynthesis and Growth Reduction with Warming Are Driven by Nonstomatal Limitations in a Mediterranean Semi-Arid Shrub. Ecol. Evol. 2016, 6, 2725–2738. [Google Scholar] [CrossRef] [PubMed] [Green Version]
  47. León-Sánchez, L.; Nicolás, E.; Goberna, M.; Prieto, I.; Maestre, F.T.; Querejeta, J.I. Poor Plant Performance under Simulated Climate Change Is Linked to Mycorrhizal Responses in a Semi-Arid Shrubland. J. Ecol. 2018, 106, 960–976. [Google Scholar] [CrossRef] [PubMed]
  48. Gliksman, D.; Rey, A.; Seligmann, R.; Dumbur, R.; Sperling, O.; Navon, Y.; Haenel, S.; De Angelis, P.; Arnone, J.A.; Grünzweig, J.M. Biotic Degradation at Night, Abiotic Degradation at Day: Positive Feedbacks on Litter Decomposition in Drylands. Glob. Chang. Biol. 2017, 23, 1564–1574. [Google Scholar] [CrossRef] [PubMed]
  49. Poulter, B.; Frank, D.; Ciais, P.; Myneni, R.B.; Andela, N.; Bi, J.; Broquet, G.; Canadell, J.G.; Chevallier, F.; Liu, Y.Y.; et al. Contribution of Semi-Arid Ecosystems to Interannual Variability of the Global Carbon Cycle. Nature 2014, 509, 600–603. [Google Scholar] [CrossRef] [Green Version]
  50. Caraux Garson, D.; Lacaze, B. Monitoring Leaf Area Index of Mediterranean Oak Woodlands: Comparison of Remotely-Sensed Estimates with Simulations from an Ecological Process-Based Model. Int. J. Remote Sens. 2003, 24, 3441–3456. [Google Scholar] [CrossRef]
  51. Masson-Delmotte, V.; Zhai, P.; Pirani, A.; Connors, S.L.; Péan, C.; Berger, S.; Caud, N.; Chen, Y.; Goldfarb, L.; Gomis, M.I.; et al. Climate Change 2021: The Physical Science Basis. Contribution of Working Group I to the Sixth Assessment Report of the Intergovernmental Panel on Climate Change; IPCC: Geneva, Switzerland, 2021.
Figure 1. Conceptual diagram of the decomposition model. Dashed boxes referred to input variables, squares were stocks, rounded squares were driver variables, circles stood for specific information dealing with model control, dashed arrows denoted fluxes, and solid arrows stood for impacts. (Adapted with permission from Vitale et al. [40]. Copyright 2014, copyright iForest–Biogeoscience and Forestry).
Soilsystems 06 00081 g001
Figure 2. Daily trends of relative soil water content (RSWC, brown line), temperature (°C, red line), and precipitation (mm, blue line) during 2020. RSWC is a dimensionless value, where this variable assumes a 0 value under the water stress condition (RSWC = 0) or 1 in absence of the water stress condition (RSWC = 1).
Soilsystems 06 00081 g002
Figure 3. Dynamic of ADF, cellulose, and lignin components expressed as sample-based weights of the remaining biomass for each Julian Day.
Soilsystems 06 00081 g003
Figure 4. Simulated k1 values (g/day) obtained by Equation (9) (continuous line in red) and the observed ones obtained by Equation (8) (points in blue).
Soilsystems 06 00081 g004
Figure 5. Simulated k2acc (t) values obtained by Equation (10) (continuous line in red), and the observed ones obtained by Equation (8) (points in blue).
Soilsystems 06 00081 g005
Figure 6. Values of k2deg (t) interpolated by the Equation (11). The curve k2deg (t) was taken from Vitale et al. (Adapted with permission from Vitale et al. [40]. Copyright 2014, copyright iForest – Biogeoscience and Forestry) -after conversion in (g/day), since the initial rate of lignin degradation was not recorded for this study.
Soilsystems 06 00081 g006
Figure 7. Trends of the real and simulated decomposition for M1 (a) and M2 (b) compared to the respective M pools derived by simulations with the appropriate CDI.
Soilsystems 06 00081 g007aSoilsystems 06 00081 g007b
Figure 8. M(t)simulated vs. M(t)measured data over time. It was evident a light overestimation of the model (M(t)modelled/M(t)measured = 1.0128).
Soilsystems 06 00081 g008
Table 1. Remaining Biomass (Avg, g), standard deviation (St.Dev., g), and remaining percentage with respect to t0 (t0 = 14 May 2020), during the sampling time (from 153 to 297 Julian days).
Sample
Date
Sampling DaysJulian
Days
Remaining Biomass
(Avg; g) ± St. Dev.
Remaining Percentage
(%)
1 June 2020151532.49 ± 0.0199.8
9 June 2020231612.40 ± 0.0496.2
2 July 2020461842.21 ± 0.0488.4
22 July 2020662042.22 ± 0.0589.0
1 October 20201372752.08 ± 0.1183.2
23 October 20201592971.86 ± 0.1174.6
Table 2. Determination coefficient: R2, and MSE (mean square error) for M1 and M2 simulated values.
M1-M2R2MSE
M1 Arctan0.9610.364
M1 Linear0.9620.072
M1 LT0.9610.069
M2 Arctan0.4390.180
M2 Linear0.4420.217
M2 LT0.4400.218
Publisher’s Note: MDPI stays neutral with regard to jurisdictional claims in published maps and institutional affiliations.

