Article

Research on the Optimal Spacing of Multiple Roof Smoke Blocking Structures in a Long Corridor

1
College of Building Environment Engineering, Zhengzhou University of Light Industry, Zhengzhou 450002, China
2
Zhengzhou Key Laboratory of Electric Power Fire Safety, Zhengzhou University of Light Industry, Zhengzhou 450001, China
3
Henan Engineering Research Center for Intelligent Buildings and Human Settlements, Zhengzhou University of Light Industry, Zhengzhou 450001, China
*
Author to whom correspondence should be addressed.
Submission received: 22 January 2024 / Revised: 29 February 2024 / Accepted: 13 March 2024 / Published: 15 March 2024

Abstract

:
In a long and narrow corridor, the installation of roof smoke blocking structures is a measure to slow down the spread of fire smoke. When employing multiple smoke blocking structures, the spacing between these structures is a critical parameter that needs to be considered for optimal effectiveness. This paper analyzes the smoke blocking performance of double structures at different spacing and measures the smoke flow velocity both upstream and downstream of the double structures. According to the analysis of the smoke velocity vector obtained from numerical simulation, the smoke can be divided into three zones based on the flow state of the smoke after passing through the front smoke screen structure, namely the vortex zone, surge wave zone, and steady flow zone. When the rear smoke screen is located in the surge zone, the smoke blocking effect is optimal. Analysis of the morphology of the smoke layer indicates that the length of the vortex region is directly proportional to the upstream smoke flow velocity. The numerical and experimental results both indicate that an excessively large or small spacing between the structures fails to achieve optimal smoke control effectiveness. When the spacing is within an optimal range, the smoke velocity is the lowest. Finally, using a real architectural corridor as a case background, this paper presents a design example of roof smoke blocking structures. In order to arrange as many smoke blocking structures as possible, an appropriate spacing between the structures should be slightly larger than the vortex region. The smoke control effectiveness of multiple roof structures was validated through numerical simulation. As a result, the time required for smoke to pass through the corridor increases by 110 s.

1. Introduction

Smoke is the first killer in the fire, and 80% of the deaths in the fire are caused by smoke [1,2]. In general, the toxic smoke in the fire spreads faster than the flame [3]. Limiting and controlling the flow of smoke is a classic problem in building fires [4,5]. At present, the smoke exhaust system is often combined with roof structures such as smoke screens or beams, and the roof structures limit the flow area of smoke so that the smoke exhaust system can exhaust smoke outdoors in time [6,7]. In long and narrow spaces such as tunnels and long corridors, smoke blocking structures such as smoke-proof hanging walls or smoke-proof curtains often achieve good results [8,9,10].
It can be seen that various roof structures play a vital role in limiting and blocking the flow of fire smoke. There is much research on the laws for the suppression of smoke in roof structures. Based on Kunch’s four-stage theory of fire smoke flow in long-narrow spaces [11], Wang Huan and others pointed out through numerical simulation research that structures such as smoke screens can shorten the hydraulic jump areas in the second and third stages, thus reducing air entrainment and smoke flow rate [12,13]. Meng Na et al. studied the influence of the smoke screen in subway stations on the fire smoke temperature through theoretical derivation and experiments [14]. In Meng Na et al.’s research, the fire smoke temperature is reduced by the smoke screen, and the thickness of the smoke layer is consistent with the height of the smoke screen. However, because the subway station can no longer be regarded as a typical long-narrow space, the research results may be inconsistent with the law of smoke temperature and thickness in long-narrow spaces. Chow and others studied the smoke blocking effect of smoke blocking structures in inclined tunnels through similar experiments, and the test photos clearly reflected the process of smoke passing through smoke blocking structures [15]. Chaabat et al. studied the relationship between smoke blocking structures and the critical wind speed of fire smoke countercurrent, and their experiments showed that the height of structures was the main factor affecting critical wind speed [16].
The above research shows that roof structures are widely used in long-narrow spaces and have high smoke blocking efficiency. Even if the fire smoke has crossed the roof structure, the blocking effect of the roof structure on the fire smoke still exists. However, the smoke blocking effect of conventional roof structures (such as fixed smoke screens) is limited after all. In recent years, in order to improve the smoke-block effect of smoke-block structures, some studies have begun to explore smoke screens with different geometric parameters, such as inclined smoke screens [17,18] and multiple smoke screen combinations [19,20]. In the previous research, the authors pointed out that the multi-roof structure has a better smoke blocking effect than the single-roof structure, and it is suitable for firefighting reconstruction in areas such as narrow corridors of old buildings where the smoke exhaust system is difficult to improve [21,
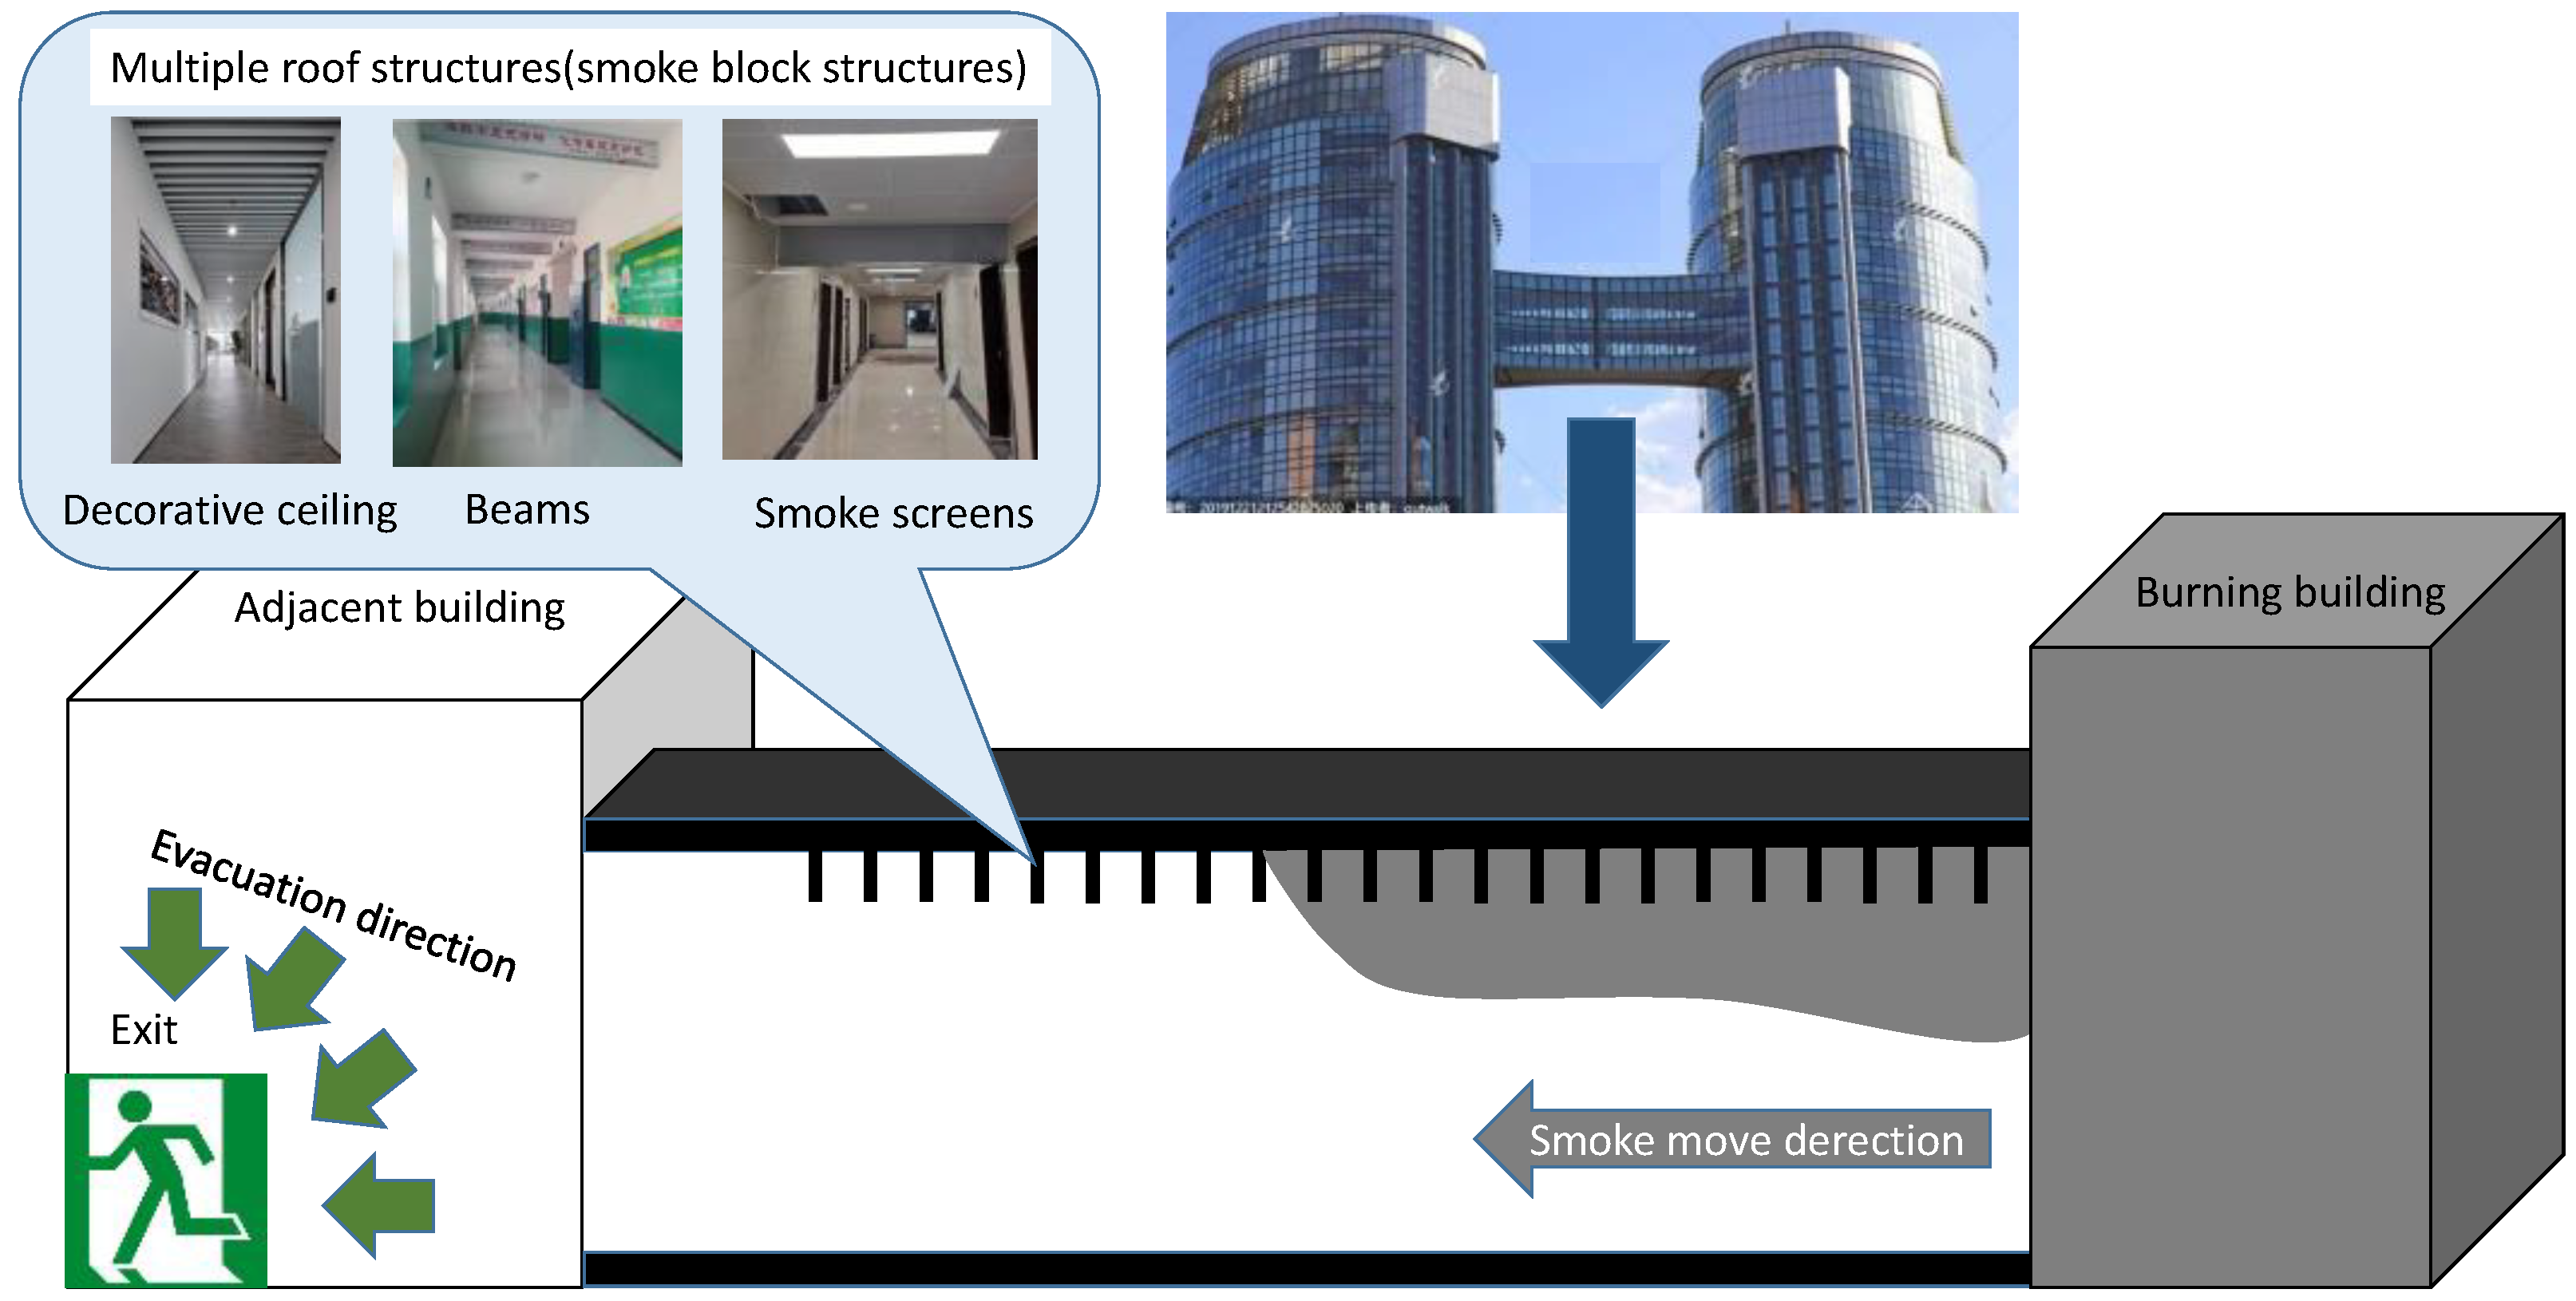
22]. For the interior corridors of some old buildings, the smoke control and exhaust systems do not comply with the current regulations, and there is no condition to renovate them to the current regulations. These internal corridors sometimes connect multiple rooms and are the main channels for fire smoke to spread from one room to another. Setting up multiple roof smoke blocking structures for these corridors can slow down the spread of smoke and buy valuable time for personnel to escape from non-fire rooms. In addition, for buildings connected by long corridors, setting up multiple roof structures in long corridors is also an effective way to slow down the spread of smoke, as shown in Figure 1. Smoke blocking structures can also be arranged in conjunction with decorative ceilings and beams. Compared to a single roof structure, after the smoke passes through multiple roof structures, the smoke front velocity is slower, increasing the time it takes for the smoke to reach another large space through the long corridor.
Different from a single-roof structure, when using multi-roof structures for smoke blocking design, it is necessary to consider the height and spacing of the structures. If analyzed from the perspective of local fluid loss, the smoke flow loss caused by the roof structure not only includes the loss within the range of the roof structure but also includes the loss caused by turbulence intensification in a downstream section. The rear structure will interfere with the downstream wake of the front structure, and the form of wake interference will affect the smoke suppression effect of multiple structures. The spacing between structures is an important parameter that affects the form of wake interference. However, the research on the smoke blocking effect of multi-roof structures still lacks theoretical and practical research on optimal spacing. This paper will study the optimal spacing of multi-roof structures through numerical and physical experiments, apply the method of determining the optimal spacing to the actual scene, and finally verify the application effect of multi-roof structures in long and narrow spaces through fire dynamics simulations.

2. Numerical Simulation of Double Smoke Blocking Structures with Different Spacings

2.1. Numerical Model

We use the FDS (fire dynamics simulation) software to numerically simulate the smoke movement in a corridor. The FDS software is a specialized fire simulation tool. This software employs a large eddy simulation (LES) model, allowing it to adapt to common fire and smoke simulation scenarios. The corridor model is set with a length of 16 m, a width of 2 m, and a height of 4 m. The left end of the corridor is closed, the right end is open, and there is no forced ventilation. The fire source is located in the middle of the ground, 1.5 m from the left end of the corridor. The fire source has an area of 1 m × 1 m, as indicated in reference [23]. The fire source type is a burner whose power is set constant at 83 KW. The smoke screen height is 0.75 m, and the front smoke screen is placed in the middle of the corridor, specifically 8.8 m from the left end. At the far right end of the corridor, 3.8 m above the ground, a thermocouple is positioned to monitor the time it takes for high-temperature smoke to reach the far right end of the corridor. The grid size is 0.07 m × 0.07 m × 0.07 m, and the grid zone is slightly larger than the corridor model. The numerical model is illustrated in Figure 2.
The FDS numerical simulation grid setting needs to be adapted to the fire source’s characteristic diameter. The calculation method for the characteristic diameter of the fire source is shown in the following equation.
D = Q ρ C p T g 2 5
where D* is the characteristic diameter of the fire source, m; Q is the fire source power, KW; ρ is the density of air, kg/m3; Cp is the specific heat capacity of constant pressure air, J/(kg·°C); T is the ambient temperature, which is set to 293 K; g is the gravitational acceleration, m/s2.
After calculation, the characteristic diameter of the fire source in this example is 0.35 m. Based on previous research findings [24,25], when the characteristic diameter of the fire source is 4–16 times the grid size, the accuracy of the simulation results is acceptable. The grid size should be set as 0.02–0.09 m. However, due to computer performance limitations, simulation cannot be completed when the grid size is 0.06 m. Therefore, a grid sensitivity study was conducted using grid sizes of 0.07 m, 0.09 m, 0.1 m, 0.15 m, 0.2 m, and 0.25 m. The temperature change of the end thermocouple serves as a reference for grid sensitivity analysis. The spacing of smoke screens is set to 1 m in grid sensitivity simulation. As shown in Figure 3, when the grid size ranges from 0.07 m to 0.2 m, there is little difference in the temperature change trend of the thermocouple. Considering factors such as the impact of the simulation model size on grid partitioning, the final grid size was set to 0.07 m × 0.07 m × 0.07 m.

2.2. Results of Numerical Simulation

The rear smoke screens were set at distances of 1 m, 3 m, and 6 m from the front smoke screen in three simulation groups. Based on the temperature data measured by the thermocouple at the right end of the corridor, the accurate times for the smoke fronts to reach the right end of the corridor in the three groups were 26.0 s, 29.5 s, and 28.6 s, respectively. From the numerical simulation results, it is observed that when there are two smoke screens in the corridor, having the spacing between them too large or too small does not achieve the optimal effect of blocking smoke spread. In other words, within a certain range of spacing between the two smoke screens, the speed of smoke spread is minimized. Therefore, the spacing of the smoke screen affects the flow state of smoke and consequently influences the speed of the smoke spread.

2.3. Analysis of The Smoke Flow State after Crossing The Smoke Screen

In order to analyze the influence of the spacing between smoke screens on the speed of smoke spread, a simulation with a single smoke screen was conducted. The parameters of this simulation model are the same as those in Section 2.1. The flow state of smoke after crossing the smoke screen can be analyzed through numerical simulations. The simulation results include velocity vector plots for longitudinal cross-sections of the corridor after the smoke crosses the smoke screen, as shown in Figure 4.
Figure 4 shows that after the smoke crosses the smoke screen, a vortex forms in the vicinity of the smoke screen. Within the vortex zone, the smoke velocity is low, and a significant portion of the smoke bypasses this vortex area. In this simulation, the length of the vortex region is approximately 2.5 m. Following the vortex region, as the smoke is at a lower position, it rises again and impacts the ceiling, resulting in a non-steady surge phenomenon and forming a surge region. The body of this surge moves in the direction of the smoke flow and gradually attenuates. After approximately 6 m, the surge essentially disappears, and the smoke returns to a steady flow, forming a steady flow region. Therefore, after the smoke crosses the smoke screen, its flow state can be divided into three regions: vortex region, surge region, and steady flow region. In this paper, the approximate ranges for these three regions are 0–2.5 m, 2.5–6 m, and above 6 m after the smoke screen.

2.4. Simulation of Smoke Blocking Effect of Different Spacing Smoke Blocking Structures

When there are two smoke screens on the roof of the corridor, the flow state of smoke in the location of the rear smoke screen is crucial to the blocking effect of the smoke. After the smoke crosses the front smoke screen, it forms a vortex region, a surge region, and a steady flow region. Since the main flow of smoke bypasses the vortex region, placing the rear smoke screen within the vortex region makes it difficult to achieve an ideal blocking effect. Therefore, in the three simulation groups in Section 2.2, when the spacing between the two smoke screens is 1 m, the smoke blocking effect is poor. When the spacing between the two smoke screens is 3 m, and the rear smoke screen is located in the surge region, the smoke layer in this region is uneven, and the smoke flow is unstable. The smoke rear screen dissipates significant energy to block the smoke, resulting in a good smoke blocking effect. When the spacing between the two smoke screens is 10 m, the rear smoke screen is almost in the steady flow region. As the body of the surge gradually attenuates, when the smoke screen is at the end of the surge region or in the steady flow region, the smoke flow in that area becomes more stable, and the smoke blocking effect decreases.
Therefore, there is an optimal spacing for the two smoke screens to achieve the best blocking effect of smoke flow. This spacing requires positioning the rear smoke screen within the surge region of the front smoke screen. Multiple simulations were conducted to find the optimal spacing of the smoke screens in the numerical model by adjusting the spacing between the smoke screens within the range of 0.2–6.5 m, and the simulation results are shown in Table 1. The results indicate that the optimal smoke screen spacing in this numerical model is between 2.5 and 6 m, and within this range, the smoke blocking effect is relatively consistent. This result confirms the conclusions drawn from the analysis of the three regions of smoke flow behind the smoke screen in the previous section.

3. Experimental Study

3.1. Experimental Model

The simulation research results indicate that multiple roof structures can achieve better smoke blocking effects than a single roof structure, and the variation in the spacing between structures can impact the speed of smoke spread. However, there is a lack of experimental research on how to arrange multiple structures, particularly the optimal spacing, to achieve the best results. This paper conducts experimental studies to analyze the smoke-blocking effects of multiple roof structures and address the optimal spacing between them.
The schematic diagram of the experimental model and the photos of the experimental model are shown in Figure 5. The experimental model is 3.2 m long, 0.4 m wide, and 0.8 m high, and the geometric similarity ratio is 1:5. The corresponding actual model is 16 m long, 2 m wide, and 4 m high. As shown in Figure 5, the left end of the model is open, and the right end is closed.
An appropriate similarity criterion must be selected according to the principle of similarity in fluid experiments. Fire smoke is a type of thermal buoyancy flow, and the difference in gravity between smoke and air is the most important force. Therefore, in fire smoke experiments, the Froude number, which characterizes the ratio of gravity to inertial force, is often chosen as a similarity criterion. The calculation of the velocity similarity ratio and fire source power similarity ratio under the Froude number similarity criterion is as follows. The calculation result is that the velocity ratio is 1:2.236, and the fire source power ratio is 1:55.9.
v 2 v 1 = l 2 l 1 1 2
Q 2 Q 1 = l 2 l 1 5 2
where v2 is the smoke velocity in the experiment, and v1 is the smoke velocity in the real model; l2 is the characteristic dimension in the experiment, and l1 is the characteristic dimension in the real model; Q2 is the fire source power in the experiment, and Q1 is the fire source power in the real model.
It should be pointed out that this experiment involves two main aspects: the flow state of smoke (size of vortex zone) and the driving force of smoke (flow velocity of smoke). However, both aspects are related to different similarity criteria. The smoke flow state is related to the Reynolds number, while the smoke driving force is related to the Froude number. Therefore, the experiment cannot fully satisfy the mechanical similarity, and the quantitative conclusions of the experimental and simulation results may not fully match. However, the qualitative conclusions of the experiment and simulation should be consistent.
The fire source adopts a pan fire, with anhydrous ethanol as the fuel, and the fire source power is controlled by the size of the pan as 1.49 KW. The center of the fire source is located 0.3 m from the right end of the model. Below the pan, a small hole is opened on the floor of the corridor model to allow the electronic balance to test the mass loss rate of the fuel in the pan, monitoring the changes in the fire source power. A metal mesh is placed 10 cm above the fire source, and a smoke cake is placed on the metal mesh to ensure a large amount of smoke generation, allowing for visual observation of the smoke flow. Rails are set on both sides of the roof of the experimental corridor, which can suspend and arbitrarily adjust the position of smoke blocking structures. The smoke blocking structures in the experiment adopted steel smoke screens. Thermocouples are set to assist in testing the position of the smoke front at a height of 10 cm below the roof of the experimental device, at the left outlet, and 0.85 m from the right end, respectively. Thermocouples are also set every 5 cm below the smoke screen to monitor temperature changes and observe the thickness of the smoke layer. High-temperature-resistant hot wire anemometers (Figure 5b) are installed around 1 m in front and behind the smoke screens and 10 cm below the roof to test the smoke flow velocity. One side of the experimental device is made of fire-resistant glass to observe the smoke movement. The data in the experiment are collected and stored through the 7018 module and self-developed data acquisition software (Figure 5a).

3.2. Experimental Results and Analysis of the Influence of Multiple Roof Structures on Smoke Spread in Long and Narrow Corridors

Experiments were conducted with two smoke blocking screens of 15 cm height at different spacings to analyze the relationship between the spacing of structures and the smoke spread time. The experiments keep the front smoke blocking screen (the one closer to the fire source) stationary while adjusting the position of the rear smoke screen. In some experiments, the position of the front smoke screen was fine-tuned to meet the desired spacing between the smoke screens. The smoke patterns in the experiments are illustrated in Figure 6.
Figure 6 shows no distinct feature in the thickness of the smoke layer between the two smoke screens in the experiments, unlike the earlier numerical simulations where the smoke layer between two smoke screens showed a thinning phenomenon in the middle [19,22]. The experimental data for the spacing between the smoke screens and the corresponding smoke spread times are presented in Table 2.
Table 2 shows that the smoke spread time in the experiments initially increases with the increasing spacing of the smoke blocking structures, then decreases, and finally stabilizes. Under the experimental conditions, the optimal smoke-blocking effect is achieved when the spacing between the smoke blocking structures is between 10~15 cm.
Figure 7 shows the wind speed curves in front (closer to the fire source side) and behind the two smoke screens. Figure 7 also shows that the smoke flow velocity in front of the smoke screens is very low and almost does not vary with the spacing between the smoke blocking screens. The average flow velocity of the smoke after the smoke blocking screens is below 0.5 m/s when the spacing is 10 cm and 15 cm, while it is above 0.5 m/s for spacings less than 10 cm or greater than 15 cm.
As shown in Figure 8, the process of smoke passing over the roof structure exhibits hydraulic-dropping and hydraulic-jumping phenomena, causing the smoke layer to first thin and then thicken. Therefore, a surge wave is formed. During the thinning process of the smoke layer, a vortex region is formed near the structure. The smoke interface undergoes a parabolic motion over the vortex region, and therefore, the smoke-blocking effect of placing a structure in this vortex region is not optimal. The experimental results above indicate that, under the experimental conditions, the range where the smoke screen generates a vortex is approximately 10 cm from the smoke screen. The extent of the vortex region is related to the horizontal velocity and buoyancy force of the smoke when it passes over the smoke blocking structure. Previous studies have suggested [14] that the thickness of the smoke layer in front of the smoke screen is positively correlated with the height of the smoke screen. Therefore, to satisfy the conservation of smoke mass, the smoke flow velocity below the smoke blocking structure should be proportional to the smoke flow velocity in front of the smoke blocking structure. For the same smoke-blocking structure, it can be assumed that the length of the vortex region is proportional to the smoke flow velocity right below the smoke-blocking structure. Hence, the length of the vortex region should be proportional to the smoke flow velocity in front of the smoke-blocking structure. Figure 7 shows that, under the experimental conditions, the average flow velocity before the smoke-blocking structure is around 0.1 m/s. Therefore, the proportionality coefficient is close to 1.
From this, it can be seen that the length of the vortex region is mainly related to the smoke flow velocity in front of the smoke-blocking structure. The smoke flow velocity before the smoke-blocking structure is influenced by parameters such as fire source power, the aspect ratio of the long-narrow corridor, and the height of the smoke blocking structure. According to the conclusions of previous research [14,22], the smoke flow velocity before the smoke blocking structure slows down as the height of the structure increases. In other words, in the same corridor with a constant fire source power, the higher the smoke-blocking structure, the shorter the vortex region, and the closer the spacing between structures can be set.

4. Design Method of Multiple Roof Smoke Blocking Structures of a Building Corridor

4.1. Determination of Optimal Spacing of Smoke Blocking Structures

Due to the relationship between the smoke spread time and the length of the vortex after the structure, this chapter proposes a method for arranging a series of smoke blocking structures to achieve the effect of slowing down corridor smoke. This method is mainly used to block the spread of smoke in the corridor. In this method, the height of the smoke blocking structures is set to 50 cm in accordance with relevant specifications, and determining the spacing between structures is the key point. Under the condition of unchanged fire source power and corridor structure, the flow velocity of smoke in front of the structures is also constant, and thus, the optimal spacing between structures can be determined. The optimal spacing between smoke blocking structures should be slightly larger than the length of the vortex region, which ensures that each structure has the highest smoke blocking efficiency and allows for the placement of as many smoke blocking structures as possible to achieve the best smoke blocking effect.
The method for determining the optimal spacing should involve numerical simulations using FDS software. A numerical model is constructed with the same dimensions as the corridor, and initially, a single smoke blocking structure is set up. Through simulations, the range of the vortex region is determined. Subsequently, additional smoke blocking structures are set up out of the boundary of the vortex region for simulation; thus, the optimal spacing is determined. Once a set of smoke blocking structures with determined height and spacing is established, they can be appropriately installed on the roof of the corridor.

4.2. Smoke Blocking Structures Design and Implementation Case Analysis

Taking the corridor inside the Innovation and Entrepreneurship Building at Zhengzhou University of Light Industry as an example, the corridor is approximately 2.5 m wide, 2.8 m high, and has a length of 53 m. This corridor is an inner corridor between rooms on both sides. Assuming that the doors of the rooms are not open and the window at one end of the corridor is closed, the corridor becomes a bag-shaped corridor with one end open and one end closed. A fire is assumed at the closed end of the corridor, and the fire source power is assumed to be 60 kW (calculated based on the recommended unit area fire source power in the “Building Smoke Prevention and Smoke Exhaust Technical Standard”, assuming a 20 cm side length square area fire). Smoke blocking structures are designed for this scenario.

4.2.1. Numerical Simulation of Optimal Spacing

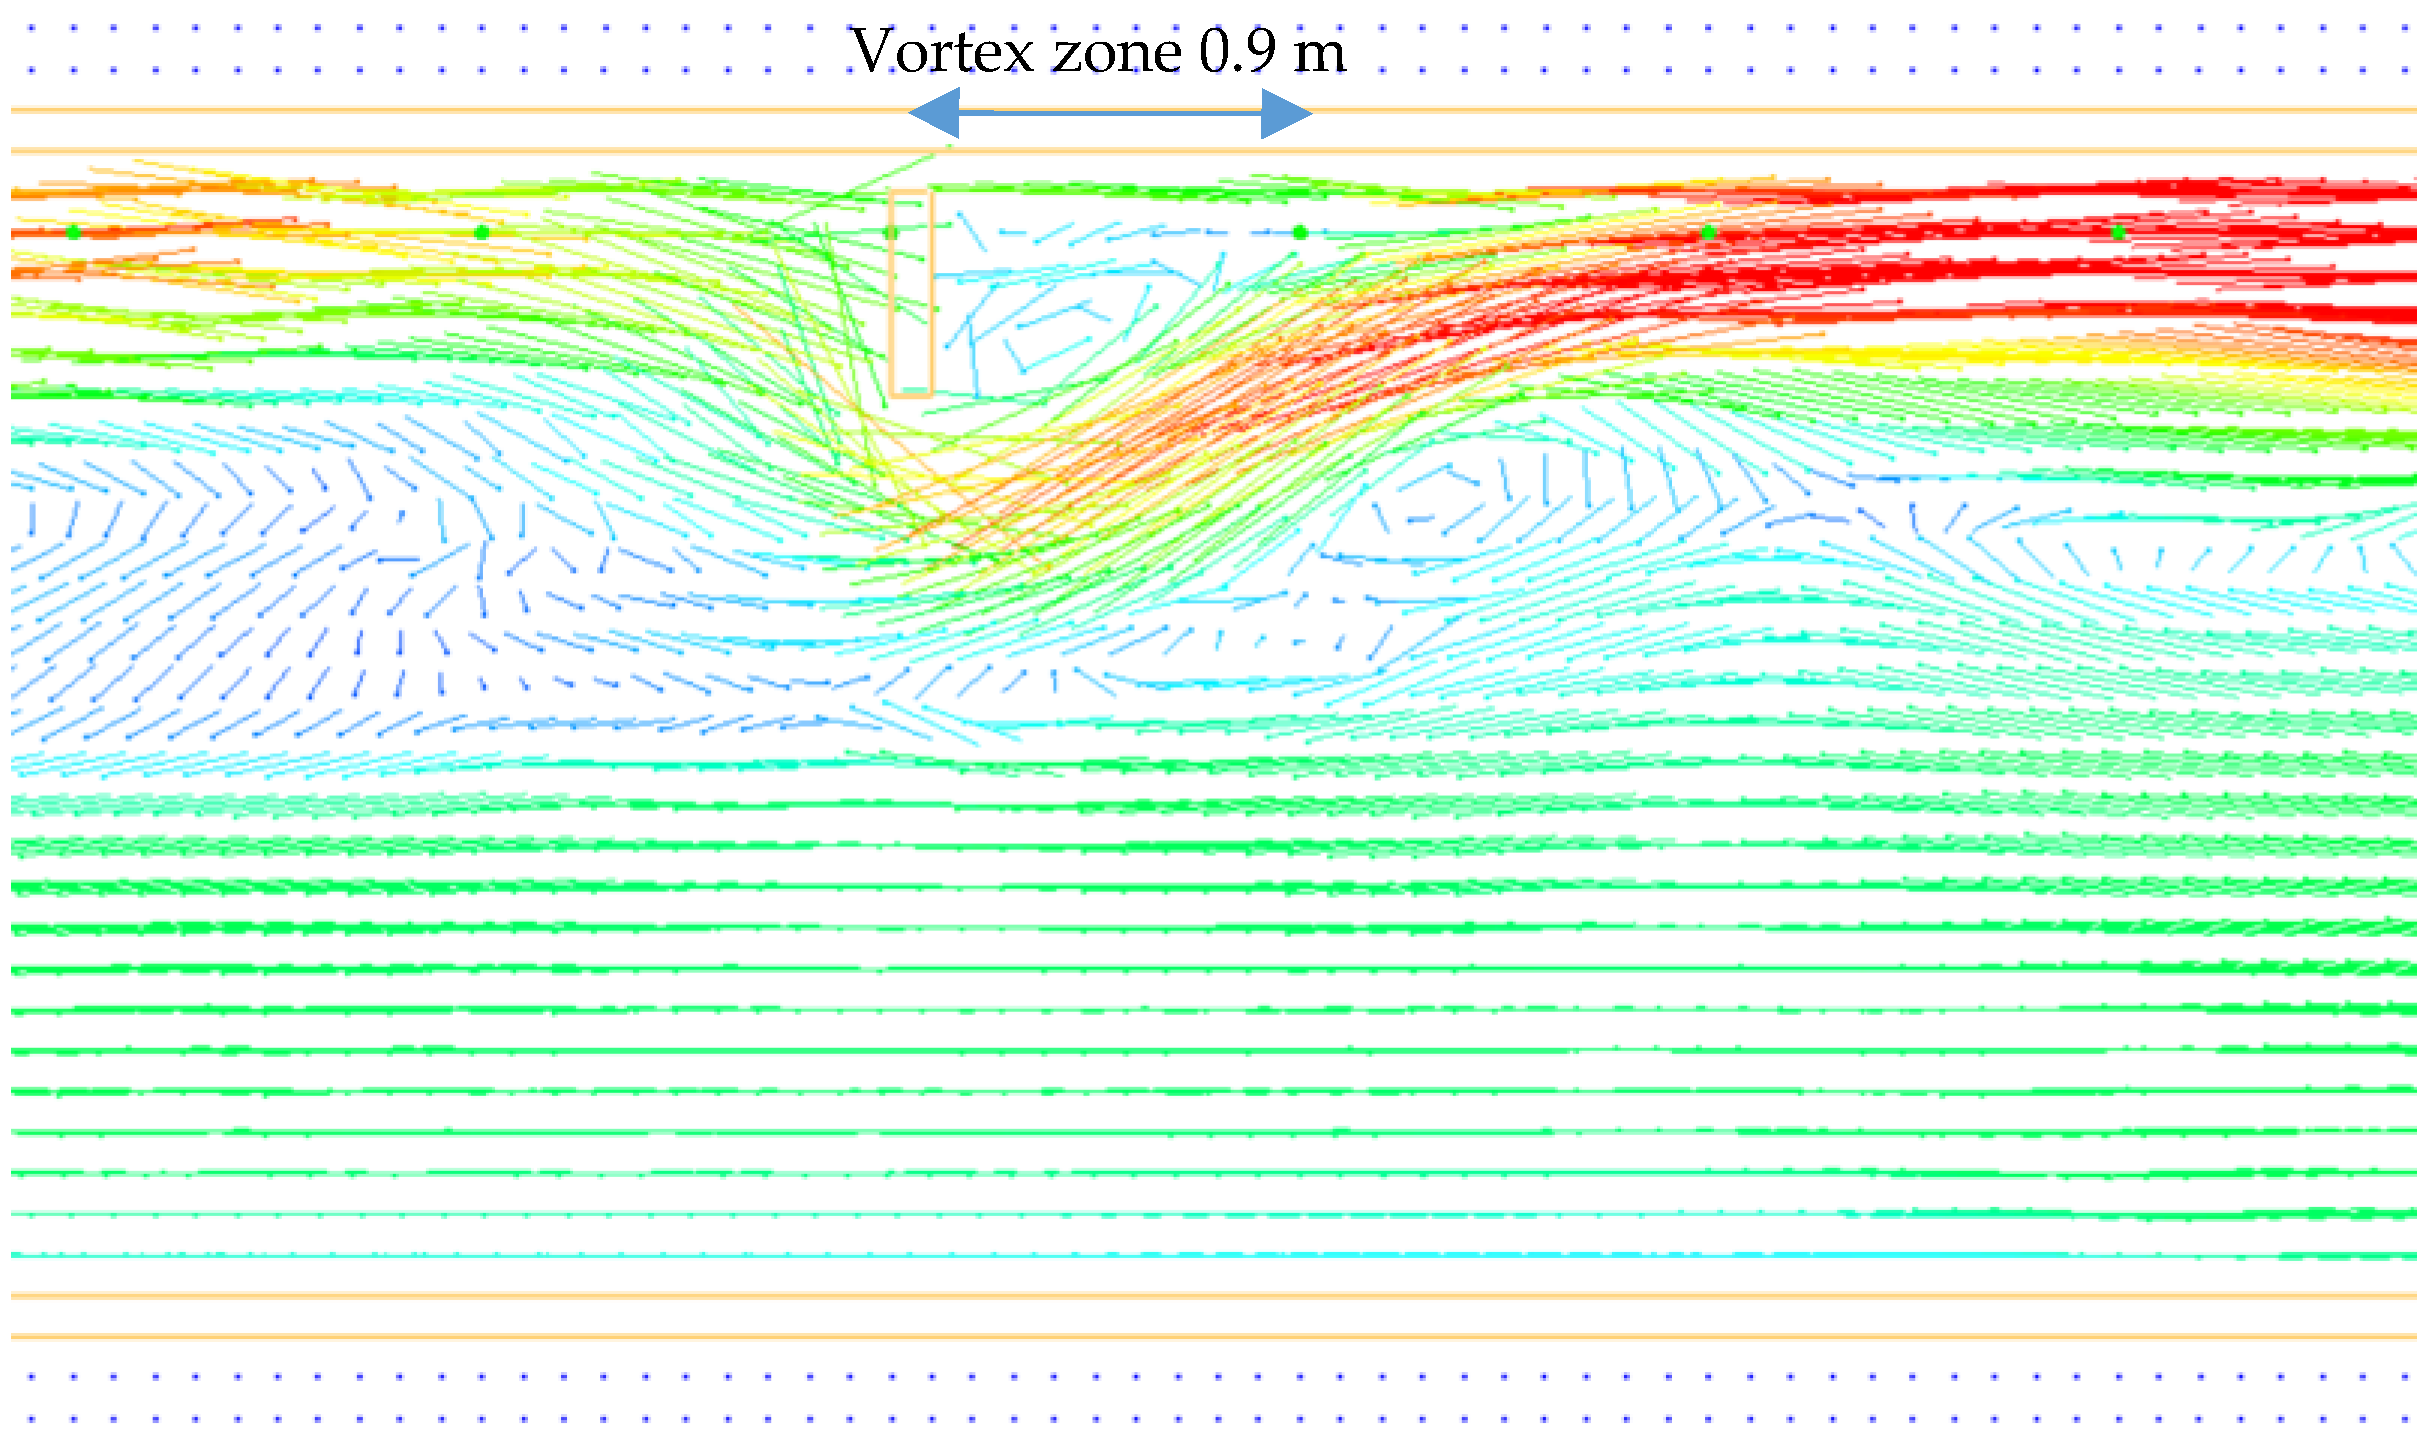
The optimal spacing is determined through numerical simulations using the Pyrosim software. A corridor model with dimensions of 53 m length, 2.8 m height, and 2.5 m width is constructed. Numerical simulations are performed for a smoke blocking structure with a height of 0.5 m. The velocity vector map obtained from the simulation is shown in Figure 9.
From Figure 9, it can be observed that the length of the vortex region is approximately 0.9 m. At this point, the smoke flow velocity before the smoke blocking structure is approximately 0.7 m/s, and the proportionality coefficient remains close to 1.
Numerical simulations were conducted for a scenario with double smoke blocking structures at a spacing of 0.9 ± 0.2 m. The results showed that the smoke spread time was 106 s and 108 s for the two cases. The latter (spacing of 1.1 m) performed better, confirming the rational selection of the optimal spacing. The simulated state of the smoke movement is shown in Figure 10.

4.2.2. Implementation Method of Multiple Smoke Blocking Structures

To meet the requirements of different corridors for roof smoke blocking structures, this study designed an implementation method that allows flexible adjustment of the spacing between smoke blocking structures, as shown in Figure 11.
As shown in Figure 11, the rails, made of high-temperature-resistant alloy material, consist of two tracks with fixed holes spaced every 1–2 m. These tracks are parallelly fixed on the corridor roof using suitable-sized expansion screws through the fixed holes. The distance between the tracks is 0.5 m, and the cross-sectional shape of the track groove is either square or rectangular, with a width of 2–3 cm and a length equal to the corridor length. Notches for installing slots are set in the tracks every 3–5 m.
The slots are made of steel and have a width of 0.55 m. Pulleys connected to the tracks are positioned at the upper part of the slots, with a spacing of 0.5 m, and the pulley size is slightly smaller than the width of the track groove. The slots are installed into the notches of the tracks and can be freely slid by the installation workers. Fastening devices at the connection points between the slots and the tracks can be opened to secure the slots and prevent free sliding. The lower part of the slots has grooves for installing a smoke screen. The spacing of the slots is determined based on the numerical simulation results of corridor fires.
The slots and tracks can be mass-produced, while the smoke screens need to be customized using non-combustible materials based on the corridor width and height. For instance, the height of the smoke screens can be set to 0.5 m, the width to 2.5 m, and the thickness to 10 cm. The spacing between the smoke screens is set to 0.9 m (as close as possible to the length of the vortex zone to ensure optimal spacing and maximize the number of smoke screens). The total number of smoke screens and slots is 53.
The cross-section of the tracks is 2 cm × 2 cm, with fixed holes every 2 m and notches every 5 m. The notches have a length of 10 cm. The two tracks are fixed paralleled on the corridor roof using expansion screws through the fixed holes, with a spacing of 0.5 m. The total length of the tracks is 53 m, and they can be installed in sections. The diameter of the pulley at the upper part of the slot is 1.5 cm, and the height of the lower groove is 10 cm. The pulley parts of the 53 slots are sequentially inserted through the notches in the tracks, with the first slot sliding to one end of the corridor and the remaining slots sliding to positions spaced 0.9 m apart. The screws are tightened to fix them. The 11 smoke screens are inserted into the lower grooves of the slots, ensuring that the fastening spring buckles out of the small holes in the grooves. This smoke-blocking device can adjust the spacing between the smoke screens or replace smoke screens of different sizes according to changes in corridor fire loads, smoke prevention, and exhaust conditions.

4.2.3. Numerical Simulation Verification of Smoke Suppression Effect of Multi-Smoke Blocking Structures

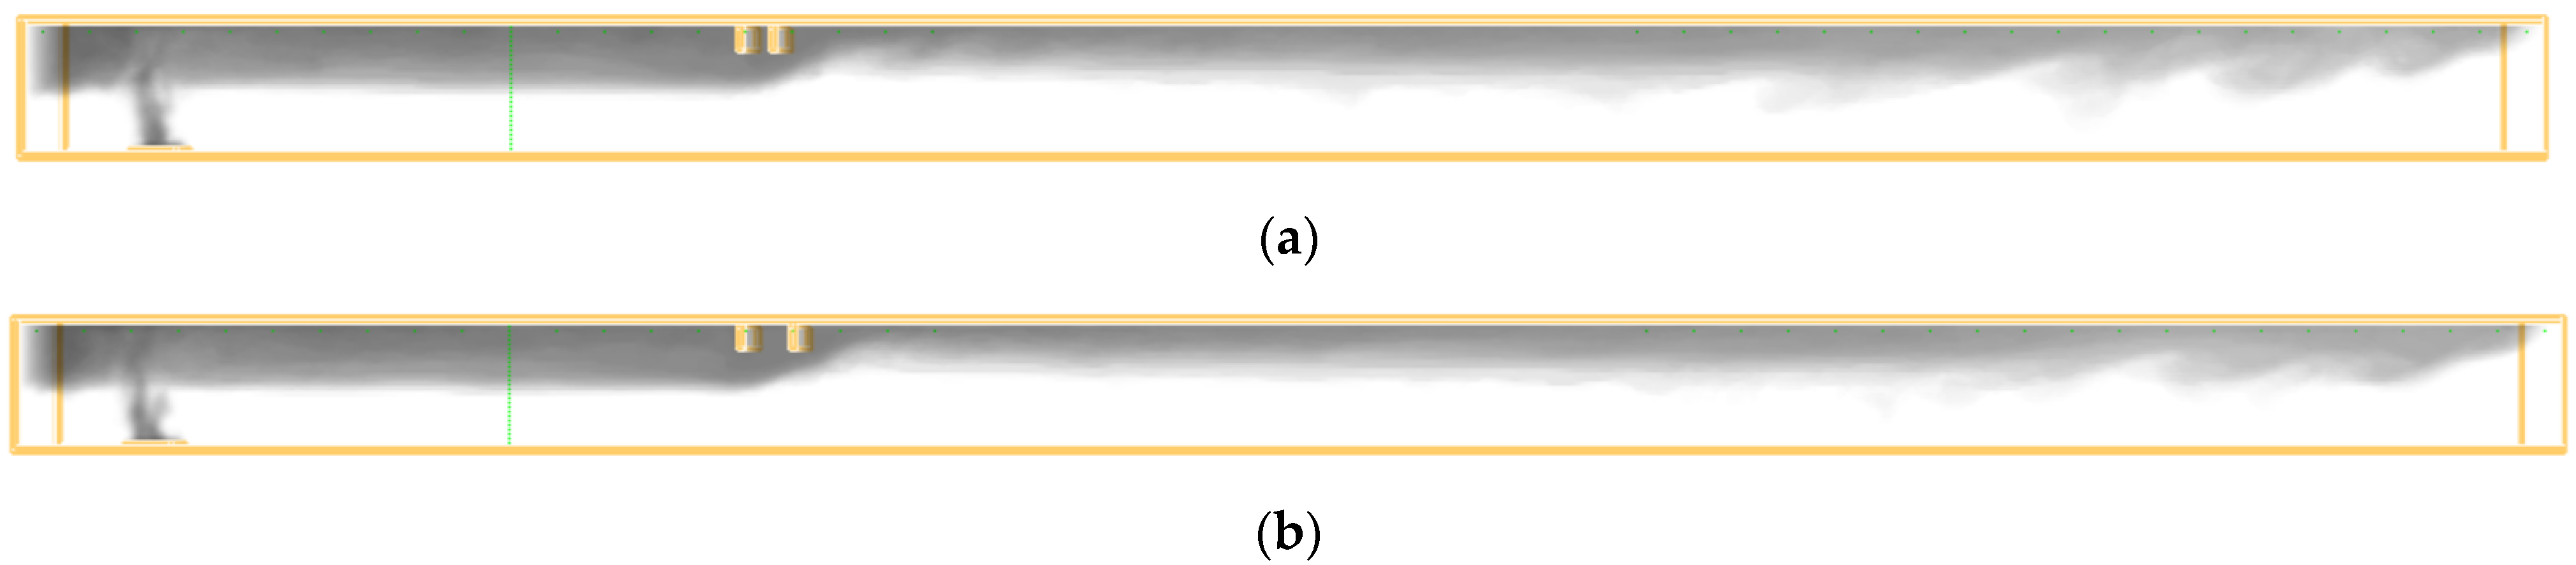
According to the description above, numerical simulations were conducted with a 60 kW fire source at one end of the corridor, simulating the early stages of a fire. The simulation results indicate that with multiple roof structures for smoke control, the smoke spread time is 208 s, compared to 98.3 s without smoke blocking structures, resulting in an increase of 110 s in smoke spread time. The temperature of the smoke at the end of the corridor decreases from 30 °C without smoke control structures to 24 °C with smoke control structures, demonstrating an effective smoke control effect. The simulated smoke distribution is shown in Figure 12.
According to Figure 12, although multi-roof structures slow down the flow of smoke, they increase the thickness of the smoke layer. When the corridor has no roof structure, only one roof structure, or multiple roof structures are installed, the thickness of the smoke layer at the same location (7 m from the fire source) is 1.2 m, 1.6 m, and 1.8 m, respectively. When the thickness of the smoke layer is large, the clear height of the corridor decreases, which will not meet the conditions for people to pass through the corridor from the space close to the ground.
From the simulation results of this case, it can be seen that when a roof structure is installed in the corridor, the thickness of the smoke layer is close to the thickness when multiple roof structures are installed. Setting up smoke-blocking vertical walls at regular intervals in long corridors to divide smoke prevention zones is currently a common method in building smoke prevention design. Therefore, corridors with smoke-blocking walls that have already been installed will not excessively worsen the evacuation conditions of the corridors. Of course, when designing the roof structure, attention should be paid to the changes in the thickness of the smoke layer caused by it to prevent excessive smoke layer thickness in important evacuation channels.

4.2.4. Discussion on the Application of This Study

In China’s fire safety regulations, smoke screens are used as partitions for smoke prevention zones. The function of the smoke screens is to cooperate with the smoke exhaust outlet to limit the smoke within the smoke prevention zone. The main function of the smoke blocking structures mentioned in this paper is to slow down the flow rate of smoke. The two have similar appearances but different functions. In practical applications, it should be noted that multiple roof structures should be placed in corridors connecting the main spaces. It is not advisable to install such structures in large spaces to prevent smoke from flowing smoothly into the smoke exhaust system. At the same time, smoke suppression in multiple roof structures needs to be coordinated with smoke exhaust systems or natural smoke exhaust windows. When blocking the flow of smoke to other spaces, the smoke in the burning space should be discharged to the outside as soon as possible. The multiple roof structures can be typically used in long corridors connecting buildings and the interior corridors of some old buildings. Other building corridors can also use multiple roof structures to block smoke. Even multiple roof structures not designed for smoke suppression, such as decorative ceilings, beams, etc., can refer to the conclusions of this paper to optimize their spacing and maximize their additional smoke suppression effect.

5. Conclusions

In order to slow down the flow of fire smoke in the corridors of buildings, this paper conducted numerical simulations and similar experiments to investigate the impact of the spacing between double-roof structures on the smoke spread time. The study analyzed the smoke characteristics and flow velocities in a corridor. Additionally, numerical simulation methods were employed to explore the design approach for spacing roof smoke control structures in optimal spaces. The specific conclusions are as follows:
(1) Through numerical simulation and similar experiments, the influence law of the distance between two structures on smoke flow is revealed. Too large or too small a distance is not conducive to blocking the spread of fire smoke. The smoke can be divided into three flow zones based on the flow state of the smoke after passing through the front smoke blocking structure, namely the vortex zone, surge zone, and steady flow zone. The smoke blocking effect is optimal when the rear smoke blocking is located in the surge zone. In the experiment, the optimal spacing of 15 cm-high structures is 10 cm. Through the analysis of smoke velocity, it is found that the change in structure spacing mainly affects the smoke velocity behind the structure.
(2) Through the analysis of the numerical simulation velocity vector diagram, it is suggested that the spacing between the two structures is slightly larger than the vortex area formed after the smoke passes through the first structure, and the smoke suppression effect is the best. The range of the vortex zone is directly proportional to the velocity of the smoke before it passes through the smoke blocking structure, and the proportional coefficient is approximately 1.
(3) Based on the real corridor size, the range of vortex area is determined by numerical simulation, and the distance slightly larger than this range is 0.9 m as the optimal distance, and the height of the smoke screen required by the code is 0.5 m as the height of the structure. The implementation method of smoke blocking structures in long and narrow spaces with a movable thin plate as the smoke blocking structure is designed. The numerical simulation results show that the design results can increase the time of smoke spreading through the corridor by nearly 110 s. Multiple roof structures will simultaneously increase the thickness of the smoke layer, which needs to be paid attention.

Author Contributions

Conceptualization, Z.W.; methodology, Z.W. and K.W.; software, Z.W., K.W., and L.S.; validation, Z.W., L.S., and H.S.; formal analysis, H.S. and K.L.; investigation, K.W.; resources, Z.W.; data curation, Z.W., K.W., and L.S.; writing—original draft preparation, Z.W. and K.W.; writing—review and editing, ALL Authors; visualization, Z.W. and K.W.; supervision, Z.W.; project administration, Z.W. and L.S.; funding acquisition, Z.W. All authors have read and agreed to the published version of the manuscript.

Funding

This paper is supported by the National Natural Science Foundation of China (No. 52004255) and the Henan Science and Technology Research Project (No. 232102320235, No. 222102320232).

Institutional Review Board Statement

Not applicable.

Informed Consent Statement

Not applicable.

Data Availability Statement

Data are contained within the article.

Conflicts of Interest

The authors declare no conflicts of interest.

References

  1. Huang, D.; Huang, L.; Jin, Q. Application status and typical case analysis of smoke exhaust tactics in fire field based on questionnaire survey. Fire Sci. Technol. 2023, 42, 137–141. [Google Scholar]
  2. Levin, B.C.; Braun, E.; Navarro, M.; Paabo, M. Further development of the N-gas mathematical model. In Fire and Polymers, 2nd ed.; Gordon, L.N., Ed.; American Chemical Society: Washington, DC, USA, 1995; Volume 599, pp. 293–311. [Google Scholar]
  3. Chen, C.; Xu, T.; Gao, F. Experimental study on fire burning characteristics and smoke control of 220 kV large cross-section cable in long and narrow space. China Saf. Prod. Sci. Technol. 2023, 19, 157–163. [Google Scholar]
  4. Shi, C.; Li, Y.; Huo, R. Model calculation and experimental study on smoke exhaust effect of indoor fire machinery. Combust. Sci. Technol. 2003, 06, 546–550. [Google Scholar]
  5. Tanaka, F.; Harada, N.; Yamaoka, S.; Moinuddin, K.A. Fire control and self-extinguishment by blocking smoke flow with water spray in a tunnel fire. Fire Saf. J. 2024, 142, 103999. [Google Scholar] [CrossRef]
  6. Ellis, F.H.; Yao, S. Influence of smoke control and exhaust system on smoke spread in arched subway station hall. Chin. J. Undergr. Space Eng. 2022, 18, 1383–1391+1400. [Google Scholar]
  7. Xu, Z.; Zhang, H.; Liang, T. Influence of coupling effect of smoke screen and water mist on smoke migration in pipe gallery cable fire. Science. Technol. Eng. 2023, 23, 2219–2227. [Google Scholar]
  8. Zheng, Z.; Hou, L. Study on the control of tunnel fire by automatic smoke screen. Saf. Environ. Eng. 2011, 18, 69–73. [Google Scholar]
  9. Liu, Y.; Liu, F.; Weng, M.; Obadi, I.; Geng, P. Research on thermal-driven smoke control by using smoke curtains during a subway platform fire. Int. J. Therm. Sci. 2022, 172, 107255. [Google Scholar] [CrossRef]
  10. Zhao, H.; Zhang, H.; Feng, J. Smoke temperature control of subway tunnel fire by smoke barrier facilities. J. N. China Univ. Sci. Technol. 2021, 43, 81–85+95. [Google Scholar]
  11. Kunsch, J.P. Simple model for control of fire gases in a ventilated tunnel. Fire Saf. J. 2002, 37, 67–81. [Google Scholar] [CrossRef]
  12. Huan, W.; Qi, Q.; Zhou, X. Study on the influence of smoke-proof hanging wall on the temperature distribution of long channel ceiling. China Saf. Sci. J. 2017, 27, 24–30. [Google Scholar]
  13. Huan, W.; Qi, Q.; Jiang, H. Study on the characteristics of smoke transport in long and narrow channels under the action of smoke screen. China Saf. Prod. Sci. Technol. 2017, 13, 150–156. [Google Scholar]
  14. Meng, N.; Hu, L.; Zhu, S.; Yang, L. Effect of smoke screen height on smoke flow temperature profile beneath platform ceiling of subway station: An experimental investigation and scaling correlation. Tunn. Undergr. Space Technol. 2014, 43, 204–212. [Google Scholar] [CrossRef]
  15. Chow, W.K.; Wong, K.; Chung, W. Longitudinal ventilation for smoke control in a tilted tunnel by scale modeling. Tunn. Undergr. Space Technol. 2010, 25, 122–128. [Google Scholar] [CrossRef]
  16. Chaabat, F.; Creyssels, M.; Mos, A.; Wingrave, J.; Correia, H.; Marro, M.; Salizzoni, P. The effects of solid barriers and blocks on the propagation of smoke within longitudinally ventilated tunnels. Build. Environ. 2019, 160, 106207. [Google Scholar] [CrossRef]
  17. Zhang, S.; Shi, Y.; Shi, L.; Wu, Y.; Wang, J.; Liu, J.; Yao, Y. Numerical study on lateral centralized smoke extraction in immersed tunnel with a new-style inclined smoke barrier. Case Stud. Therm. Eng. 2023, 42, 102770. [Google Scholar] [CrossRef]
  18. Zhao, W.; Wang, T.; He, L.; Tao, H.; Xu, Z. Influences of inclined tunnel ceiling on plug-holing phenomenon and mechanical smoke exhaust efficiency in tunnel fires. Fire Mater. 2022, 46, 818–829. [Google Scholar] [CrossRef]
  19. Halawa, T.; Safwat, H. Fire-smoke control strategies in road tunnels: The effectiveness of solid barriers. Case Stud. Therm. Eng. 2021, 27, 101260. [Google Scholar] [CrossRef]
  20. Jia, J.; Tian, X.; Wang, F. Research on smoke control for an underground mall fire, based on smoke barrier and mechanical smoke exhaust system. Sci. Rep. 2022, 12, 13071. [Google Scholar] [CrossRef]
  21. Shao, L.; Jiang, Y.; Yang, J. Study on the mechanism of roof structure blocking smoke spread in narrow space. J. Light Ind. 2021, 36, 95–101. [Google Scholar]
  22. Shao, L.; Yang, J.; Li, Z. Numerical simulation of smoke spreading in long and narrow space with different spacing and smoke screen blocking fire. Safety 2020, 41, 59–62. [Google Scholar]
  23. Hu, L.; Huo, R.; Peng, W.; Chow, W.K.; Yang, R. On the maximum smoke temperature under the ceiling in tunnel fires. Tunn. Undergr. Space Technol. 2006, 21, 650–655. [Google Scholar] [CrossRef]
  24. Chen, Z.; Liu, Z.; Huang, L.; Niu, G.; Yan, J.; Wang, J. Research on the effect of ceiling centralized smoke exhaust system with air curtains on heat confinement and plug-holing phenomenon in tunnel fires. Process Saf. Environ. Prot. 2023, 169, 646–659. [Google Scholar] [CrossRef]
  25. Zhong, W.; Sun, C.; Bian, H.; Gao, Z.; Zhao, J. The plug-holing of lateral mechanical exhaust in subway station: Phenomena, analysis, and numerical verification. Tunn. Undergr. Space Technol. 2021, 112, 103914. [Google Scholar] [CrossRef]
Figure 1. Schematic diagram of the function of setting multiple roof structures in the building connecting corridor.
Fire 07 00091 g001
Figure 2. Schematic diagram of the numerical simulation model.
Fire 07 00091 g002
Figure 3. Temperature variation curves of the end thermocouple simulated under different grid size conditions.
Fire 07 00091 g003
Figure 4. Smoke migration speed vector after the smoke crosses through the smoke blocking structure.
Fire 07 00091 g004
Figure 5. Schematic diagram of the experimental model.
Fire 07 00091 g005
Figure 6. Experimental photos of smoke blocking structures with different spacing. (a) The spacing of the smoke screens is 15 cm. (b) The spacing of the smoke screens is 40 cm.
Fire 07 00091 g006aFire 07 00091 g006b
Figure 7. Wind speed curves before and after experimental smoke blocking structures with different spacings. (a) The spacing is 4 cm. (b) The spacing is 10 cm. (c) The spacing is 15 cm. (d) The spacing is 20 cm. (e) The spacing is 30 cm. (f) The spacing is 40 cm.
Fire 07 00091 g007
Figure 8. Schematic diagram of smoke crossing the roof structure.
Fire 07 00091 g008
Figure 9. Partial diagram of a simulated vortex of a single smoke blocking structure.
Fire 07 00091 g009
Figure 10. Comparison of reasonable spacing of smoke blocking structures. (a) The spacing is 0.7 m, 106 s. (b) The spacing is 1.1 m and 108 s.
Fire 07 00091 g010
Figure 11. Schematic diagram of implementation method of multi-smoke blocking structures. (a) Smoke-blocking structure as a whole. (b) Top view and section view of the track. (c) Schematic diagram of card slot.
Fire 07 00091 g011
Figure 12. Comparison simulation of smoke flow status between with and without smoke blocking structures. (a) Non-roof structure 98.3 s. (b) One roof structure 105.4 s. (c) Multi-roof structure 208 s.
Fire 07 00091 g012
Table 1. Table of simulation results of the time when the smoke reaches the right end of the corridor within the smoke screen space of 0.2~6.5 m.
Smoke Screen Spacing (m)The Time to Reach the Right End of the Corridor (s)
0.226.5
0.527.1
0.7527.4
1.026.0
1.527.2
2.027.8
2.528.3
3.029.5
3.531.6
4.031.8
4.531.9
5.032.3
5.531.1
628.6
6.528.7
Table 2. Experimental results of spacing between the smoke blocking structures and smoke spread time.
Smoke Screen Spacing (cm)Smoke Spread Time (s)
1015
1514
2010
308
408
Disclaimer/Publisher’s Note: The statements, opinions and data contained in all publications are solely those of the individual author(s) and contributor(s) and not of MDPI and/or the editor(s). MDPI and/or the editor(s) disclaim responsibility for any injury to people or property resulting from any ideas, methods, instructions or products referred to in the content.

