Article

A Model for Assessing the Potential Impact Radius of Hydrogen Pipelines Based on Jet Fire Radiation

1
State Key Laboratory of Chemical Safety, Qingdao 266071, China
2
SINOPEC Research Institute of Safety Engineering Co., Ltd., Qingdao 266071, China
3
National Registration Center for Chemicals, Ministry of Emergency Management, Qingdao 266071, China
4
SINOPEC National Petrochemical Project Risk Assessment Technical Center Co., Ltd., Qingdao 266071, China
5
School of Safety Engineering, Changzhou University, Changzhou 213164, China
*
Author to whom correspondence should be addressed.
Submission received: 7 December 2023 / Revised: 19 January 2024 / Accepted: 21 January 2024 / Published: 26 January 2024
(This article belongs to the Special Issue Fire Safety of the New Emerging Energy)

Abstract

:
The accurate determination of the potential impact radius is crucial for the design and risk assessment of hydrogen pipelines. The existing methodologies employ a single point source model to estimate radiation and the potential impact radius. However, these approaches overlook the jet fire shape resulting from high-pressure leaks, leading to discrepancies between the calculated values and real-world incidents. This study proposes models that account for both the mass release rate, while considering the pressure drop during hydrogen pipeline leakage, and the radiation, while incorporating the flame shape. The analysis encompasses 60 cases that are representative of hydrogen pipeline scenarios. A simplified model for the potential impact radius is subsequently correlated, and its validity is confirmed through comparison with actual cases. The proposed model for the potential impact radius of hydrogen pipelines serves as a valuable reference for the enhancement of the precision of hydrogen pipeline design and risk assessment.

1. Introduction

Hydrogen pipeline transmission stands out as a highly efficient and cost-effective method for transporting hydrogen over long distances, particularly when compared to alternatives such as tube trailers and liquid hydrogen tankers [1,2]. Safety concerns within the international community arise due to the increased risk of leakage associated with hydrogen embrittlement [3]. In the event of a leak, the ignition of hydrogen poses a potential threat, as its low ignition energy, high flame speed, wide flammable limits, and elevated combustion heat make it susceptible to fire or explosion. Risk assessment has become a widely employed approach for evaluating the hazards associated with hydrogen systems, with numerous studies focusing on hydrogen stations, vehicles, pipelines, and other high-pressure hydrogen systems [4,5,6,7,8,9,10,11,12]. While many prior investigations concentrated on hazard analysis, some delved into quantitative risk assessment (QRA). It is crucial to recognize that quantitative risk assessment for hydrogen stations or vehicles differs fundamentally from that applied to long-distance hydrogen pipelines. In the quantitative risk assessment for stations or vehicles, the probability of equipment-specific leakage remains constant. In contrast, the probability of leakage for long-distance pipelines is influenced by diverse factors, including equipment impact, external corrosion, internal corrosion, stress corrosion cracking, manufacturing defects, construction defects, geotechnical hazards, equipment failure, incorrect operation and maintenance, and seismic hazards, among others. Consequently, the probability of leakage is not uniform throughout the hydrogen pipeline.
Moreover, pinpointing the location of hydrogen leaks in stations or vehicles is relatively straightforward, while the evaluation of an entire pipeline, spanning hundreds of kilometers, is less efficient. Therefore, the concept of a high consequence area (HCA) is introduced. A high consequence area is defined as an area where a gas pipeline accident could lead to significant consequences, causing considerable harm to people and property [13]. Given that the primary hazard of gas pipeline leakage is thermal radiation from a sustained jet fire [13], the potential impact radius is established to determine the high consequence area. This radius is associated with the heat flux of a sustained jet fire that ignites immediately after a pipeline rupture; it is based on the single point source heat flux model, which assumes that the flame is a single point and ignores the influence of the flame shape.
A collaborative effort by C-FER Technologies, the Gas Technology Institute, and the El Paso Pipeline Group has proposed a model for calculating the potential impact radius of natural gas pipelines [13]. In the quantitative risk assessment of high-pressure tanks, the pressure is sometimes assumed to be constant during the whole process of leakage in order to provide relatively conservative results. However, in the quantitative risk assessment of hydrogen pipelines, the pressure inside the pipeline decreases with time. Thus, the initial mass flow rate is calculated first; then, an equivalent mass flow rate is obtained that takes the pressure drop into account [13]. More details of the mass flow rate are given in Section 2. One should note that two aspects are taken into consideration with regard to mass flow rate calculation:
(1)
The pressure inside the hydrogen pipeline decays with time;
(2)
The rupture leads to a double-ended gas release.
With the further use of the release rate decay factor λ (λ = 0.33) and the constant 2, representing the pressure decay and double-ended gas release respectively, the equivalent mass flow rate is 2 λ times the initial mass flow rate. It is to be noted that more details of λ are given in Section 2. By further applying the equivalent mass flow rate to the single point source model and using 15.8 kW/m2 as the radiation threshold, Equation (1) and the value 0.099 are derived [13]. It is to be noted that the single point source model takes the jet fire as one single point and neglects the influence of flame shape on radiation. The previous model for the potential impact radius (Equation (1)) was validated by the data from the National Transportation Safety Board (NTSB) of the United States and the Transportation Safety Board (TSB) of Canada. In total, 12 practical cases were validated, and Equation (1) shows the reasonable and conservative results. One possible explanation is that Equation (1) assumes immediate ignition. While in real cases, the actual time for ignition is longer. Thus, the mass flow rate in Equation (1) is more conservative than the real cases [13]. It is to be noted that Equation (1) is limited to natural gas pipelines and is not applicable to hydrogen pipelines. The pipeline diameter (d, m) and operating pressure (p, Pa) are utilized in Equation (1) to determine the potential impact radius (r, m):
r = 0.099 p d 2
Other studies have similarly correlated the potential hazard area with the pipeline diameter and operating pressure of natural gas pipelines [14,15]. However, there is a scarcity of research specifically addressing the potential impact radius of hydrogen pipelines. The American Society of Mechanical Engineers (ASME) has put forth a model for the potential impact radius of hydrogen pipelines, as articulated in Equation (2a,b) [16]:
r = 0.47 p d 2
r = 0.068 p d 2
It is to be noted that the only difference between Equation (2a) and Equation (2b) is the units. In Equation (2a), the unit of r is ft, the unit of p is psi, and the unit of d is inches. In Equation (2b), the unit of r is mm, the unit of p is MPa, and the unit of d is m [16].
It is essential to recognize that the previously mentioned models for the potential impact radius are predicated on the following assumptions [13]: (1) The direction of leakage is assumed to be vertical; this takes into account the fact that high-pressure hydrogen encounters obstacles such as soil, leading to the formation of a crater in the ground. This directional assumption is made because the impingement on obstacles dissipates some of the momentum, redirecting the jet fire in a more vertical manner. (2) A single point source model is employed to calculate jet fire radiation. This model simplifies the jet flame as a single point and neglects the influence of flame shape on radiation. It is to be noted that radiation is highly influenced by the flame shape. In the single point source model, the radiation is determined by the heat release rate and the distance from the jet fire to the point receiving the radiation. This means that as long as the heat release rate is the same, for the same position, the radiation from a relatively tall jet fire is the same as the radiation from a relatively short pool fire, which deviates from practical cases. Therefore, the assumption of the single source point is beneficial in terms of a quick calculation; however, it introduces inaccuracy in the radiation calculation, particularly for the near field. It is important to note that Equation (1) considers factors such as the incomplete combustion of the gas escaping from the leakage and the emissivity factor of the fire. (3) The potential impact radius model considers a hazardous event involving pipeline rupture, resulting in a double-ended gas release that triggers a fire immediately upon leakage. One should note that in real cases, it is possible that a fireball happens after pipeline leakage. And the assumption is that immediate ignition takes the fireball into consideration by calculating the sustained jet fire immediately ignited after the pipeline leakage [13]. However, the high-pressure leakage of the pipeline leads to a large jet fire which cannot be understood as one single point. And previous works demonstrated that a high-pressure hydrogen jet fire in the vertical direction is long in length and narrow in width [17]. Moreover, the accuracy of the single point source model diminishes as the target approaches the flame. Recognizing this limitation, various researchers, including the American Petroleum Institute (API) and Sandia National Laboratories (SNL), have employed a weighted multi-source model to predict the radiation from gas jet fires [18,19]. The weighted multi-source model takes the flame as a 2-dimensional flame which is similar to the shape of jet flames in real cases [17,19]. Compared with the single point source model, the weighted multi-source model divides the whole flame into parts and calculates the radiation of each part separately. The sum of all the parts is the radiation of the whole flame. Additionally, the combustion intensity varies in the parts, and a weight factor is used to consider the different contributions of each part to the radiation of the whole hydrogen jet fire. It is to be noted that in addition to the heat release rate and the distance from the flame, the radiation of the weighted multi-source model is determined by how many parts are divided and the weight factor of each part. Some researchers used a convergence study to determine the number of parts. Others used empirical values. The distance from a single part to the flame is influenced by the flame shape. In summary, by dividing the flame into parts, assigning the weighted factor, and calculating the radiation of each part individually, the weighted multi-source model allows for the flame shape.
Although the weighted multi-source model considers flame shape, it introduces complexities in the radiation calculations, impeding its widespread industrial applicability. Compared with single point source model (Equations (1) and (2)), which uses a linear calculation, the weighted multi-source model introduces integration and adds complexity. One should also note that many CFD methods incorporate the discrete ordinate method or the discrete transfer mode and the weighted sum of gray gases model to calculate radiation; these models are more complicated than the weighted multi-source model.
Therefore, as the potential impact radius is determined by radiation, there is a need for a new model to assess the potential impact radius to determine the high consequence area (HCA) for hydrogen pipelines. This study simulates the potential impact radius of hydrogen pipelines under actual conditions and proposes a simplified model based on the weighted multi-source model. This new model aims to enhance the risk assessment of hydrogen pipelines and to serve as a valuable reference for industry design.

2. Radiation Threshold for Potential Impact Radius

Based on previous work on the high consequence area, when the radiation is below the radiation threshold of the potential impact radius [13]:
(1)
The people located outdoors when failure happens would be exposed to a low and finite chance of fatality.
(2)
The property represented by a typical wooden structure would not ignite and burn, thereby providing indefinite protection for people indoors when failure happens.
The radiation threshold for a potential impact radius is 15.8 kW/m2, accounting for the impact on the effect of thermal load on both people and property [13]. Assuming an individual is exposed to radiation for 30 s and would remain in position for 1–5 s to evaluate the situation and then run with a 2.5 m/s speed towards a shelter, the estimated distance of people traveling within this period is 60 m. It is assumed that a shelter is located within 60 m of individuals. Then, under 30 s of exposure, 15.8 kW/m2 is the significant threshold leading to a 1% chance of fatality [13,20,21]. And when a wooden structure is exposed to 15.8 kW/m2 radiation, spontaneous ignition is improbable, and piloted ignition will only occur after approximately 20 min of exposure [20]. Therefore, it is posited that when the radiation is below 15.8 kW/m2, the wooden structures would not be destroyed and would provide indefinite protection for the individuals [13]. This 15.8 kW/m2 threshold of radiation is applicable for hydrogen pipelines, as indicated in ASME B31.12 [16].

3. A Model for Assessing Potential Impact Radius

3.1. Equivalent Mass Release Rate

In contrast to other high-pressure hydrogen systems, the mass release rate of hydrogen pipelines diminishes over time as the pressure difference between the leaking pipelines and the atmosphere gradually decreases. For example, in the quantitative risk assessment of a high-pressure vessel of hydrogen, some researchers assume no pressure drop in order to provide conservative risk results [18]. However, in the long-distance pipeline quantitative risk assessment, the pressure drop cannot be neglected [13]. To account for this pressure decay, an equivalent mass release rate model is introduced. Initially, the mass release rate resulting from hydrogen pipeline leakage is calculated using Crane Co.’s model [22], which considers high-pressure leakage leading to sonic or choked flow, as shown in Equation (3):
m ˙ R G m a x = C d A h γ P 1 ρ 2 1 + γ γ + 1 γ 1 1 / 2
P 2 P 1 2 1 + γ γ γ 1
where m ˙ R G m a x ( k g / s ) is the initial mass rate; Cd is the frictional coefficient and has no unit; A h (m2), which is calculated as π d 2 / 4 , is the area of the leakage hole of the hydrogen pipeline cross-section; d is the diameter of the rupture, namely the pipeline diameter in the present work (m) [13]; γ is the adiabatic constant; P 1 P 0 + P a (Pa) is the absolute pressure inside the pipeline; P 2 ( P 0 + ρ w g H 0 ,   Pa) is the absolute atmosphere pressure; P 0 (Pa) is the effective gauge operating pressure; P a (Pa) is the ambient pressure; ρ (kg/m3), which is calculated as P 0 + P a M w R T 1 , is the ideal gas density; M w (kg/mol) is the molar mass of hydrogen; R (Jmol−1K−1) is the ideal gas constant; and T1 (K) is the temperature of hydrogen. By further considering the pressure drop and the double-ended leakage of hydrogen pipelines, as well as the integration of the release rate decay factor λ = 0.33 [13,23], the equivalent mass release rate m ˙ R G e q u is obtained, as shown in Equation (4):
m ˙ R G e q u = 2 λ m ˙ R G m a x
One should note that the decay factor is likely to represent a steady state of pipeline rupture when λ is in the range of 0.2~0.5, and some researchers report the decay factor of 0.25 . More recently, the decay factor of 0.33 was used to provide more conservative results to ensure that the sustained jet fire radiation, as well as the potential influence of a fireball, was not underestimated. The value of 0.33 has been widely used in natural gas pipeline quantitative risk assessment [13].

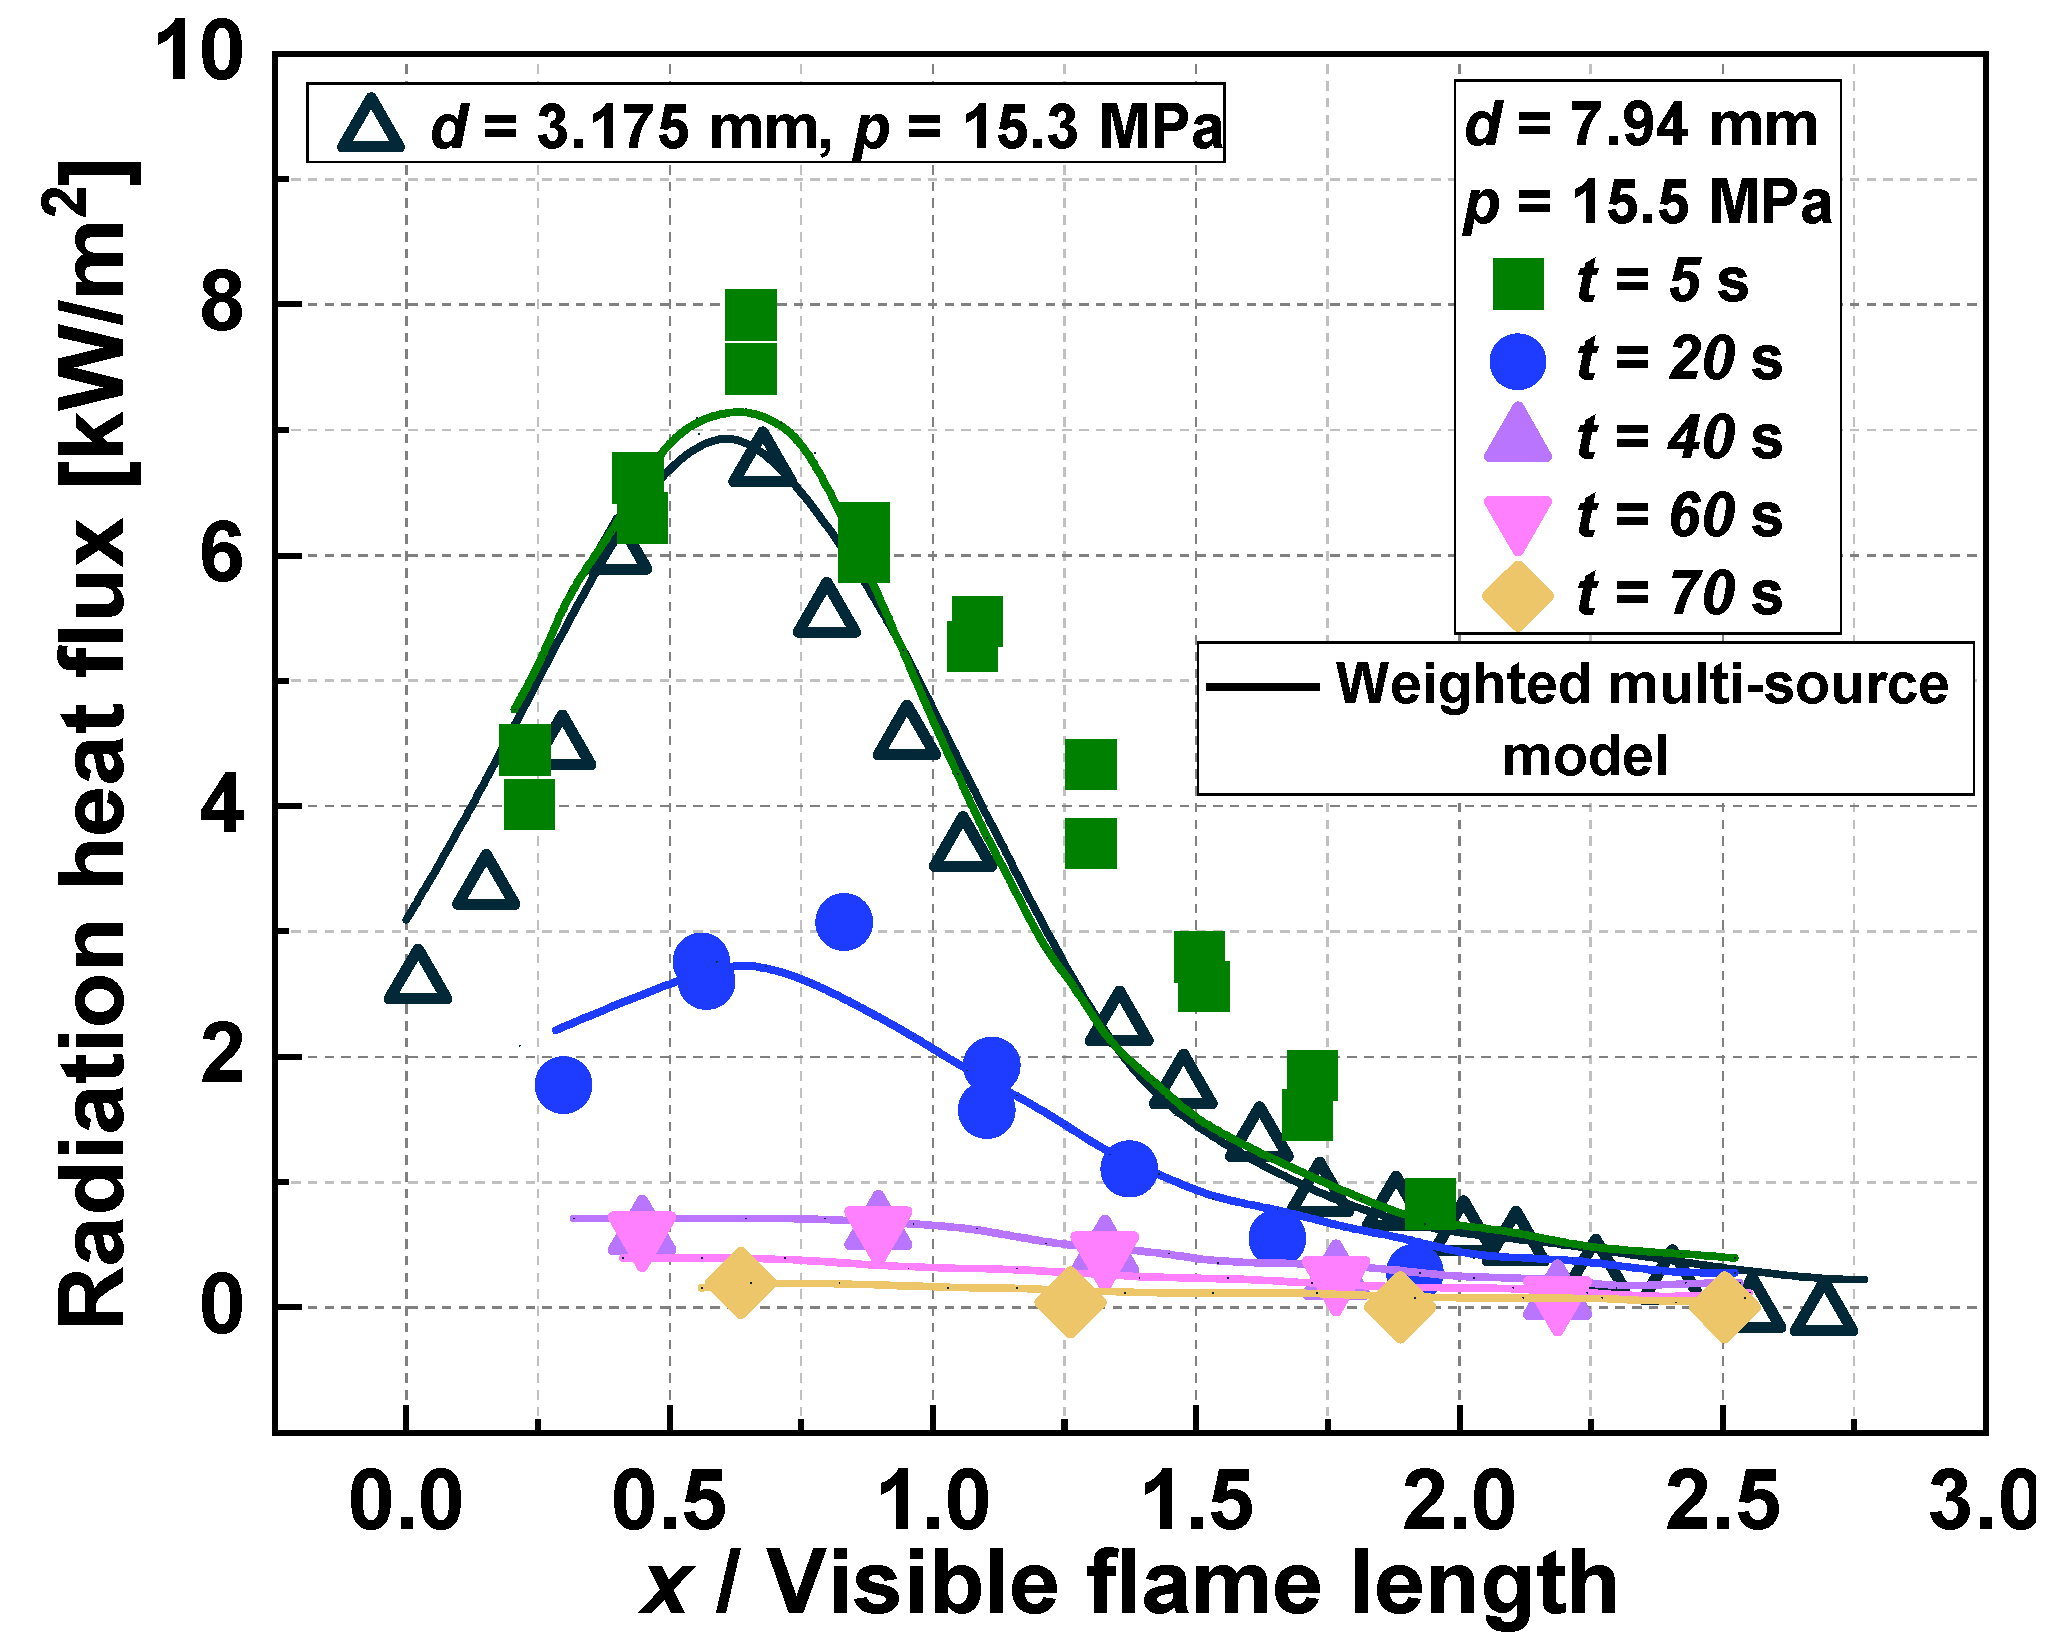
3.2. Flame Radiation Model

The weighted multi-source model involves dividing the entire flame into N points and assigning a weight wi to each point. The heat release rate P (kW) is calculated using Equation (5). The radiation of each point is understood as an independent part, and the radiation of part i is calculated individually, as shown in Equation (6). As shown in Equation (7), wi is used because the intensity of each part is different. The total radiation of the entire flame is the sum of each point, as illustrated in Equations (5)–(9) [24,25]:
P = χ m ˙ R G e q u Δ H c
q i = P w i c o s β i 4 π D i 2 τ i
w i = i w 1 , i 0.75 N n n 1 N n 1 , i > 0.75 N
q = i = 1 N q i = P i = 1 N w i c o s β i 4 π D i 2 τ i
τ i = 1.006 0.01171 l o g 10 X H 2 O 0.02368 l o g 10 X H 2 O 2 0.03188 l o g 10 X C O 2 + 0.001164 l o g 10 X C O 2 2
where χ is the radiation fraction, Δ H c is the combustion heat (kJ/kg), τ i is the transmissivity, and β i and D i are the angle and distance between the point and the observer. Therefore, the flame geometry, including flame length and flame tilt, is accounted for as the flame geometry influences β i and D i . X H 2 O and X C O 2 are the proportional amounts of water vapor and CO2 in the path. One should note that the transmissivity is constant through the whole flame in the present work. Equation (1) considers the incomplete combustion of natural gas, whose main component is methane. The minimum ignition energy and the flammable limits of methane are 0.28 mJ and 5% to 15%, while the minimum ignition energy and flammable limits of hydrogen are 0.017 mJ and 4.25% to 75%. Compared with methane, the minimum ignition energy of hydrogen is low and the flammable limits of hydrogen are wide; therefore, the combustion efficiency of the hydrogen jet fire is 1.
Various researchers employ different values for N. The American Petroleum Institute (API) uses N = 10 for hydrocarbon jet fires, while Miller et al. use N = 30 for hydrogen and syngas jet fires [19,26]. On the other hand, Sandia National Laboratories (SNL) follow the approach of Lowesmith et al., utilizing N = 50 [18,24]. It is to be noted that the values of N are given directly in previous works [19,24]. In this study, N = 50 is employed to ensure a more accurate and detailed result. It is to be noted that Figure 1 shows the validation of Equation (8). Figure 1 compares the radiation calculation results of the weighted multi-source model with the experimental data from previous works [27,28]. The x-axis is the non-dimensional length, which is defined as the ratio of x and the visible flame length. x is defined as the horizontal distance to the leakage point. And the y-axis is the radiation heat flux (kW/m2). The hollow triangles in Figure 1 indicate the experimental results of Schefer, with the leakage diameter of 3.175 mm. The initial temperature is assumed to be 294 K, and the initial pressure is 15.3 MPa [28]. The solid dots in Figure 1 indicate the experimental results of Schefer regarding different times after leakage, with the leakage diameter of 7.94 mm and the initial pressure of 15.5 MPa. The gas temperature at the jet exit is predicted to be 258 K to 284 K. The radiation changes with time as the pressure changes with time [27]. In previous work, the visible, infrared (IR), and ultraviolet (UV) digital images of the flame were used to obtain the flame shape. The average flame length over five successive frames was then taken to discuss the flame properties and to provide quantitative data, and the visible flame lengths from the averaged visible digital images were used for the radiation calculation [28]. The curved lines indicate the results calculated by the weighted multi-source model. In total, 59 experimental data points from previous works are used to validate Equation (10). Nineteen data points are derived from the experimental condition when the leakage diameter is 3.175 mm and the initial pressure is 15.3 MPa [27]; these are the black hollow triangles is Figure 1. Additionally, 40 data points are derived from the experimental condition when the leakage diameter is 7.94 mm and the initial pressure is 15.5 MPa [27]; these are the green, blue, purple, pink, and yellow solid points in Figure 1. This comparison demonstrates that the weighted multi-source model effectively captures the characteristics of high-pressure hydrogen leakage.

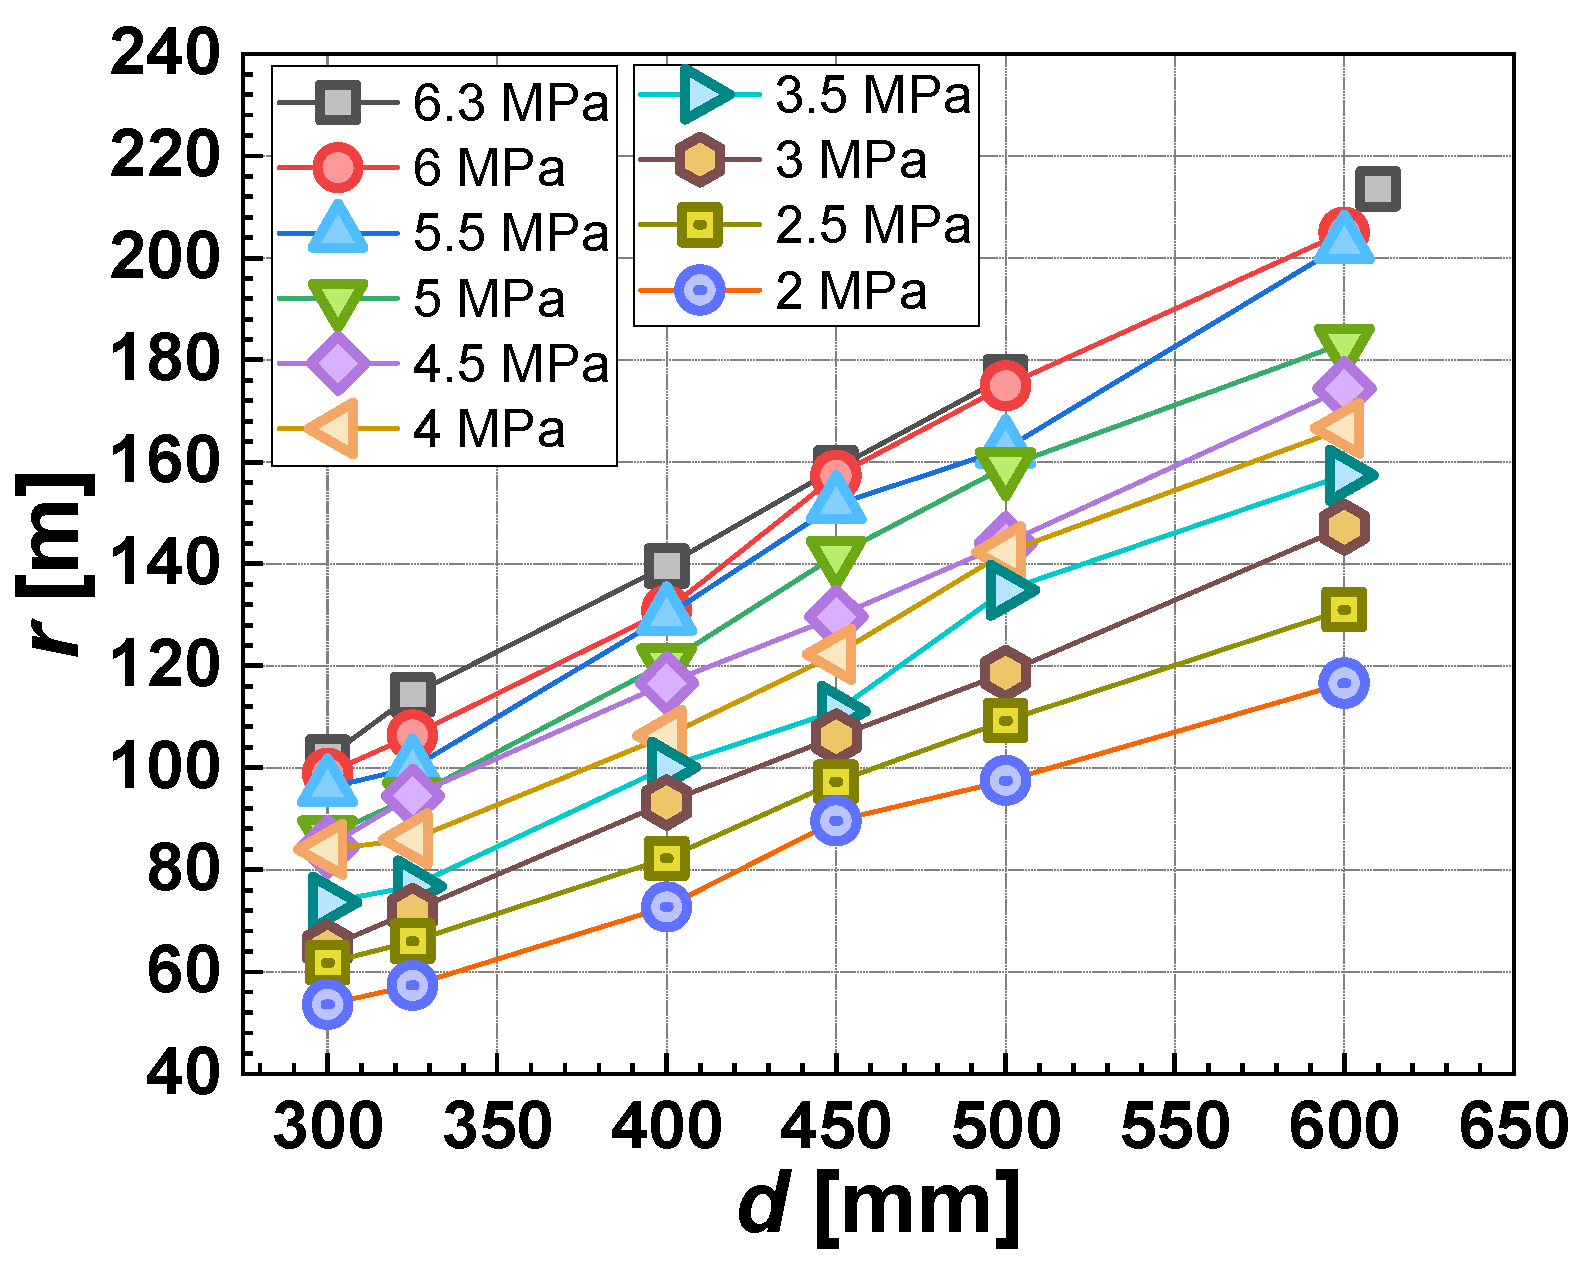
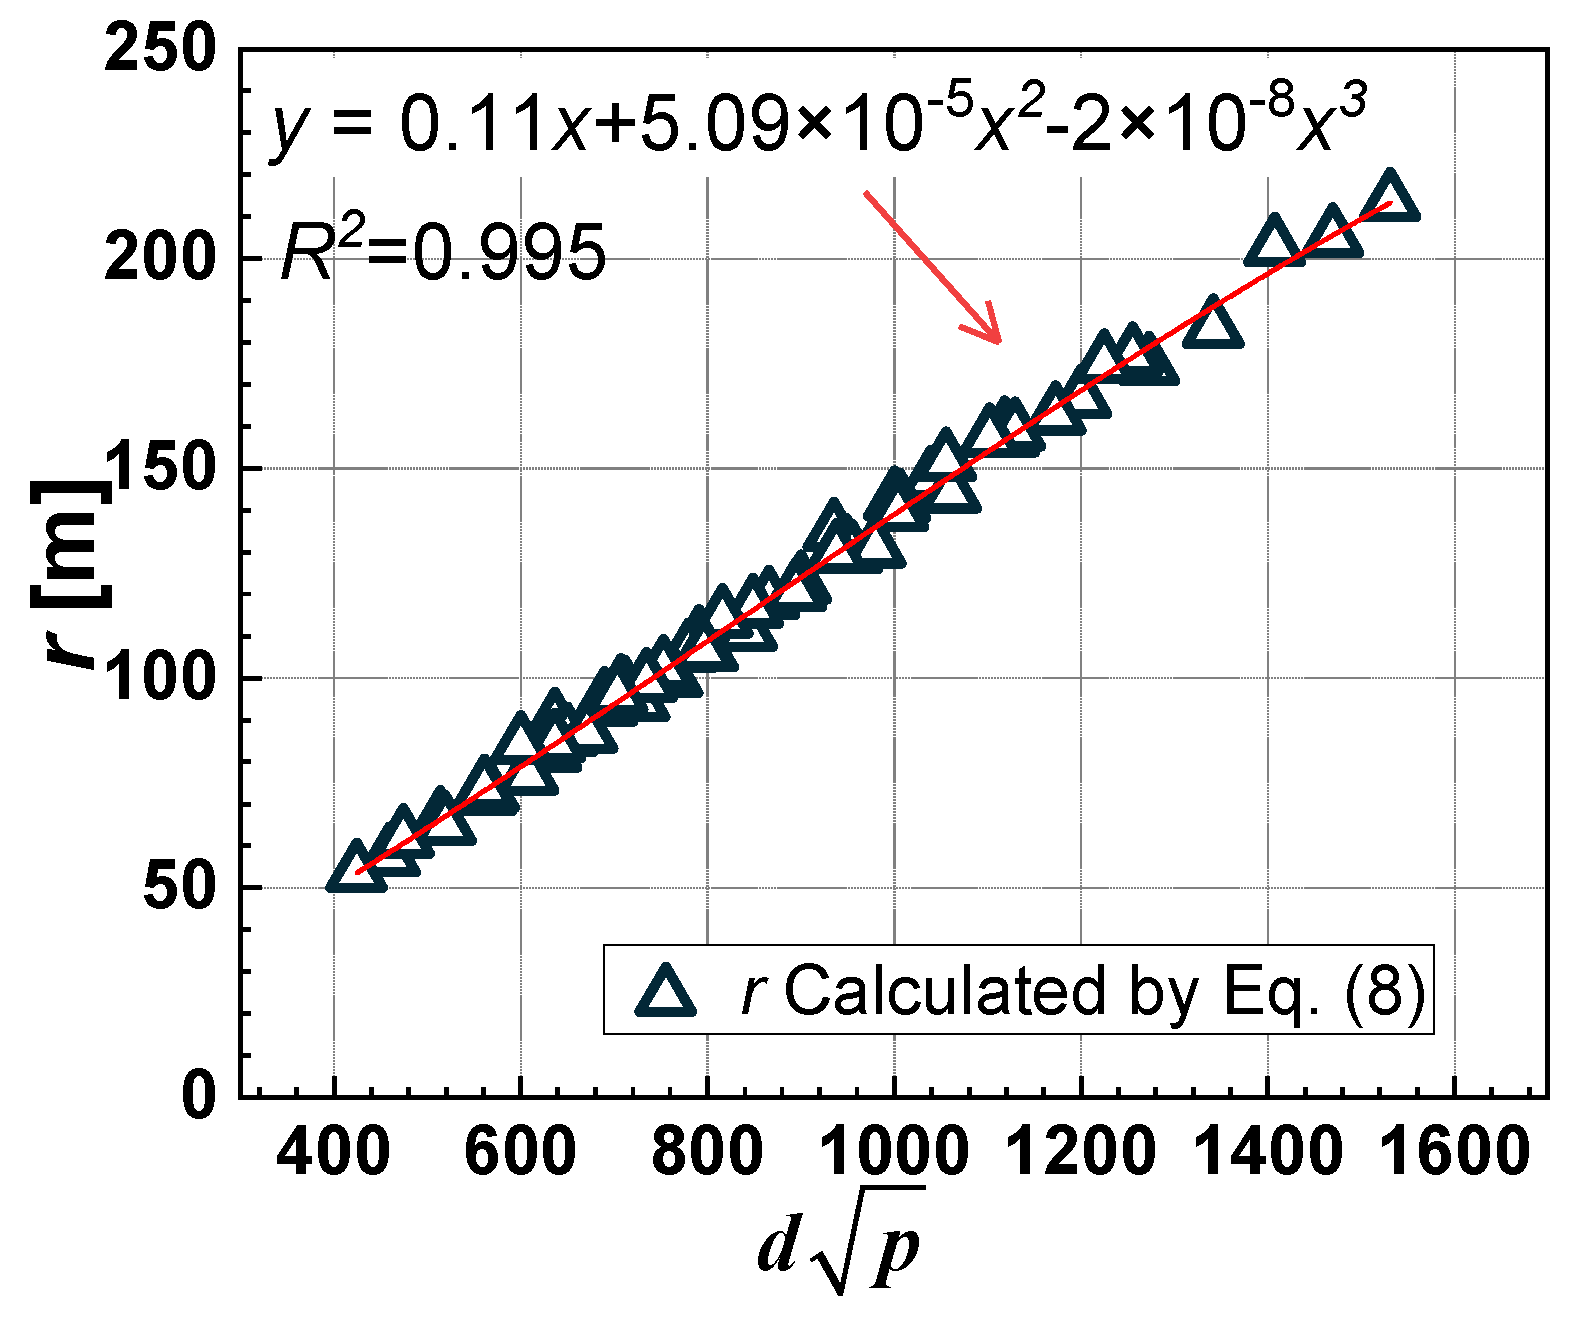
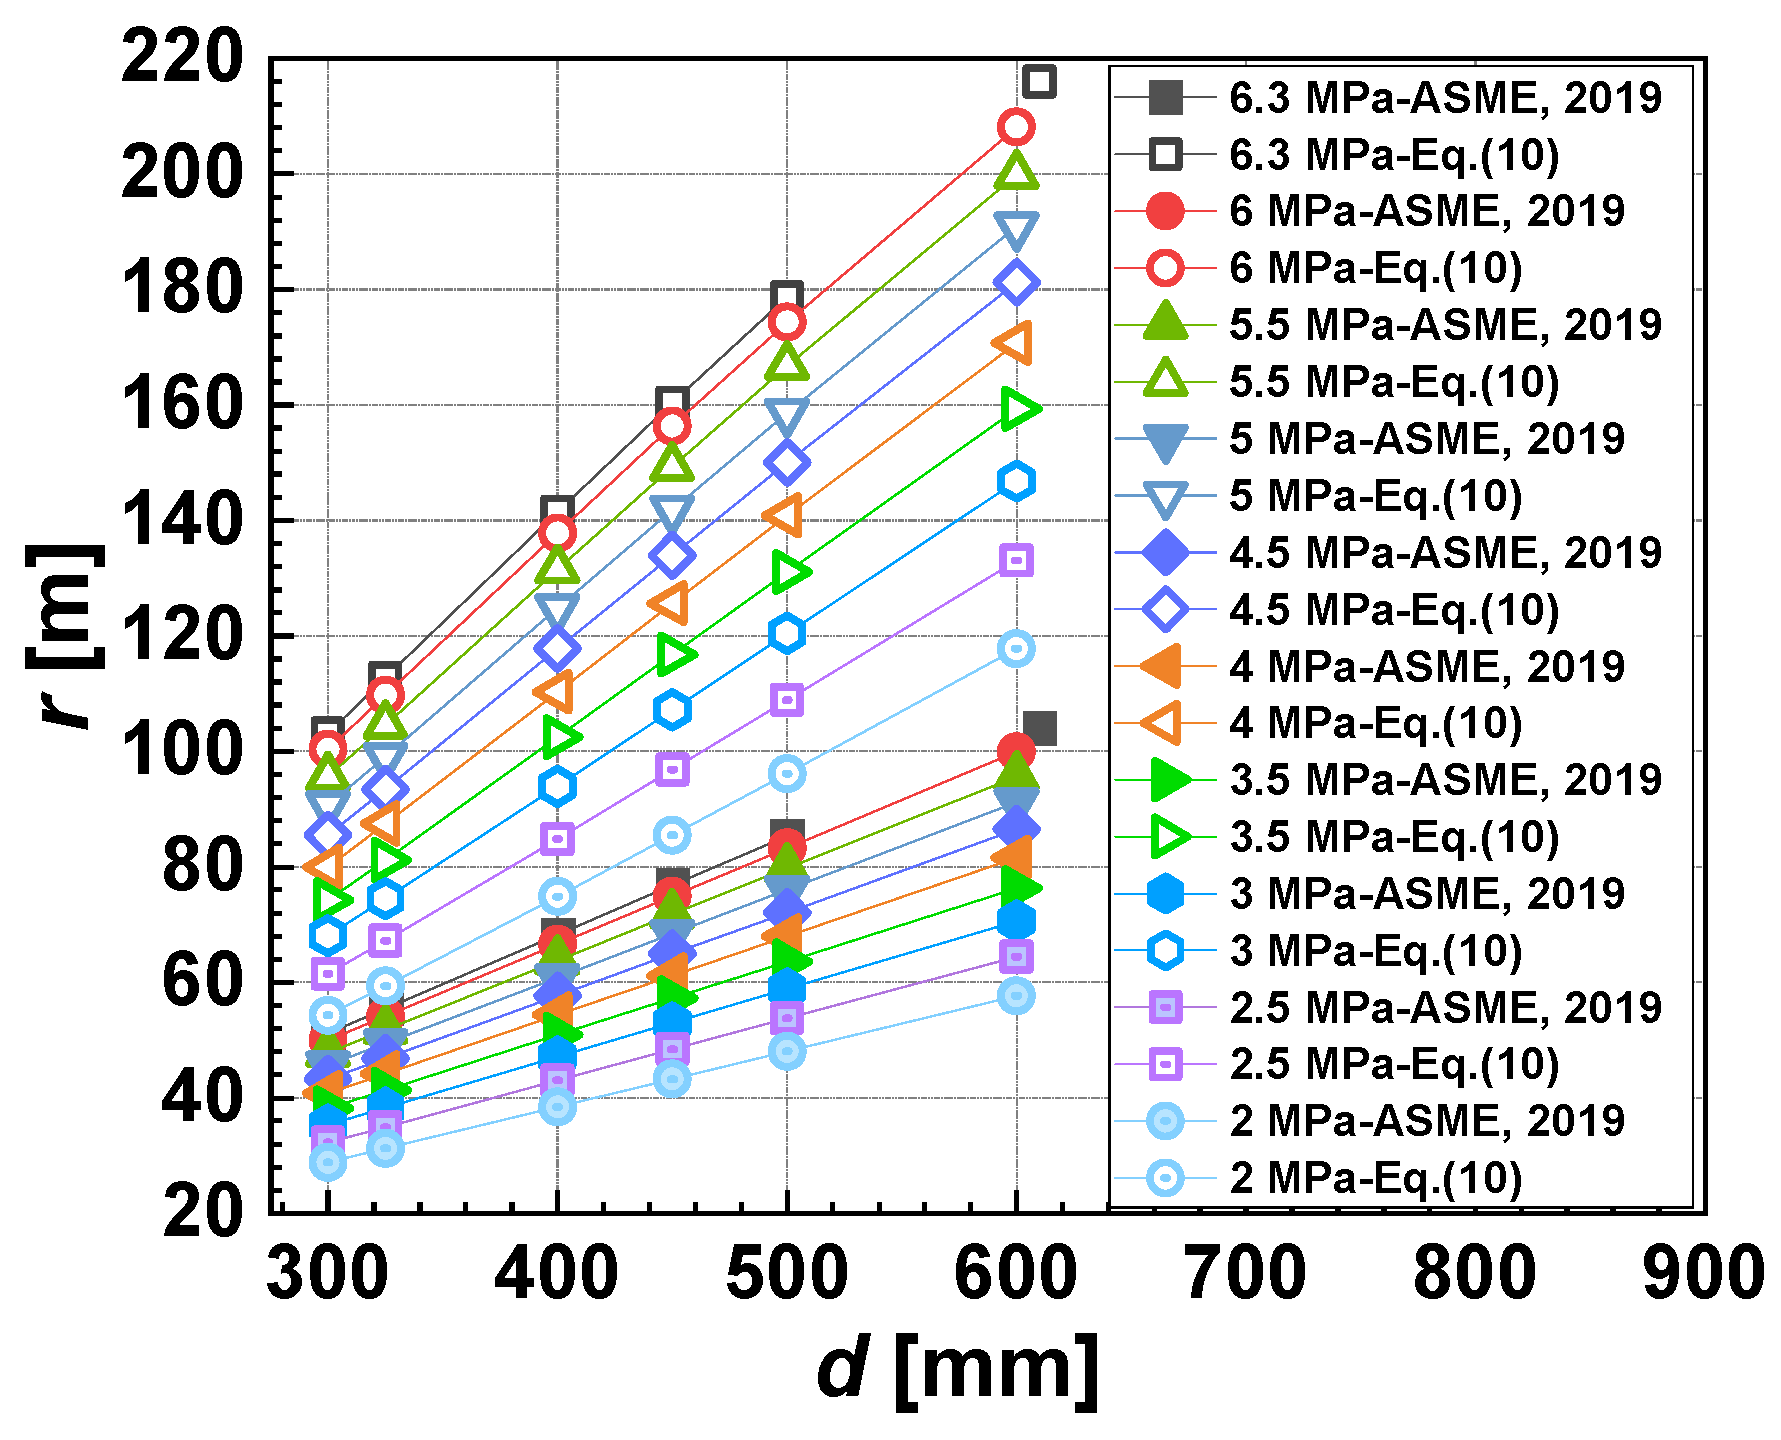
3.3. Potential Impact Radius for Hydrogen Pipelines

The potential impact radius (r) for hydrogen pipelines represents the horizontal distance from the leakage point to the location where the radiation reaches 15.8 kW/m2. The radiation is calculated with the aforementioned model in Section 3.2, with the pipeline diameter varying from 300 mm to 610 mm and operation pressure from 2 MPa to 6.3 MPa. And the temperature inside the hydrogen pipeline is 294 K. A total of 60 cases were computed with Equations (1)–(9), as depicted in Figure 2. It is to be noted that these conditions encompass real-world hydrogen pipelines. All the conditions are shown in Table 1. The calculated values of the potential impact radius increase with the increase in pipeline diameter and operating pressure, affirming the applicability of Equation (8) for the potential impact radius calculation.
However, Equation (8) is relatively intricate compared to Equation (2), making it less suitable for swift industrial calculations. Consequently, a new correlation is proposed, as illustrated in Figure 3. It is noteworthy that the characteristic factor d p is employed, which is consistent with Equations (1) and (2). It is to be noted that in Equation (10), the unit of d is mm, the unit of p is MPa, and the unit of r is m.
r = 0.11 d p + 5.09 × 10 5 d p 2 2 × 10 8 d p 3
As shown in Figure 3, the new proposed correlation Equation (10) agrees well with the data, with an R square of 0.995. One should note that the applicability of the proposed model is limited to the calculation of the potential impact radius for the hydrogen pipelines. The properties, including the combustion heat and density of methane, are needed to revise Equation (10), if applying Equation (10) to natural gas pipelines.

4. Results and Discussion

Figure 4 and Figure 5 compare the potential impact radius based on the single point source model proposed by ASME (Equation (2)) with the proposed model (Equation (10)). The x-axis is the diameter of the pipeline rupture. The y-axis is the potential impact radius calculated by the previous model (Equation (2)) or the proposed model (Equation (10)). Notably, no other work has been reported on the potential impact radius of hydrogen pipelines other than Equation (2). It is evident that regardless of the model used, for a given pipeline diameter, the potential impact radius increases with the rise in operating pressure. Similarly, for a given operating pressure, the potential impact radius increases with the augmentation of the pipeline diameter. Notably, the potential impact radius calculated by Equation (2) appears consistently smaller than that obtained from Equation (10). It is worth mentioning that the potential radius calculated by the single point source model has been reported to be significantly smaller than the potential impact radius in real-case pipeline leakages [29]. Given the absence of reported incidents of long-distance hydrogen pipeline leakage, the proposed model for the potential impact radius is validated using data from a natural gas pipeline incident published online. In this case, an Enbridge Corporation natural gas pipeline, with a diameter of 762 mm and a maximum operating pressure of 6.45 MPa, experienced a leak. The potential impact radius calculated using the point source model was 192.9 m. It is to be noted that the data were collected and measured by the National Transportation Safety Board, and the information on the incident was reported in Natural Gas Transmission Pipeline Rupture and Fire (Pipeline Investigation Report: NTSB/PIR-22/02) online [29]. However, the reported fatality occurred 195 m south of the leakage, and the furthest distance from a damaged structure to the leakage point was 335 m—both significantly larger than the calculated 192.9 m with Equation (1) [29]. Figure 6 compares the reported data with the potential impact radius calculated using Equations (8)–(10). In Figure 6, the y-axis is the reported or calculated potential impact radius. From left to right, the four bars in Figure 6 represent the calculated results of Equation (2), the calculated results of the proposed model Equation (10), the furthest distance causing a 1% fatality reported, and the furthest distance causing house damage reported. It is important to note that the properties of methane were employed in the proposed model to calculate the potential impact radius for the natural gas pipeline. Figure 6 illustrates that the results from the proposed model are closer to the accurate values compared to the previous model based on the point source model. As the definition of the potential impact radius is the distance where: (1) the fatality is 1% and (2) the structure could provide infinite protection, 335 m (orange bar in Figure 6, indicating the position where the structure could provide infinite protection) is used as the potential impact radius for the previous incident. And the accuracy of the potential impact radius is improved by 38%. This validation indicates that the proposed model aligns well with actual incidents, offering a simplified approach for calculating the potential impact radius for hydrogen pipelines. The results agree well with real-case scenarios and contribute to the improved risk assessment of hazard zones and pipeline design.
By proposing models for the equivalent mass flow rate and utilizing a weighted multi-source model for radiation, a simplified model for quick industrial calculation is obtained to access the potential impact radius for hydrogen pipelines. The improvement and novelty of the present model are due to the consideration of the shape of the hydrogen jet fire, as well as the increase in the accuracy of the radiation calculation and the improved potential impact radius calculation. And one should note that Equation (10) is applicable for hydrogen pipelines. With more models and incident data reported for hydrogen pipelines, the further validation of Equation (10) would make an interesting future work.

5. Conclusions

The potential impact radius (r) serves as a crucial parameter in the risk assessment of hydrogen pipelines, delineating the horizontal distance from the leakage to the point where the radiation reaches 15.8 kW/m2. Previous methodologies relied on the single point source model to calculate radiation, overlooking the impact of the flame shape. This study, encompassing 60 cases, introduces a novel model for the potential impact radius and considers the geometric characteristics of the jet flame induced by high-pressure leakage. The key findings include:
(1)
A model for assessing the potential impact radius is proposed, including an equivalent mass release rate that considers the pressure drop of the hydrogen pipeline leakage and a radiation model based on a weighted multi-source model;
(2)
A simplified correlation (Equation (10)) is proposed to calculate the potential impact radius and to provide a reference for industrial use. The proposed model consistently yields more accurate results than the single point source model. The validation against an actual pipeline leakage demonstrates good agreement with real-world scenarios.
This work presents a model for assessing the potential impact radius of hydrogen pipelines based on jet fire radiation, supporting safety design and risk assessment in hydrogen pipeline applications. With more hydrogen pipeline information reported, more validation of the present work will be necessary in future works.

Author Contributions

Conceptualization, Y.L. (Yujie Lin), A.Y. and W.D.; methodology, Y.L. (Yujie Lin) and X.L.; software, Y.L. (Yujie Lin), C.K. and Y.L. (Yi Liu); validation, Y.L. (Yujie Lin) and Y.Z.; formal analysis, Y.L. (Yujie Lin); data curation, Y.L. (Yujie Lin); writing—original draft preparation, Y.L. (Yujie Lin); writing—review and editing, Y.L. (Yuan Lu); supervision, A.Y., Y.L. (Yi Liu) and W.D.; funding acquisition, Y.L. (Yujie Lin). All authors have read and agreed to the published version of the manuscript.

Funding

This research was funded jointly by the National Natural Science Foundation of China, grant numbers 52206190 and 52306171, and the Ministry of Science and Technology of China Petroleum and Chemical Corporation, grant number 122072.

Institutional Review Board Statement

Not applicable.

Informed Consent Statement

Not applicable.

Data Availability Statement

Data are contained within the article.

Acknowledgments

We are grateful to the editor and anonymous reviewers for their valuable comments, which improved this paper significantly.

Conflicts of Interest

Authors Yujie Lin, Anfeng Yu, Yi Liu and Chen Kuang were employed by the company SINOPEC Research Institute of Safety Engineering Co., Ltd., Authors Xiaolong Liu and Yang Zhang were employed by the company SINOPEC National Petrochemical Project Risk Assessment Technical Center Co., Ltd. The remaining authors declare that the research was conducted in the absence of any commercial or financial relationships that could be construed as a potential conflict of interest.

References

  1. Du, Y.; Liu, Y.; Zhou, F.; Li, Z.; Ma, L.; Liu, B. Evaluation of blast wave from hydrogen pipeline burst by a coupled fluid-structure-rupture approach. Int. J. Hydrogen Energy 2023, 55, 696–703. [Google Scholar] [CrossRef]
  2. Faye, O.; Szpunar, J.; Eduok, U. A critical review on the current technologies for the generation, storage, and transportation of hydrogen. Int. J. Hydrogen Energy 2022, 47, 13771–13802. [Google Scholar] [CrossRef]
  3. Crowl, D.; Jo, Y.D. The hazards and risks of hydrogen. J. Loss Prevent Proc. 2007, 20, 158–164. [Google Scholar] [CrossRef]
  4. Yu, X.; Kong, D.; He, X.; Ping, P. Risk Analysis of Fire and Explosion of Hydrogen-Gasoline Hybrid Refueling Station Based on Accident Risk Assessment Method for Industrial System. Fire 2023, 6, 181. [Google Scholar] [CrossRef]
  5. Virtue, B.; Salehi, F.; Abbassi, R. Safety Assessment of Hydrogen Jet Fire Scenarios within Semi-Confined Spaces. Fire 2023, 6, 29. [Google Scholar] [CrossRef]
  6. Ma, Q.; He, Y.; You, J.; Chen, J.; Zhang, Z. Probabilistic risk assessment of fire and explosion of onboard high-pressure hydrogen system. Int. J. Hydrogen Energy 2023, 50, 1261–1273. [Google Scholar] [CrossRef]
  7. Zhang, J.; Shi, M.; Lang, X.; You, Q.; Jing, Y.; Huang, D.; Dai, H.; Kang, J. Dynamic risk evaluation of hydrogen station leakage based on fuzzy dynamic Bayesian network. Int. J. Hydrogen Energy 2023, 50, 1131–1145. [Google Scholar] [CrossRef]
  8. Wang, X.; Gao, W. Hydrogen leakage risk assessment for hydrogen refueling stations. Int. J. Hydrogen Energy 2023, 48, 35795–35808. [Google Scholar] [CrossRef]
  9. Ramon, S.; Marcelo, H.; Adiel, T. Portfolio-based decision model for enhancing the mitigation of multidimensional risks in hydrogen pipeline sections. Process Saf. Environ. 2023, 175, 700–714. [Google Scholar]
  10. Francisco, F.; Marcelo, H.; Rodrigo, J.; Adiel, T. Multidimensional risk assessment and categorization of hydrogen pipelines. Int. J. Hydrogen Energy 2022, 47, 18424–18440. [Google Scholar]
  11. Bedford, T.; Wilson, K.; Daneshkhah, A. Assessing parameter uncertainty on coupled models using minimum information methods. Int. J. Hydrogen Energy 2014, 125, 3–12. [Google Scholar] [CrossRef]
  12. Lins, P.; Almeida, A. Multidimensional risk analysis of hydrogen pipelines. Int. J. Hydrogen Energy 2012, 37, 13545–13554. [Google Scholar] [CrossRef]
  13. Stephens, M.; Leewis, K.; Moore, D. A Model for Sizing High Consequence Areas Associated with Natural Gas Pipelines. In Proceedings of the 4th International Pipeline Conference, Calgary, AB, Canada, 29 September–3 October 2002. [Google Scholar]
  14. Knowles, E.; Tweedle, F.; Van, L. The Background and Implications of IGE/TD/1 Edition 2; Gas Engineering and Management: London, UK, 1978; p. 247. [Google Scholar]
  15. Institute of Gas Engineers. Steel Pipelines for High Pressure Gas Transmission. Recommendations on Transmission and Distribution Practice IGE/TD/1 Edition 4; The Institution of Gas Engineers: London, UK, 1977. [Google Scholar]
  16. American Society of Mechanical Engineers. Hydrogen Piping and Pipelines; American Society of Mechanical Engineers: New York, NY, USA, 2019. [Google Scholar]
  17. Wang, C.; Wen, J.; Chen, Z.; Dembele, S. Predicting radiative characteristics of hydrogen and hydrogen/methane jet fires using FireFOAM. Int. J. Hydrogen Energy 2014, 39, 20560–20569. [Google Scholar] [CrossRef]
  18. Ehrhart, B.; Hecht, E. Hydrogen Plus Other Alternative Fuels Risk Assessment Models (HyRAM+) Version 4.1 Technical Reference Manual; SAND2022-5649; Sandia National Laboratories: Albuquerque, NW, USA, 2022.
  19. Miller, D. New model for predicting thermal radiation from flares and high pressure jet fires for hydrogen and syngas. Process Saf. Prog. 2017, 36, 237–251. [Google Scholar] [CrossRef]
  20. Bilo, M.; Kinsman, P. Thermal Radiation Criteria Used in Pipeline Risk Assessment. Pipes Pipelines Int. 1997, 42, 17–25. [Google Scholar]
  21. Eisenberg, N.; Lynch, C.; Breeding, R. Vulnerability Model: A Simulation System for Assessing Damage Resulting from Marine Spills. In Environmental Control; Report CG-D-136-75; Transportion Research Board: Rockville, MD, USA, 1975. [Google Scholar]
  22. Crane, C. Flow of Fluids through Valves, Fittings and Pipe, Metric Edition—SI Units; Technical Paper No. 410M; Crane: New York, NY, USA, 1981. [Google Scholar]
  23. TNO. Safety Study on the Transportation of Natural Gas and LPG by Underground Pipeline in the Netherlands; Netherlands Organization for Applied Scientific Research, Ref. No. 82-04180, File No. 8727-50960 [R]; Translation of a Report by the Division of Technology for Society; The Minister of Public Health and Environmental Hygiene: Enthe Hague, The Netherlands, 1982.
  24. Hankinson, G.; Lowesmith, B. A consideration of methods of determining the radiative characteristics of jet fires. Combust. Flame 2012, 159, 1165–1177. [Google Scholar] [CrossRef]
  25. Wayne, F. An economical formula for calculating atmospheric infrared transmissivities. J. Loss Prevent Proc. 1991, 4, 86–92. [Google Scholar] [CrossRef]
  26. Ekoto, I. Updated jet flame radiation modeling with buoyancy corrections. Int. J. Hydrogen Energy 2014, 39, 20570–20577. [Google Scholar] [CrossRef]
  27. Ehrhart, B.; Hecht, E.; Mohmand, J. Validation and Comparison of HyRAM Physics Models’ Sandia Report SAND2010-8676; US Department of Energy: Washington, DC, USA, 2021.
  28. Houf, W.; Schefer, R. Predicting radiative heat fluxes and flammability envelopes from unintended releases of hydrogen. Int. J. Hydrogen Energy 2007, 32, 136–151. [Google Scholar] [CrossRef]
  29. Enbridge Corporation. Natural Gas Transmission Pipeline Rupture and Fire (Pipeline Investigation Report: NTSB/PIR-22/02); Enbridge Corporation: Hillsboro, KY, USA, 2022. [Google Scholar]
Figure 1. Comparison of weighted multi-source model and experimental results [27,28].
Fire 07 00038 g001
Figure 2. The potential impact radius calculated by Equation (8).
Fire 07 00038 g002
Figure 3. Correlation of potential impact radius (r) for hydrogen pipelines.
Fire 07 00038 g003
Figure 4. Comparison of ASME [16] (Equation (2)) and new proposed model (Equation (10)) for hydrogen pipeline leakage with the same pipeline diameter.
Fire 07 00038 g004
Figure 5. Comparison of ASME [16] (Equation (2)) and new proposed model (Equation (10)) for hydrogen pipeline leakage with the same operation pressure.
Fire 07 00038 g005
Figure 6. Comparison between the actual pipeline incident and the proposed model.
Fire 07 00038 g006
Table 1. Calculated conditions.
Operation Pressure (MPa)Pipeline Diameter (mm)
6.3, 6, 5.5, 5, 4.5, 4, 3.5, 3, 2.5, 2610, 600, 500, 450, 400, 325, 300
Disclaimer/Publisher’s Note: The statements, opinions and data contained in all publications are solely those of the individual author(s) and contributor(s) and not of MDPI and/or the editor(s). MDPI and/or the editor(s) disclaim responsibility for any injury to people or property resulting from any ideas, methods, instructions or products referred to in the content.

