Article

Surface Wildfire Regime and Simulation-Based Wildfire Exposure in the Golestan National Park, NE Iran

1
Faculty of Agriculture and Natural Resources, University of Mohaghegh Ardabili, Ardabil 56199-11367, Iran
2
National Research Council of Italy, Institute of BioEconomy (CNR IBE), 07100 Sassari, Italy
3
Soil Erosion and Degradation Research Group, Department of Geography, Valencia University, Blasco Ibàñez, 28, 46010 Valencia, Spain
*
Author to whom correspondence should be addressed.
Fire 2023, 6(6), 244; https://doi.org/10.3390/fire6060244
Submission received: 14 May 2023 / Revised: 10 June 2023 / Accepted: 13 June 2023 / Published: 20 June 2023

Abstract

:
This research analyzes the spatiotemporal patterns of wildfire regime attributes (e.g., seasonality, size, frequency, and burn rate) across the Golestan National Park (GNP), northeast Iran over the last two decades. We used a variety of data, including existing vegetation data, current vegetation survey, and historical wildfire data, and then data were processed through ArcMap. We also predicted fire exposure profiles (burn probability (BP), conditional flame length (CFL (m)), and fire size (FS (ha)) by the application of the minimum travel time (MTT) fire spread algorithm. The kernel density estimation (KDE) method was used to estimate wildfire likelihood, based on recent wildfires (2000–2020) that occurred in the GNP. Finally, we developed a logistic regression model to investigate how independent variables such as weather, fuel, and topographic data influence wildfires in the park. Wildfires in the landscape have not been constant in either space or time. Their extent, seasonality, frequency, and other wildfire regime characters varied considerably across the landscape. Our results highlighted that shrublands in the southern part of the park showed, in general, the highest values in terms of the wildfire regime attributes. Large fires (10–100 ha, 51%) and very large fires (>100 ha, 24%), fire intervals greater than 10 years (90%), and high burn rates (>1% y−1, 35%) are all characteristics that contribute to high wildfire activity in shrublands. Similarly, areas predicted to have high wildfire exposure levels (average BP = 0.004; average CFL = 1.60 m; average FS = 840 ha) are found in the fuel models of high-load grass and medium-load shrub. Finally, the regression model results revealed that weather and fuel were the most influential parameters (R2 ≥ 0.2), while topography had comparatively less influence in the study area. In light of these results, we suggest proactively incorporating this information into fire and fuel management which can help develop a fire prevention plan, predict fire ignition probability and frequency, and finally address altered fire regimes threatening the park.

1. Introduction

Wildfires have been present in the Earth system since the vegetation colonized the continents, shaping biota and landforms; humans used them for 1 million years to manage the landscapes as hunters-gatherers, and later as farmers [1,2]. The distinct pattern in which wildfires naturally occur in a particular ecosystem during long periods is known as the wildfire regime [3,4]. The wildfire regime is a generalized description of the typical fire characteristics in a specific area during a given time, such as statistical distributions seasonality, fire return interval, size, intensity, and severity [5,6]. These attributes depend on various drivers including climate, land use/cover (LUC), and topography. However, several studies [7,8] highlighted—at the global level—a deviation from eco-climatic fire regimes towards anthropogenically driven regimes. That is, anthropogenic activities (fire suppression, fire policies, LUC, and vegetation changes) greatly influenced patterns of fire seasonality, normally driven by climate or weather [9]. In turn, under climate change, this situation can further introduce ecosystem changes, affecting ecosystem services.
Studies of past wildfire regimes presented a fire history and fire frequency analysis over the decades [10,11,12]. In these studies, examining the wildfire regime components is implemented for understanding the primary drivers, geographic patterns, and ecological effects of wildfires. For instance, Miller [13] et al. assessed trends and patterns in wildfire size and frequency and the percentage of high-severity wildfires in northwestern California, USA. In general, the percentage of these wildfires was less in years characterized by wildfires of lightning origin. Rogeau [14] et al. used historical data and a sampling strategy to identify past wildfires and calculate fire intervals in southern Canada. Large and high-severity wildfires identified wildfire regime patterns in the study area with mean fire intervals greater than 20 years. Dwomoh and Wimberly [6] identified the spatial patterns and relationship between wildfire regime variables and fire-conductive climate, topography, vegetation, and human factors in West Africa. Villarreal [15] et al. assessed different wildfire regime attributes across climate gradients and vegetation types during the period from 1985 to 2017 in the United States–Mexico borderlands. This approach identified broad-scale wildfire regime patterns, which can be used to understand the main drivers of wildfire and to guide forest and wildfire management efforts. Bergonse [16] et al. characterized four types of fire regimes and their biophysical drivers in central Portugal over 44 years. Furthermore, among biophysical drivers, LUC, slope, and spring rainfall were the most important. These results suggest that these identified wildfire regimes should be subject to specific wildfire mitigation and adaptation strategies.
In addition, to increase our understanding of historical wildfire regimes and how they may adapt to future environmental changes, we need to quantify the independent effects of key environmental drivers on wildfire behavior. Logistic regression methods have been commonly used to analyze the influence of environmental controls on a wildfire in different landscapes across the world [17,18,19,20]. These studies provided a model based on a set of independent environmental factors (weather, fuel, and topography) potentially affecting wildfires.
On the other hand, wildfire risk and exposure analysis are essential for facilitating comparisons across landscapes or fire and fuel management scenarios under different fire regimes. In this regard, burn probability (BP) models integrate both stochastic and deterministic elements of the wildfire regime and provide a framework for further wildfire risk and exposure analyses [21]. BP as a metric of wildfire risk analysis provides an estimate of relative fire likelihood given a specific degree of natural variability in the weather conditions and ignition pattern [22]. In fire-prone landscapes, modeling the distribution of wildfire likelihood and the potential fire behavior and impacts provides key information for effective planning, mitigation, and adaptation [23,24,25]. BP modeling was performed with the Canadian Burn-P3 (probability, prediction, and planning) [26], FSim (large-fire simulation system) [21], FlamMap [27] in the US, and Australian PHOENIX [28]. Several studies have focused on the BP-based risk assessments using recent wildfire data and environmental variables [29,30,31,32,33]. According to these studies, a quantitative framework to characterize wildfire exposure and risk profiles with objective variables such as BP and fire size (FS) has been proposed to help analyze the potential effectiveness of fire and fuel management strategies in fire-prone regions.
Measurements of historic wildfire regimes give a baseline for comparison of current conditions and suggested management [34]. Maps of wildfire regimes provide a broad context for wildfire and fuel management decisions because wildfire regimes reflect the fire environment [35]. However, few studies have specifically examined wildfire regimes in the temperate forest ecosystems of Iran [36,37,38,39], where wildfire is an important phenomenon shaping these ecosystems.
This study characterizes wildfire regimes across Golestan National Park (GNP), a natural protected area in the northeast of Iran. GNP was the first region designated as a national park in Iran and also the first Iranian national park listed on the UNESCO Biosphere Reserve List [40]. The main goal of this research was to examine the vegetation-specific fire regimes across the GNP through the following four parameters: seasonality, size, frequency, and burn rate. We explore and map the different wildfire regime components, as well as their regulating environmental factors, and model wildfire exposure patterns in the GNP landscape. In other words, the analysis of this research is about seeking answers to two important questions: (1) how are wildfire regime components and wildfire exposure parameters distributed across the landscape? and (2) what are the likely effects of the environmental factors on fire at the landscape scale? Considering the mapping of wildfire regime parameters and exposure metrics in the critical fire risk area, this study has a crucial role to play in strategic wildfire and land management planning, identifying high-risk areas, illustrating the changes in natural and human landscape characteristics through time, and highlighting how variations in environmental conditions influence wildfire risk.

2. Materials and Methods

2.1. Description of the Study Area

Golestan National Park (GNP) located in northeast of Iran, covers 87,402 ha, and the bounding coordinates are 37°17′ to 37°31′ N and 55°43′ to 56°17′ E (Figure 1; Table 1). The park is located between three of Iran’s provinces: east of Golestan, north of Semnan, and west of North Khorasan. GNP is primarily a transitional mountainous region between the western Khorasan–Kopet Dagh Mountains and the eastern Alborz Mountain, with average elevations of 1378 m [41]. According to Emberger’s classification, the park has three climate types: (1) cold-arid in the north, south, and east, (2) temperate semi-arid in the west and northwest, and (3) temperate sub-humid located in the west [42]. Southern and eastern areas receive less than 250 mm of rain per year on average, whereas the northeastern and north-central areas receive 300 to 500 mm. During the winter, mountainous portions of the study area are fully covered by snow. The mean annual temperature differs from 12 °C to 18 °C. From March to July and August, the temperature rises to its highest level and then declines to its lowest level in January and February [41]. The study area with the complexity of geology, landform, and climate has a high diversity of vegetation [43]. GNP is in the easternmost regions of Iran’s Caspian forests, constituting a transition zone between Artemisia steppes, juniper woodlands, the montane, and Hyrcanian temperate forests [44]. The transition between tree and grass ecosystems (forest–grassland ecotones) is also a unique and dynamic component of the GNP landscape. In general, there are seven vegetation units in the park, including closed forest, open woodlands and scrubs, mountain meadows, steppes, halophytic communities, hygrophilous and aquatic communities, and fern communities.

2.2. Input Data

To explore wildfire regime and model wildfire exposure patterns in the GNP, we collected three crucial input data: topography, weather, and vegetation. First, we needed geographically referenced data that covered the park to describe the fire patterns in terms of other descriptive factors. Topographic data (slope, aspect, and elevation) were available through a digital elevation model (DEM; 30 m resolution). Regarding weather conditions, we gathered hourly meteorological data from the weather stations of the Golestan Meteorology Department for the study period 2000–2020. Then, we calculated the average daily weather conditions in terms of temperature, humidity, wind speed, and precipitation. Vegetation description was extracted from the LUC map prepared based on Landsat 8 satellite OLI images (19/07/2020; path = 162; row = 34). The image processing steps include pre-processing, supervised maximum likelihood classification, preliminary LUC map (four classes), and qualitative assessment. The overall accuracy of the final LUC map of the park was 86.3%, and Cohen’s kappa was 0.77, as obtained by using ground truth points from field surveys. The basic LUC type identified within the park was vegetation (Figure 2).
Overall, the park covers three vegetation types: grass, shrub, and forest (Figure 2). According to the map, a significant GNP portion (49%, 42,470 ha), particularly in the eastern part, is covered by grasslands and herbaceous pastures. The area includes plains, mountains, and annual grassland ecosystems dominated by Artemisia sieberi Besser., Stipa barbata Desf., Agropyron spp., Bromus persicus Boiss., and Astragalus spp. Mediterranean shrubs (8%, 7312 ha) in the GNP comprised primarily of three dominant species of Juniperus communis L., Juniperus excelsa M. Bieb., Juniperus sabina L. along with Berberis vulgaris L. and Colutea arborescens L. Furthermore, approximately 41% of the park (35,950 ha) is covered by forests. Temperate broadleaf forests are mostly represented by oak (Quercus castaneifolia CA Mey.), Hornbeam (Carpinus betulus L., and Carpinus orientalis Mill.), and succulent maple (Acer cappadocicum Gled.). Furthermore, conifer forests are typical of higher elevations on rocky slopes dominated by juniper woodlands in the eastern and southern parts of the park. Only 2% of the park (1670 ha) is sporadically composed of non-burnable features that prevented fire growth across the landscape, including bare and stony lands, agriculture, and developed areas.
In each vegetation type, representative fuel models used in FlamMap simulations were determined based on the previous study in the park by Jahdi [45]. It is worth mentioning that in the study, herbaceous vegetation and surface litter data were collected from 1 × 1 m, 10 × 10 m, and 30 × 30 m sampling plots, respectively, in the grassland (24 samples), shrubland (8 samples), and forest (22 sample plots) based on stratified random sampling. The map of the selected fuel models in the study area is presented in Figure 2. Furthermore, for the fuel moisture parameter, we used the fuel moisture content which was calculated in the previous study in the GNP by Alhaj Khalaf [46] et al. In Appendix A, a summary of the method for calculating the fuel moisture content is presented. Figure A1 shows the fuel moisture map of the study area, for example, 1 h moisture content.

2.3. Wildfire Data

The Golestan Department of Environment provided fire data of the park from 2000 to 2020. The historical wildfire records contain information about the location, size (ha), type (surface, crown), cause, and date of wildfires. Wildfire statistics for the study period (2000–2020) are summarized in Appendix B for further details (Table A1). Since 2000, 324 fires have been reported in the wildfire database. The wildfires have burned an average of 504 ha of the temperate forest and rangeland ecosystems of the park each year. Annual fire ignition and burned area vary in the study area with as few as 9 fires and <85 ha burned during low activity years (2001, 2006), and over 33 fires and 3124 ha burned during extreme years (2010, 2013) (Table A1). The mean annual fire ignition was 16 fires, and the average fire size was 33 ha. Historical wildfire ignitions in the park for the study period as a function of the final fire size are presented in Figure 1. The south part of the park had more frequent and larger wildfires in comparison to the other parts. There have been 14 very large wildfires (>100 ha) in the southern part of the park.

2.4. Wildfire Regime Attributes

In this research, we focused our attention on temporal (seasonality and fire return interval) and spatial (fire size and burn rate) attributes of wildfire regime. Fire seasonality is the primary burn season and is expressed by the cumulative proportion of yearly area burned over the baseline (2000–2020). The period it takes for a fire to burn most or all of a given area is described by the fire return interval, which integrates fire size and fire occurrence frequency [47]. Buma [48] et al. defined frequent fires as those occurring at 1–10 years and infrequent fires are those occurring at intervals greater than 10 years. Fire size is the extent of the area burned by an individual fire, the distribution of individual fire sizes, or the total area burned by all wildfires within a specified period. Finally, the burn rate represents the annual burned area percentage [49].

2.5. Wildfire Exposure Modeling

In wildfire risk and exposure modeling, point data are used to represent fire ignition points, which can be considered as a dependent variable, while spatial data are used to represent independent variables such as fuel and topography. Therefore, in wildfire risk analysis, the conversion of historical wildfire data to continuous data and locations of fire ignition points with greater accuracy is required. To model wildfire likelihood, we applied the kernel density interpolation approach based on the nearest neighbor distance of the fire ignition points that occurred in GNP during the study period. The kernel density estimation (KDE), a non-parametric statistical method for estimating probability densities, is mathematically defined as (Equation (1)), [50]:
f ^ z = 1 n h 2 i = 1 n k z Z i h  
where f ^ z is the prediction for the real intensity function, n is the number of point observations, h is bandwidth, z is the vector of coordinates at which the density is calculated, Zi is the vector of coordinates that represent each point observation, and K indicates the kernel function that meets the following requirement (Equation (2)):
K z d z = 1 .
In this study, a normal kernel function is used and its bivariate form is given as Equation (3);
K x = 1 2 π exp 1 2 x T x
The smoothness of the resulting density function is strongly affected by the bandwidth. The KDE map was generated with a bandwidth of 250 m. This map of fire density was produced to show the likelihood of wildfires in terms of time and place in the study area, which shows the average density values for each area in the GNP landscape.
Wildfire exposure modeling was performed using the minimum travel time (MTT) fire growth algorithm [51] from FlamMap simulations [52]. The model requires geospatial input data on topographic features and fuels, weather data, fuel moisture content, and fuel characteristics. We assembled FlamMap MTT inputs using methods described in detail by Jahdi and Arabi [53]. Appendix B (Table A2) presents the ranges of fuel model parameters used for wildfire simulation in the main fuel types (grass, shrub, and timber fuels) in the study area. Probabilistic wildfire exposure components were modeled using fuel and terrain data (30 m resolution), historical wildfire data, and surface weather records. Most frequent fire weather conditions in terms of fuel moisture content and wind speed (6 m/s) and direction (west) during wildfire season (Appendix B, Table A2; Appendix C, Figure A2) were considered to model BP. The length of the burning time for simulation is set at 5 h based on the average fire duration of historical fires in the study area.
FlamMap MTT generates estimates of BP and measures of wildfire intensity, including CFL (m) and FS (ha). Values in the BP data layer indicate, for each pixel, the number of times that cell was burned by simulated fires [54]. These data are intended to derive a quantitative method to support wildfire risk analysis [55]. The area that burns is recorded for each wildfire and eventually compiled in a cumulative grid of area burned. The final product is a map where the BP of each cell i is calculated using the following equation:
B P i = b i N × 100
where bi is the number of times cell i burned and N is the total number of simulations (generally ≥1000). BPi represents the percent annual likelihood of cell i being burned [54,56].
The flame length data layer produced from multiple fires burning each pixel was used to calculate the CFL (m), which is the probability-weighted flame length given a fire occurs [54]:
CFL = i = 1 20 B P i B P FL i
where FL i is the flame length midpoint of the ith category.
Text files containing the fire size (FS, ha) and ignition coordinates were used to calculate the potential fire size grid.

2.6. Logistic Regression Modeling

The influence of the environmental factors on wildfires was analyzed using the fire environment data of large fires (>10 ha) in the study area. Three explanatory variables (weather, fuel, and topography) important to BP, CFL (m), and FS (ha) were selected for the regression model in the study area. We collected a list of potential explanatory variables from the literature on fire regime and fire behavior. From this initial list, we distinguished variables that met two key criteria: (1) fundamental data were readily available to the Golestan Department of Environment in the Park, and (2) the variable was simple to derive and consistently accessible for the entire study area and study period. We extracted explanatory variables from spatial data layers describing environmental conditions including weather, fuel, and topography attributes (Table 2). For weather and fuel moisture data, we used the information of the day of the large fires that occurred in the study area in our dataset. Before establishing a logistic regression model, we conducted a multicollinearity test of the variables by SPSS 26.0 which showed the existence of a definite degree of correlation between the explanatory variables in a regression model. In this test, the variance inflation factor (VIF) was used for multiple linearity tests, and the tolerance factor was calculated as follows:
TOL = 1 − Ri2
where Ri are the decisive coefficients of the linear regression model. Multicollinearity between independent variables is significant if TOL < 0.1. VIF is the converse of TOL, a proportional coefficient for estimating the variance of regression coefficients [57]. The higher the value of VIF, the stronger the multicollinearity between the independent variables. Thus, 0 < VIF < 10 indicates no multicollinearity, 10 < VIF < 100 indicates strong multicollinearity, and VIF > 100 indicates severe multicollinearity between the independent variables.
GIS spatial analysis and logistic regression model (multiple linear regression) were used to identify the primary variables defining the park’s wildfire spread and environmental attributes. The influence of each factor was measured based on the resulting coefficient of determination, R2, from the Cox-Snell model, using SPSS. The model’s R2 has a theoretical maximum value of less than 1. Furthermore, the individual simple logistic regression model was used to evaluate the potential for each explanatory variable to support the wildfire spread. The model was first developed to assess the independent effect of each variable on wildfire size based on the observed wildfire perimeters in the study area.

3. Results and Discussion

3.1. Wildfire Regime

According to the wildfire database, the historical wildfire regime in the GNP was characterized by surface fires. Crown fires do not play a major role in the temperate forests of the park. Regarding the transition from surface fire to crown fire in the study area, the success of the crown fire initiation from surface fire decreases as the tree’s crown base height and fuel moisture content increase [58]. The primary cause of past and ongoing fire ignitions is human activity. Human-caused ignitions can be separated between those started by native people and tourists. According to Akhani [41], natural wildfire seems unlikely in the park. In addition, Faramarzi [
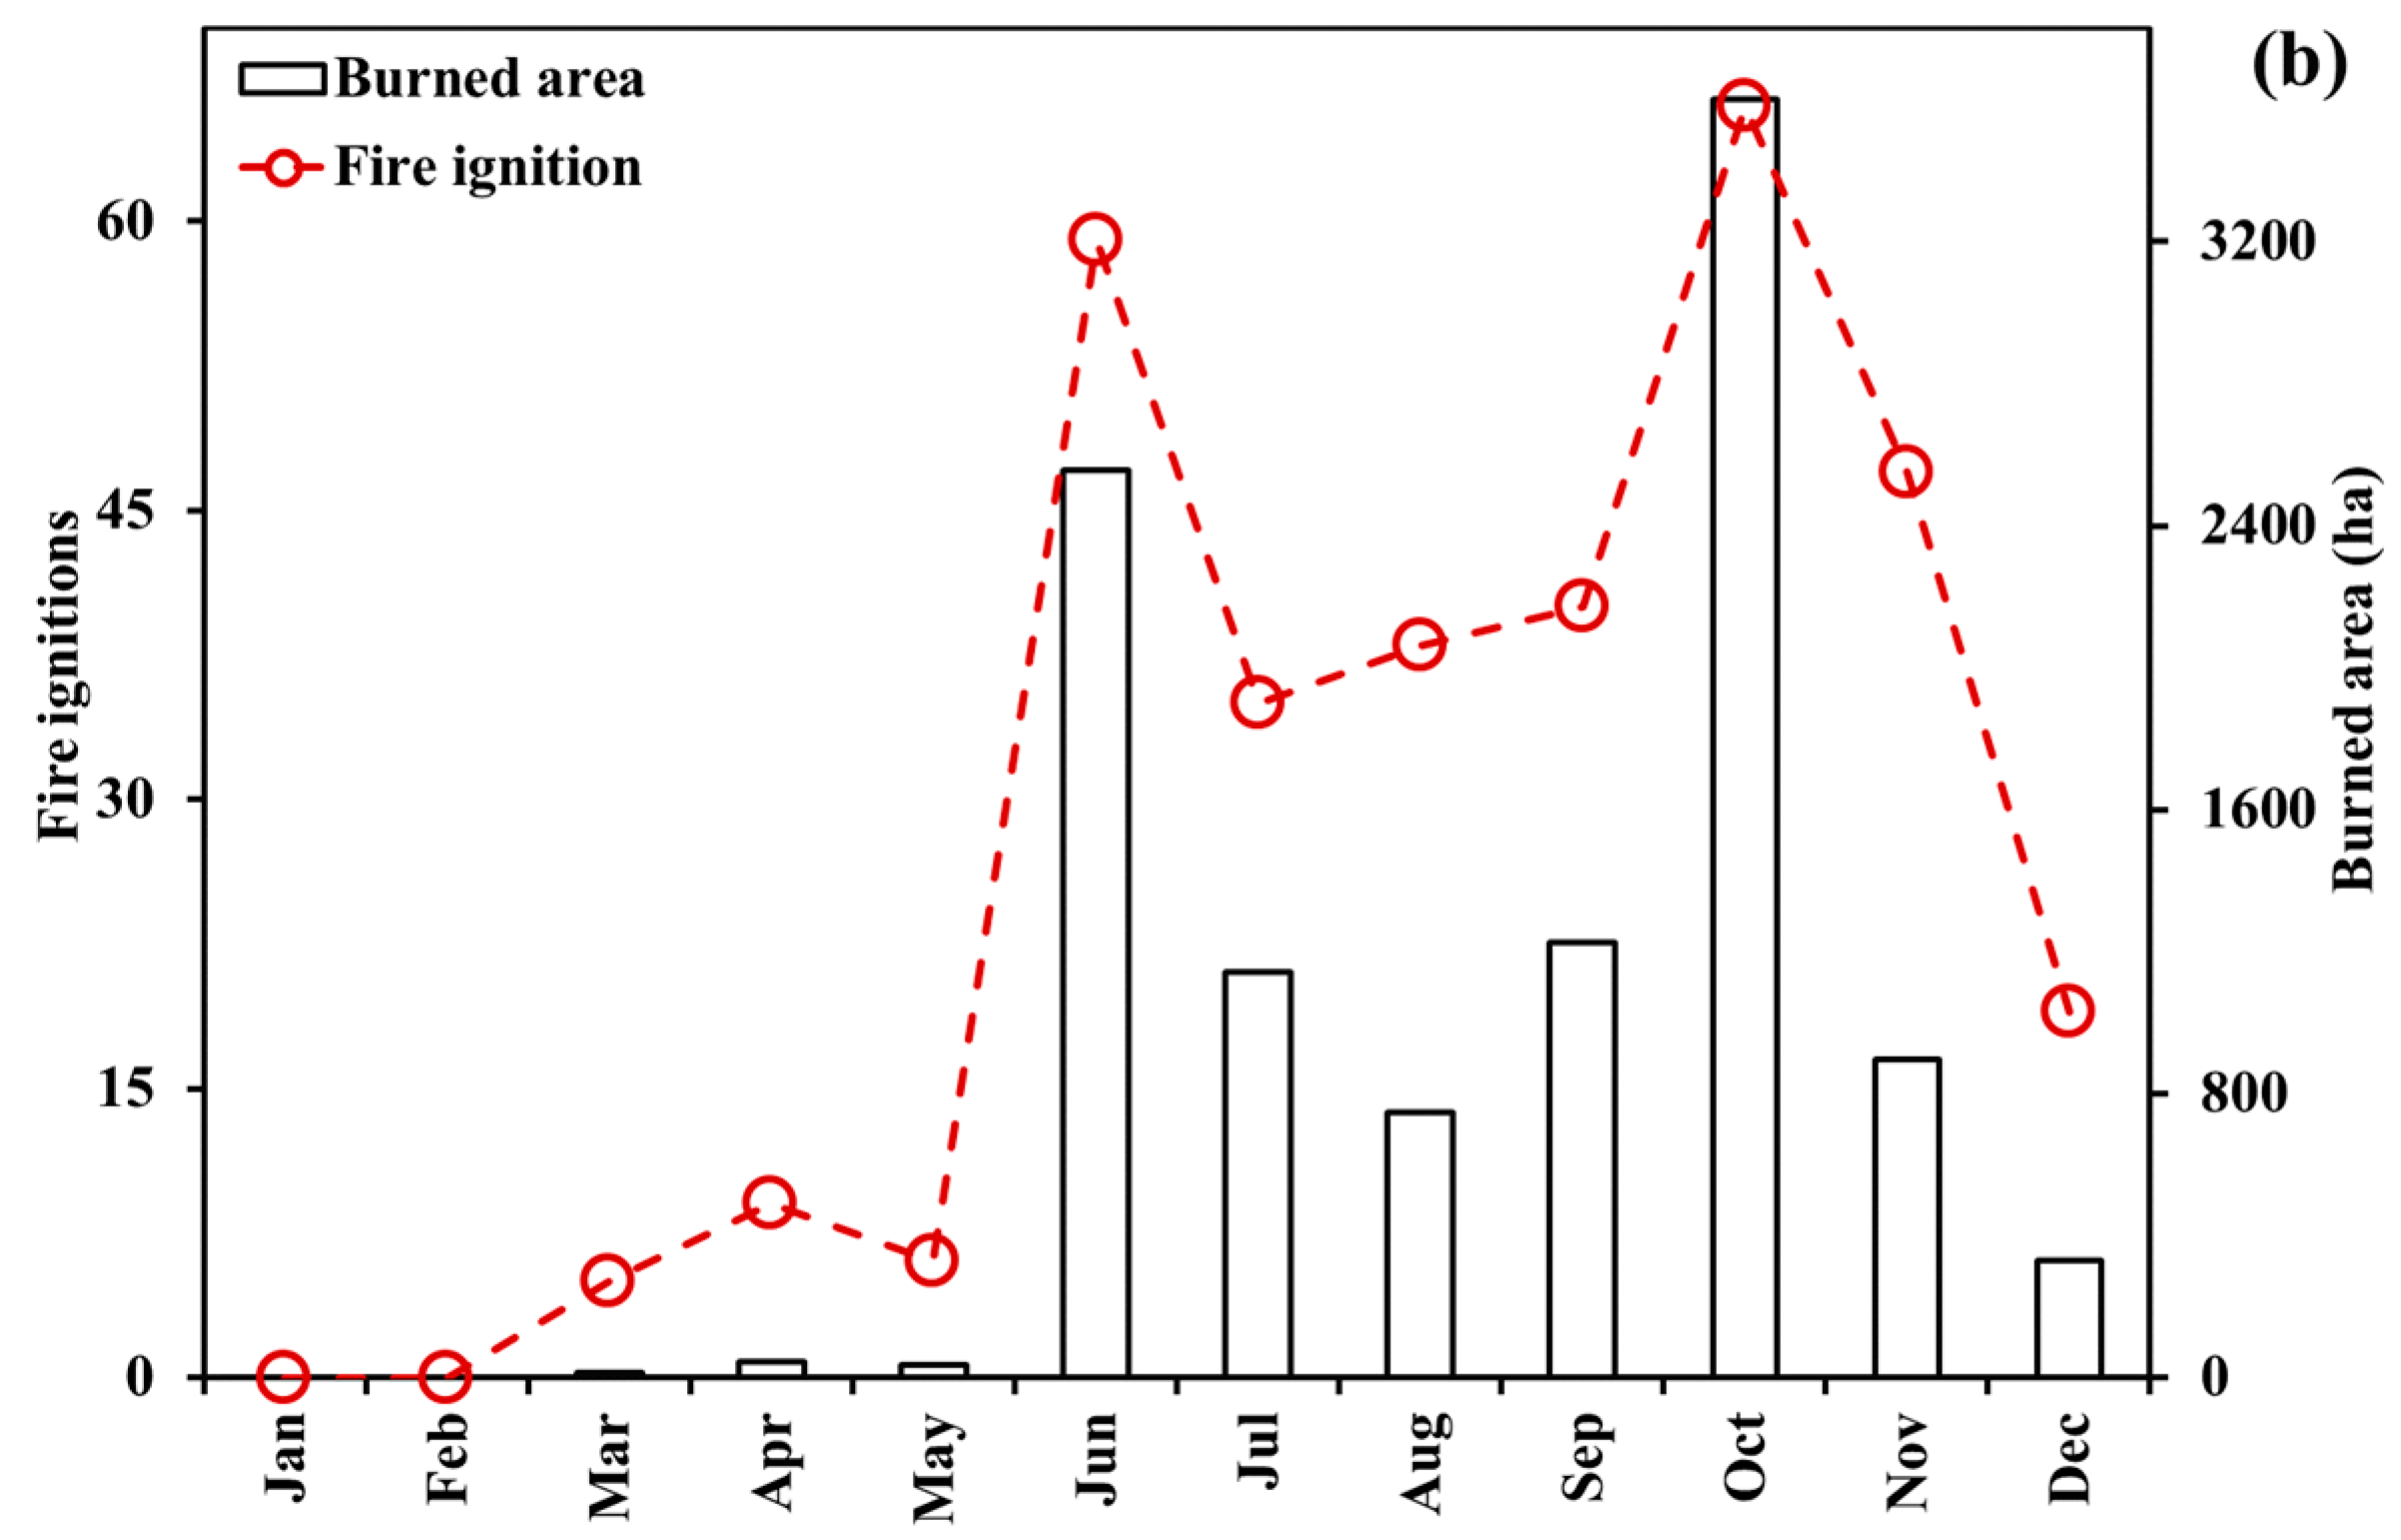
18] et al. reported that the transit road across the park has been the most important factor among human factors including villages, hunters, shepherds, and camping in the anthropogenic fires. The values for both annual fire ignition and burned area, as well as monthly fire ignition and burned area, during the study period are presented in Appendix C, Figure A3. There is no significant trend in the annual fire ignition and burned areas for the study period. However, the study area experienced almost a twofold increase in both parameters, especially for the 2010–2020 period. This increase mainly resulted from a rise in fire activity during June and October. The lowest fire activity in terms of burned area and fire frequency was recorded in 2004, with a mean fire size of 8 ha and an annual burn rate of 0.1% of the burnable area, while 2013 was the most active year. The year 2010 showed the highest percentage of wildfires (10%), while 2001 and 2006 showed the lowest (3%). We can also see the seasonal pattern of fire ignition and burned area in the park in Figure A3. The park’s wildfire season is relatively long, extending from early June at the driest sites (e.g., southerly slopes) to early November. About 70% of very large wildfires in the park burned during June and October. Large wildfires may burn until fall rains arrive in November. Although the greatest fire ignition and burned area occur in early summer and early fall, the climate is uncertain enough to allow occasional fires during favorable periods in the late spring, especially in warm, dry areas. The more xeric, lowland forest zone of the park, including juniper woodlands and oak (Quercus castaneifolia C. A. Mey., and Quercus macranthera Fisch. & C. A. Mey. ex Hohen.) are the forests that are most likely to burn early in the fire season. The fire season lasts longer on the southern sides due to the shorter duration of snow cover when fuels are sufficiently dry for fires to ignite and spread.
Approximately 10,587 ha of the study area (12%) burned between 2000 and 2020, with much of that occurring in grassland (
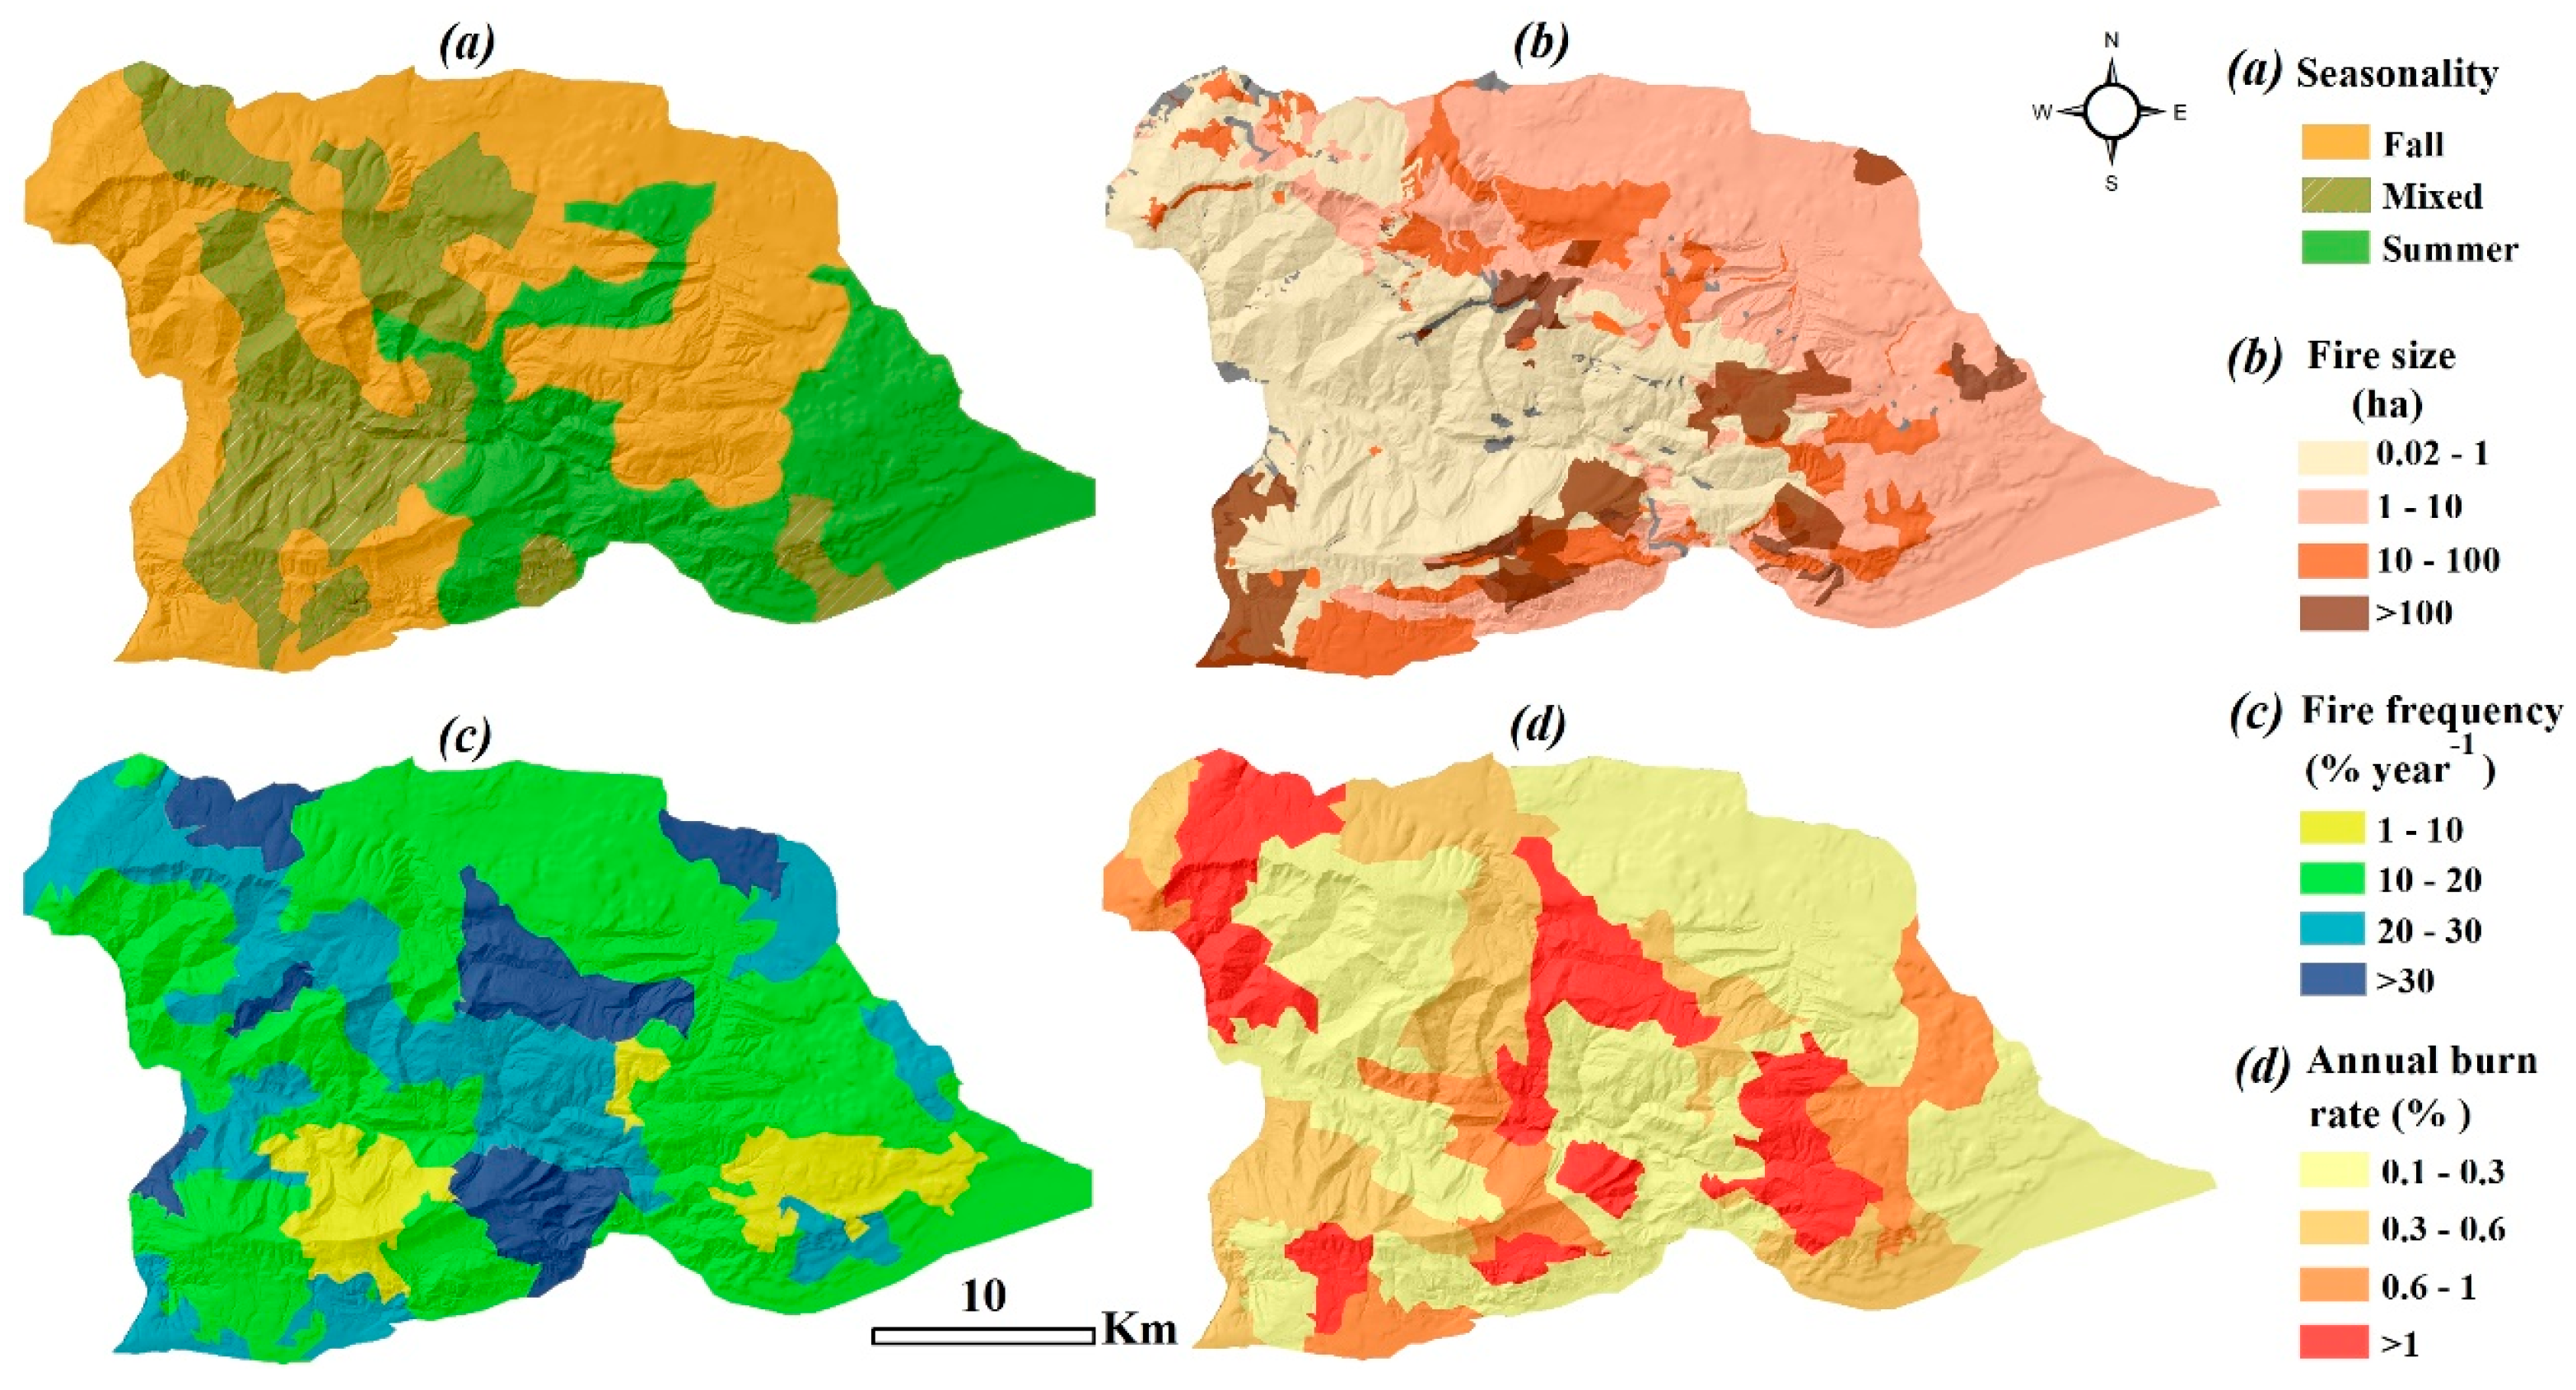
Table 3). As a percentage of the total area, 27% of shrubland and 12% of timber fuel, and 11% of grassland burned. The spatial distribution of selected fire regime features in the Park is shown in Figure 3. Furthermore, the ranges of the features for different fuel types in the study area are summarized in Table 3. The seasonality fire map shows that the majority of wildfires occurred during the summer and fall seasons (Figure 3a, Table 3). Fire ignition in summer is less than in fall, especially in southern regions of pronounced annual summer drought, the warming induced by regional climate change will likely increase the fire season duration [59] and the drying of fuels, thus increasing the fire risk. The first fire season starts in early summer and peaks in June and July when areas become increasingly hot, dry, and vulnerable to wildfires. These wildfires also indicate an increase in incendiary and suspicious fires, resulting from the shift to warmer weather with an increase in dry vegetation and outdoor activities. The second peak correlates with the fall months of October and November when weather patterns shift. Warm and dry winds from the Turkmen Sahra region and Semnan deserts and plains (in the north and south of the park) blow offshore across dry grasses, shrubs, and trees that have not seen significant rain since the spring. In comparison with the montane forest areas in the north and west parts, the fog influence of the moist Hyrcanian air masses in the east and south parts is limited, and the dry season, from mid-summer to early fall, is more pronounced [42]. It is worth noting that hotter summers are extending into the fall in the park, and this trend is very likely to continue and intensify as global warming increases. Although the fire regime consisted of the summer, fall, and a mixture of the two in the study area, wildfires in recent years have burned well outside of the typical fire season. According to Jahdi [60] et al. the three-month wildfire season in northern Iran has become longer and now lasts six months. Other factors contributing to longer wildfire seasons include extended drought, dieback of Persian oak trees (Quercus castaneifolia C. A. Mey.) from fungi causing charcoal diseases [61], and invasive fern species Pteridium aquilinum with scattered shrubs such as Prunus divaricata and Crataegus pentagyna [41], that allow the fire to ignite easily and spread rapidly.
Wildfire regimes have also been classified according to size (Figure 3b, Table 3). Fire sizes estimated from fire scars in the park ranged from 0.02 ha to 875 ha. A negative exponential pattern can be seen in the distribution of fire sizes (many small fires, few large ones), also noted in other countries by Archibald [3] et al. and Alcasena [63] et al. Generally, natural fires may become large since they often burn under conditions of rapid spread and high intensity [64]. Human actions tend to change the pattern toward smaller, lower-intensity fires [65]. However, as a protected area, no activities are carried out to manage wildfires and fuel in the study area. Small fires in the park presumably were generated from ignitions near the areas characterized by fragmented landscapes with a patchy mosaic of low-load fuels and non-burnable fuels [56]. These results are consistent with observations reported in nearby regions with similar climates and vegetation [53,59,66]. On the other hand, fire size distribution patterns revealed that large fires are more likely to occur in the forest–grassland ecotones, especially in the southern areas of the park. In fact, the forest–grassland ecotones are a primary corridor for fire growth in the park, which is in agreement with other studies conducted in grassland–forest ecotones [67,68], as well as with the site-specific fire history studies in the park [18,53,69]. Increasing the resilience of the ecotonal forests to wildfire will have implications for restoration efforts and would contribute to the entire landscape’s resilience.
Fire size was lowest for areas dominated by forests. Generally, the wildfire regime of grasslands and shrublands is characterized by large wildfires (10–100 ha). The percentage of large wildfires was lower in timber type (3%) than in shrublands (51%) and grasslands (78%). Among fuel types, the percentage of very large wildfires (>100 ha) was highest in shrublands at 24%. Compared to timber fuels, the quantity of available fuel in grasslands and shrublands is low; however, the fuel is very dry and almost all of which burns during a typical fire [70]. Grass can spread fire widely due to faster initial propagation or accessibility issues [71]. Without grass, especially at low elevations (<1500 m), areas in the park would have experienced fires of a small spatial extent. Furthermore, larger fires can affect shrublands due to the extensive continuity of the vegetation cover. Additionally, in Mediterranean environments, large fires tend to occur in landscapes with dense shrublands [72,
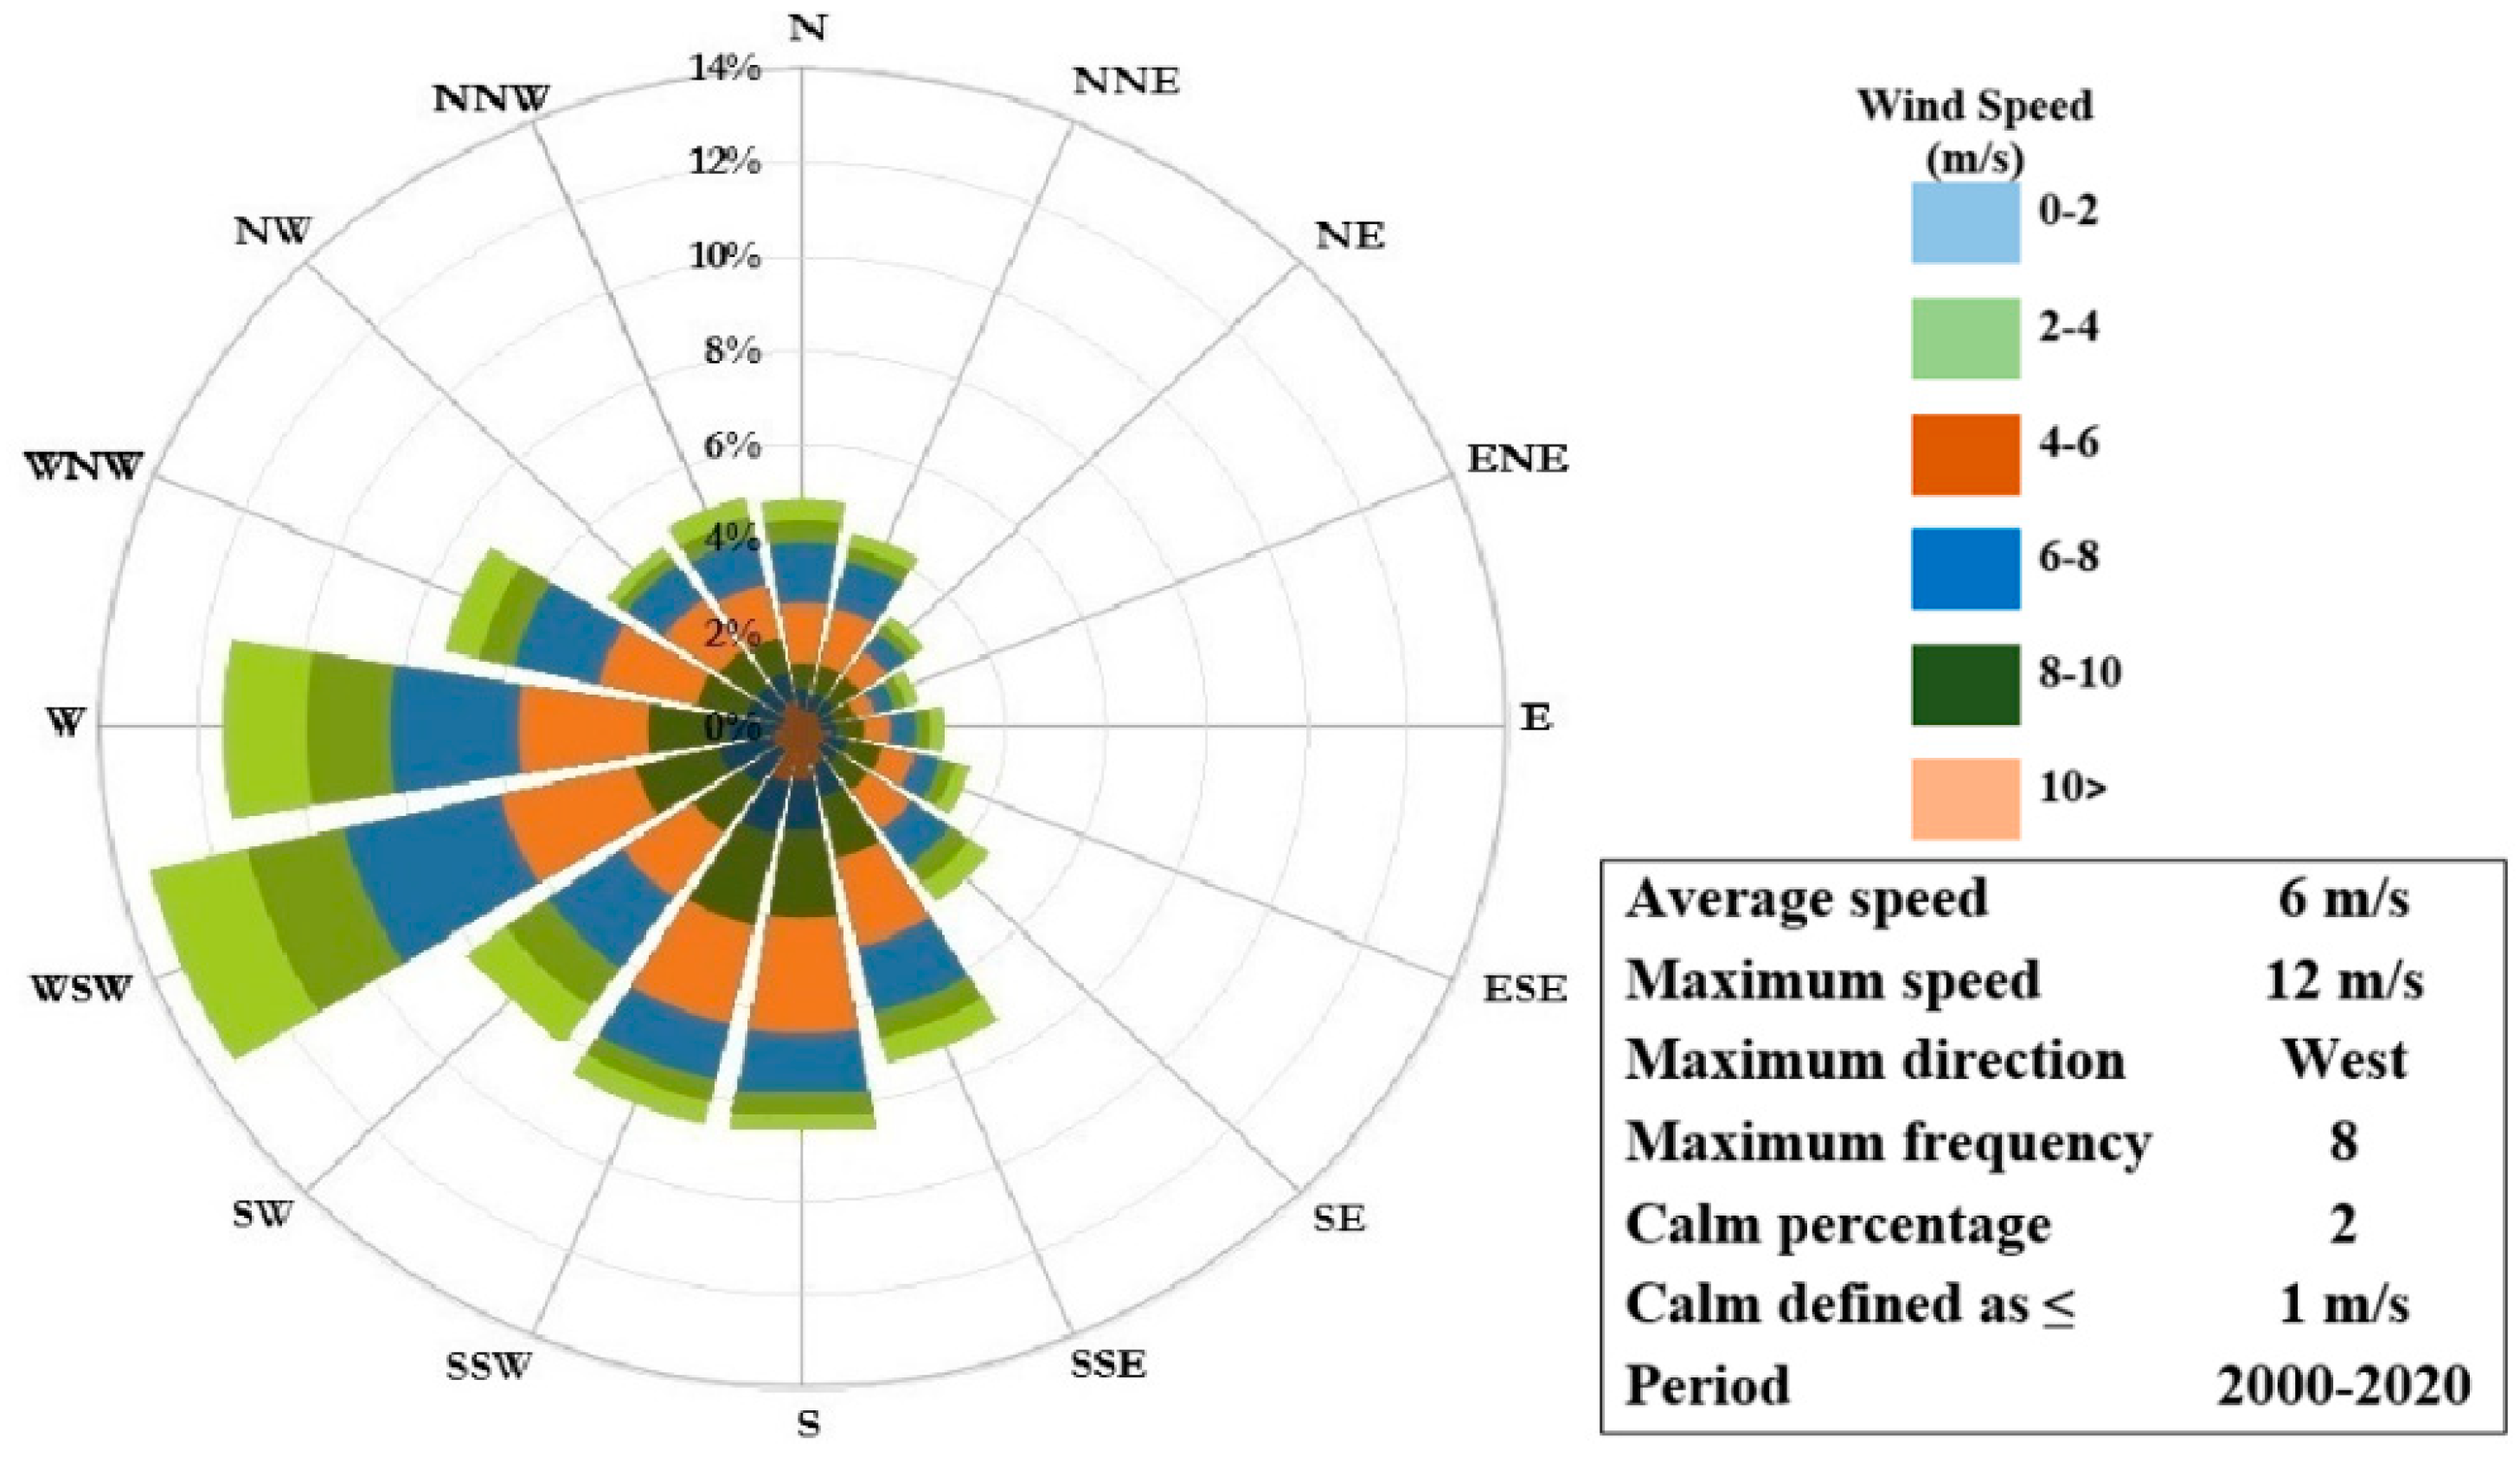
73] and that is also the case here; shrub vegetation was the one with the greatest burned area. Shrublands are very sensitive to fires in the park. First, because of the dense ground vegetation of the shrublands, which becomes dry during the hot summer months, and second, due to the strong winds caused by the interaction of high-pressure air masses from the Hyrcanian area in the west and low-pressure air masses of Central Asia in the east [42]. Any small fire may easily spread and develop into an uncontrollable disaster. For example, during the fire on 29–31 August 1995, over 1000 hectares of Crataegus scrubs in the southeastern slopes of the Alu-Baq Mountain, Yelaq plain (37°19′ N, 55°58′ E, 1350 m) were affected [41]. Unlike shrublands, in the closed lowland forest, which is restricted to the lower altitudes along the Madrasu River and the northwestern border of the park, the lower temperatures, moister air, and less flammable vegetation lead to reduced fire occurrence and the proportion of burned areas. There is also a permanent mountain lake (Sulukli lake) located in the forested zone in the northwestern part of the park with an elevation of 1380 m, which according to Nielsen [74] et al. can act as a firebreak. Overall, these areas are highly dissected by the river, where the vegetation has a higher moisture content [75], with insufficient grass cover [76], or sufficiently high forest cover, seem to have intrinsically low landscape connectivity [3] and as a result having the potential to limit fires.
Each fuel type’s average hectares burned per year were used to calculate the current fire return interval (Figure 3c, Table 3). The intervals across the study area varied from 8 to 35 years, with an average interval of 22 years. Regarding total area, the predominant fire regime was relatively infrequent fires. Wildfires are currently frequent (<10 years) on 10% of the landscape and infrequent (>10 years) on 90% of the landscape (Table 3). Mean fire intervals increased with elevation, but fire frequency is often highest at middle elevations. Historically, 8% of the grasslands experienced frequent wildfires (fires every 0–10 years), and intervals less than 20 years were frequently (64%) observed in the areas. In the shrublands, intervals ranging from up to 10–20 years were considered, notably for high-elevation sites. Within the timber fuels, the mean fire return interval was 20 years. Results showed an average fire return interval of ~10 years in the major fuel types in the park. This also agrees with Atrak Chali [36], who reported an average fire return period of 5 to 7 years in the Golestan forests. Fire frequency was often highest at middle elevations in the park, a pattern in line with the conclusion of McKelvey and Busse [77] and Rollins [78] et al. Large areas of continuous fuels in the southern parts favor larger fires with shorter return intervals than the northern ones with smaller land patches. In dry conditions, shrublands facilitate fire growth and result from periodic fires [79]. Juniperus shrublands are generally considered threatened vegetation types in Iran. They grow slowly; fire damaged parts of the areas on the subalpine summits of Divar-Kaji (the highest peak of the GNP with 2411 m above sea level) during 1950–1953. The vegetation has not yet regenerated in the area after more than 45 years [41].
The burn rate and the changes in the total area of each fuel type are presented in Table 3. The study area had overall annual burn rates varying from 0.1% to 1.3%, with a mean annual burn rate of 0.4% during the study period (Figure 3d, Table 3). Only 23% of the landscape had high annual burn rates (i.e., rates > 1%). The greatest percentage annual burn rate is for grassland, where values range from 0.1% to 0.3% (60%). In shrublands, high fire activity is driven by large fires and high annual bun rates (>1% (35%)). Annual burn rate can be increased by a higher proportion of burned area, by fires burning the same area repeatedly, or both [64]. High annual burn rates in the southern part of the park were predominately due to a higher proportion of burned areas, especially in shrublands. Conversely, the woodland ecosystems are mostly limited to burning at these high rates. According to the study by Héon [80] et al. most forest areas are resilient to high annual burn rates because of the density of young trees.

3.2. Wildfire Exposure

Based on the kernel density interpolation, Figure 4 shows the average fire ignition density (FID) per hectare map for the GNP. The map shows the probability of fire occurrence, expressed in five categories: very high, high, medium, low, and very low. The FID map shows that fire occurrences are not evenly or randomly distributed throughout the park. In fact, the distribution of fire has not been uniform, and unburned and severely burned areas are clearly visible. Intense FID can be seen in the southern part of the park, especially in the lowlands with grassy cover, while in most areas of the park, there is a low FID. The results of this study showed that 62% of the region had very low, 16% had low, and 21% had medium FID, respectively. The study area shows small signs of high and very high FID (<2%) across all fuel types.
The results of simulated fire exposure profiles are shown in Figure 4 and Table 4. In general, the BP is low across the landscape and ranged from 0.00 to 0.02 (Figure 4b). Mean BP was highest in the grass and shrub fuels and notably lower in the timber fuel. BP calculations yielded a mean BP of 0.005 for the grasslands. The highest BP (0.01–0.02) was found in southern and eastern areas of the park with contiguous grassland/shrub cover at an altitude of 1500–2000 m and correspond to high ignition likelihoods. Regarding mixed broadleaves and conifers, more canopy cover has less BP. Large areas with zero BP were located in the west-central areas, and low BP (<0.002) was predicted for the western areas, covered by temperate broadleaf forests. The south part of the park has the highest BP (0.02) and is mainly composed of large parts of unmanaged shrublands and conifer fuels. The greatest concentration of high BP values occurred in the western and southern parts of GNP, characterized by historical large fires, consistent with the results of Faramarzi [18] et al. and Pourshakouri [69] et al. in the park. High BP areas are found in the fuel models of high-load grass and medium-load shrub. An efficient fire prevention measure based on fuel load reduction can be considered in the areas with the fuel models. In contrast, the lowest BP was found in mixed broadleaves and low-load conifers. Palaiologou [81] et al. highlighted that those areas covered by broadleaf forests have a low BP. The result is consistent with the findings of Alcasena [63] et al., which observed that the BP was lowest in the mature forests with low fuel load, timber litter, and closed canopy. However, BP values in Alcasena [82] et al. are one order of magnitude bigger than the simulated BP values in our study area. This might be related to a number of factors, including ignition patterns, spatial locations of fuels, topography, prevailing winds, etc.
As with BP, the spatial patterns in CFL reflected a wide range (0–7.2 m) (Figure 4c). Significant parts of the landscape (75%) had lower values of CFL (<1 m). Mean CFL ranged between 0.5 and 1.6 m (Table 4). Similar to BP spatial patterns, shrublands exhibited the higher average CFL (1.6 m) among fuel types, while the lower average CFL was observed with timber fuels (0.5 m). The average modeled CFL for grasslands was 0.7 m. The highest CFL (>2 m) values occur in the south and east parts of the park, with moderately high CFL values (1–2 m) also occurring in the center of the park. Elsewhere, CFL values tend to be low (<1 m). It is worth noting that the maximum CFL for timber fuels was 7.2 m, while shrublands and grasslands both had maximum CFL values of less than 5.6 m. Generally, our spatial analyses of wildfire exposure outputs across the landscape showed that fires favor shrub-dominated vegetation over other vegetation. Because the vegetation grows dense and generally continuous fuels across large areas given enough time after fire, fires in these dense fire-prone shrublands are typically able to originate large and intense fires [83]. Our results agree with other studies that addressed fire risk and exposure to land cover especially in Mediterranean areas [70,84,85], which found that fire preferred shrublands and grasslands, with forests showing an intermediate risk.
Focusing on the simulated FS (Figure 4d, Table 4), the fuel type that produced low FS (average FS < 200 ha) was timber fuels. FS in the study area ranges from 3.3 to 2240 ha. The simulated FS ranged from 15 ha to a maximum of 2480 ha in the shrublands, with a mean FS of 840 ha. The mean FS detected in the grasslands was 452 ha (2.5–2770 ha).
In general, forests in the park naturally colonize many zones and require low or no management, in contrast with grasslands and shrublands, which also with low fire hazards but require ongoing management efforts to reduce forest density and restore frequent surface fires.

3.3. Logistic Regression Model

First, the collinearity test results of the explanatory variables (Table A3) show that the VIF value of each fire risk factor (weather, fuel, and topography) is below 5, indicating no multicollinearity among the variables. Therefore, all the variables can participate in the establishment of the logistic regression model. Then, logistic regression analysis of multiple variables revealed the influence of weather, fuel, and topography on the observed wildfire perimeters for the period 2000–2020 in the park, with R2 values ranging from 0.11 to 0.37 (Figure 5a). Results from the model showed that climatic variables contribute the most in explaining fire activity, fuel variables come second, while topographic variables contribute the least, agreeing with the findings of related studies [20,86]. A fire prevention strategy should incorporate detail and full consideration of all the issues arising from weather, fuel, and topography. Only a few studies have suggested that fuel variables would be more important than weather within large areas burned [87,88]. However, in this study, topography had the least effect, being of particular importance in steep and rugged landscapes, especially where weather within fire seasons is not a critical driver [89,90].
Based on the analyses above, the logistic regression was implemented on the selected eight variables to determine further their relationship with the simulated wildfire exposure metrics (BP (Figure 5b), CFL (Figure 5c), and FS (Figure 5d)). The results are consistent with those obtained on the observed fire perimeters and reveal that the weather variables are the most critical in whether the fires can be ignited or not (R2 values range from 0.21 to 0.34), followed by the variables of fuel and topography. Nevertheless, weather effects on the simulated fires (R2 = 0.28) are less than the observed wildfires (R2 = 0.32), while similar significant correlations emerge concerning fuel (R2 = 0.25) and topography (R2 = 0.15) effects.
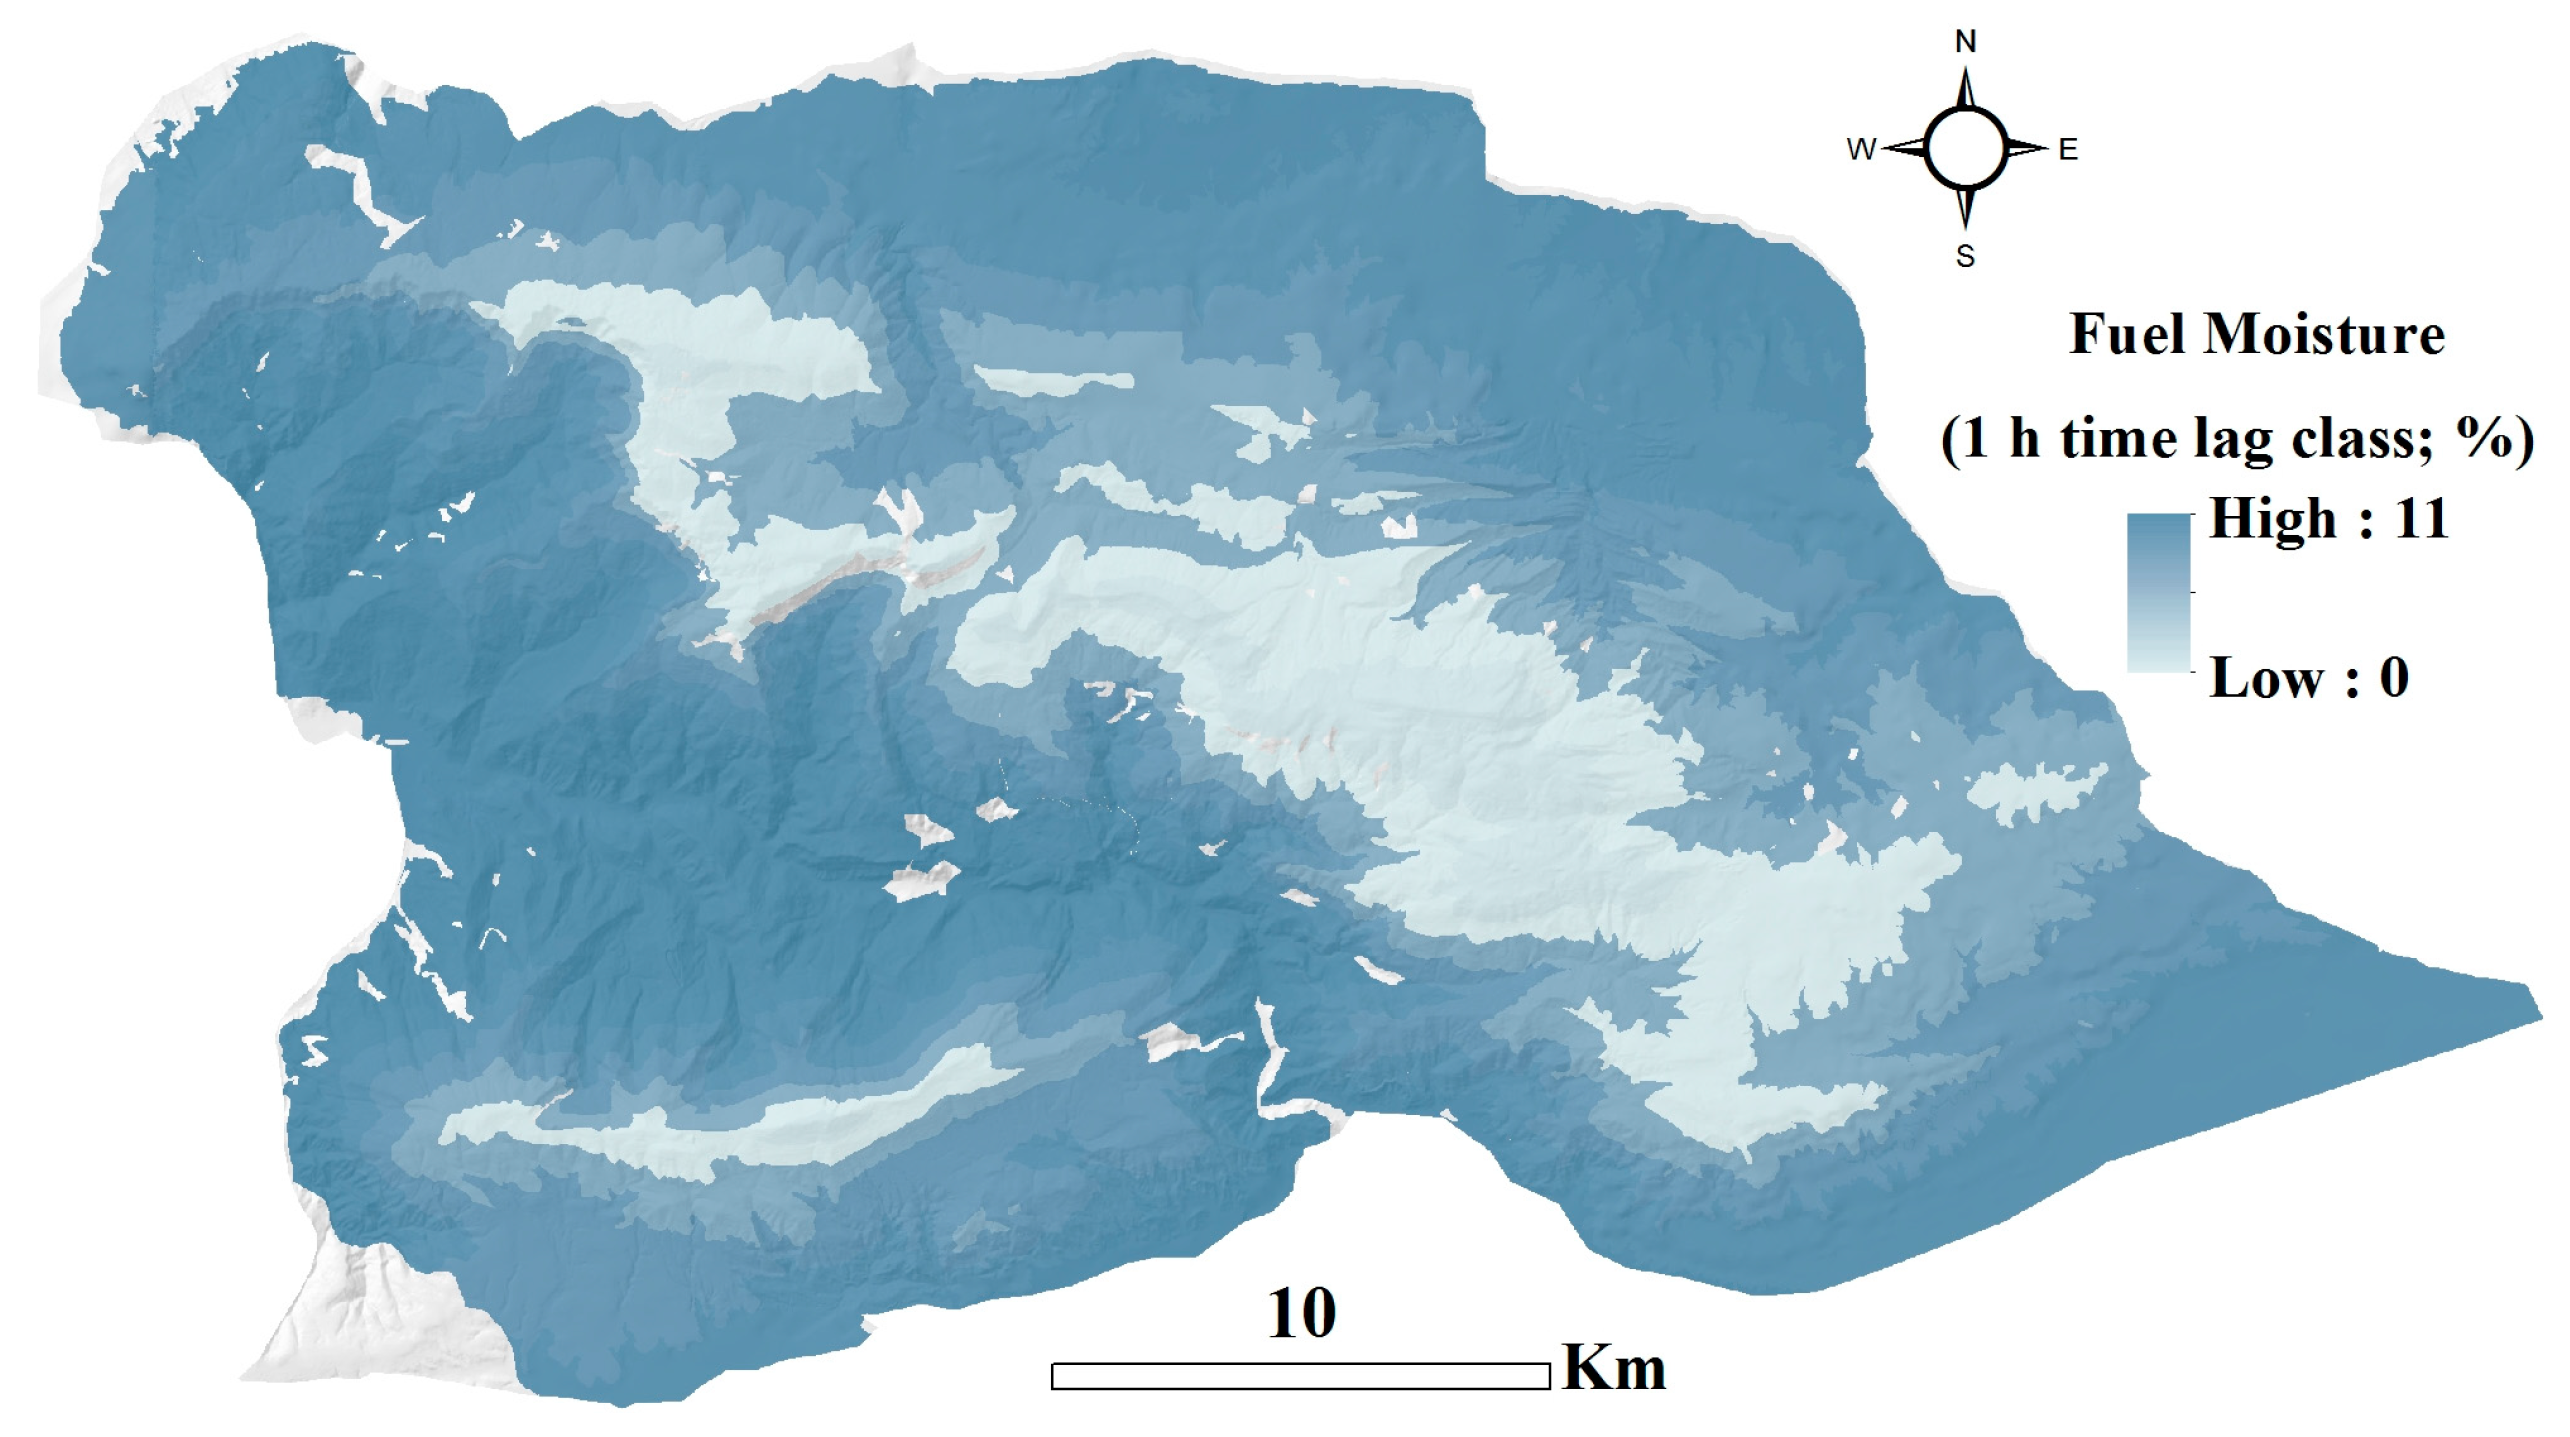
We also investigated the relative importance of individual variables within each factor (e.g., elevation vs. slope). In this work, the most influential variable explaining the large wildfires was wind speed, followed by temperature, relative humidity, NDVI, precipitation, fuel moisture, fuel load, elevation, and slope, respectively. Like Birch [86] et al. (2015) and Cruz and Alexander [91], strong winds appear to be the most important environmental factor influencing fire behavior. The most likely explanation is that wind is the single most influential climatic parameter affecting fire spread and, as a result, the burned area [92]. Considering the other weather-related variables we examined, the temperature was highly influential in the park, as found in several other studies that evaluated fire activity [89,93]. In this study, precipitation and relative humidity were moderately influential, while precipitation had relatively stronger influences on fire occurrence than temperature and humidity in the study of Liu and Wimberly [5]. Regarding the influence of specific fuel-related variables, fires were most strongly affected by NDVI, followed by fuel moisture and fuel load. This is consistent with previous studies and indicates that NDVI is among the primary drivers of fires [19,94]. Naderpour [95] et al. and Wu [96] et al. found that fire occurrences are significantly affected by fuel moisture and fuel load. Furthermore, Syphard [97] et al. found that fuel loading condition is one of the most critical factors influencing fire behavior. Concerning topographical variables, elevation had a significant and positive effect on wildfire occurrence, with the secondary influence of slope, and the result was largely consistent with Zhang [98] et al. and Milanović [20] et al.
Although this study proposed an integrated approach to generating fire regime and fire exposure maps, we could not combine the predictive models of spatial scale of wildfire driving factors which consider the effect of differences in the spatial scale of wildfire drivers in the analysis. Therefore, this aspect can be addressed for further research. Furthermore, this analysis is limited by the available data and analytical methods. For example, the fuel composition and structure of the burned vegetation were not precisely known, which can cause some uncertainty in the fire size analysis.

4. Conclusions

Our study documents the historical wildfire regime in a fire-prone landscape in Iran, which is instrumental in managing landscapes today. Historic wildfire regimes in the GNP were highly variable in terms of seasonality, fire size, frequency, and spatial pattern. The result shows that the forest–grassland ecotones are a primary corridor for fire growth in the park. Furthermore, spatial analyses showed that wildfires across the landscape favor shrublands and grasslands. The most fire-prone areas were shrublands, while broadleaved forests were significantly less fire-prone. We found that much of the forest had relatively low exposure but a higher potential for wildfires with moderate intensity. These findings have profound implications for our understanding of wildfire regimes and predictions about the further evolution of wildfire regimes to face the extensive climate and land-use changes. Management should aim to limit or constrain large summer and fall wildfires in grasslands and shrublands. In addition, specific traits of climate and landscape can be considered the most critical variables in wildfire ignition, spread, and behavior in the study area. Therefore, we analyzed and compared the influence of different environmental factors on fires and verified that weather is the main driver for wildfires in the landscape. The obtained results can be used to provide further valuable insights about the drivers of wildfire in the study area and to provide a reasonable look at future fire environment scenarios. In conclusion, the methodology has already been applied in a variety of locations at different scales. However, this study is one of the first works in Iran’s natural ecosystems, which requires more accurate data and analysis methods. Finally, an improved understanding of the landscape–wildfire interactions resulting from a complex interaction among topography, weather, land cover, and ignition sources contributes to highlighting areas of wildfire hazard potential and defining land and fire policies that mitigate wildfire hazards.

Author Contributions

Conceptualization, R.J. and M.S.; methodology, R.J.; software, R.J.; validation, R.J. and M.S.; formal analysis, R.J.; investigation, R.J. and V.B.; resources, R.J.; data curation, V.B.; writing—original draft preparation, R.J.; writing—review and editing, V.B., M.S. and L.D.G.; visualization, L.D.G.; supervision, A.C.; project administration, M.S. All authors have read and agreed to the published version of the manuscript.

Funding

This research received no external funding.

Data Availability Statement

The data are available on request.

Conflicts of Interest

The authors declare no conflict of interest.

Appendix A

Calculating Fuel Moisture Content

To determine the fuel moisture content, 1 h (<0.64 cm) fuel was selected based on Rothermel’s [99] method, taking into account topographical factors, average temperature, and humidity during the month with the highest fire occurrences. The air temperature and relative humidity were adjusted for elevation using a fixed lapse rate [100]. The solar radiation was adjusted for slope steepness and orientation and reduced based on the percentage of canopy cover and specified cloud cover for the given time period. After estimating 1 h moisture content, 1% and 2% were added to account for 10 h (0.64–2.54 cm) and 100 h (2.54–7.62 cm) fuel moisture content, respectively.
Next, the fuel moisture map was prepared using the FlamMap 6.2 version and the basic fire behavior algorithm. FlamMap incorporates a new model, developed by Nelson [101], for calculating the dead fuel moisture content of 10 h fuels. This model also includes modifications by Nelson to handle other fuel size classes (1 h, 100 h, and 1000 h). Nelson’s model replaces the ones developed by Rothermel [100] et al. for BEHAVE [102] and Deeming [103] et al. for the NFDRS [104], as used in versions 1, 2, and 3 of FARSITE [105]. Nelson’s model calculates the exchange of water between the environment and the surface of a round wooden stick and the transport of water within the stick itself. The stick is assumed to be without bark and located above ground. FlamMap obtains the 1 h fuel moisture content to improve computational efficiency using a calculation based on the equilibrium moisture content [104], rather than Nelson’s specific calculation for 1 h fuels.
During the progression of a FlamMap conditioning period, the moisture contents of the four fuel size classes are adjusted to reflect changing weather conditions over time at the local site. This adjustment is based on the dead fuel moistures provided in the Initial Fuel Moistures (.FMS) File for 1 h, 10 h, and 100 h time lag classes, serving as the starting conditions. The moistures are then modified according to changes in temperature, humidity, rainfall, and cloud cover obtained from the Weather Stream (.WXS) file, along with the local site conditions such as elevation, slope, aspect, and canopy cover obtained from the Landscape (.LCP) file.
Figure A1. The 1 h fuel moisture content map obtained from Alhaj Khalaf [46] et al.
Fire 06 00244 g0a1

Appendix B

Table A1. Statistics of current wildfire regime for the study period (2000–2020).
Variables
Range of annual fire ignition 9–33
Average annual fire ignition16
Range of annual burned area (ha)84–3124
Average annual burned area (ha)504
Range of fire size (ha)0.02–875
Average fire size (ha)33
Average proportion burned per year0.006
Proportion of fires < 1 ha0.12
Proportion of area burned by fires < 1 ha0.002
Proportion of fires 1–10 ha0.37
Proportion of area burned by fires 1–10 ha0.05
Proportion of fires 10–100 ha0.47
Proportion of area burned by fires 10–100 ha0.45
Proportion of fires > 100 ha0.04
Proportion of area burned by fires > 100 ha0.50
Proportion of fires by cause natural/human0.07/0.93
Table A2. Ranges of fuel model parameters used for wildfire simulation on the three fuel types (grass, shrub, and timber fuels) in the study area.
Fuel Mode ParametersGrass FuelShrub FuelTimber Fuel
Model typeDynamicDynamicDynamic
1-h TL * FL ** (t ha−1)0.14–1.860.63–2.911.66–5.42
10-h TL FL (t ha−1)-0.25–0.780.97–3.30
100-h TL FL (t ha−1)--0.33–2.15
Live herb FL (t ha−1)0.67–3.050.150.67–2.77
Live woody FL (t ha−1)-0.15–1.300.16–1.99
1-h SAV *** (cm−1)52.37–78.1326.15–37.1221.46–51.14
Herb SAV (cm−1)--65.30–69.47
Woody SAV (cm−1)-46.15–53.0641.2–88.32
Fuelbed Depth (cm)16.71–20.1532.20–46.2012–53.10
Dead fuel moisture of extinction (%)14–1714–2121–45
* TL: Time-Lag; ** FL: Fuel Load; *** Surface-area-to-volume.
Table A3. Collinearity diagnosis.
Fire Environment VariablesCollinearity Statistics
AllowanceVIF
Fuel
  Surface fuel load0.312.72
  Fuel density0.421.31
  Fuel moisture0.332.14
Topography
  Digital elevation model (DEM)0.333.42
  Slope steepness0.711.54
Weather
  Temperature0.254.16
  Relative humidity0.293.96
  Wind speed0.322.14
  Precipitation0.234.02

Appendix C

Figure A2. Windrose plot showing wind speed, direction, and frequency for the summer–fall wildfire season (2000–2020).
Fire 06 00244 g0a2
Figure A3. Annual fire ignitions and burned area (ha) (a) and monthly average fire ignitions and burned area (ha) (b) of the historical wildfires across the GNP between 2000 and 2020, obtained from the Golestan Department of Environment.
Fire 06 00244 g0a3aFire 06 00244 g0a3b

References

  1. Cerdà, A.; Borja, M.E.L.; Úbeda, X.; Martínez-Murillo, J.F.; Keesstra, S. Pinus halepensis M. versus Quercus ilex subsp. Rotundifolia L. runoff and soil erosion at pedon scale under natural rainfall in Eastern Spain three decades after a forest fire. For. Ecol. Manag. 2017, 400, 447–456. [Google Scholar] [CrossRef] [Green Version]
  2. Dindaroglu, T.; Babur, E.; Yakupoglu, T.; Rodrigo-Comino, J.; Cerda, A. Evaluation of geomorphometric characteristics and soil properties after a wildfire using Sentinel-2 MSI imagery for future fire-safe forest. Fire Saf. J. 2021, 122, 103318. [Google Scholar] [CrossRef]
  3. Archibald, S.; Staverb, A.C.; Levin, S.A. Evolution of human-driven fire regimes in Africa. Proc. Natl. Acad. Sci. USA 2012, 19, 847–885. [Google Scholar] [CrossRef] [PubMed] [Green Version]
  4. Pausas, J.G.; Fernández-Muñoz, S. Fire regime changes in the Western Mediterranean Basin: From fuel limited to drought-driven fire regime. Clim. Chang. 2012, 110, 215–226. [Google Scholar] [CrossRef] [Green Version]
  5. Liu, Z.; Wimberly, M.C. Climatic and Landscape Influences on Fire Regimes from 1984 to 2010 in the Western United States. PLoS ONE 2015, 10, e0140839. [Google Scholar] [CrossRef] [PubMed] [Green Version]
  6. Dwomoh, F.K.; Wimberly, M.C. Fire Regimes and Their Drivers in the Upper Guinean Region of West Africa. Remote Sens. 2017, 9, 1117. [Google Scholar] [CrossRef] [Green Version]
  7. Le Page, Y.; van der Werf, G.R.; Morton, D.C.; Pereira, J.M.C. Modeling fire-driven deforestation potential in Amazonia under current and projected climate conditions. J. Geophys. Res. 2010, 115, G03012. [Google Scholar] [CrossRef] [Green Version]
  8. Pausas, J.G.; Keeley, J.E. Abrupt climate-independent fire regime changes. Ecosystems 2014, 17, 1109–1120. [Google Scholar] [CrossRef]
  9. Cano-Crespo, A.; Traxl, D.; Prat-Ortega, G.; Rolinski, S.; Thonicke, K. Characterization of land cover-specific fire regimes in the Brazilian Amazon. Reg. Environ. Chang. 2023, 23, 19. [Google Scholar] [CrossRef]
  10. McCarty, J.L.; Aalto, J.; Paunu, V.V.; Arnold, S.R.; Eckhardt, S.; Klimont, Z.; Fain, J.J.; Evangeliou, N.; Venäläinen, A.; Tchebakova, N.M.; et al. Reviews and syntheses: Arctic fire regimes and emissions in the 21st century. Biogeosciences 2021, 18, 5053–5083. [Google Scholar] [CrossRef]
  11. Galizia, L.F.; Curt, T.; Barbero, R.; Rodrigues, M. Understanding fire regimes in Europe. Int. J. Wildland Fire. 2022, 31, 56–66. [Google Scholar] [CrossRef]
  12. Lourenco, M.; Woodborne, S.; Fitchett, J.M. Fire regime of peatlands in the Angolan Highlands. Environ. Monit. Assess 2023, 195, 78. [Google Scholar] [CrossRef]
  13. Miller, J.D.; Skinner, C.N.; Safford, H.D.; Knapp, E.E.; Ramirez, C.M. Trends and causes of severity, size, and number of fires in northwestern California, USA. Ecol. Appl. 2012, 22, 184–203. [Google Scholar] [CrossRef] [PubMed]
  14. Rogeau, M.P.; Parisien, M.A.; Flannigan, M.D. Fire History Sampling Strategy of Fire Intervals Associated with Mixed- to Full-Severity Fires in Southern Alberta, Canada. For. Sci. 2016, 62, 613–622. [Google Scholar] [CrossRef]
  15. Villarreal, M.L.; Iniguez, J.M.; Flesch, A.D.; Sanderlin, J.S.; Montano, C.C.; Conrad, C.R.; Haire, S.L. Contemporary fire regimes provide a critical perspective on restoration needs in the Mexico-United States borderlands. Air Soil Water Res. 2020, 13, 1–18. [Google Scholar] [CrossRef]
  16. Bergonse, R.; Oliveira, S.; Zêzere, J.L.; Moreira, F.; Ribeiro, P.F.; Leal, M.; Lima, E.; Santos, J.M. Differentiating fire regimes and their biophysical drivers in Central Portugal. EGUsphere, 2022; preprint. [Google Scholar] [CrossRef]
  17. Fernandes, P.M.; Monteiro-Henriques, T.; Guiomar, N.; Loureiro, C.; Barros, A.M.G. Bottom-Up Variables Govern Large-Fire Size in Portugal. Ecosystems 2016, 19, 1362–1375. [Google Scholar] [CrossRef]
  18. Faramarzi, H.; Hosseini, S.M.; Gholamali fard, M. Fire Hazard Zoning in National Golestan Park Using Logistic Regression and GIS. Geogr. Environ. Hazards 2014, 3, 73–90. (In Persian) [Google Scholar]
  19. Nhongo, E.J.S.; Fontana, D.C.; Guasselli, L.A.; Bremm, C. Probabilistic modelling of wildfire occurrence based on logistic regression, Niassa Reserve, Mozambique. Geomat. Nat. Hazards Risk 2019, 10, 1772–1792. [Google Scholar] [CrossRef] [Green Version]
  20. Milanović, S.; Marković, N.; Pamućar, D.; Gigović, L.; Kostić, P.; Milanović, S.D. Forest Fire Probability Mapping in Eastern Serbia: Logistic Regression versus Random Forest Method. Forests 2021, 12, 5. [Google Scholar] [CrossRef]
  21. Finney, M.A.; McHugh, C.W.; Grenfell, I.C.; Riley, K.L.; Short, K.C. A simulation of probabilistic wildfire risk components for the continental United States. Stoch. Environ. Res. Risk Assess. 2011, 25, 973–1000. [Google Scholar] [CrossRef] [Green Version]
  22. Parisien, M.A.; Barber, Q.E.; Hirsch, K.G.; Stockdale, C.A.; Erni, S.; Wang, X.; Arseneault, D.; Parks, S.A. Fire deficit increases wildfire risk for many communities in the Canadian boreal forest. Nat. Commun. 2020, 11, 2121. [Google Scholar] [CrossRef] [PubMed]
  23. Miller, C.; Ager, A.A. A review of recent advances in risk analysis for wildfire management. Int. J. Wildland Fire 2013, 22, 1–14. [Google Scholar] [CrossRef] [Green Version]
  24. Page, W.G.; Jenkins, M.J.; Alexander, M.E. Crown fire potential in lodgepole pine forests during the red stage of mountain pine beetle attack. Forestry 2014, 87, 347–361. [Google Scholar] [CrossRef] [Green Version]
  25. Alcasena, F.J.; Ager, A.A.; Bailey, J.D.; Pineda, N.; Vega-Garcia, C. Towards a comprehensive wildfire management strategy for Mediterranean areas: Framework development and implementation in Catalonia, Spain. J. Environ. Manag. 2019, 231, 303–320. [Google Scholar] [CrossRef]
  26. Parisien, M.A.; Kafka, V.; Hirsch, K.G.; Todd, J.B.; Lavoie, S.G.; Maczek, P.D. Mapping Wildfire Susceptibility with the BURN-P3 Simulation Model; Information Report NOR-X-405; Natural Resources Canada, Canadian Forest Service, Northern Forestry Centre: Edmonton, AB, Canada, 2005; p. 36. [Google Scholar]
  27. Ager, A.A.; Finney, M.A.; Kerns, B.K.; Maffei, H. Modeling wildfire risk to northern spotted owl (Strix occidentalis caurina) habitat in Central Oregon, USA. For. Ecol. Manag. 2007, 246, 45–56. [Google Scholar] [CrossRef]
  28. Tolhurst, K.; Shields, B.; Chong, D. Phoenix: Development and Application of a Bushfire Risk Management Tool. Aust. J. Emerg. Manag. 2008, 23, 47. [Google Scholar]
  29. Mallinis, G.; Mitsopoulos, I.; Beltran, E.; Goldammer, J.G. Assessing wildfire risk in cultural heritage properties using high spatial and temporal resolution satellite imagery and spatially explicit fire simulations: The case of Holy Mount Athos, Greece. Forests 2016, 7, 46. [Google Scholar] [CrossRef] [Green Version]
  30. Wang, X.; Parisien, M.A.; Taylor, S.W.; Perrakis, D.D.B.; Little, J.; Flannigan, M.D. Future burn probability in south-central British Columbia. Int. J. Wildland Fire 2016, 25, 200–212. [Google Scholar] [CrossRef] [Green Version]
  31. Beverly, J.L.; McLoughlin, N. Burn probability simulation and subsequent wildfire activity in Alberta, Canada—Implications for risk assessment and strategic planning. For. Ecol. Manag. 2019, 451, 117490. [Google Scholar] [CrossRef]
  32. D’Este, M.; Ganga, A.; Elia, M.; Lovreglio, R.; Giannico, V.; Spano, G.; Colangelo, G.; Lafortezza, R.; Sanesi, G. Modeling fire ignition probability and frequency using Hurdle models: A cross regional study in Southern Europe. Ecol. Process. 2020, 9, 54. [Google Scholar] [CrossRef]
  33. Villarreal, M.L.; Norman, N.M.; Yao, E.H.; Conrad, C.R. Wildfire probability models calibrated using past human and lightning ignition patterns can inform mitigation of post-fire hydrologic hazards. Geomat. Nat. Hazards Risk 2022, 13, 568–590. [Google Scholar] [CrossRef]
  34. Frost, E.J.; Sweeny, R. Fire Regimes, Fire History and Forest Conditions in the Klamath-Siskiyou Region: An Overview and Synthesis of Knowledge; Wildwood Environmental Consulting: Ashland, OR, USA, 2000; Available online: http://www.worldwildlife.org/forests/attachments/fire_report.pdf (accessed on 14 June 2020).
  35. Morgan, P.; Hardy, C.C.; Swetnam, T.W.; Rollins, M.G.; Long, D.G. Mapping fire regimes across time and space: Understanding coarse and fine-scale fire patterns. Int. J. Wildland Fire 2001, 10, 329–342. [Google Scholar] [CrossRef] [Green Version]
  36. Atrak Chali, A.B. Investigation of the Effects of Fire on Vegetation Changes. Master’s Thesis, University of Mazandaran, Sari, Iran, 2000; 85p. (In Persian). [Google Scholar]
  37. Hoshyarkhah, B.; Jamshidi Alashti, R. Fire regimes in the forest and strategies to deal with it. In Proceedings of the 2nd Disaster Management Conference, University of Tehran, Tehran, Iran, 25 December 2007. [Google Scholar]
  38. Sarkargar Ardakani, A.; Valadanzooj, M.J.; Mansourian, A. Spatial analysis of fire potential in Iran using RS and GIS. J. Environ. Stud. 2010, 35, 7–9. (In Persian) [Google Scholar]
  39. Adab, H. Landfire hazard assessment in the Caspian Hyrcanian Forest ecoregion with the long-term MODIS active fire data. Nat. Hazards 2017, 87, 1807–1825. [Google Scholar] [CrossRef]
  40. UNESCO-MAB Secretariat. Biosphere Reserves World Network; UNESCO: Paris, France, 2010. [Google Scholar]
  41. Akhani, H. Plant Biodiversity of Golestan National Park, Iran. Stapfia 1998, 53, 1–411. [Google Scholar]
  42. Akhani, H. Studies on the flora and vegetation of the Golestan National Park, NE Iran, III. Three new species, one new subspecies and fifteen new records for Iran. Edinb. J. Bot. 1999, 56, 1–31. [Google Scholar] [CrossRef]
  43. Jahdi, R.; Salis, M.; Darvishsefat, A.A.; Alcasena, F.; Mostafavi, M.A.; Etemad, V.; Munoz Lozano, O.; Spano, D. Evaluating fire modeling systems in recent wildfires of the Golestan National Park, Iran. Forestry 2016, 89, 136–149. [Google Scholar] [CrossRef] [Green Version]
  44. Leylian, M.R.; Amirkhani, A.; Ansari, M.; Bemanian, M.R. Investigating the Perceptions of Residents in Golestan National Park, Iran. Asian Soc. Sci. 2010, 6, 64–72. [Google Scholar] [CrossRef] [Green Version]
  45. Jahdi, R. Surface Fuel Models and Fire Hazard in Golestan National Park. J. Nat. Ecosyst. Iran 2021, 12, 82–99. (In Persian) [Google Scholar]
  46. Alhaj Khalaf, M.W.; Shataee-Jouibary, S.; Jahdi, R. Optimum Allocation of Firebreaks Networks during the Design Process in Golestan National Park, Northeastern Iran. Environ. Sci. Proc. 2022, 17, 41. [Google Scholar] [CrossRef]
  47. Agee, J.K. Fire Ecology of Pacific Northwest Forests; Island Press: Washington, DC, USA, 1996. [Google Scholar]
  48. Buma, B.; Hayes, K.; Weiss, S.; Lucash, M. Short-interval fires increasing in the Alaskan boreal forest as fire self-regulation decays across forest types. Sci. Rep. 2022, 12, 4901. [Google Scholar] [CrossRef] [PubMed]
  49. Erni, S.; Wang, X.; Taylor, S.; Boulanger, Y.; Swystun, T.; Flannigan, M.; Parisien, M.A. Developing a two-level fire regime zonation system for Canada. J. For. Res. 2020, 50, 259–273. [Google Scholar] [CrossRef]
  50. Koutsias, N.; Balatsos, P.; Kalabokidis, K. Fire occurrence zones: Kernel density estimation of historical wildfire ignitions at the national level, Greece. J. Maps 2014, 10, 630–639. [Google Scholar] [CrossRef] [Green Version]
  51. Finney, M.A. Fire growth using minimum travel time methods. Can. J. For. Res. 2002, 32, 1420–1424. [Google Scholar] [CrossRef] [Green Version]
  52. Finney, M.A. An overview of FlamMap fire modeling capabilities. In Fuels Management—How to Measure Success: Conference Proceedings, Portland, OR, USA, 28–30 March 2006; Rocky Mountain Research Station Proceedings RMRS-P-41; Andrews, P.L., Butler, B.W., Eds.; USDA Forest Service: Fort Collins, CO, USA, 2006; pp. 213–220. [Google Scholar]
  53. Jahdi, R.; Arabi, M. Modeling wildfire pathways in forest-grassland ecotones in Golestan National Park. J. Geogr. Environ. Hazards 2020, 9, 125–142. (In Persian) [Google Scholar]
  54. Ager, A.A.; Vaillant, N.M.; Finney, M.A. A comparison of landscape fuel treatment strategies to mitigate wildland fire risk in the urban interface and preserve old forest structure. For. Ecol. Manag. 2010, 259, 1556–1570. [Google Scholar] [CrossRef]
  55. Thompson, M.P.; Calkin, D.E.; Gilbertson-Day, J.W.; Ager, A.A. Advancing effects analysis for integrated, large-scale wildfire risk assessment. Environ. Monit. Assess 2011, 179, 217–239. [Google Scholar] [CrossRef]
  56. Salis, M.; Arca, B.; Del Giudice, L.; Palaiologou, P.; Alcasena-Urdiroz, F.; Ager, A.; Fiori, M.; Pellizzaro, G.; Scarpa, C.; Schirru, M.; et al. Application of simulation modeling for wildfire exposure and transmission assessment in Sardinia, Italy. Int. J. Disaster Risk Reduct. 2021, 58, 102189. [Google Scholar] [CrossRef]
  57. Pan, J.; Wu, X.; Zhou, L.; Wei, S. Spatial and Temporal Distribution Characteristics of Active Fires in China Using Remotely Sensed Data. Fire 2022, 5, 200. [Google Scholar] [CrossRef]
  58. Guo, H.; Kong, L.; Gao, Y.; Xiang, D.; Li Gong, L.; Zhang, Y. Transition from Surface Fire to Crown Fire and Effects of Crown Height, Moisture Content and Tree Flower. Fire Technol. 2022, 2022, e01262. [Google Scholar] [CrossRef]
  59. Jahdi, R.; Salis, M.; Alcasena, F.; Del Giudice, L. Assessing the Effectiveness of Silvicultural Treatments on Fire Behavior in the Hyrcanian Temperate Forests of Northern Iran. Environ. Manag. 2023, 22, e01785. [Google Scholar] [CrossRef] [PubMed]
  60. Jahdi, R.; Salis, M.; Darvishsefat, A.A.; Mostafavi, M.A.; Alcasena, F.; Etemad, V.; Lozano, O.; Spano, D. Calibration of FARSITE simulator in northern Iranian forests. Nat. Hazards Earth Syst. Sci. 2015, 15, 443–459. [Google Scholar] [CrossRef] [Green Version]
  61. Mirabolfathy, M.; Groenewald, J.Z.; Crous, P.W. The occurrence of charcoal disease caused by Biscogniauxia mediterranea on chestnut-leaved oak (Quercus castaneifolia) in the Golestan Forests, North of Iran. Plant Dis. 2011, 95, 876. [Google Scholar] [CrossRef]
  62. Salis, M.; Arca, B.; Alcasena-Urdiroz, F.; Massaiu, A.; Bacciu, V.; Bosseur, F.; Caramelle, P.; Dettori, S.; Fernandes De Oliveira, A.S.; Molina-Terren, D.; et al. Analyzing the recent dynamics of wildland fires in Quercus suber L. woodlands in Sardinia (Italy), Corsica (France) and Catalonia (Spain). Eur. J. For. Res. 2019, 138, 415–431. [Google Scholar] [CrossRef] [Green Version]
  63. Alcasena, F.J.; Salis, M.; Ager, A.A.; Castell, R.; Vega-García, C. Assessing wildland fire risk transmission to communities in northern Spain. Forests 2017, 8, 30. [Google Scholar] [CrossRef] [Green Version]
  64. Rolstad, J.; Blanck, Y.; Storaunet, K.O. Fire history in a western Fennoscandian boreal forest as influenced by human land use and climate. Ecol. Monogr. 2017, 87, 219–245. [Google Scholar] [CrossRef] [Green Version]
  65. Granström, A.; Niklasson, M. Potentials and limitations for human control over historic fire regimes in the Boreal Forest. Philos. Trans. R Soc. Lond. B Biol. Sci. 2008, 363, 2353–2358. [Google Scholar] [CrossRef] [Green Version]
  66. Ertuğrul, M.; Varol, T. The relationship between fire number and burned area in Antalya, Izmir and Muğla regions in Turkey. J. Envirn. Biol. 2015, 36, 399–403. [Google Scholar] [PubMed]
  67. Falk, D.A.; Allen, C.D.; Parmenter, R.; Swetnam, T.; Dils, C. Fire Regimes of Montane Grasslands of the Valles Caldera National Preserve, New Mexico; JFSP Research Project Reports 83; University of Arizona: Tucson, AZ, USA, 2011; 35p, Available online: https://digitalcommons.unl.edu/jfspresearch/83/ (accessed on 1 February 2023).
  68. Conver, J.L.; Falk, D.A.; Yool, S.R.; Parmenter, R.R. Modeling Fire Pathways in Montane grassland-forest ecotones. Fire Ecol. 2018, 14, 17–32. [Google Scholar] [CrossRef]
  69. Pourshakouri, F.; Darvishsefat, A.A.; Samadzadegan, F.; Attarod, P.; Selyari, J. Assessment of active fire detection algorithm for fire detection in natural resources using MODIS images (Case Study: Golestan national Park). J. Wood For. Sci. Technol. 2014, 20, 81–97. (In Persian) [Google Scholar]
  70. Stavi, I. Wildfires in Grasslands and Shrublands: A Review of Impacts on Vegetation, Soil, Hydrology, and Geomorphology. Water 2019, 11, 1042. [Google Scholar] [CrossRef] [Green Version]
  71. Bountzouklis, C.; Fox, D.M.; Bernardino, E.D. Environmental Factors Affecting Wildfire Burned Area in Southeastern France. Nat. Hazards Earth Syst. Sci. 2021, 5, 1970–2019. [Google Scholar] [CrossRef]
  72. Aini, A.; Curt, T.; Bekdouche, F. Modelling fire hazard in the southern Mediterranean fire rim (Bejaia Region, Northern Algeria). Environ. Monit. Assess 2019, 191, 747. [Google Scholar] [CrossRef] [PubMed]
  73. Ruffault, J.; Mouillot, F. Contribution of human and biophysical factors to the spatial distribution of forest fire ignitions and large wildfires in a French Mediterranean region. Int. J. Wildland Fire 2017, 26, 498–508. [Google Scholar] [CrossRef] [Green Version]
  74. Nielsen, S.E.; DeLancey, E.R.; Reinhardt, K.; Parisien, M.A. Effects of Lakes on Wildfire Activity in the Boreal Forests of Saskatchewan, Canada. Forests 2016, 7, 265. [Google Scholar] [CrossRef] [Green Version]
  75. Govender, N.; Trollope, W.S.; Van Wilgen, B. The effect of fire season, fire frequency, rainfall and management on fire intensity in savanna vegetation in South Africa. J. Appl. Ecol. 2006, 43, 748–758. [Google Scholar] [CrossRef]
  76. Trollope, W.; Trollope, L.; Hartnett, D. Forest Fire Research and Wildland Fire Safety; Millpress: Rotterdam, The Netherlands, 2002. [Google Scholar]
  77. McKelvey, K.S.; Busse, K.K. Twentieth-century fire patterns on forest service lands. In Sierra Nevada Ecosystem Project, Final Report to Congress, Assessments and Scientific Basis for Management Options; Report No. 37; University of California, Centers for Water and Wildland Resources: Davis, CA, USA, 1996; Volume II, pp. 1119–1138. [Google Scholar]
  78. Rollins, M.G.; Morgan, P.; Swetnam, T. Landscape-scale controls over 20th century fire occurrence in two large Rocky Mountain (USA) wilderness areas. Landsc. Ecol. 2002, 17, 539–557. [Google Scholar] [CrossRef]
  79. Tessler, N.; Sapir, Y.; Wittenberg, L.; Greenbaum, N. Recovery of Mediterranean vegetation after recurrent forest fires: Insight from the 2010 forest fire on Mount Carmel. Land Degrad. Dev. 2015, 27, 1424–1431. [Google Scholar] [CrossRef]
  80. Héon, J.; Arseneault, D.; Parisien, M.C. Resistance of the boreal forest to high burn rates. Proc. Natl. Acad. Sci. USA 2014, 111, 13888–13893. [Google Scholar] [CrossRef] [Green Version]
  81. Palaiologou, P.; Ager, A.A.; Nielsen-Pincus, M.; Evers, C.R.; Kalabokidis, K. Using transboundary wildfire exposure assessments to improve fire management programs: A case study in Greece. Int. J. Wildland Fire 2018, 27, 501–513. [Google Scholar] [CrossRef]
  82. Alcasena, F.J.; Salis, M.; Vega-García, C. A fire modeling approach to assess wildfire exposure of valued resources in central Navarra, Spain. Eur. J. For. Res. 2016, 135, 87–107. [Google Scholar] [CrossRef] [Green Version]
  83. van Etten, E.J.B.; Davis, R.A.; Doherty, T.S. Fire in Semi-Arid Shrublands and Woodlands: Spatial and Temporal Patterns in an Australian Landscape. Front. Ecol. Evol. 2021, 9, 653870. [Google Scholar] [CrossRef]
  84. Barros, A.M.G.; Pereira, J.M.C. Wildfire Selectivity for Land Cover Type: Does Size Matter? PLoS ONE 2014, 9, e84760. [Google Scholar] [CrossRef]
  85. Salis, M.; Del Giudice, L.; Jahdi, R.; Alcasena, F.; Scarpa, C.; Pellizzaro, G.; Bacciu, B.; Schirru, M.; Ventura, A.; Casula, M.; et al. Spatial Patterns and Intensity of Land Abandonment Drive Wildfire Hazard and Likelihood in Mediterranean Agropastoral Areas. Land 2022, 11, 1942. [Google Scholar] [CrossRef]
  86. Birch, D.S.; Morgan, P.; Kolden, C.A.; Abatzoglou, J.T.; Dillon, G.K.; Hudak, A.T.; Smith, A.M.S. Vegetation, topography and daily weather influenced burn severity in central Idaho and western Montana forests. Ecosphere 2015, 6, 17. [Google Scholar] [CrossRef]
  87. Estes, B.L.; Knapp, E.E.; Skinner, C.N.; Miller, J.D.; Preisler, H.K. Factors influencing fire severity under moderate burning conditions in the Klamath Mountains, northern California, USA. Ecosphere 2017, 8, e01794. [Google Scholar] [CrossRef] [Green Version]
  88. Ye, T.; Wang, Y.; Guo, Z.; Li, Y. Factor contribution to fire occurrence, size, and burn probability in a subtropical coniferous forest in East China. PLoS ONE 2017, 12, e0172110. [Google Scholar] [CrossRef] [Green Version]
  89. Holsinger, L.; Parks, S.A.; Miller, C. Weather, fuels, and topography impede wildland fire spread in, western US landscapes. For. Ecol. Manag. 2016, 380, 59–69. [Google Scholar] [CrossRef]
  90. Bigio, E.R.; Swetnam, T.W.; Baisan, C.H. Local-scale and regional climate controls on historical fire regimes in the San Juan Mountains, Colorado. For. Ecol. Manag. 2016, 360, 311–322. [Google Scholar] [CrossRef]
  91. Cruz, M.G.; Alexander, M.E. The 10% wind speed rule of thumb for estimating a wildfire’s forward rate of spread in forests and shrublands. Ann. For. Sci. 2019, 76, 44. [Google Scholar] [CrossRef] [Green Version]
  92. Dimitrakopoulos, A.P.; Dritsa, S. Novel nomographs for fire behaviour prediction in Mediterranean and submediterranean vegetation types. Forestry 2003, 76, 479–490. [Google Scholar] [CrossRef]
  93. Natole Jr, M.; Ying, Y.; Buyantuev, A.; Stessin, M.; Buyantuev, V.; Lapenis, A. Patterns of mega-forest fires in east Siberia will become less predictable with climate warming. Environ. Adv. 2021, 4, 100041. [Google Scholar] [CrossRef]
  94. Caccamo, G.; Chisholm, L.A.; Bradstock, R.A.; Puotinen, M.L.; Pippen, B.G. Monitoring live fuel moisture content of heathland, shrubland and sclerophyll forest in south-eastern Australia using MODIS data. Int. J. Wildland Fire. 2012, 21, 257–269. [Google Scholar] [CrossRef]
  95. Naderpour, M.; Rizeei, H.M.; Ramezani, F. Forest Fire Risk Prediction: A Spatial Deep Neural Network-Based Framework. Remote Sens. 2021, 13, 2513. [Google Scholar] [CrossRef]
  96. Wu, Z.; He, H.S.; Keane, R.E.; Zhu, Z.; Wang, Y.; Shan, Y. Current and future patterns of forest fire occurrence in China. Int. J. Wildland Fire 2020, 29, 104–119. [Google Scholar] [CrossRef]
  97. Syphard, A.D.; Rustigianromsos, H.; Mann, M.L.; Conlisk, E.; Moritz, M.A.; Ackerly, D.D. The relative influence of climate and housing development on current and projected future fire patterns and structure loss across three California landscapes. Glob. Environ. Chang. 2019, 56, 41–55. [Google Scholar] [CrossRef]
  98. Zhang, Y.; Lim, S.; Sharples, J.J. Effects of climate on the size of wildfires in the Eucalyptus camaldulensis forests and the dry lands of the Riverina Bioregion, Australia. For. Ecol. Manag. 2017, 401, 330–340. [Google Scholar] [CrossRef]
  99. Rothermel, R.C. How to Predict the Spread and Intensity of Forest and Range Fires; Gen. Tech. Rep. INT-143; U.S. Department of Agriculture, Forest Service, Intermountain Forest and Range Experiment Station: Ogden, UT, USA, 1983; 161p. [Google Scholar]
  100. Rothermel, R.C.; Wilson, R.A., Jr.; Morris, G.A.; Sackett, S.S. Modeling Moisture Content of Finc Dead Wildland Fuels: Input to the BEHAVE Fire Prediction System; Res. Pap. INT-359; USDA Forest Service, Intermountain Research Station: Ogden, UT, USA, 1986; 61p. [Google Scholar]
  101. Nelson, R.M., Jr. Prediction of diurnal change in 10-h fuel stick moisture content. Can. J. For. Res. 2000, 30, 1071–1087. [Google Scholar] [CrossRef]
  102. Andrews, P.L. BEHAVE: Fire Behavior Prediction and Fuel Modeling System—BURN Subsystem, Part 1; Gen. Tech. Rep. INT-194; U.S. Department of Agriculture, Forest Service, Intermountain Forest and Range Experiment Station: Ogden, UT, USA, 1986; 130p. [Google Scholar]
  103. Deeming, J.E.; Burgan, R.E.; Cohen, J.D. The National Fire Danger Rating System—1978; Gen. Tech. Rep. INT-39; U.S. Department of Agriculture, Forest Service, Intermountain Forest and Range Experiment Station: Ogden, UT, USA, 1977; 63p. [Google Scholar]
  104. Bradshaw, L.S.; Deeming, J.E.; Burgan, R.E.; Cohen, J.D. The 1978 National Fire Danger Rating System: Technical Documentation; Gen. Tech. Report INT-169; USDA Forest Service: Ogden, UT, USA, 1983; 44p. [Google Scholar]
  105. Finney, M.A. FARSITE: Fire Area Simulator-Model Development and Evaluation; Res. Pap. RMRS-RP-4, Revised 2004; U.S. Department of Agriculture, Forest Service, Rocky Mountain Research Station: Ogden, UT, USA, 1998; 47p. [Google Scholar]
Figure 1. The location of the GNP in NE Iran (top-right insert), along with the digital elevation model (DEM), (a), and the historical wildfire ignitions (2000–2020), (b) in the park.
Fire 06 00244 g001
Figure 2. Land use/cover (LUC, (a)) and fuel models (b) maps of the study area.
Fire 06 00244 g002
Figure 3. Description of wildfire regime in the study area: (a) seasonality; (b) fire size; (c) fire frequency; (d) annual burn rate. Metrics were obtained by calculating the median of each wildfire regime parameter per year, using fire data for 2000–2020.
Fire 06 00244 g003
Figure 4. Output maps of fire ignition density (FID, (a)); burn probability (BP, (b)); conditional flame length (CFL (m), (c)); and fire size (FS (ha), (d)) for the study area.
Fire 06 00244 g004
Figure 5. The coefficient of determination (R2) from the logistic regression model for individual weather, fuel, and topography factors influencing the observed fire perimeters (>10 ha, (a)); simulated burn probability (BP, (b)); conditional flame length (CFL (m), (c)); and fire size (FS (ha), (d)). Significance is indicated by * for p ≤ 0.05, ** for p ≤ 0.01, and *** for p ≤ 0.001.
Fire 06 00244 g005
Table 1. Description of the study area.
Variables
Study area extent (ha)87,402
Burnable area (ha)85,732
Elevation (m a.s.l.)455–2344
Dominant tree species
-
Quercus castaneifolia C. A. Mey.,
-
Carpinus betulus L.,
-
Carpinus orientalis Mill.,
-
Acer cappadocicum Gled.,
-
Tilia platyphyllos subsp.
-
Mespilus germanica L.,
Dominant shrub species
-
Juniperus excelsa M. Bieb.,
-
Juniperus communis L.
-
Juniperus sabina L.
-
Prunus divaricate Ledeb.,
-
Crataegus oxyacantha L.,
-
Paliurus spina-christi Mill.,
-
Colutea buhsei Boiss.,
Dominant grass species
-
Festuca drymeia Mert. & Koch.,
-
Artemisia sieberi Besser.,
-
Astragalus jolderensis B. Fedtsch.,
-
Poa bulbosa L.,
-
Euphorbia amygdaloides L.,
-
Primula heterochroma Stapf.,
-
Thymus kotschyanus Boiss. & Hohen.,
-
Stipa holosericea Trin.,
-
Agropyron spp.
-
Bromus persicus Boiss.,
-
Hordeum bulbosum L.,
-
Galium odoratum (L.) Scop.
Table 2. List of environmental variables analyzed in the logistic regression model in the study area.
Fire Environment VariablesDescription/Data Structure
Fuel
  Surface fuel loadDry weight of the surface fuel layer per unit area (t ha−1)/Static
  Fuel densityNormalized difference vegetation index (NDVI *)/Static
  Fuel moistureThe average monthly fuel moisture content, obtained from Alhaj Khalaf [46] et al./Dynamic
Topography
  Digital elevation model (DEM)Elevation (m)/Static
  Slope steepnessSlope (°)/Static
Weather
  TemperatureThe average daily temperature (°C)/Dynamic
  Relative humidityThe average daily relative humidity (%)/Dynamic
  Wind speedThe average daily wind speed (m s−1)/Dynamic
  PrecipitationThe average daily precipitation (mm)/Dynamic
* Landsat 8 OLI-derived NDVI.
Table 3. The total area occupied by each fuel type, area burned by fuel type, percentage of the total burned area, and ranges of wildfire regime components (seasonality, size, frequency, and burn rate) in the three fuel types (grass, shrub, and timber fuels) in the study area, using fire data for 2000–2020.
VariablesGrass FuelShrub FuelTimber FuelTotal
Area (ha)42,470731235,95085,732
Total area burned (ha)47271508453210,587
Total area burned (%)11211212
Wildfire regime componentsPercentage of landscape
Seasonality
  Fall49365145
  Summer37331629
  Mixed14313326
Fire size class [62].
  ≤1 ha197629
  1–10 ha14162117
  10–100 ha7851344
  >100 ha724010
Fire frequency (% year−1)
  1–10810109
  10–2064574455
  20–3017113421
  >3011221215
Annual burn rate (%)
  0.1–0.360304545
  0.3–0.617162319
  0.6–11219813
  >111352423
Table 4. Summary statistics of the predicted burn probability (BP), conditional flame length (CFL (m)), and fire size (FS (ha) in the three fuel types (grass, shrub, and timber fuels) in the study area.
VariablesGrass FuelShrub FuelTimber FuelTotal
BPMin0000
Max0.0200.0170.0090.020
Mean0.0050.0040.0010.003
SD0.0030.0030.0010.002
CFL (m)Min0000
Max4.115.607.207.20
Mean0.741.600.530.48
SD0.580.400.660.66
FS (ha)Min2.5315.063.272.47
Max2768.332479.462241.232770
Mean451.59838.94181.37232.00
SD561.41585.62156.08443.21
Disclaimer/Publisher’s Note: The statements, opinions and data contained in all publications are solely those of the individual author(s) and contributor(s) and not of MDPI and/or the editor(s). MDPI and/or the editor(s) disclaim responsibility for any injury to people or property resulting from any ideas, methods, instructions or products referred to in the content.

