Article

Thermal and Pyrolysis Kinetics Analysis of Glass Wool and XPS Insulation Materials Used in High-Rise Buildings

1
School of Engineering, Design and Built Environment, Western Sydney University, Penrith, NSW 2751, Australia
2
Department of Textile Engineering, Dhaka University of Engineering & Technology, Gazipur 1707, Bangladesh
3
School of Mechanical and Manufacturing Engineering, University of New South Wales, Sydney, NSW 2052, Australia
4
Advanced Materials Characterisation Facility, Western Sydney University, Locked Bag 1797, Penrith, NSW 2751, Australia
*
Author to whom correspondence should be addressed.
Fire 2023, 6(6), 231; https://doi.org/10.3390/fire6060231
Submission received: 23 May 2023 / Revised: 2 June 2023 / Accepted: 6 June 2023 / Published: 8 June 2023

Abstract

:
This study investigates the kinetics data of glass wool (GW) and extruded polystyrene (XPS) insulation materials used in cladding systems using a systematic framework. The determination of appropriate kinetic properties, such as pre-exponential factors, activation energy and reaction orders, is crucial for accurately modelling the full-scale fire performance of insulation materials. The primary objective of this research is to extract thermal and kinetics data of XPS and GW insulation materials employed in high-rise buildings. To obtain these properties, thermogravimetric analysis (TGA) is conducted at four different heating rates: 5, 10, 15 and 20 K/min. The TGA results serve as the basis for determining the kinetic properties using a combination of model-free and model-based methods. The outcomes of this study are expected to be highly beneficial in defining the pyrolysis reaction steps and extracting kinetics data for fire modelling of such insulation materials. This information will enhance the understanding of the fire behaviour and performance of these materials during fire incidents, aiding in developing more accurate fire models and improving fire safety strategies for cladding systems in high-rise buildings.

1. Introduction

Building insulation materials that are flammable and combustible have emerged as a potential new fire threat. Improved building thermal insulation is one of the most important and increasingly popular solutions for energy saving and thermal balancing, as energy consumption of buildings accounts for about 30–40% of global energy [1,2]. As a result, commercial building insulation materials, such as organic polystyrenes, are receiving greater attention for use in buildings [3,4]. These insulation materials attracted more attention in the construction industry due to their appealing characteristics, such as being lightweight with excellent thermal insulation, good chemical resistance, and cheaper price [5]. However, these polystyrene foams without fire protection layers can be highly flammable. When organic polystyrenes-based insulation materials ignite, they melt and produce flame drips, and then the flames can quickly spread and become challenging to extinguish [1,6]. Because combustible thermal insulation materials are intrinsically flammable, some researchers advocate replacing them with non-combustible materials. Glass wool (GW) is a common and popular thermal insulation material widely used in building construction as a non-combustible insulation material [7]. Due to its excellent thermal insulation at relatively high temperatures, GW has received particular attention in fire protection [5]. However, the material structural deformation caused by the GW melting that causes morphological changes under high radiation heat flux can be fatal [7]. Therefore, it is important to analyse the fire performance of these materials using full-scale fire tests.
In different countries, the full-scale fire testing approach has been used to assess the fire performance of the entire cladding system, including all insulations and fastening methods [8,9]. Even though the full-scale test would accurately simulate a cladding fire, such tests require highly-equipped fire laboratories with large infrastructures [10,11,12]. Furthermore, these tests are usually expensive, take a long time to plan and release significant pollutants into the environment [12,13,14,15]. In addition, Australia has more than 3400 buildings with combustible cladding systems [16]. Even while full-scale fire tests may be carried out to examine the flammability restrictions of the building cladding system with flammable insulations, it is not practical to analyse the flammability of the existing building cladding system with the full-scale fire test as it needs a large number of test materials and is highly costly [17].
Numerical simulation is a possible alternative for evaluating the fire performance of the building cladding with insulation materials under a full-scale test [18,19]. To numerically predict the fire behaviour of insulation materials, pyrolysis needs to be modelled first. The pyrolysis model allows an understanding of the fire behaviour of insulation materials without having to conduct expensive full-scale experimental tests. The precision of the pyrolysis modelling heavily depends on the kinetics triplets, activation energy, pre-exponential factor and reaction model. Several studies on kinetics triplet analysis of XPS exist in the literature [20,21]. Limited research on the combustion properties of GW has been conducted [7]. To the best of the author’s knowledge, no kinetics parameters for GW are available.
Jiao et al. [19] focused on the pyrolysis characteristics of XPS in combination with EPS and PU foam with the model-free Kissinger–Akahira–Sunose (KAS) method. The study used the KAS instead of the OFW (Ozawa–Flynn–Wall) method to more accurately measure activation energy. Li et al. [20] explored different kinetics models for the suitability of XPS pyrolysis kinetics extraction. The study utilised the Distributed Activation Energy Model Method (DAEM) instead of KAS. Most of the studies focused on typical mineral insulation, i.e., stone wool, to analyse their thermal and kinetic reaction properties as non-combustible insulation materials [22,23]. Hidalgo et al. [22] examined the thermal properties of stone wool to establish the concept of the critical temperature for constructing fire-safe buildings. Livikiss et al. [23] employed two reaction steps to analyse the kinetic properties of stone wool and develop a model. More recently, Yuan et al. [7] investigated the temperature range of pyrolysis and combustion, heat of the reaction and mass loss of the GW. However, none of these studies explored the pyrolysis kinetics properties of GW, which is crucial for fire performance analysis using numerical modelling.
To address the above research gap, this study aims to establish quality kinetics data of XPS and GW insulation materials and benchmark their accuracies compared to experimental data from TGA. The materials include (i) XPS and (ii) GW. A state-of-the-art kinetic software (Kinetics NEO) is used to determine the key kinetic parameters in the form of a derived kinetic triplet (activation energy Ea, pre-exponential factor A, and kinetic conversion function related to the pyrolysis mechanism) by combining model-free and model-based kinetic methods. Once a kinetic model has been verified for certain reaction steps, a numerical prediction method is used to predict the mass loss of XPS and GW insulation materials under standard fire curves.

2. Materials and Methods

2.1. Materials

This study used two types of insulation materials (XPS and GW) commonly used in buildings as thermal insulators [24]. XPS is mainly produced from oil-based polystyrene with expanding gas agents, such as HFC, CO2 or H6H12, with an extruded nozzle [5]. The GW is composed of SiO2 (63.4%), Na2O (16.1%), CaO (8.3), MgO (2.5), Al2O3 (1.9) and others (7.8%) [25]. The current materials are collected from the commercial products used in the existing buildings, which are listed in Table 1. Materials thicknesses are based on the available commercial product. The density of XPS is measured as 28 kg/m3 and 45 kg/m3 for GW. The measured specific heat was 1.712 Jg−1 K−1 for XPS and 0.855 Jg−1 K−1 for GW. The thermal conductivity is collected from literature [1,7]. All the samples are shown in Figure 1, where the onset is the top view of each sample.

2.2. Simultaneous Thermal Analysis

Simultaneous thermal analysis (STA), including thermogravimetric analysis (TGA) and differential scanning calorimetry (DSC), was performed for all test samples with two objectives. The first objective was to investigate the difference in thermal degradation patterns between these materials. The second objective was to analyse the decomposition reaction scheme with a number of reaction steps that can provide a satisfactory fit to experimental data and derive the kinetics parameter. TGA/DSC analysis was conducted on a Netzsch STA449C Jupiter with four linear heating rates of 5, 10, 15 and 20 °C min−1. The heating rates were chosen based on a study carried out by several current research studies [26,27,28]. The chosen range of heating rates allowed for analysing the various thermal breakdown stages and the effects of varying the flow rate. The characterisation was carried out in a nitrogen atmosphere with a total flow rate of 50 mL/min and temperatures ranging from room temperature to 1000 °C. Each sample was loaded into a crucible, with sample weights ranging from 10 ± 2 mg. The reproducibility at each heating rate and with each material was also periodically checked by performing duplicate runs.

2.3. Pyrolysis Kinetics Theory

Pyrolysis, also known as the thermal deterioration of a material without oxygen, produces volatile combustibles, which can induce ignition, sustained combustion and flame spread over a material. To fit a model accurately, pyrolysis kinetics data of the individual materials of cladding systems can play an important role that has not yet been examined in depth for ACP cladding simulations. These kinetic parameters, which are often termed kinetic triplets, include the pre-exponential factor (A), activation energy (Ea) and reaction order (n). Many researchers are now using small-scale simultaneous thermal analysis (STA) techniques, such as thermogravimetric analysis (TGA) and differential scanning calorimetry (DSC), for pyrolysis kinetics investigations of organic polymers [2,14]. Model-free and model-based techniques can be used to calculate the kinetic parameters (i.e., calculation of peak points, different phases of the process, number of reaction steps, prediction at temperatures, process optimisation and/or heating rates) [29,30,31,32].
The model-free analysis or iso-conversational analysis can be described using one (single) kinetic equation (Equation (1)) as a single-step reaction process for mass conversion (α).
d α d t = A   ( α ) · e x p [ E a ( α ) R T ] · f ( α )
where d α d t is the reaction rate (s−1), t is the time (s), α is the conversion rate, Ea is the activation energy (J mol−1), A is the pre-exponential factor (s−1), T is the absolute temperature (K), R is the gas constant (8.314 J K−1 mol−1) and f (α) is the kinetic reaction model.
There are some common model-free methods, including Friedman (FR), Ozawa–Flynn–Wall (OFW), Kissinger–Akahira–Sunose (KAS) and the Vyazovkin method (VA) [33]. The model-free methods considered to study the kinetics analysis are listed in Table 2. In the calculation, the FR method applies the differential equation approximation (see Table 2). The FR model findings (curves Ea(α) and A(α)) were numerically adjusted to improve the fit between experimental and simulated curves. The modified differential method of FR is known as numerical optimisation analysis (NOA). NOA uses a differential form of the iso-conversional method to determine the activation energy and pre-exponential factor to achieve the best agreement between simulated and experimental curves [34,35]. In contrast, OFW (Ozawa–Flynn–wall) and KAS (Kissinger–Akahira–Sunose) use the approximation of integral equations (see Table 2). VA (Vyazovkin) analysis uses an integral variant of the iso-conversional procedure. For NOA, non-isothermal and isothermal conditions may be necessary, whereas for VA, non-isothermal conditions are required only. The activation energy is calculated using the same conversion values (α = 0.01 to 0.99) from data taken at various heating rates in all techniques.
In the model-based kinetic analysis, the reaction consists of multi-step reactions, each of which can be described by individual kinetics equations based on the concentration of the initial reactant,   e j , the concentration of the product, p j , the pre-exponential factor, A j and the activation energy, E a j , for this step with number, j, as follows:
( Reaction   rate ) j =   A j · f j ( e j , p j ) exp ( E a j R T )
Each considered step has its reaction type described by the function of f j ( e j , p j ) . The number of kinetic equations equals the number of reaction steps. Some of the most often used functions in Kinetics NEO and their codes are summarised in Table 3.

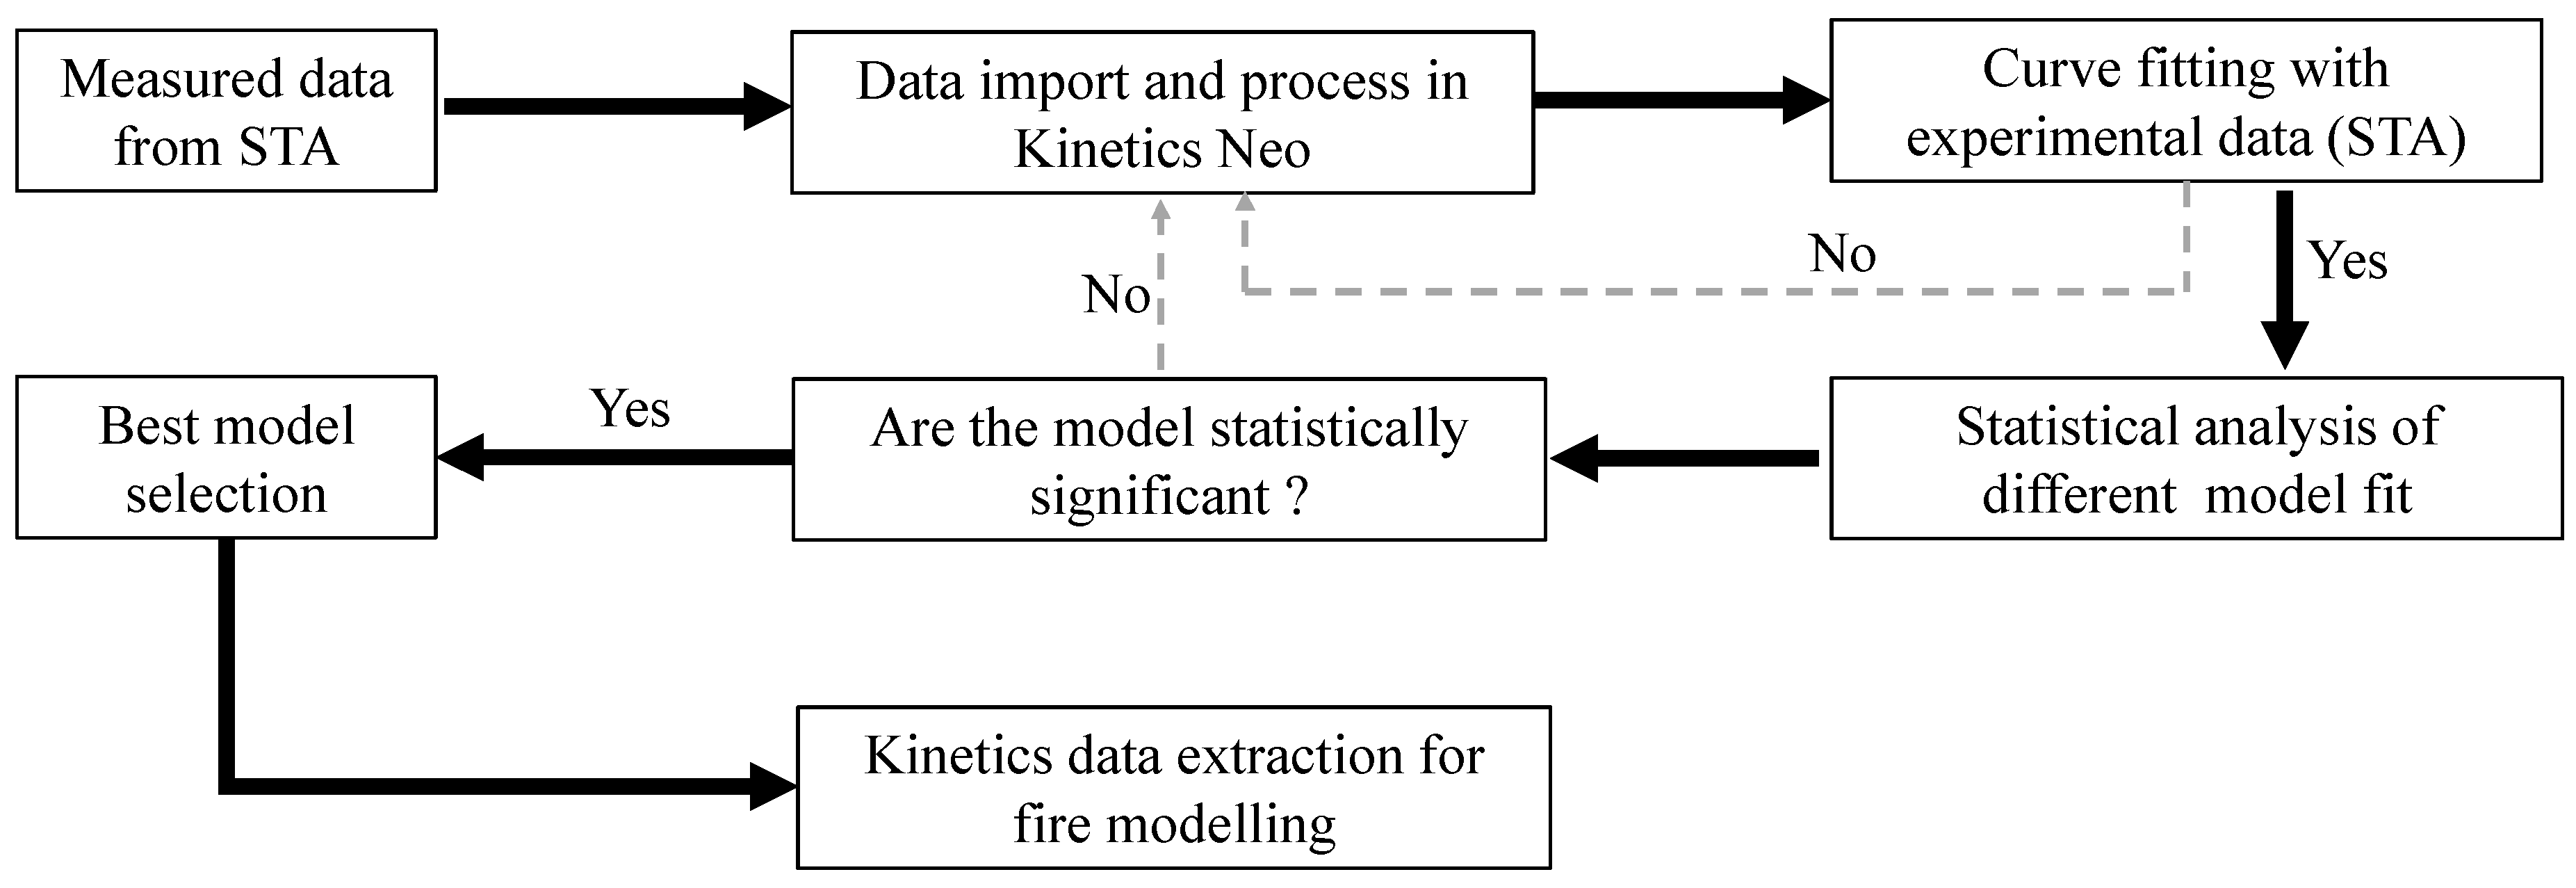
2.4. Proposed Framework for Kinetics Data Extractions

A systematic framework is given below for selecting an appropriate model for kinetic extraction using STA measurement (Figure 2). It is crucial to identify the pyrolysis reaction steps of the materials for choosing the model types. These can primarily be determined from TGA and DTG curves. To define an appropriate model, curve fitting is carried out, which is also helpful in identifying the appropriate number of reaction steps of the tested materials. Depending on the careful selection of experimental data fitting to a model-free or model-based analysis, the kinetics triplets can be used to predict measurement output (signals), conversion, conversion rate, concentration for each reactant (model-based) and reaction rate for each reaction step (model-based). Next, the appropriate model can be selected from the statistical analysis for individual materials to extract the kinetics data. All calculations and model selections were made using the Kinetics NEO software toolset. In isoconverisonal analysis, Kinetics Neo substitutes the decimal logarithm for the traditional natural logarithm. For optimisation and curve-fitting, Kinetics Neo, NETZSCH developed the nonlinear least square method [36]. In order to achieve the best coefficient of determination, or R2, of the calculation fit to experimental data, the kinetic parameters are optimised using the least squares method. The F-test was chosen as a statistical test to compare the models, as well as to assess the suitability of various model-free and model-based approaches. The kinetics data are then used for mass loss estimation and fire modelling under different fire profiles.
For statistical analysis, the coefficient of determination (R2), residual sum of squares (S2) and F-test were calculated, and a right tail p-value of 0.05 was used. The coefficient of determination, R2, is well known, and the details can be found elsewhere [37]. The sum of squares, S2, was measured as the sum of deviation squares between experimental and calculated data (Equation (3)). If the experimental data, yj, measured at the points xj for the curve i, and the model function, f(x), is calculated at these points, then the regression values are f(xj). The residual between the experimental data and model data for ith curve is y i , j f ( x i , j ) , therefore, S2 can be written as:
S 2 = i C u r v e s j P o i n t s [ y i , j f ( x i , j ) ] 2
The F-test is used to compare various models provided by the least square method. A non-symmetrical distribution or F-distribution is used for sampling to describe the distribution of the ratio of two estimates of standard deviations,   σ 2 . The F-test value for each analysed model presents a ratio of its minimal estimate variance to minimum variance in the experimented population as Equation (4). The models are selected based on the F-test value, which is within the range of critical F-distribution. Higher F-test values indicate that the standard deviations for the j and min models are equal, which is a reason to reject the null hypothesis, and as a result, such models should be disregarded. Using the S2 in the formula for F-test can be written as:
F = S j 2 S m i n 2
Here, S j 2 and S m i n 2 min represents the variance estimates of σ j 2 and σ m i n 2 , which are minimum values of the model and experimental population, respectively. The mean residual (MR) is the average of the absolute residuals Equation (5). If the experimental data yj is measured at the points xj for the curve i, and the model function f(x) is calculated at these points, then the regression values are f(xj). y i , j f ( x i , j ) is the residual value of the experimental and model value for the ith curve. The mean residual (MR) is written as:
M R = i c u r v e s j p o i n t s | y i , j f ( x i , j ) | i c u r v e s n P o i n t s i
Here, n P o i n t s i are the number of points in the ith curve. If the model curve matches exactly to the experimental curve, the residuals will be zero. Hence the MR value will be zero. Thus, MR approaches zero as the calculated model curve approaches the experimental data.

2.5. Fire Curves for Modelling

Mass loss of insulation materials is a commonly used parameter in fire safety engineering to evaluate fire hazards. A model (model-free or model-based) with which the data was previously studied has been chosen to examine the prediction of mass loss under different fire curves [38]. Different external temperature profiles have been used for predicting the material behaviour under fire. In this study, three pre-defined temperature profiles or fire curves are used: (i) standard fire curve, (ii) external fire curve and (iii) slow heating fire curve (see Figure 3).
The standard fire curve [39] is the oldest fire curve used to evaluate and classify passive fire protection systems for buildings, such as loadbearing structure fire protection, compartmentation and fire stopping.
Standard   fire   curve ,   T = 20 + 345 × l o g 10   ( 8 t + 1 )
where T is the temperature (°C) and t is time (min).
The external fire curve [40] is employed when the outside of the building is required to offer fire resistance to prevent the fire from spreading to the next story. The curve assumed that the air outside the structure cools the flames.
External fire curve, T = 20 + 660 × (1 − 0.687e−0.32t − 0.313e−3.8t)
In addition to regular fire curve testing, a slow-heating fire curve [38] is advised to ensure that reactive chemicals, such as intumescent paints, work well under slow-heating circumstances. The beginning phase of a slow-heating fire starts at a low temperature, and after about 20 min, the fire reaches the standard fire curve. The equation for the fire curves is as follows:
Slow heating curve, T = 20 + 345 × log10 [8(t − 20) + 1] (for, T > 21 °C)
= 154 ×t0.25 + 20 (for, T ≤ 21 °C)

2.6. Microscopy Imaging and Elemental Microanalysis

Microscopic imaging was used to determine the presence of any filler materials in the insulation materials. The samples were first imaged at 50× magnification on a Jeol 6510LV SEM in a low vacuum with a backscatter detector and an accelerating voltage of 25 kV and connected with an Amptek EDS detector for elemental analysis. The results obtained from SEM and EDS for the insulation materials (XPS and GW) are reported in Figure 4.
XPS samples revealed non-charring qualities; hence, no char analysis was performed on XPS samples. XPS samples (Figure 4a) revealed the presence of certain coloured pigments in the microstructure. Apart from carbon (C) and oxygen (O), the existence of elements such as aluminium (Al), bromine (Br), calcium (Ca) and magnesium (Mg) was found in Figure 4b. The solid structure of GW revealed a thread-like structure (Figure 4c), containing silicon (Si), calcium (Ca), oxygen (O), sodium (Na) and magnesium (Mg) (Figure 4d). In comparison to the solid samples, the char of GW displayed a more compact microstructure (Figure 4e) after heat exposure with no elemental change in the material configuration (Figure 4f). This indicates the shrinkage behaviour of the GW under higher thermal exposure [7].

3. Results and Discussion

3.1. Thermal Analysis

The heating rate, temperature range, onset temperature (To), peak temperature (Tp), end temperature (Te) and mass residual % are shown in Table 4 for XPS and GW. The scheme used for calculating To, Tp and Te from the DTG curve is described in [31]. Table 4 shows that a higher heating rate slows the rate of deterioration, causing the beginning, peak and end temperatures to move to higher values.
This change was mainly attributable to the temperature and time histories of the materials. The contour of the weight loss curve does not alter with the change in the heating rate, as seen in TGA curves. The change in the mechanism caused by increasing the heating rate explains the displacement of To, Tp and Te to higher temperatures by many researchers [31,41,42]. The difference in mechanism owing to various heating rates supports this argument since the sample size and amount taken for TGA are modest enough to disregard any heat and mass transfer gradients [31].
The TGA analysis was used to estimate the number of reaction steps of the materials across a wide range of temperatures under visual inspection. Though the visual inspection does not always indicate the accurate multi-step nature of materials, it will be useful for primary model selection for kinetics analysis [33]. In the later section, the specific reaction steps will be discussed.

3.1.1. Extruded Polystyrene (XPS)

Only one mass loss step in the TG curve (Figure 5a) and a single DTG peak confirm the one-step process of XPS (Figure 5b). Only 3% mass residue was observed. The degradation behaviour of XPS begins at 390 °C and stops at 469 °C in Figure 5b. In this degradation temperature range, only one peak in weight loss exists, which performs similarly to other literature [43]. The main reason for the mass loss is that the solid phase of XPS generates volatile gases [44]. As shown in Figure 5b, the movement of the DTG or conversion rate curves is related to the heating rates. As the heating rate increases, the reaction range is gradually delayed to a higher temperature to complete the reaction.
For example, the peak temperatures (TP) of the DTG curves at four heating rates are 408 °C, 418 °C, 428 °C and 435 °C. In addition, the initial decomposition temperature of XPS varies from 390 °C to 411 °C depending on the heating rate (5 to 20 K/min), and the final temperature ranges from 430 °C to 469 °C. It is suggested that if there was just one peak in the DTG curve, one reaction occurred. Figure 5c also confirmed one endothermic peak for each curve. This endothermic peak is associated with the significant mass loss seen in TGA curve and was the thermal decomposition of the sample. However, a limited exothermic peak was observed, specifically for 10 K/min and 15 K/min heating rate curves. It suggested that some small amount of additives in the materials was volatilised in this stage. Since each DTG and DSC curve has only one peak, the pyrolysis of XPS in nitrogen is a one-step reaction [45].

3.1.2. Glass Wool (GW)

From the TGA curves, two-step reactions were initially identified for GW. The amount of residual percentage for GW was 95% (Figure 6a). The onset temperature (To) ranged between 242 °C and 260 °C (Figure 6b). Two visible reaction steps were found. The peak of the first reaction steps ranged between 295 °C and 335 °C, corresponding to the dehydration and reaction of the resin binder [23]. The second steps were between 745 °C and 775 °C, consistent with previous research [23]. The second step indicates the pyrolysis process of the GW. The DSC curves are not perfect, especially for 20 k/min (Figure 6c). Overall, the heat flow signals were very weak and indicated that GW does not react strongly during the single pyrolysis process.

3.2. Model Selections

The present study utilised the proposed framework described in Figure 2 to select the model for each sample and analyse the kinetics parameters. All the kinetics analyses were based on the collected TGA mass loss results and the decomposition steps. Sample XPS, consisting of only polystyrene, is modelled using isoconversonal multipoint model-free methods (i.e., FR, OFW, VA and NOA) to analyse the kinetics parameters. The advantage of the model-free analysis is its simplicity and avoiding errors connected with selecting a kinetics model [46]. However, GW consists of multi-mixture elements in its core and have possibilities for individual reaction steps. In this type of condition, the model-free method is not suitable. Hence model-based methods are used (i.e., An, Cn, Cnm, Fn and KS) [47]. Table 5 shows a comparative overview of the statistical analysis of all used models employed in the kinetics analysis of the tested samples (XPS and GW). A higher R2, lower F-test and a lower sum of deviation indicate a good fit model [35,48]. From the curve fitting, Friedman, numerical optimisation analysis (NOA) and Vyazovkin models overlapped each other (Figure 7a,b).
In contrast, the shift and amplitude variation in curve fitting is obtained with OFW. The Friedman, VA and NOA methods use the point values of the overall reaction rate or short time intervals [32]. However, OFW underestimates the Ea when Ea increases with α. This is because in OFW models, Ea assumes to be a constant value. As a result, conversion rate vs. time curve variation can be observed [49]. On the other hand, the An model gives the best curve fitting (Figure 8a,b) compared to other models for GW. However, for further confirmation, statistical analysis is essential.
Table 5 shows a comparative overview of the statistical analysis of all used models employed in the kinetics analysis of the tested samples (XPS and GW). A higher R2, lower F-test and a lower sum of deviation indicate a good fit model [35,48]. For XPS, similar trends were observed from the statistical analysis, where the Friedman, numerical optimisation analysis (NOA) and Vyazovkin models showed comparatively similar trends. The low mean residual was obtained from Firedman and NOA model ranging between 0.544 and 0.60. For simplicity and due to available related literature, the Friedman model is selected for model development.
On the other hand, for GW, low mean residual and F-test values of 0.03 and 1, respectively, were found for the An model. The R2 value and sum of deviation value also support the statistical significance of the An model compared to other models. From the observation of curve fitting and analysis, the statistical significance of different models and the An model is used to analyse the kinetics of GW in this study.

3.3. Kinetics Analysis

Kinetics analysis used the Friedman model for XPS and the An model for GW. The kinetics parameters obtained using the abovementioned models for XPS and GW samples are listed in Table 6 and are discussed in the subsections below.

3.3.1. Extruded Polystyrene (XPS)

The kinetics triplets of XPS are calculated using Friedman model. The average activation energy, Ea, and the log A value were 159.89 kJ/mol and 9.927 (A/1/s), respectively. The predicted curves obtained from the Friedman model for the different heating rates are compared with the experimental TGA curves for XPS in Figure 9. It can be seen that the predicted curves fit well with the test curves. The XPS showed single steps reaction (Figure 9) and supported the previous literature [44,50]. The degradation process of XPS is that the reactant is heated procedurally and transformed into gaseous hydrocarbon [44]. The reaction scheme can be represented using Equation (10):
a R 1 b + g a s
where, a = initial reactant, b = product and R1 = single reaction step

3.3.2. Glass Wool (GW)

The statistical analysis allows access to the suitability of each tested model and aids in choosing the kinetic model that can be selected within a given statistical significance [35]. After statistical analysis and curve fitting (Figure 10), it was found that the three-step consecutive mechanism represents the topgallant accepted mechanism as the most probable for the pyrolysis of GW, where each step is described by the n-dimensional nucleation Avrami–Erofeev model (An) from Table 5.
The current model reaction scheme is as follows:
a R 1 b R 2 c R 3 d
The balance equation:
M a s s = m i Δ m × [ c t b .   ( a b ) × [ d ( a b ) d t ] d t + c t b . ( b c ) × [ d ( b c ) d t ] d t +                                 c t b .   ( c d ) × [ d ( c d ) d t ] d t ]
where m i is initial mass, Δ m is total mass change and c t b . is contribution.
The equations for each reaction step, considering the An model:
Reaction   step   R 1 ,   a R 1 b : d ( a b ) d t = A 1 × n 1 a [ ln ( a ) ] n 1 1 n 1 × e x p [ E A 1 R T ]
Reaction   step   R 2 ,   b R 2 c :   d ( b c ) d t = A 2 × n 2 b [ ln ( b ) ] n 2 1 n 2 × e x p [ E A 2 R T ]
Reaction   step   R 3 ,   c R 3 d :   d ( c d ) d t = A 3 × n 3 c [ ln ( c ) ] n 3 1 n 3 × e x p [ E A 3 R T ]
In the above Equations (11) to (15), d = 1-a-b-c-d = α (total conversion). In equation, R1, R2, R3 and R4 are the decomposition steps; a, b, c and d represent the concentrations in chemical model kinetics. In transformation to conversion values separated by individual steps using the consecutive mechanism, where A1, A2, A3 and EA1, EA2, EA3 represent pre-exponential factors and activation energy values related to first, second and third reaction steps, respectively; n1, n2 and n3 are the Avrami–Erofeev nucleation exponent constants. In the Avrami–Erofeev (An) model, the nucleation exponent constant is attached to the first, second and third reaction steps, where decomposition follows the chemical kinetics as step 2 follows step 1 and step 3 follow step 2.
Following the above information, the first reaction, R1, has an activation energy, Ea = 106.96 kJ/mol, log A = 6.88 (A/1/s). Therefore, it is assumed that this reaction step was due to the evaporation of humidity and the burnup of the organic binder in the range of 200–400 °C [51]. The second reaction step, R2, can result from the glass transition of the GW samples with activation energy, Ea = 89.27 kJ/mol, log A = 1.88 (A/1/s) [52]. Finally, reaction step R3 valued with Ea = 361.89 kJ/mol and log A = 16.40 (A/1/s), can be a product of the crystallisation of the samples with an endothermic effect [52].On the other hand, considering the Avrami–Erofeev exponent constant, (ni), for all steps in consecutive mechanism, the values were observed as less than the unity (ni < 1), and its variations are connected with the changes of Ea values for each reaction steps. The reaction contributions value (ci) showed that the responses decrease with the reaction steps.

3.4. Mass Loss Prediction with Different Standard Fire Curves

The mass loss of insulation materials served as an essential parameter in fire safety engineering, enabling experts to assess and understand the fire hazards associated with these materials and ultimately enhancing fire safety measures and strategies. In the case of a building fire, either the metal skin peeled off owing to structural failure and exposed the insulation materials in the cladding system, or the fire might spread through the weak channels or vents of the cladding system, such as the connections and joining of the panels [53,54]. When the fire interacts with the insulation materials of the cladding system, it spreads more quickly [55]. As a result, they undergo a process called mass loss, which refers to the reduction in their overall weight or quantity due to combustion or degradation. By measuring and analysing the mass loss of these materials during fire incidents, fire safety engineers can gain insights into the severity and progression of the fire, as well as its potential to spread and cause damage. During the primary stage of fire exposure, the insulation layer is covered by metal skins and is not exposed to air. Therefore, using Kinetics Neo software, the present study utilises the kinetics data under a nitrogen atmosphere and fits with different fire curves. In this study, TGA tests were followed by kinetics analysis of the test samples. The current simulation of mass loss is performed according to the worst-case scenario, where it is assumed that materials have the same temperature everywhere at the same time. The present study utilises the Friedman model for the XPS and An reaction model for GW. The models fit well with experimental data at different temperature conditions and were used for the mass loss modelling with standard curves [33].
Figure 11a,b from the XPS samples demonstrates a rapid mass loss of 47% at 2 min on 480 °C for both cellulosic and external fires. Additionally, during 23 min at 480 °C, rapid mass loss (50%) was observed on slow heating fire (Figure 11c). Four percent (4%) mass residue was observed for each fire curve, i.e., cellulosic, external and slow-heating fire curves.
Only 2% of the mass loss for GW in the rapid mass loss reaction phases was observed in 2 min at 440 °C for both the cellulosic and external fire curves (Figure 12a,b). In contrast, the slow heating fire curve (Figure 12c) requires 23 min to attain a mass loss of 2%. In total, 96% of the predicted mass residue for each fire curve was measured for GW.
Overall, mass loss predictions for all samples showed a consistent pattern for both cellulosic fire and external fire, with the time for maximum mass loss occurring around 2 min at a temperature of 440 °C for GW and 480 °C for XPS. A slow-heating fire had a maximum mass loss time of around 23 min. The peak temperature range at which the highest mass loss occurs in the current study could provide valuable information for refining the failure criterion of insulations in real fire scenarios.

4. Conclusions

In this work, thermo–chemical reaction stages and kinetic analyses were used to investigate and explain the thermal degradation of XPS and GW insulation materials. Model-free and model-based models have been used to obtain the kinetic parameters of the pyrolysis process. The cutting-edge kinetics software Kinetics Neo was used to create the preliminary mechanistic diagram of the pyrolysis process of the samples. Using kinetics parameters, such as activation energy, pre-exponential factor and reaction order, among others, the degradation behaviour and mass loss of cladding materials were also predicted under the different present fire curves. Finally, a framework has been provided for extracting kinetics data on the insulation materials for real-scale fire modelling. Based on the scope of this study, the following main points can be drawn:
  • GW has lower mass loss than XPS, with an average residue of 95% and 3%, respectively;
  • XPS has a single reaction step, while GW exhibits three reaction steps;
  • The Friedman model fits XPS best (R2 = 0.99966) and the An model code fits GW best (R2 = 0.99961);
  • Mass loss prediction shows consistent patterns, with a maximum mass loss around 2 min at 440 to 480 °C for cellulosic and external fires and around 23 min for slow-heating fires.
These kinetics data provide a foundation for further research on the fire behaviour of XPS and GW insulation materials in full-scale fire modelling, according to AS 5113.

Author Contributions

M.D.H. Conceptualisation, Methodology, Investigation, Writing—Original draft preparation; M.K.H. Supervision, Conceptualisation, Methodology Writing—Reviewing and Editing; S.S. Conceptualisation, Writing—Reviewing and Editing, Supervision, Project administration, Funding acquisition; A.C.Y.Y. Supervision, Writing—Reviewing and Editing; C.W. Writing—Reviewing and Editing; L.G. Resources, Writing—Reviewing and Editing; R.W. Resources, Writing—Reviewing and Editing. All authors have read and agreed to the published version of the manuscript.

Funding

The authors are grateful for the financial support from the Australian Research Council Grant (IC170100032) and Western Sydney University (P00024103).

Institutional Review Board Statement

Not applicable.

Informed Consent Statement

Not applicable.

Data Availability Statement

Data is available upon the request.

Acknowledgments

This work is funded by the Australian Research Council (ARC) Industrial Transformation Training Centre (IC170100032) and Western Sydney University (P00024103). The authors would like to acknowledge the Advanced Materials Characterisation Facility (AMCF) of Western Sydney University (WSU) and the ARC fire safety training centre, UNSW, Australia, for access to their instrumentation and help from staff. The authors sincerely appreciate all financial and technical support.

Conflicts of Interest

The authors declare no conflict of interest.

References

  1. Hossain, M.D.; Hassan, M.K.; Akl, M.; Pathirana, S.; Rahnamayiezekavat, P.; Douglas, G.; Bhat, T.; Saha, S. Fire Behaviour of Insulation Panels Commonly Used in High-Rise Buildings. Fire 2022, 5, 81. [Google Scholar] [CrossRef]
  2. Zhang, W.; Jia, J.; Zhang, J.; Ding, Y.; Zhang, J.; Lu, K.; Mao, S. Pyrolysis and combustion characteristics of typical waste thermal insulation materials. Sci. Total Environ. 2022, 834, 155484. [Google Scholar] [CrossRef] [PubMed]
  3. Egbon, B.; Tomlinson, D. Experimental investigation of longitudinal shear transfer in insulated concrete wall panels with notched insulation. J. Build. Eng. 2021, 43, 103173. [Google Scholar] [CrossRef]
  4. Awad, H.; Secchi, L.; Gül, M.; Ge, H.; Knudson, R.; Al-Hussein, M. Thermal resistance of multi-functional panels in cold-climate regions. J. Build. Eng. 2021, 33, 101838. [Google Scholar] [CrossRef]
  5. Kalhor, K.; Emaminejad, N. Qualitative and quantitative optimisation of thermal insulation materials: Insights from the market and energy codes. J. Build. Eng. 2020, 30, 101275. [Google Scholar] [CrossRef]
  6. Zhang, M.; Li, M.; Wang, Y.; Sun, J. Experimental study of thermal shrinkage and melt dripping properties of expanded polystyrene under various heat fluxes. J. Build. Eng. 2022, 60, 105179. [Google Scholar] [CrossRef]
  7. Yuan, R.; Zhang, Y.; Qiu, T.; Lu, S. Research on the effect of pyrolysis and melting on thermal insulation of glass fiber at multiple scales. J. Therm. Anal. Calorim. 2022, 147, 8009–8018. [Google Scholar] [CrossRef]
  8. BS 8414-1; Fire Performance of External Cladding Systems. Test Methods for Non-Loadbearing External Cladding Systems Applied to the Face of a Building. British Standards: London, UK, 2002.
  9. AS 5113:2016; Classification of External Walls of Buildings Based on Reaction-to-Fire Performance. Standards Australia: Sydney, Australia, 2016.
  10. Bakhtiyari, S.; Taghi-Akbari, L.; Ashtiani, M.J. Evaluation of thermal fire hazard of 10 polymeric building materials and proposing a classification method based on cone calorimeter results. Fire Mater. 2015, 39, 1–13. [Google Scholar] [CrossRef]
  11. Apte, V.B. Flammability Testing of Materials Used in Construction, Transport and Mining; Woodhead Publishing: Sawston, UK, 2006. [Google Scholar]
  12. Li, Y.; Wang, Z.; Huang, X. An exploration of equivalent scenarios for building facade fire standard tests. J. Build. Eng. 2022, 52, 104399. [Google Scholar] [CrossRef]
  13. Guillaume, E.; Fateh, T.; Schillinger, R.; Chiva, R.; Ukleja, S.; Weghorst, R. Intermediate-Scale Tests of Ventilated Facades With Aluminium-Composite Claddings. J. Phys. Conf. Ser. 2018, 1107, 032007. [Google Scholar] [CrossRef]
  14. Yuen, A.; Chen, T.; Wang, C.; Wei, W.; Kabir, I.; Vargas, J.; Chan, Q.; Kook, S.; Yeoh, G. Utilising genetic algorithm to optimise pyrolysis kinetics for fire modelling and characterisation of chitosan/graphene oxide polyurethane composites. Compos. Part B Eng. 2020, 182, 107619. [Google Scholar] [CrossRef]
  15. Nguyen, K.T.; Navaratnam, S.; Mendis, P.; Zhang, K.; Barnett, J.; Wang, H. Fire safety of composites in prefabricated buildings: From fibre reinforced polymer to textile reinforced concrete. Compos. Part B Eng. 2020, 187, 107815. [Google Scholar] [CrossRef]
  16. Oswald, D.; Moore, T.; Lockrey, S. Combustible costs! financial implications of flammable cladding for homeowners. Int. J. Hous. Policy 2022, 22, 225–250. [Google Scholar] [CrossRef]
  17. McKenna, S.T.; Jones, N.; Peck, G.; Dickens, K.; Pawelec, W.; Oradei, S.; Harris, S.; Stec, A.A.; Hull, T.R. Fire behaviour of modern façade materials–Understanding the Grenfell Tower fire. J. Hazard. Mater. 2019, 368, 115–123. [Google Scholar] [CrossRef] [PubMed]
  18. Rogaume, T. Thermal decomposition and pyrolysis of solid fuels: Objectives, challenges and modelling. Fire Saf. J. 2019, 106, 177–188. [Google Scholar] [CrossRef]
  19. Hossain, M.D.; Hassan, M.K.; Yuen, A.C.Y.; He, Y.; Saha, S.; Hittini, W. Flame behaviour, fire hazard and fire testing approach for lightweight composite claddingsA review. J. Struct. Fire Eng. 2021, 12, 257–292. [Google Scholar] [CrossRef]
  20. Jiao, L.; Xu, G.; Wang, Q.; Xu, Q.; Sun, J. Kinetics and volatile products of thermal degradation of building insulation materials. Thermochim. Acta 2012, 547, 120–125. [Google Scholar] [CrossRef]
  21. Li, A.; Zhang, W.; Zhang, J.; Ding, Y.; Zhou, R. Pyrolysis kinetic properties of thermal insulation waste extruded polystyrene by multiple thermal analysis methods. Materials 2020, 13, 5595. [Google Scholar] [CrossRef]
  22. Hidalgo, J.P.; Torero, J.L.; Welch, S. Experimental characterisation of the fire behaviour of thermal insulation materials for a performance-based design methodology. Fire Technol. 2017, 53, 1201–1232. [Google Scholar] [CrossRef] [Green Version]
  23. Livkiss, K. Fires in Narrow Construction Cavities: Fire Dynamics and Material Fire Performance. Ph.D. Thesis, Lund University, Lund, Sweden, 2020. [Google Scholar]
  24. Stec, A.A.; Hull, T.R. Assessment of the fire toxicity of building insulation materials. Energy Build. 2011, 43, 498–506. [Google Scholar] [CrossRef]
  25. Lemougna, P.N.; Yliniemi, J.; Nguyen, H.; Adesanya, E.; Tanskanen, P.; Kinnunen, P.; Roning, J.; Illikainen, M. Utilisation of glass wool waste and mine tailings in high performance building ceramics. J. Build. Eng. 2020, 31, 101383. [Google Scholar] [CrossRef]
  26. Torero, J. Flaming ignition of solid fuels. In SFPE Handbook of Fire Protection Engineering; Springer: New York, NY, USA, 2016; pp. 633–661. [Google Scholar]
  27. Liu, L.; Chen, T.B.Y.; Yuen, A.C.Y.; Doley, P.M.; Wang, C.; Lin, B.; Liang, J.; Yeoh, G.H. A systematic approach to formulate numerical kinetics for furnishing materials fire simulation with validation procedure using cone/FT-IR data. Heat Mass Transf. 2021, 1–19. [Google Scholar] [CrossRef]
  28. Rashid, M.; Chetehouna, K.; Settar, A.; Rousseau, J.; Roudaut, C.; Lemée, L.; Aboura, Z. Kinetic analysis of the thermal degradation of an intumescent fire retardant coated green biocomposite. Thermochim. Acta 2022, 711, 179211. [Google Scholar] [CrossRef]
  29. Brown, M.E.; Dollimore, D.; Galwey, A.K. Reactions in the Solid State; Elsevier: Amsterdam, The Netherlands, 1980. [Google Scholar]
  30. Vyazovkin, S.; Chrissafis, K.; Di Lorenzo, M.L.; Koga, N.; Pijolat, M.; Roduit, B.; Sbirrazzuoli, N.; Suñol, J.J. ICTAC Kinetics Committee recommendations for collecting experimental thermal analysis data for kinetic computations. Thermochim. Acta 2014, 590, 1–23. [Google Scholar] [CrossRef]
  31. Das, P.; Tiwari, P. Thermal degradation kinetics of plastics and model selection. Thermochim. Acta 2017, 654, 191–202. [Google Scholar] [CrossRef]
  32. Mortezaeikia, V.; Tavakoli, O.; Khodaparasti, M.S. A review on kinetic study approach for pyrolysis of plastic wastes using thermogravimetric analysis. J. Anal. Appl. Pyrolysis 2021, 160, 105340. [Google Scholar] [CrossRef]
  33. Vyazovkin, S.; Burnham, A.K.; Favergeon, L.; Koga, N.; Moukhina, E.; Pérez-Maqueda, L.A.; Sbirrazzuoli, N. ICTAC Kinetics Committee recommendations for analysis of multi-step kinetics. Thermochim. Acta 2020, 689, 178597. [Google Scholar] [CrossRef]
  34. NETZSCH. Model-Free (Isoconvertional) Analysis Methods in Kinetics Neo [Database on the Internet]. Available online: https://kinetics.netzsch.com/en/features/model-free-analysis (accessed on 4 July 2022).
  35. Manić, N.; Janković, B.; Dodevski, V. Model-free and model-based kinetic analysis of Poplar fluff (Populus alba) pyrolysis process under dynamic conditions. J. Therm. Anal. Calorim. 2021, 143, 3419–3438. [Google Scholar] [CrossRef]
  36. NETZSCH. Kinetics Neo. [Database on the Internet]. 2022. Available online: https://kinetics.netzsch.com/en (accessed on 4 July 2022).
  37. Di Bucchianico, A. Coefficient of determination (R2). Encycl. Stat. Qual. Reliab. 2008, 1. [Google Scholar] [CrossRef]
  38. EN 1363-2:1999; Fire Resistance Tests. Alternative and Additional Procedures. British Standards: London, UK, 1999.
  39. ISO 834-1; Fire-Resistance Tests—Elements of Building Construction—Part 1: General Requirements. ISO: Geneva, Switzerland, 1999.
  40. EN 1991-1-2; Eurocode 1: Actions on Structures—Part 1-2, General Actions—Action on structures Exposed to Fire. British Standards: London, UK, 2002; -2.
  41. Nyazika, T.; Jimenez, M.; Samyn, F.; Bourbigot, S. Pyrolysis modeling, sensitivity analysis, and optimisation techniques for combustible materials: A review. J. Fire Sci. 2019, 37, 377–433. [Google Scholar] [CrossRef]
  42. Yang, J.; Miranda, R.; Roy, C. Using the DTG curve fitting method to determine the apparent kinetic parameters of thermal decomposition of polymers. Polym. Degrad. Stab. 2001, 73, 455–461. [Google Scholar] [CrossRef]
  43. Jiang, L.; Zhang, D.; Li, M.; He, J.-J.; Gao, Z.-H.; Zhou, Y.; Sun, J.-H. Pyrolytic behavior of waste extruded polystyrene and rigid polyurethane by multi kinetics methods and Py-GC/MS. Fuel 2018, 222, 11–20. [Google Scholar] [CrossRef]
  44. Jiang, L.; Xiao, H.-H.; He, J.-J.; Sun, Q.; Gong, L.; Sun, J.-H. Application of genetic algorithm to pyrolysis of typical polymers. Fuel Process. Technol. 2015, 138, 48–55. [Google Scholar] [CrossRef]
  45. Jun, H.-C.; Oh, S.C.; Lee, H.P.; Kim, H.T. A kinetic analysis of the thermal-oxidative decomposition of expandable polystyrene. Korean J. Chem. Eng. 2006, 23, 761–766. [Google Scholar] [CrossRef]
  46. Ashraf, A.; Sattar, H.; Munir, S. A comparative applicability study of model-fitting and model-free kinetic analysis approaches to non-isothermal pyrolysis of coal and agricultural residues. Fuel 2019, 240, 326–333. [Google Scholar] [CrossRef]
  47. Kinetic Analysis—Selection of Suitable Kinetic Methods & Models by Means of Kinetics Neo Software. 2022. [Database on the Internet]. 2022. Available online: https://www.youtube.com/watch?v=tKi70BAz3z8 (accessed on 4 February 2023).
  48. Mandal, S.; Mohalik, N.K.; Ray, S.K.; Khan, A.M.; Mishra, D.; Pandey, J.K. A comparative kinetic study between TGA & DSC techniques using model-free and model-based analyses to assess spontaneous combustion propensity of Indian coals. Process Saf. Environ. Prot. 2022, 159, 1113–1126. [Google Scholar]
  49. Šimon, P.; Thomas, P.; Dubaj, T.; Cibulková, Z.; Peller, A.; Veverka, M. The mathematical incorrectness of the integral isoconversional methods in case of variable activation energy and the consequences. J. Therm. Anal. Calorim. 2014, 115, 853–859. [Google Scholar] [CrossRef]
  50. Jiao, L.-L.; Sun, J.-H. A thermal degradation study of insulation materials extruded polystyrene. Procedia Eng. 2014, 71, 622–628. [Google Scholar] [CrossRef] [Green Version]
  51. Livkiss, K.; Andres, B.; Bhargava, A.; van Hees, P. Characterization of stone wool properties for fire safety engineering calculations. J. Fire Sci. 2018, 36, 202–223. [Google Scholar] [CrossRef]
  52. Sammler, A. Comprehensive Overview of the Thermal Properties of Ceramics; NETZSCH: Selb, Germany, 2021; pp. 1–20. [Google Scholar]
  53. Khan, A.A.; Lin, S.; Huang, X.; Usmani, A. Facade fire hazards of bench-scale aluminum composite panel with flame-retardant core. Fire Technol. 2021, 59, 5–28. [Google Scholar] [CrossRef]
  54. Bisby, L.A. Grenfell Tower Inquiry: Phase 1-Final Expert Report. [Database on the Internet]. 2018. Available online: https://www.research.ed.ac.uk/en/publications/grenfell-tower-inquiry-phase-1-final-expert-report (accessed on 4 July 2022).
  55. Yuen, A.C.Y.; Chen, T.B.Y.; Li, A.; De Cachinho Cordeiro, I.M.; Liu, L.; Liu, H.; Lo, A.L.P.; Chan, Q.N.; Yeoh, G.H. Evaluating the fire risk associated with cladding panels: An overview of fire incidents, policies, and future perspective in fire standards. Fire Mater. 2021, 45, 663–689. [Google Scholar] [CrossRef]
Figure 1. Different materials of the cladding system.
Fire 06 00231 g001
Figure 2. Proposed framework for kinetics data extractions of insulation materials used in the cladding system.
Fire 06 00231 g002
Figure 3. Nominal fires evaluation temperature curve as a function of time [38].
Fire 06 00231 g003
Figure 4. SEM image (left) and EDS elemental analysis (right) of insulation materials and their chars.
Fire 06 00231 g004
Figure 5. Thermal degradation profile of XPS.
Fire 06 00231 g005
Figure 6. Thermal degradation profile of GW.
Fire 06 00231 g006
Figure 7. Comparison between the experimental and numerical fit of conversion rate curves for XPS using the Friedman and NOA model.
Fire 06 00231 g007
Figure 8. Comparison between the experimental and numerical fit of conversion rate curves for GW.
Fire 06 00231 g008
Figure 9. Numerical fit of the TGA curve for XPS using the Friedman model.
Fire 06 00231 g009
Figure 10. Numerical fit of the TGA curve for GW using the An model.
Fire 06 00231 g010
Figure 11. Mass loss of XPS under different fire profiles.
Fire 06 00231 g011
Figure 12. Mass loss of GW under different fire profiles.
Fire 06 00231 g012
Table 1. List of materials used in a typical cladding system.
Sample CodeMaterial Typesb (mm)ρ (kg/m3)k (W/mK)CP (Jg−1 K−1)Ref.
XPSExtruded polystyrene25280.0251.712[1]
GWGlass wool30450.0320.855[7]
b = Thickness, ρ = Density, k = Thermal conductivity, and CP = Specific heat.
Table 2. List of iso-conversional models considered to study the kinetics [33].
MethodsExpressionTypes
Friedman (FR) ln ( β d α d t ) = ln [ A f ( α ) ] E R T Differential
Ozawa–Flynn–Wall (OFW) ln ( β ) = ln ( A E R ln ( 1 α ) ) 5.331 1.052 E R T Integral
Kissinger–Akahira–Sunose (KAS) ln ( β T 2 ) = ln ( A R E ln ( 1 α ) ) E R T Integral
Vyazovkin (VA) Φ ( E a ) = i = 1 n j 1 n J ( E a , T i ( t α ) J ( E a , T j ( t α )
Where J ( E a , T i ( t α ) = t α Δ α t α e x p [ E a R T i ( t ) ] d t
Integral
Table 3. Model-based reaction types and corresponding reaction equations considered [36].
Code FunctionType of Reaction
Fn f = ( 1 α ) n Reaction of nth order
Cn f = ( 1 α ) n · ( 1 + Kcat · α )Reaction of nth order with autocatalysis by product
Cnm f = ( 1 α ) n · ( 1 + Kcat · α m )Reaction of nth order with m-Power autocatalysis by product
An f = n ( 1 α ) · [ ln ( 1 α ) ] n 1 n n-dimensional nucleation according to Avrami−Erofeev
KS Reaction   rate = A · ( 1 α ) n [ exp ( E R T ) + K c a t · α m · exp ( E 2 R T ) ] Kamal–Sourur equation
Table 4. Thermal analysis at different heat rates: Onset (To), end (Te) and peak degradation temperature (Tp).
Material Temperature Range (°C)β (K/min)To (°C)Te (°C)Mass Residual %
R1R2
XPS25–6005390408-4303.32
XPS25–60010390418-4533.63
XPS25–60015407428-4602.48
XPS25–60020411435-4692.42
GW25–1000524229574581995.12
GW25–10001024630075082095.48
GW25–10001525632075487795.89
GW25–10002026033577598695.45
To = Onset temperature; Tp = Peak temperature; Te = End temperature, R = reaction steps, β = Heating rate.
Table 5. Comparative statistical analysis results of different models.
Material Types of MethodModel/CodeR2Sum of Deviated SquaresMean Residual F-Test
Glass wool (GW)Model-basedAn0.999611.300.031.00
Cn0.998704.330.063.35
Cnm0.998913.640.052.82
Fn0.998744.220.063.26
KS0.999481.730.041.35
XPS Model-freeFriedman0.99981781.800.60α
NOA 0.99985626.8560.544α
OFW0.9973410,861.582.024α
Vyazovkin0.999551854.160.885α
Here, α = infinity number, NaN = not a number.
Table 6. Kinetics parameters of different cladding materials under an inert atmosphere.
MaterialModelEa (kJ/mol)log A (A/1/s)nici
Glass wool (GW)AnR1 = 106.96R1 = 6.88R1 = 0.33R1 = 0.47
R2 = 89.27R2 = 1.88R2 = 0.27R2 = 0.31
R3 = 361.89R3 = 16.40R3 = 0.06R3 = 0.22
XPS FriedmanR1 = 159.89R1 = 9.927--
Ea = Activation energy, A = pre-exponential factor, Ri = Reaction rate, ni = Avrami–Erofeev constant, ci = Contribution, and i = 1, 2, 34.
Disclaimer/Publisher’s Note: The statements, opinions and data contained in all publications are solely those of the individual author(s) and contributor(s) and not of MDPI and/or the editor(s). MDPI and/or the editor(s) disclaim responsibility for any injury to people or property resulting from any ideas, methods, instructions or products referred to in the content.

