
Fire Egress System Optimization of High-Rise Teaching Building Based on Simulation and Machine Learning

Abstract
:1. Introduction
1.1. Background
1.2. Literature Review
1.3. Scientific Originality
1.4. Aim of This Work
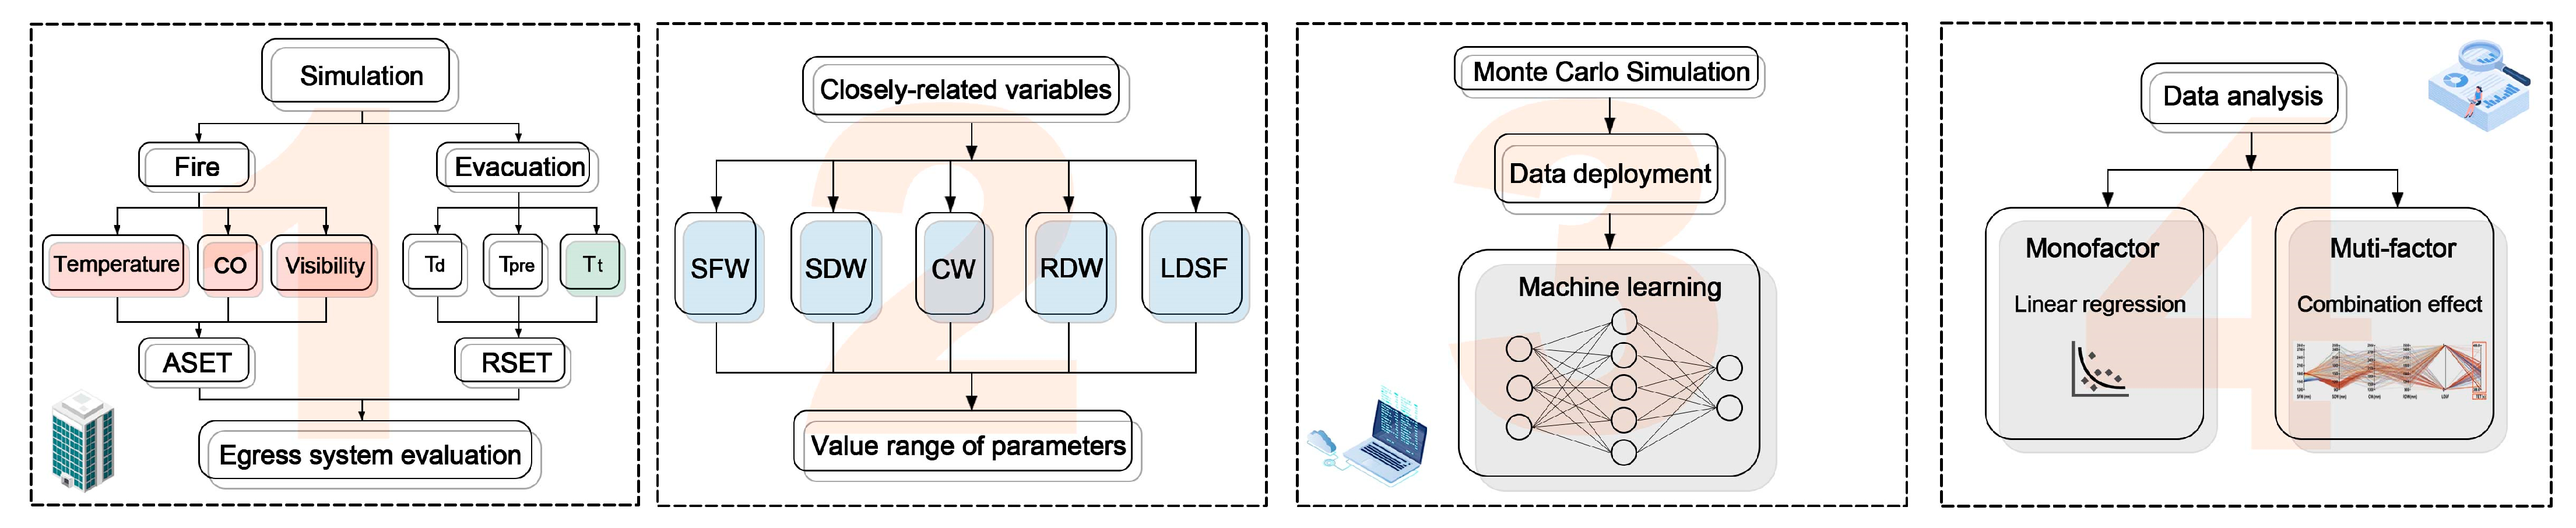
2. Research Methodology
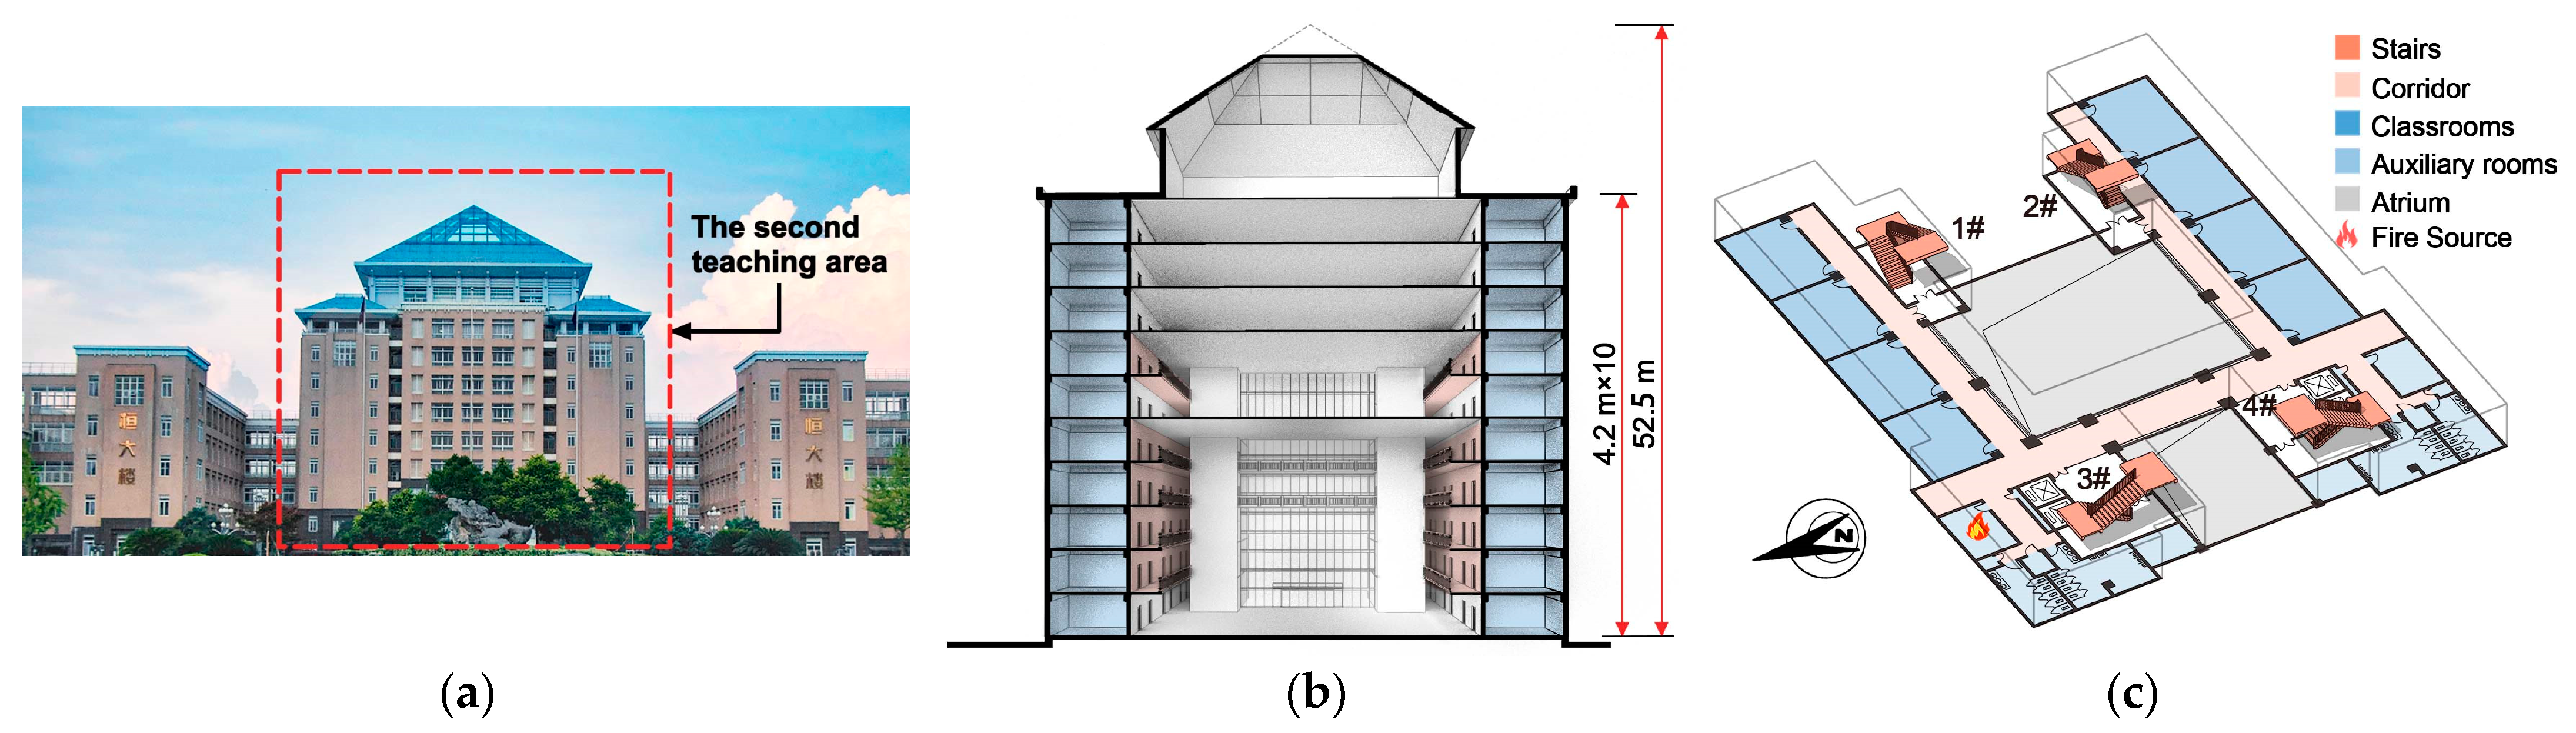
2.1. Study Building Specification
2.2. Indicators for Evaluations of the Building Egress System
2.2.1. Criterion for Evaluation of the ASET
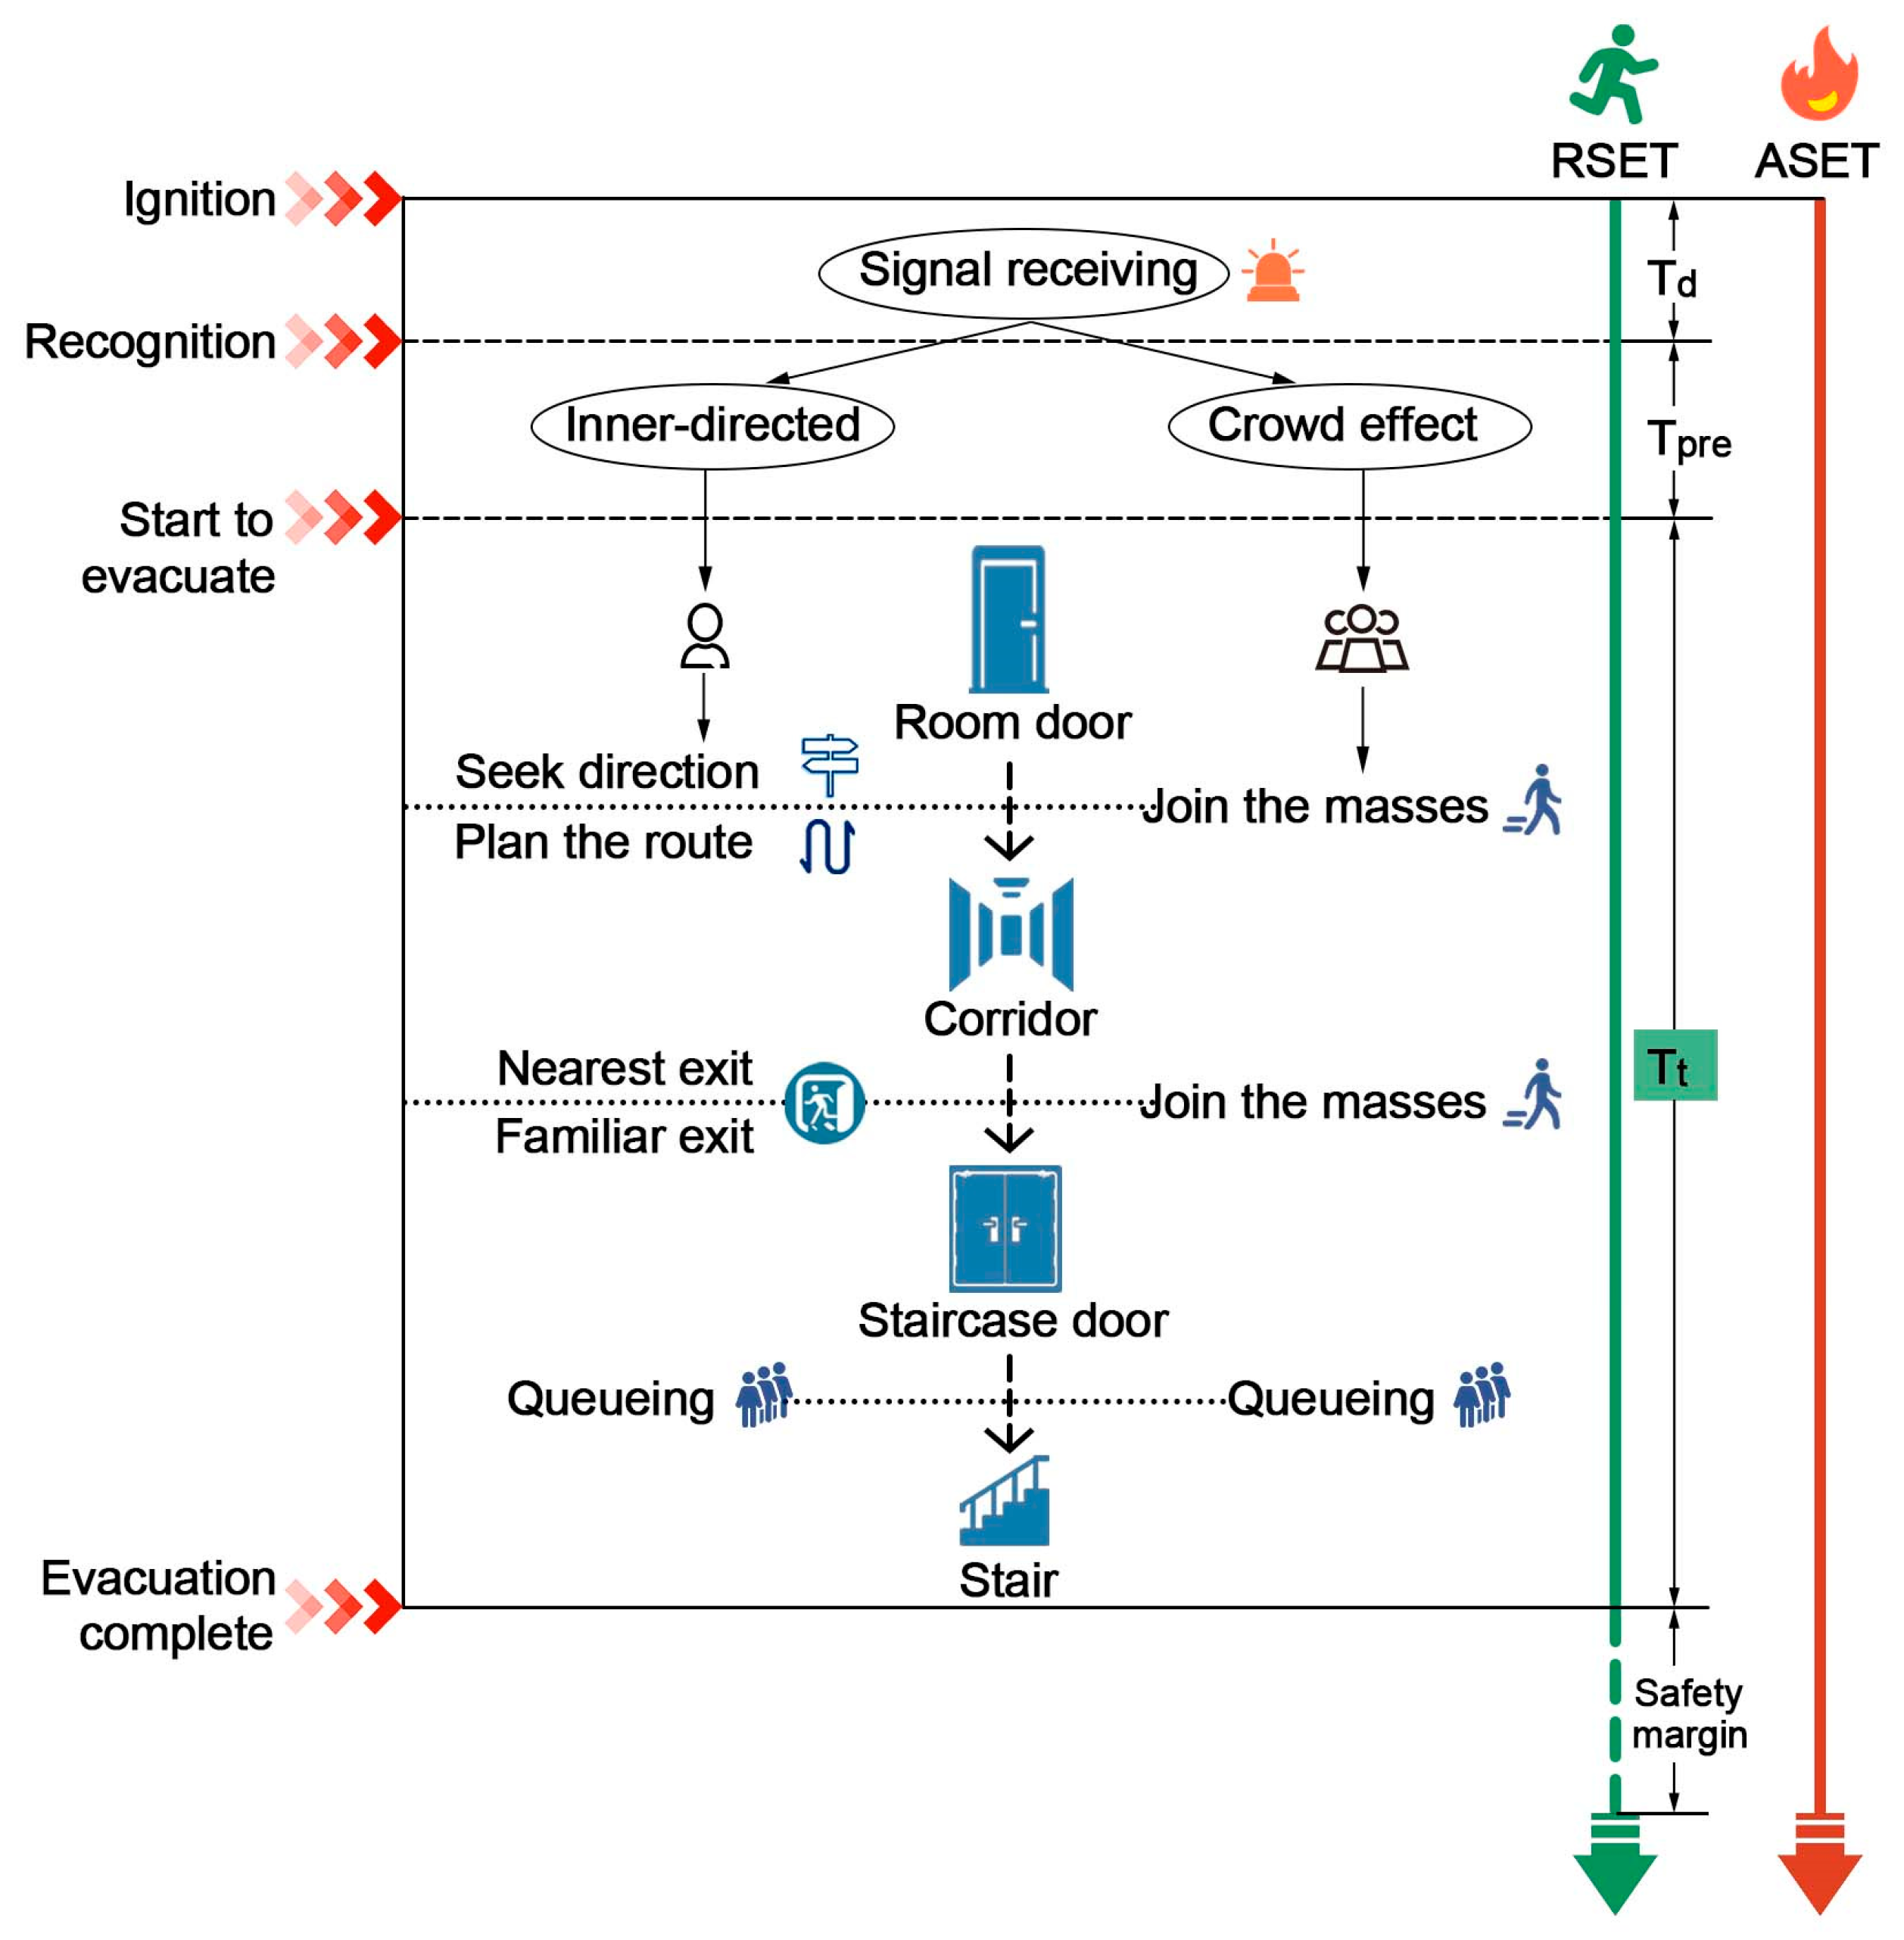
2.2.2. Criterion for Evaluation of the RSET
- The speed of evacuating people decelerates when passing through obstructions such as stairs, with a certain acceleration maintained in areas with low density of passenger flow:where is the evacuees’ starting velocity (m/s), is the evacuees’ maximum velocity (m/s), k is the impact factor, D is the density of evacuees’, (per/), is the maximum acceleration (m/), and t is the acceleration time (s).
- 2.
- Directional selection weights during evacuation:where ω represents the significance of the chosen evacuation direction, and θ represents the angle between all possible evacuation directions and the curve tangent of the software-planned path.
- 3.
- The speed and acceleration vectors in the direction of evacuation with the least probability of path selection:where is the speed of vector in the present evacuation direction (m/s), is the longest forward distance in the present evacuation direction (m), is the smallest acceleration-affected distance in the present evacuation direction (m), is the least important evacuation direction, is the least valued velocity vector in the evacuation direction (m/s), and is the least influenced acceleration vector in the evacuation direction (m/s2).
- 4.
- The speed and place of evacuees travelling to the next location:where is the speed of the evacuees when they reach the next location, is the next location, is the present location, and is the duration.
2.3. Determination of Main Independent Variables
2.4. Data Deployment and Preference of Machine Learning Algorithms
2.4.1. Preferential Selection of Algorithms
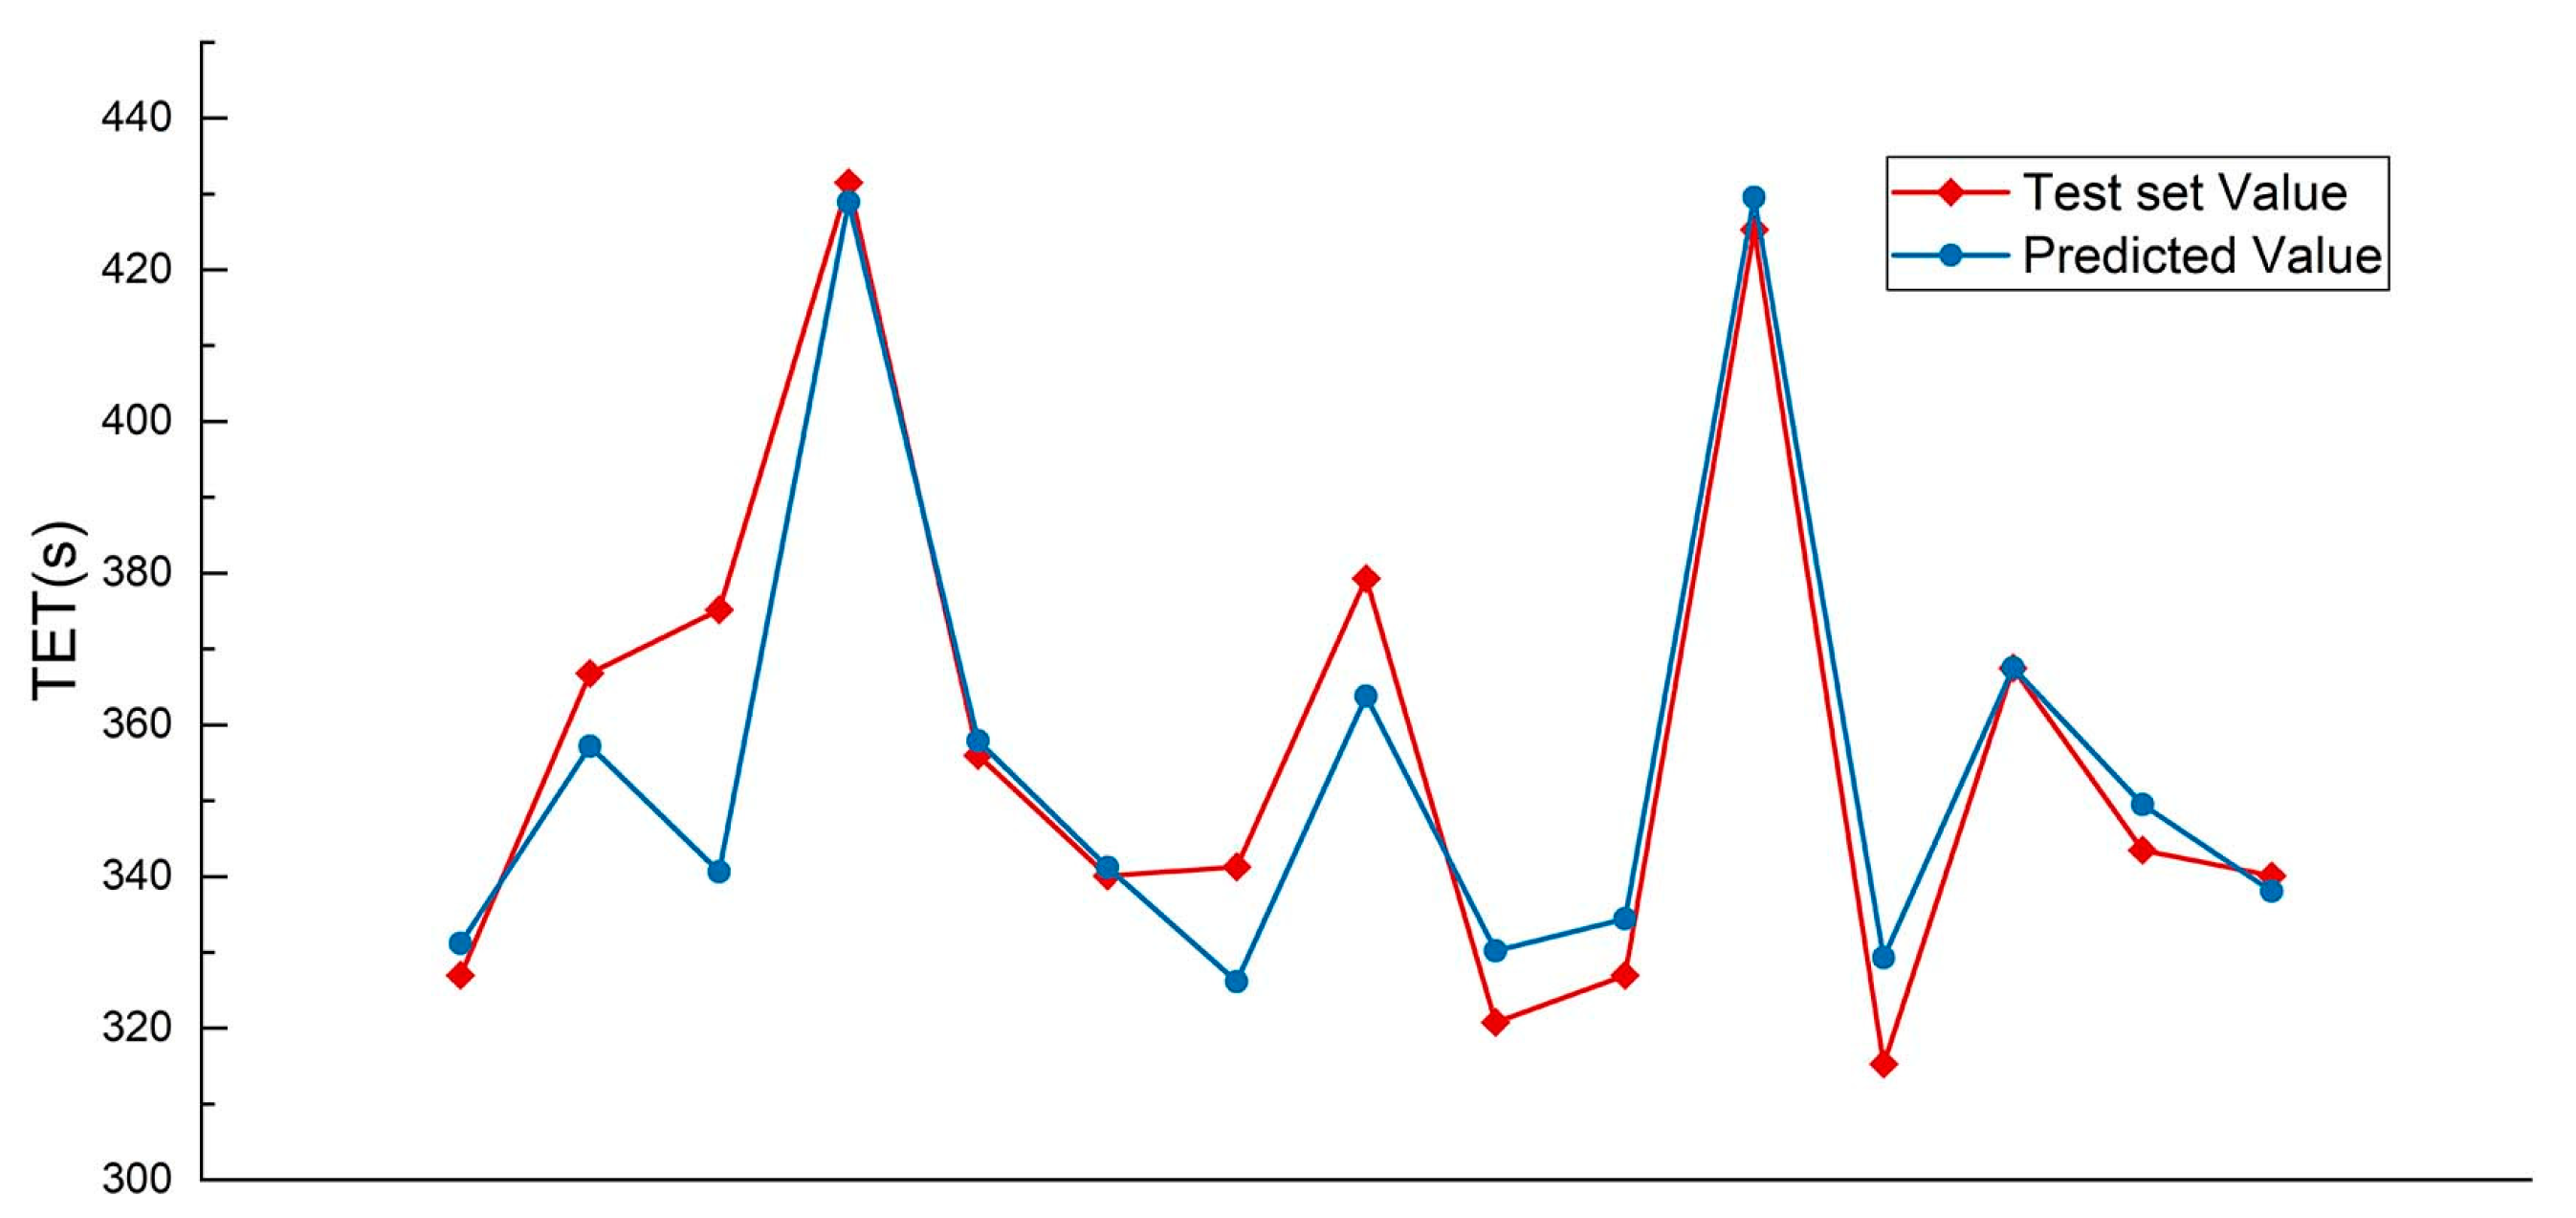
2.4.2. Parameter Combinations and Results Prediction
2.5. Statistical Method
3. Results and Discussion
3.1. Results of the Simulation
3.1.1. Determining ASET: Simulating Fire Scenarios with Pyrosim
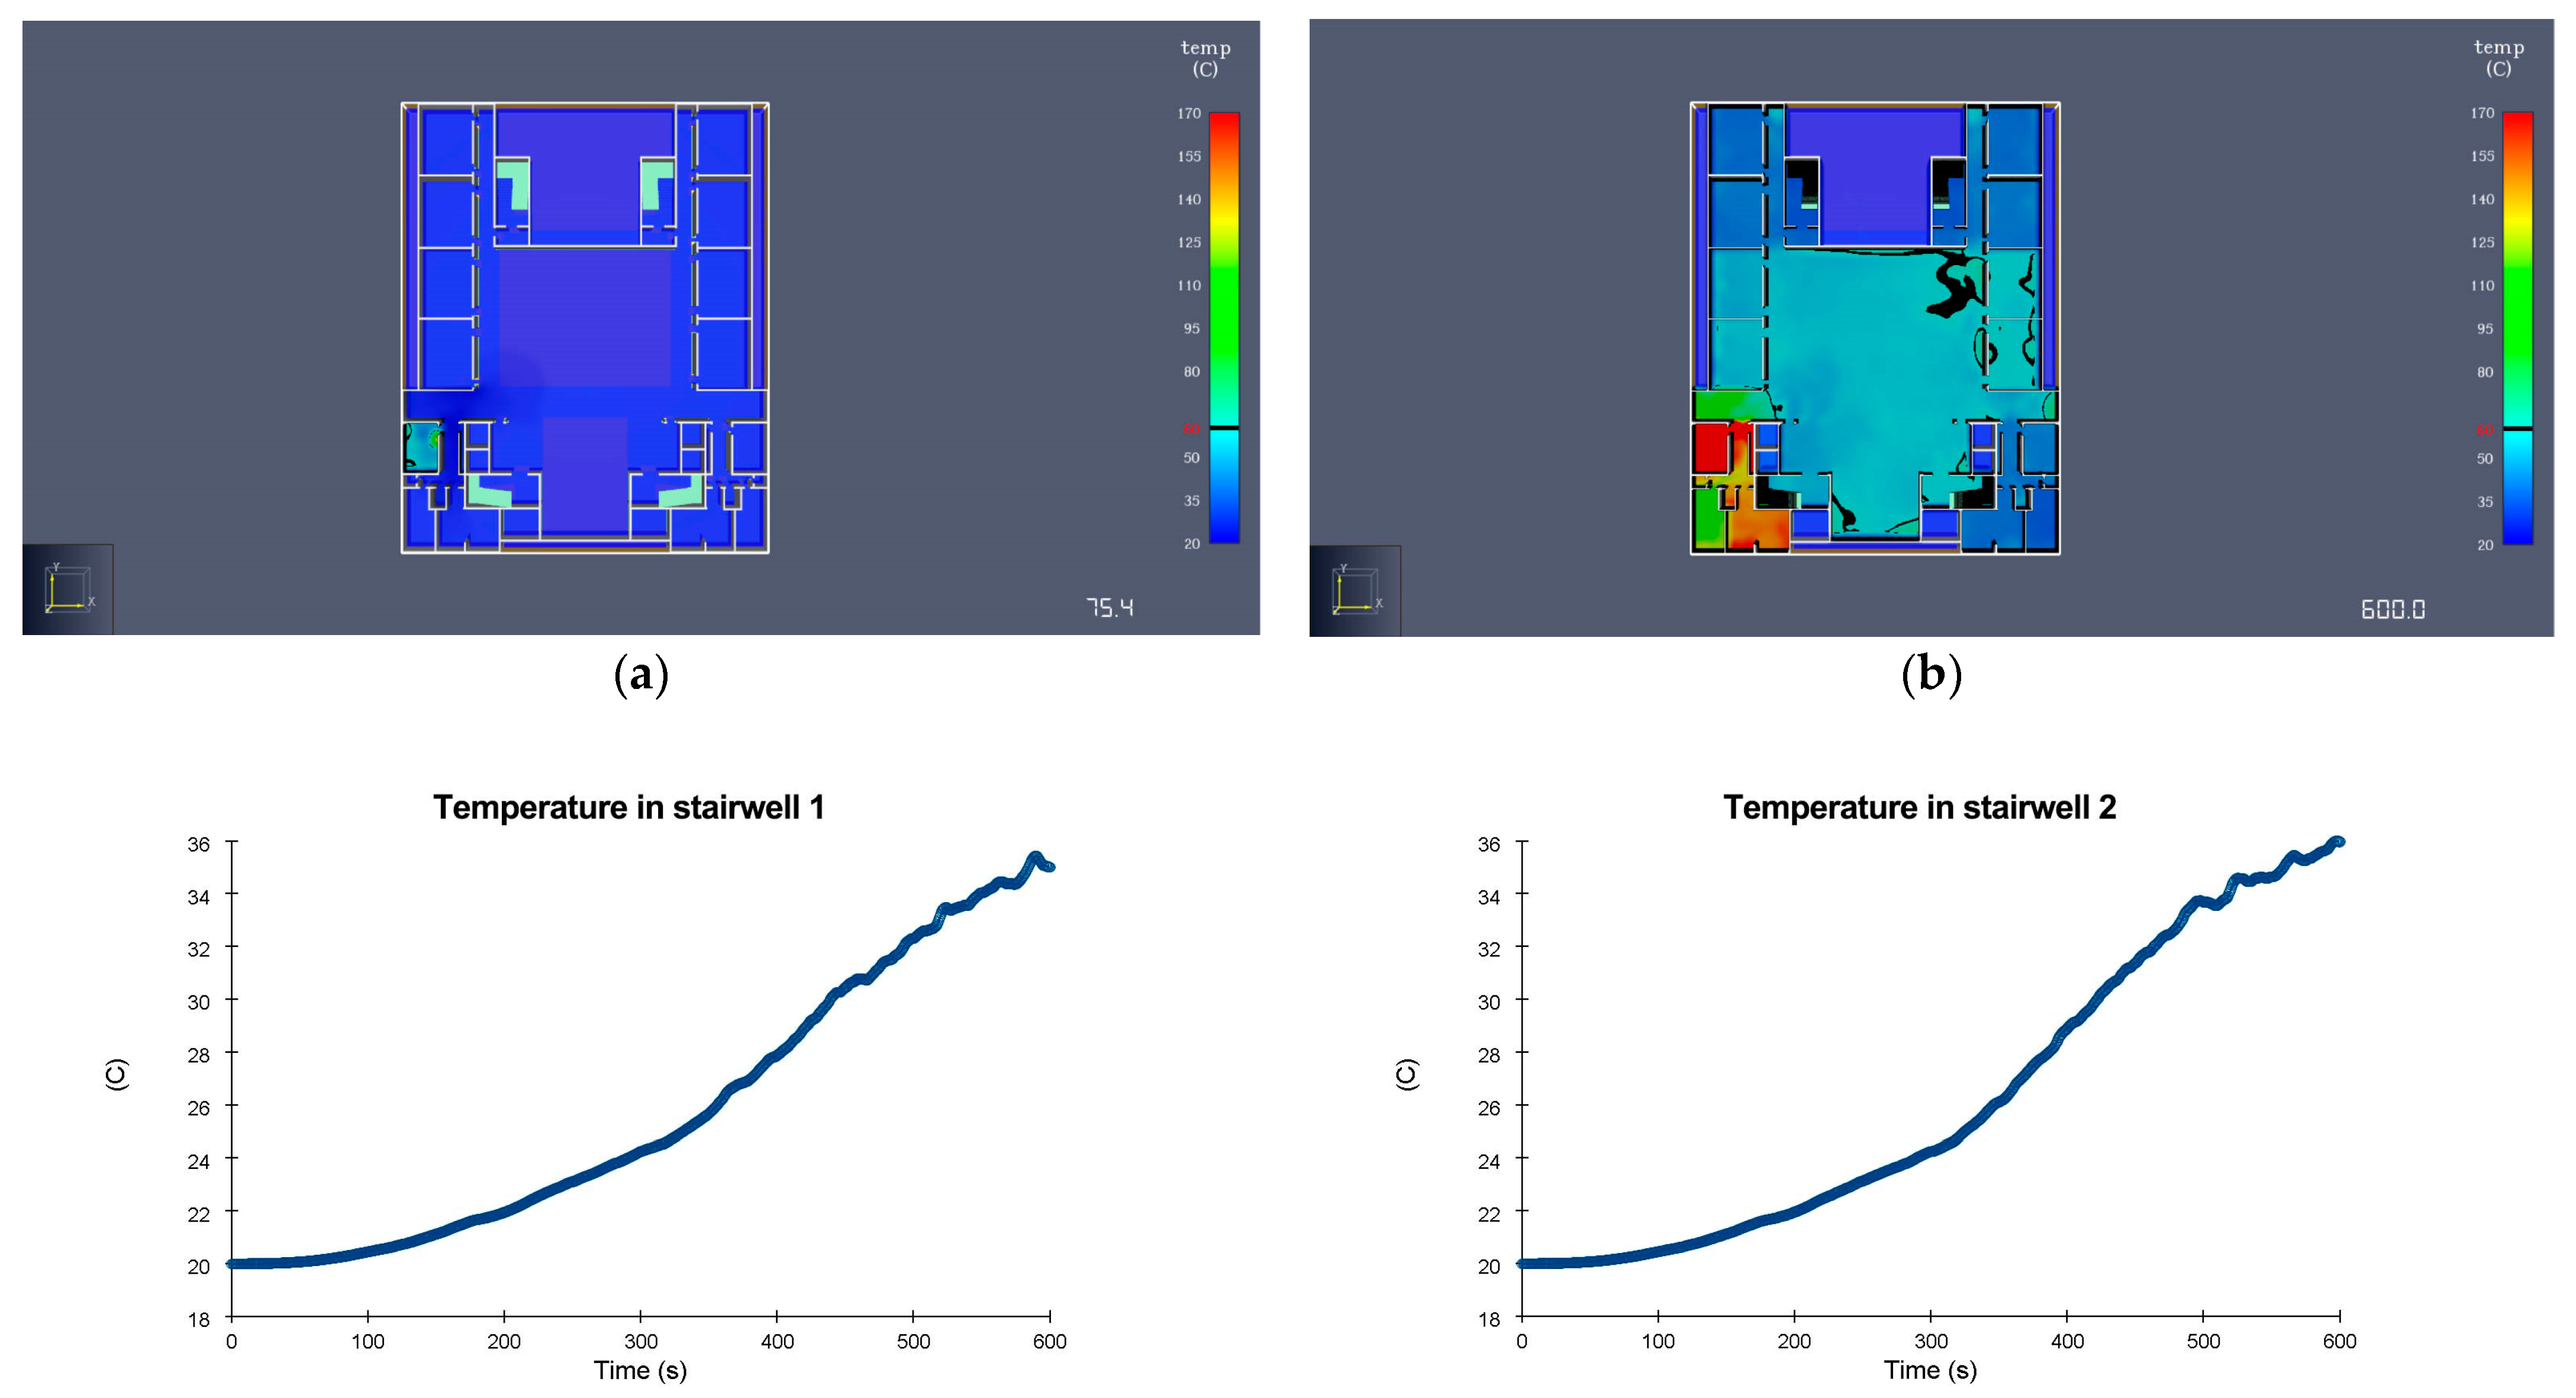
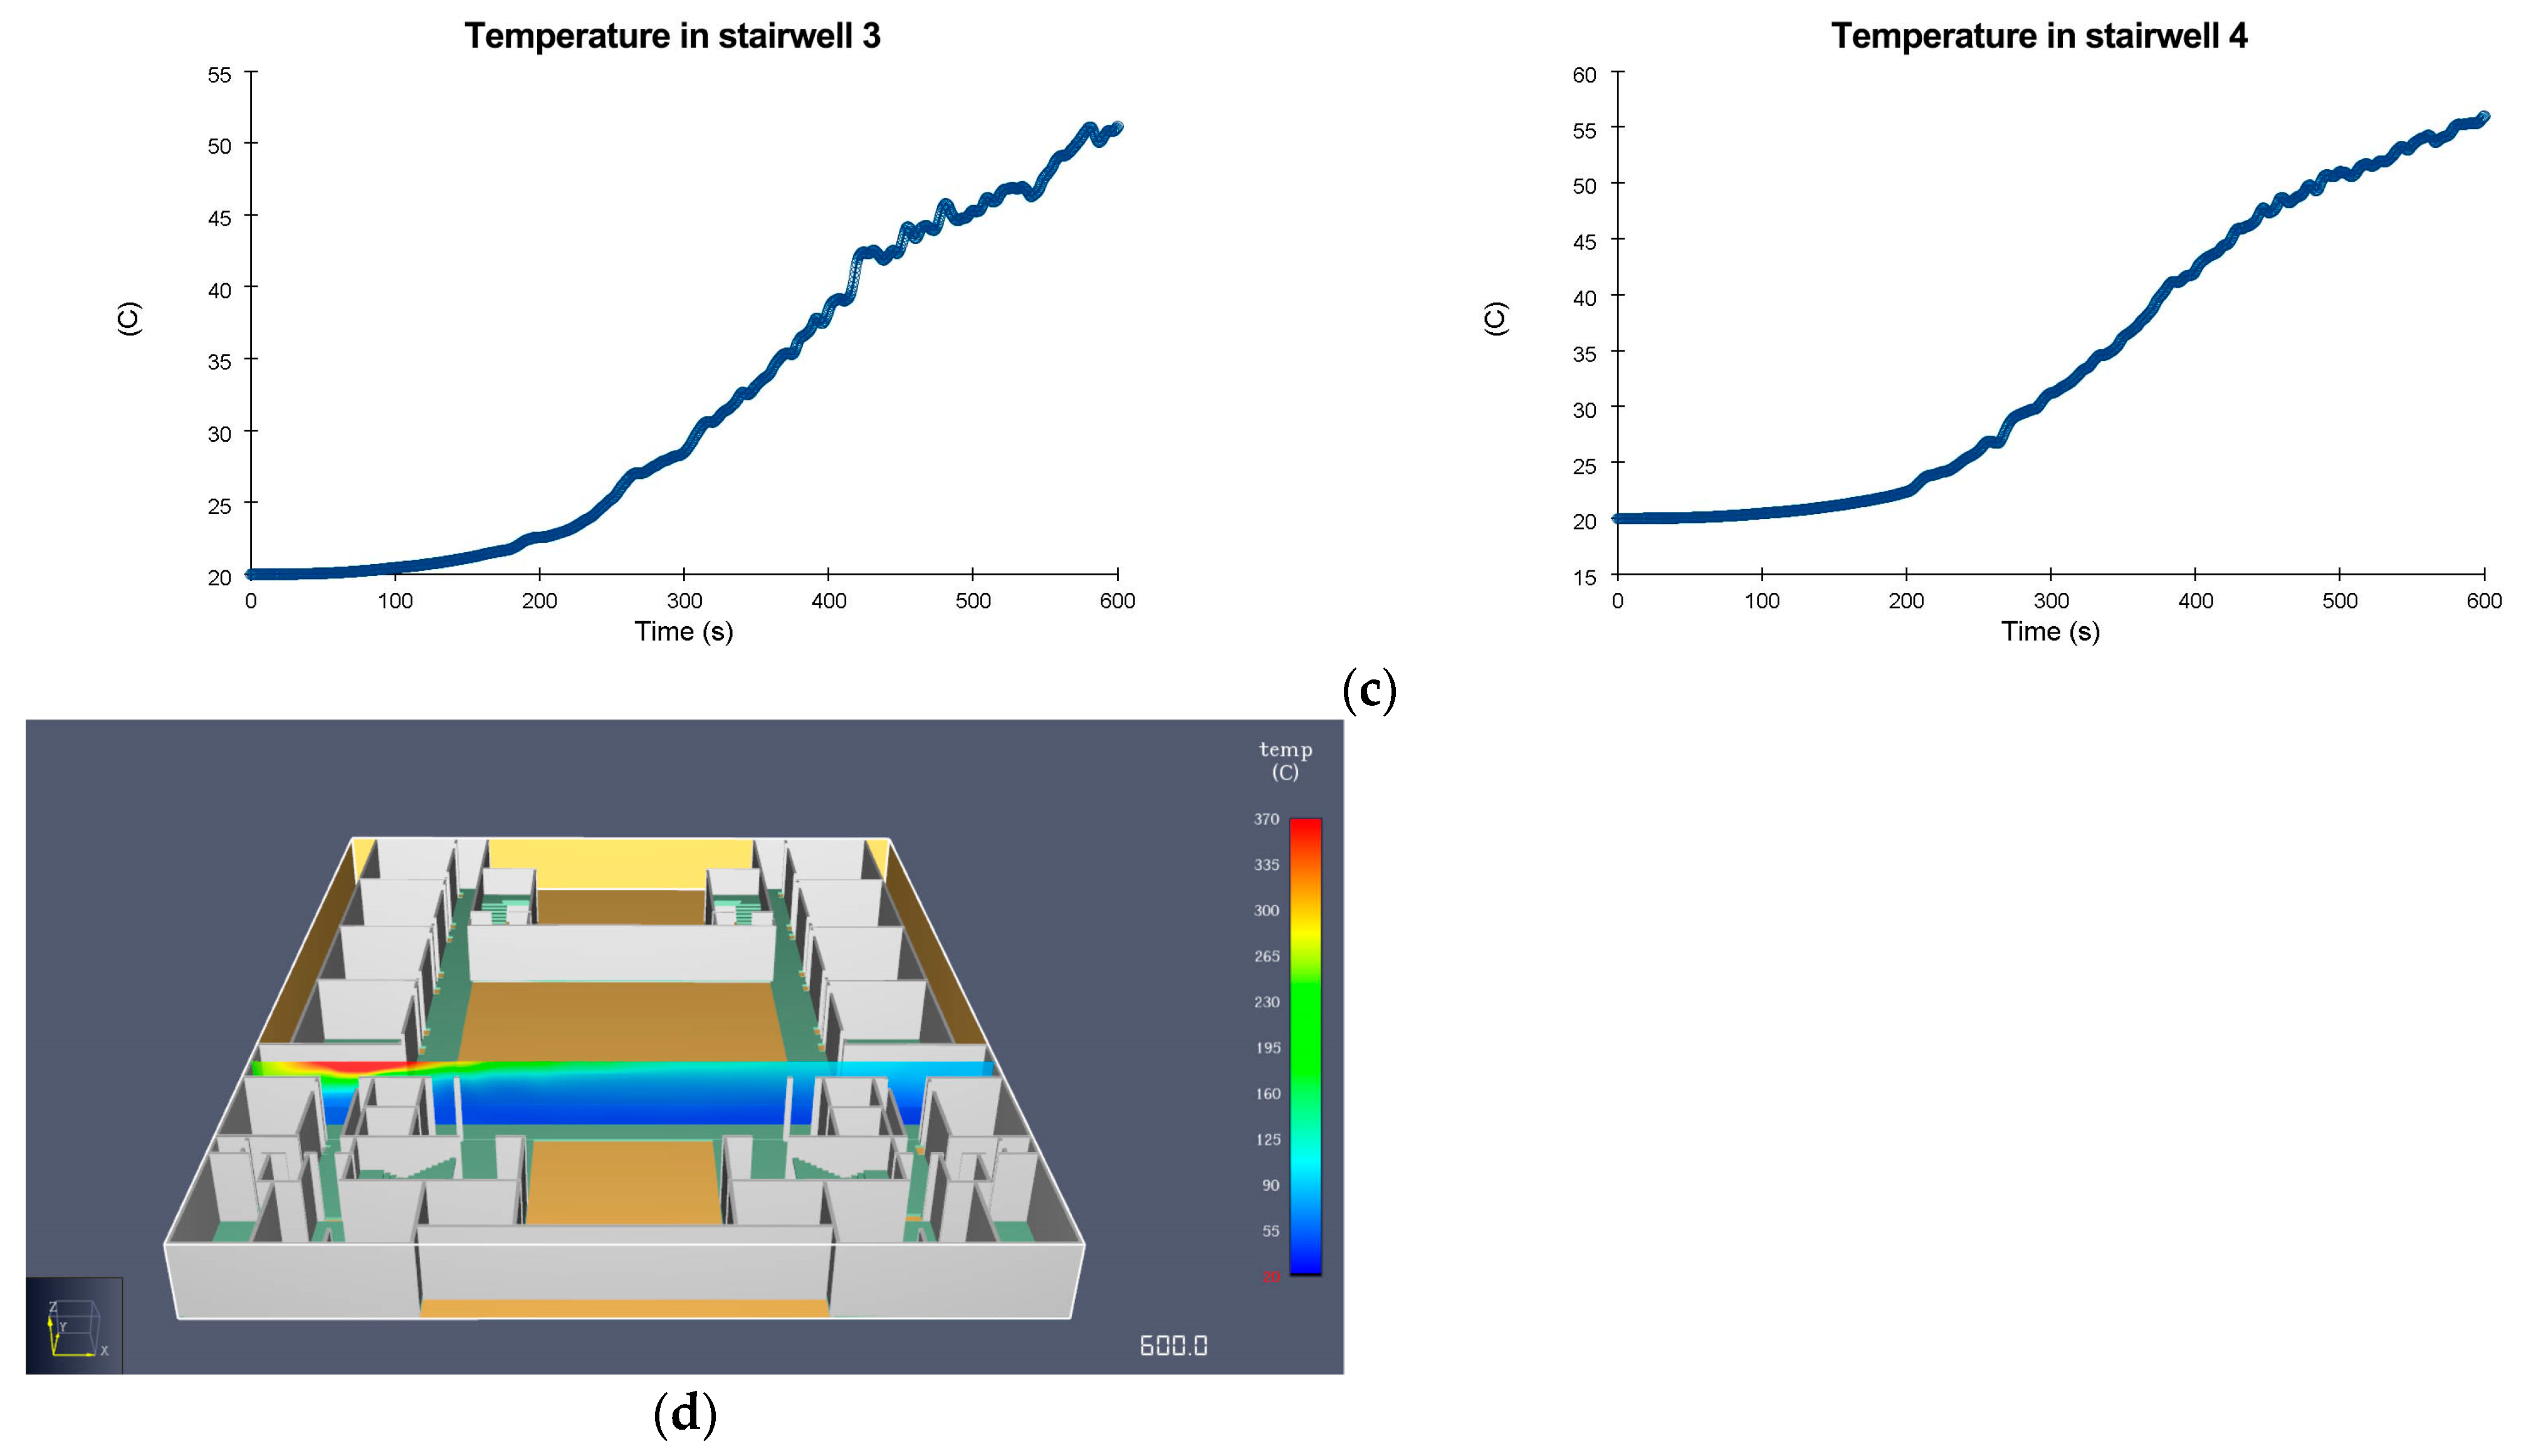
- Temperature analysis
- 2.
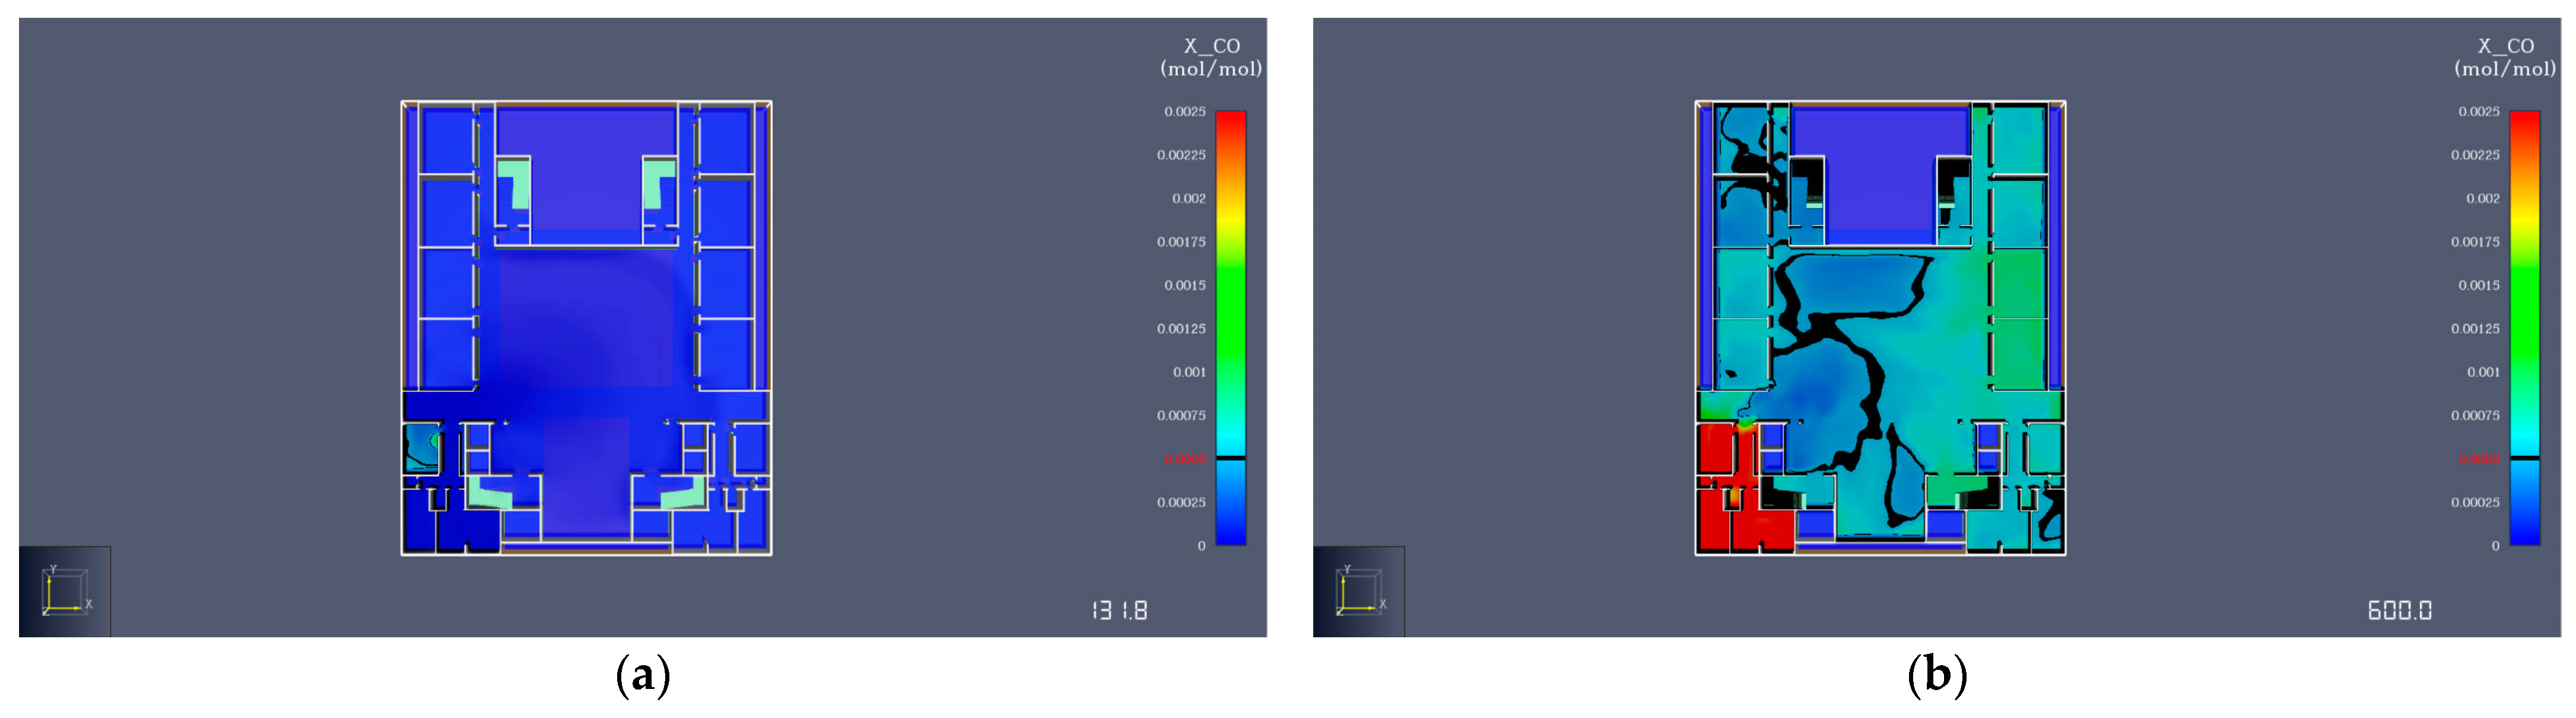
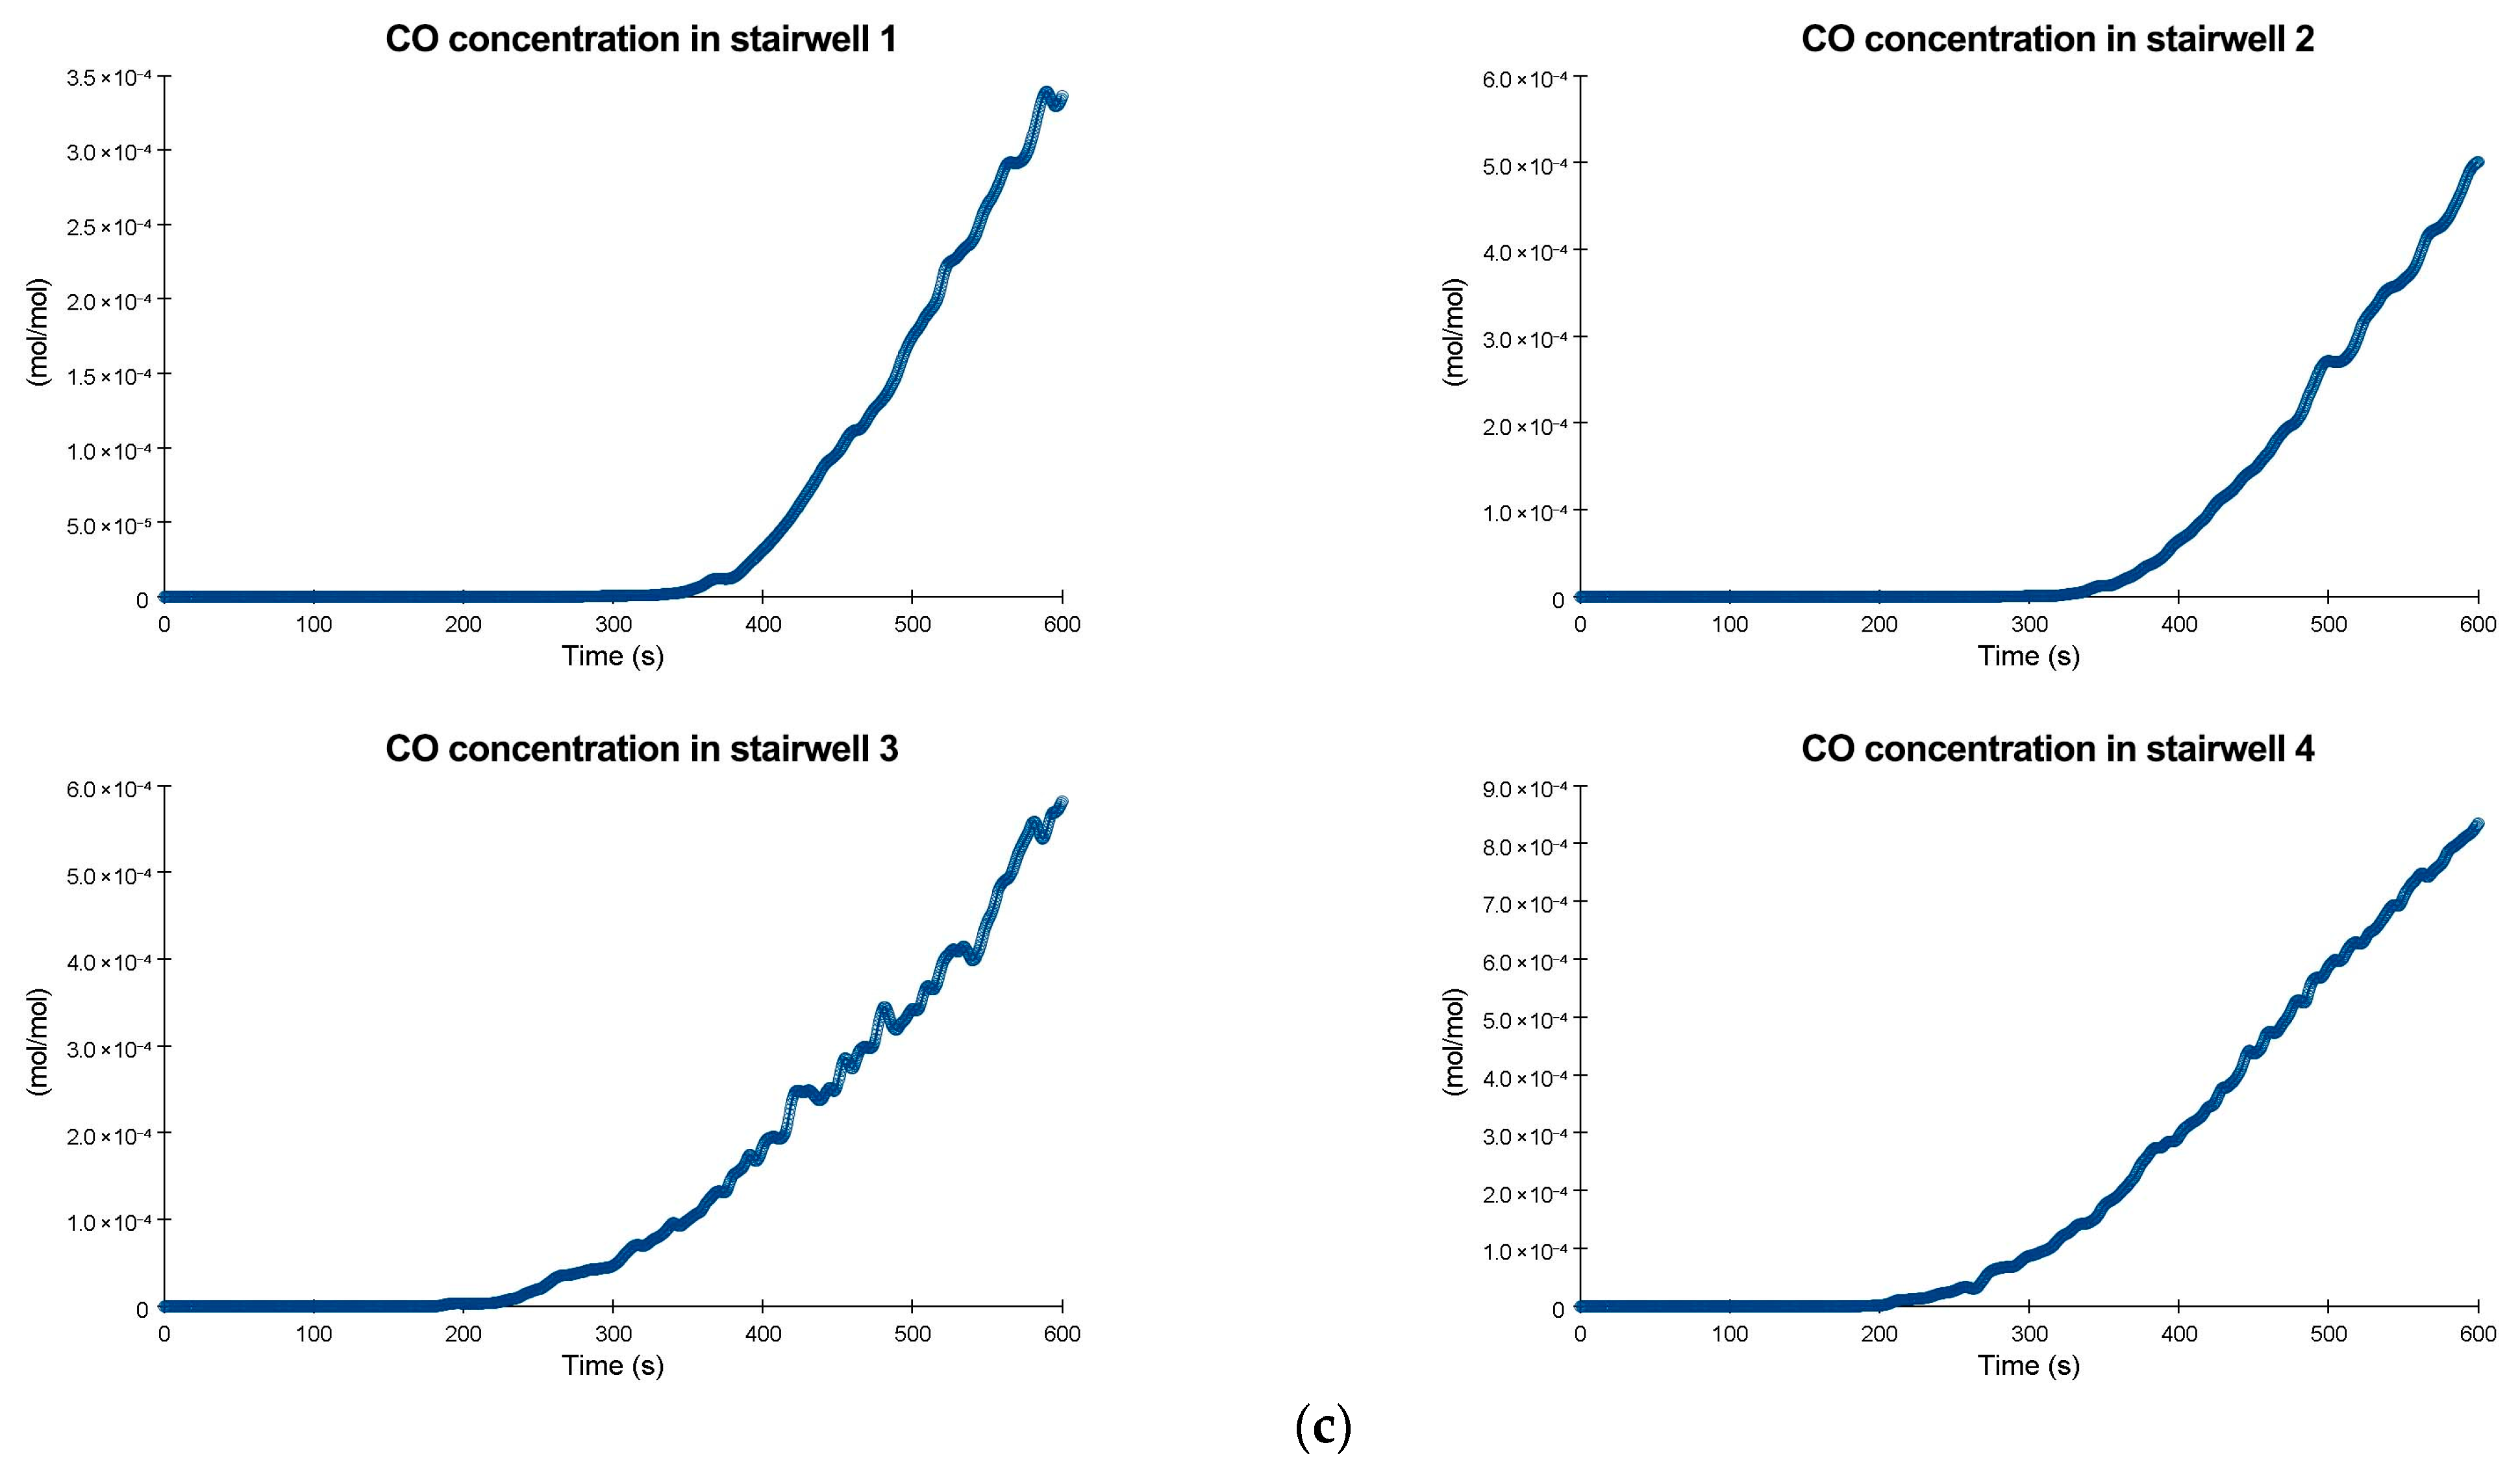
- CO concentration analysis
- 3.
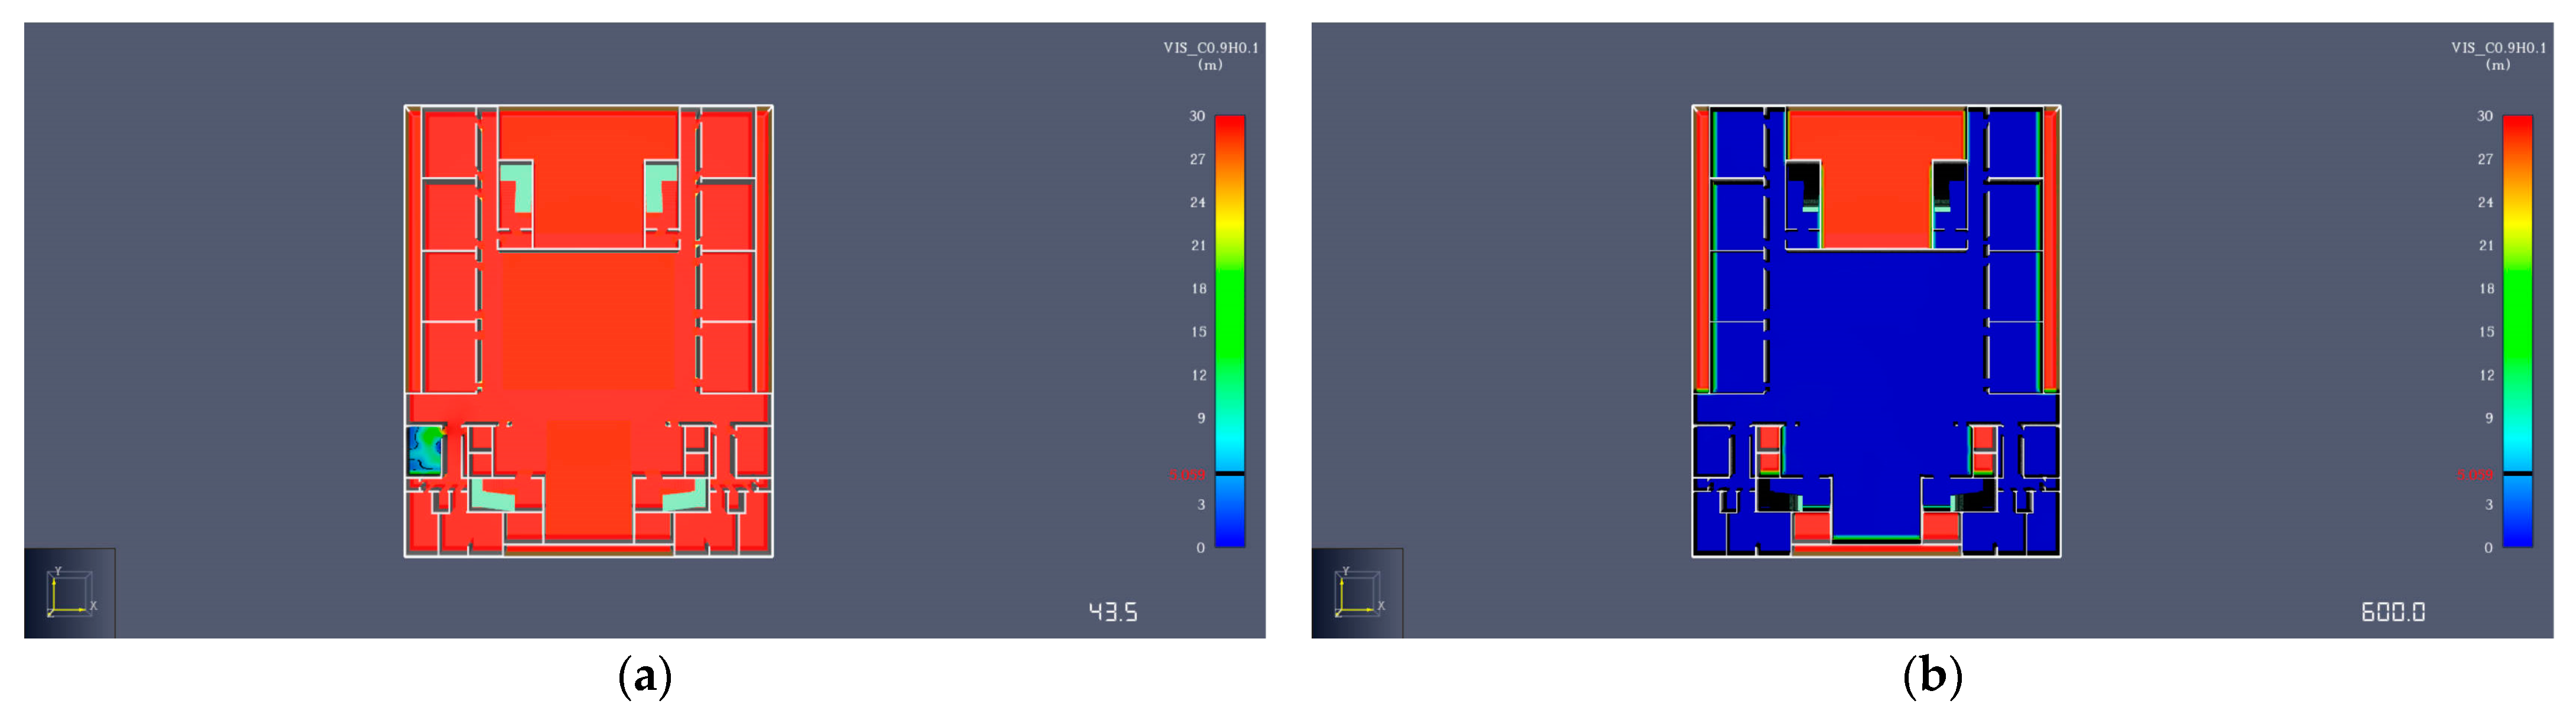
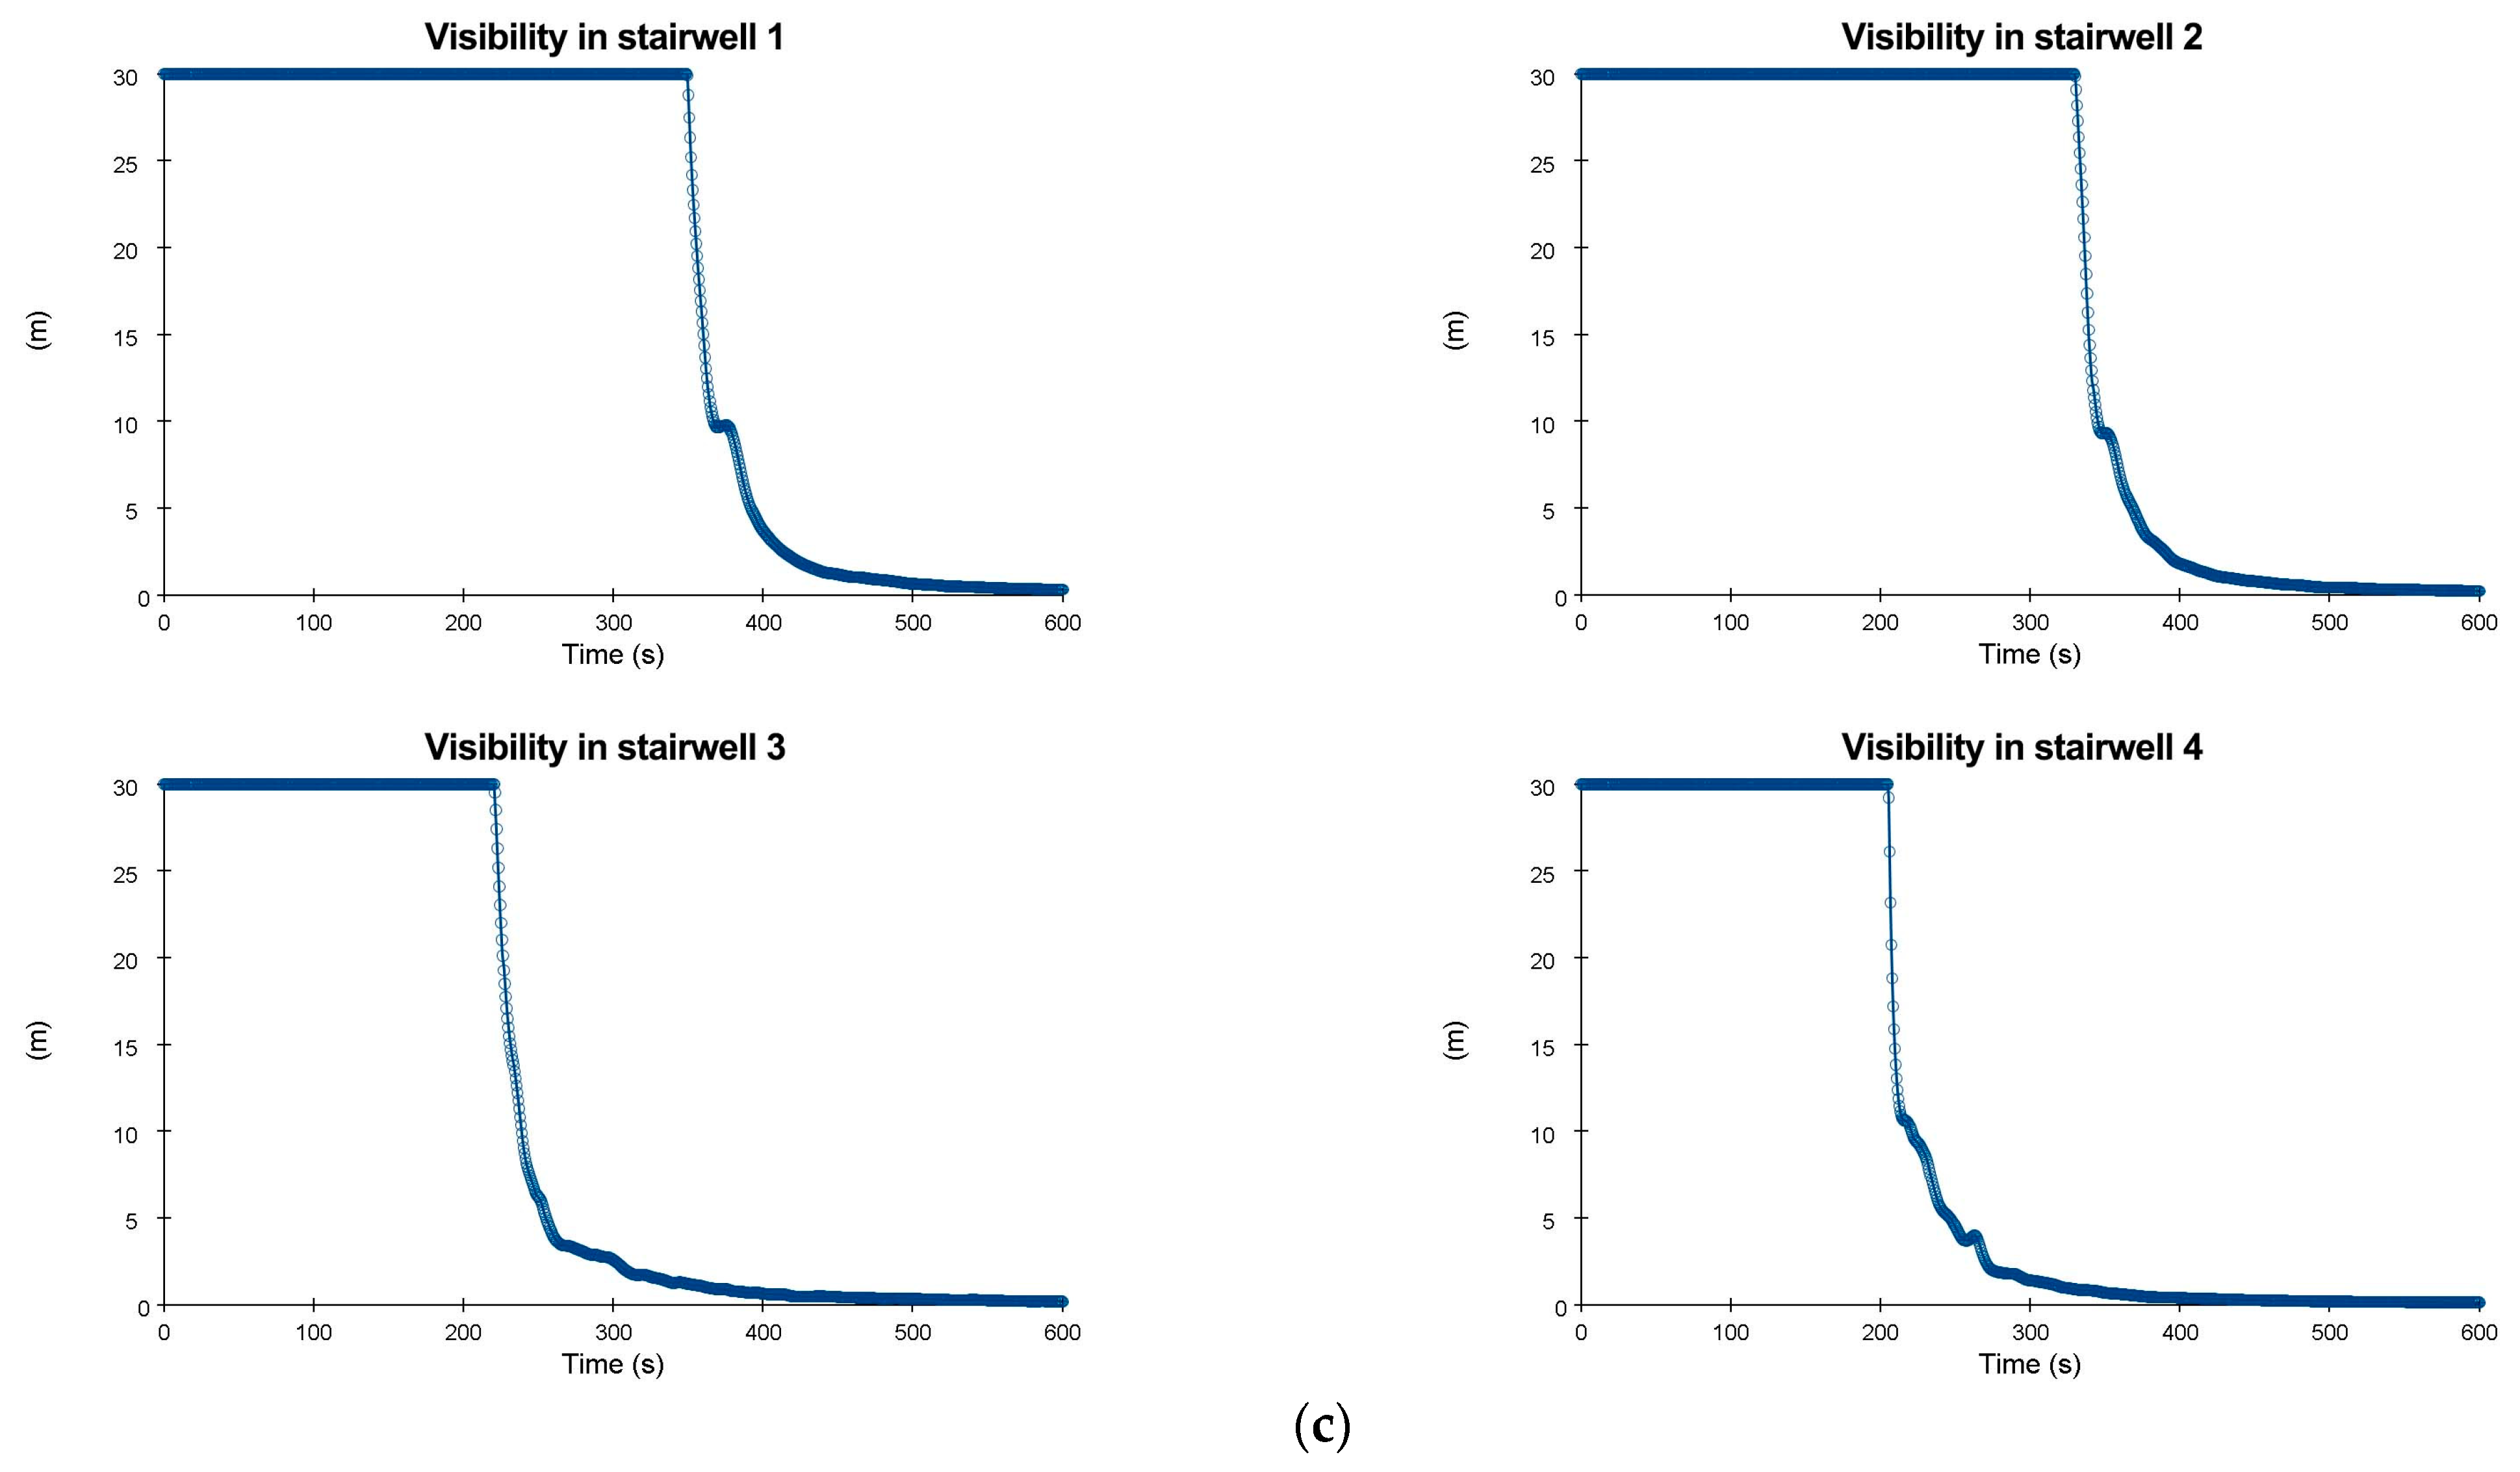
- Visibility analysis
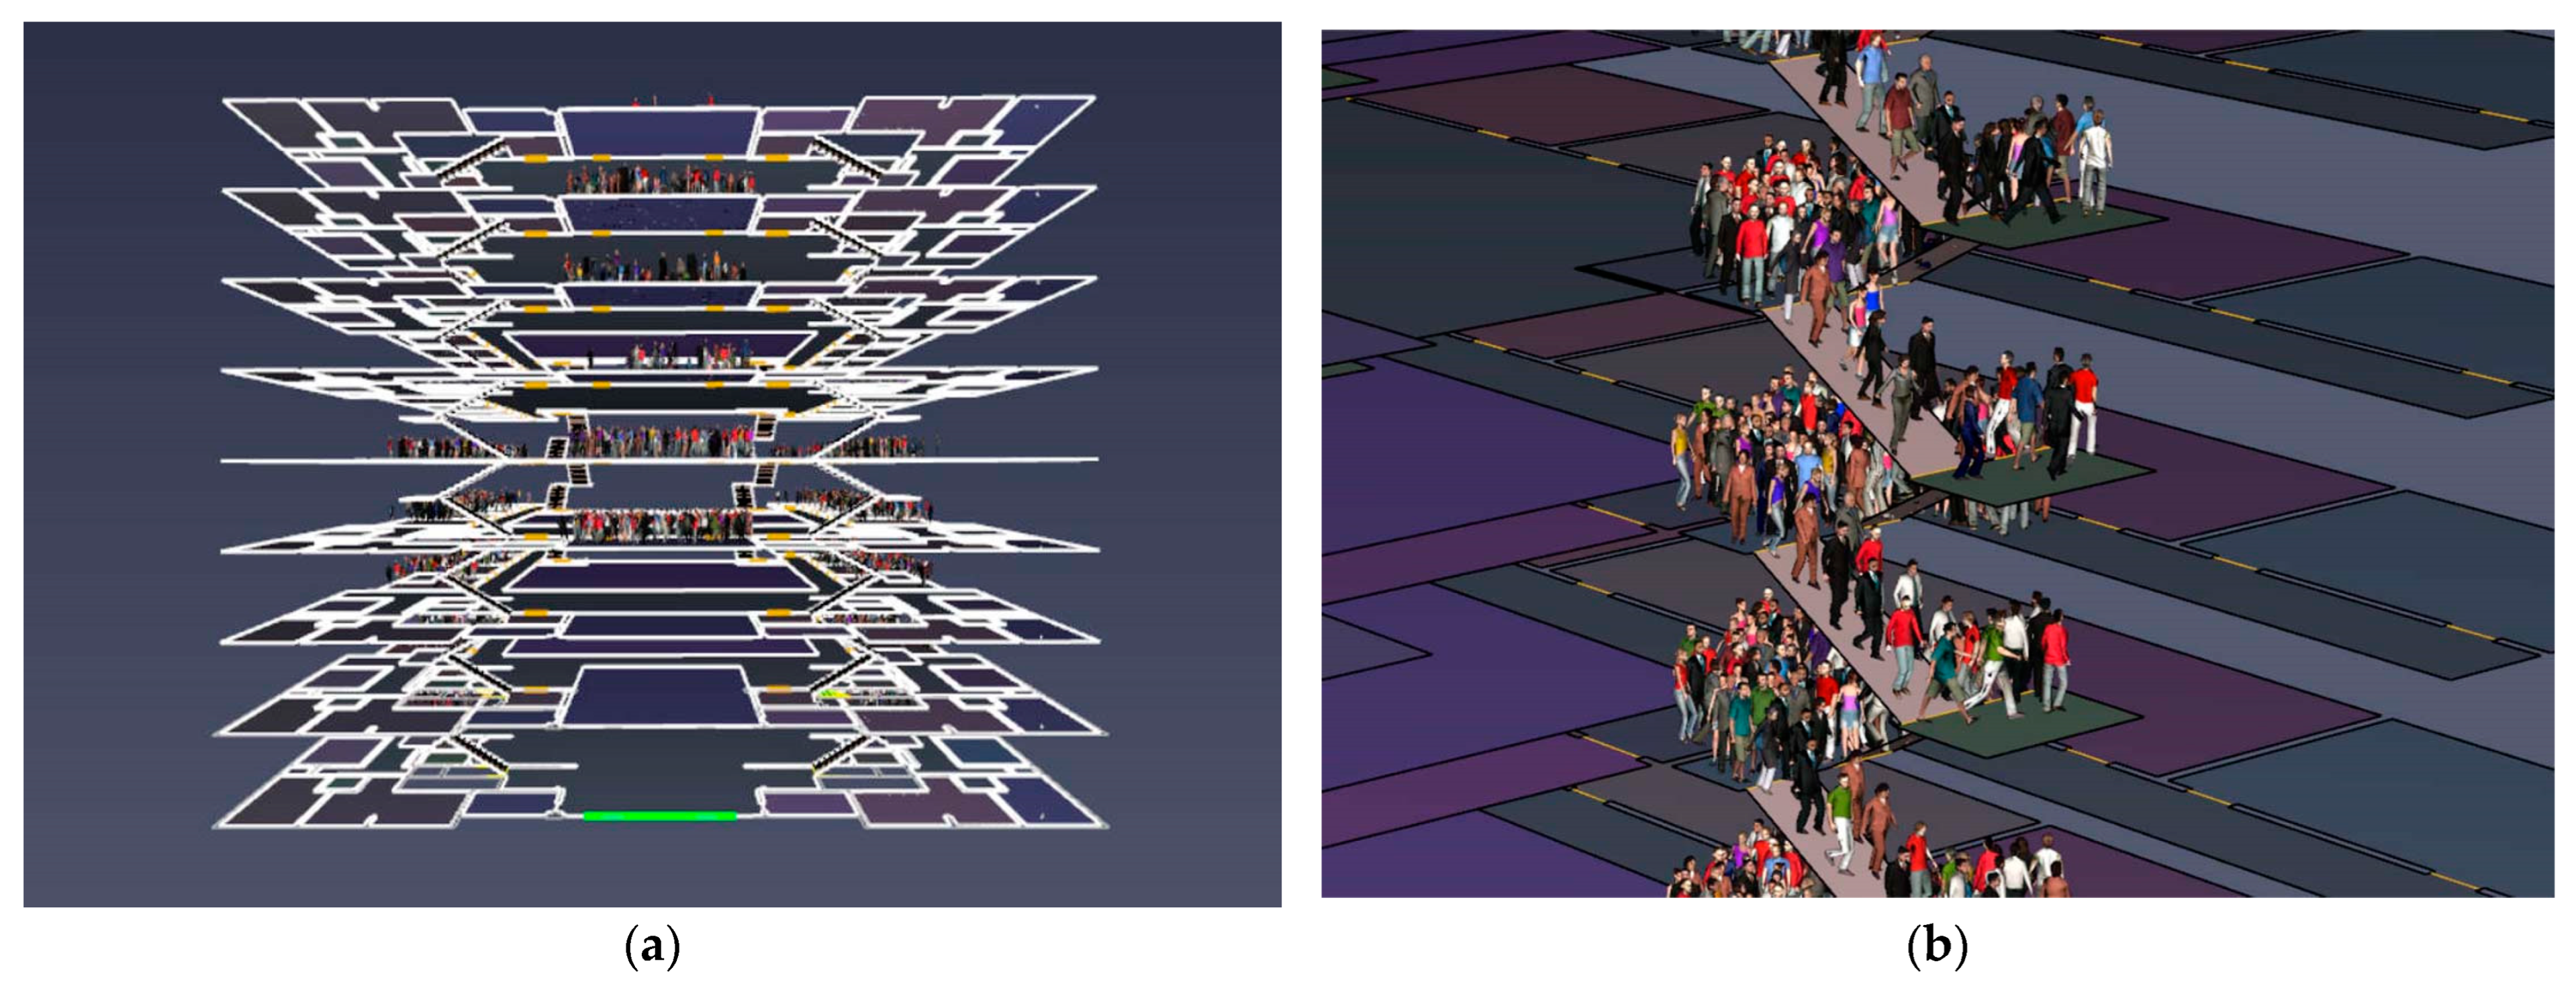
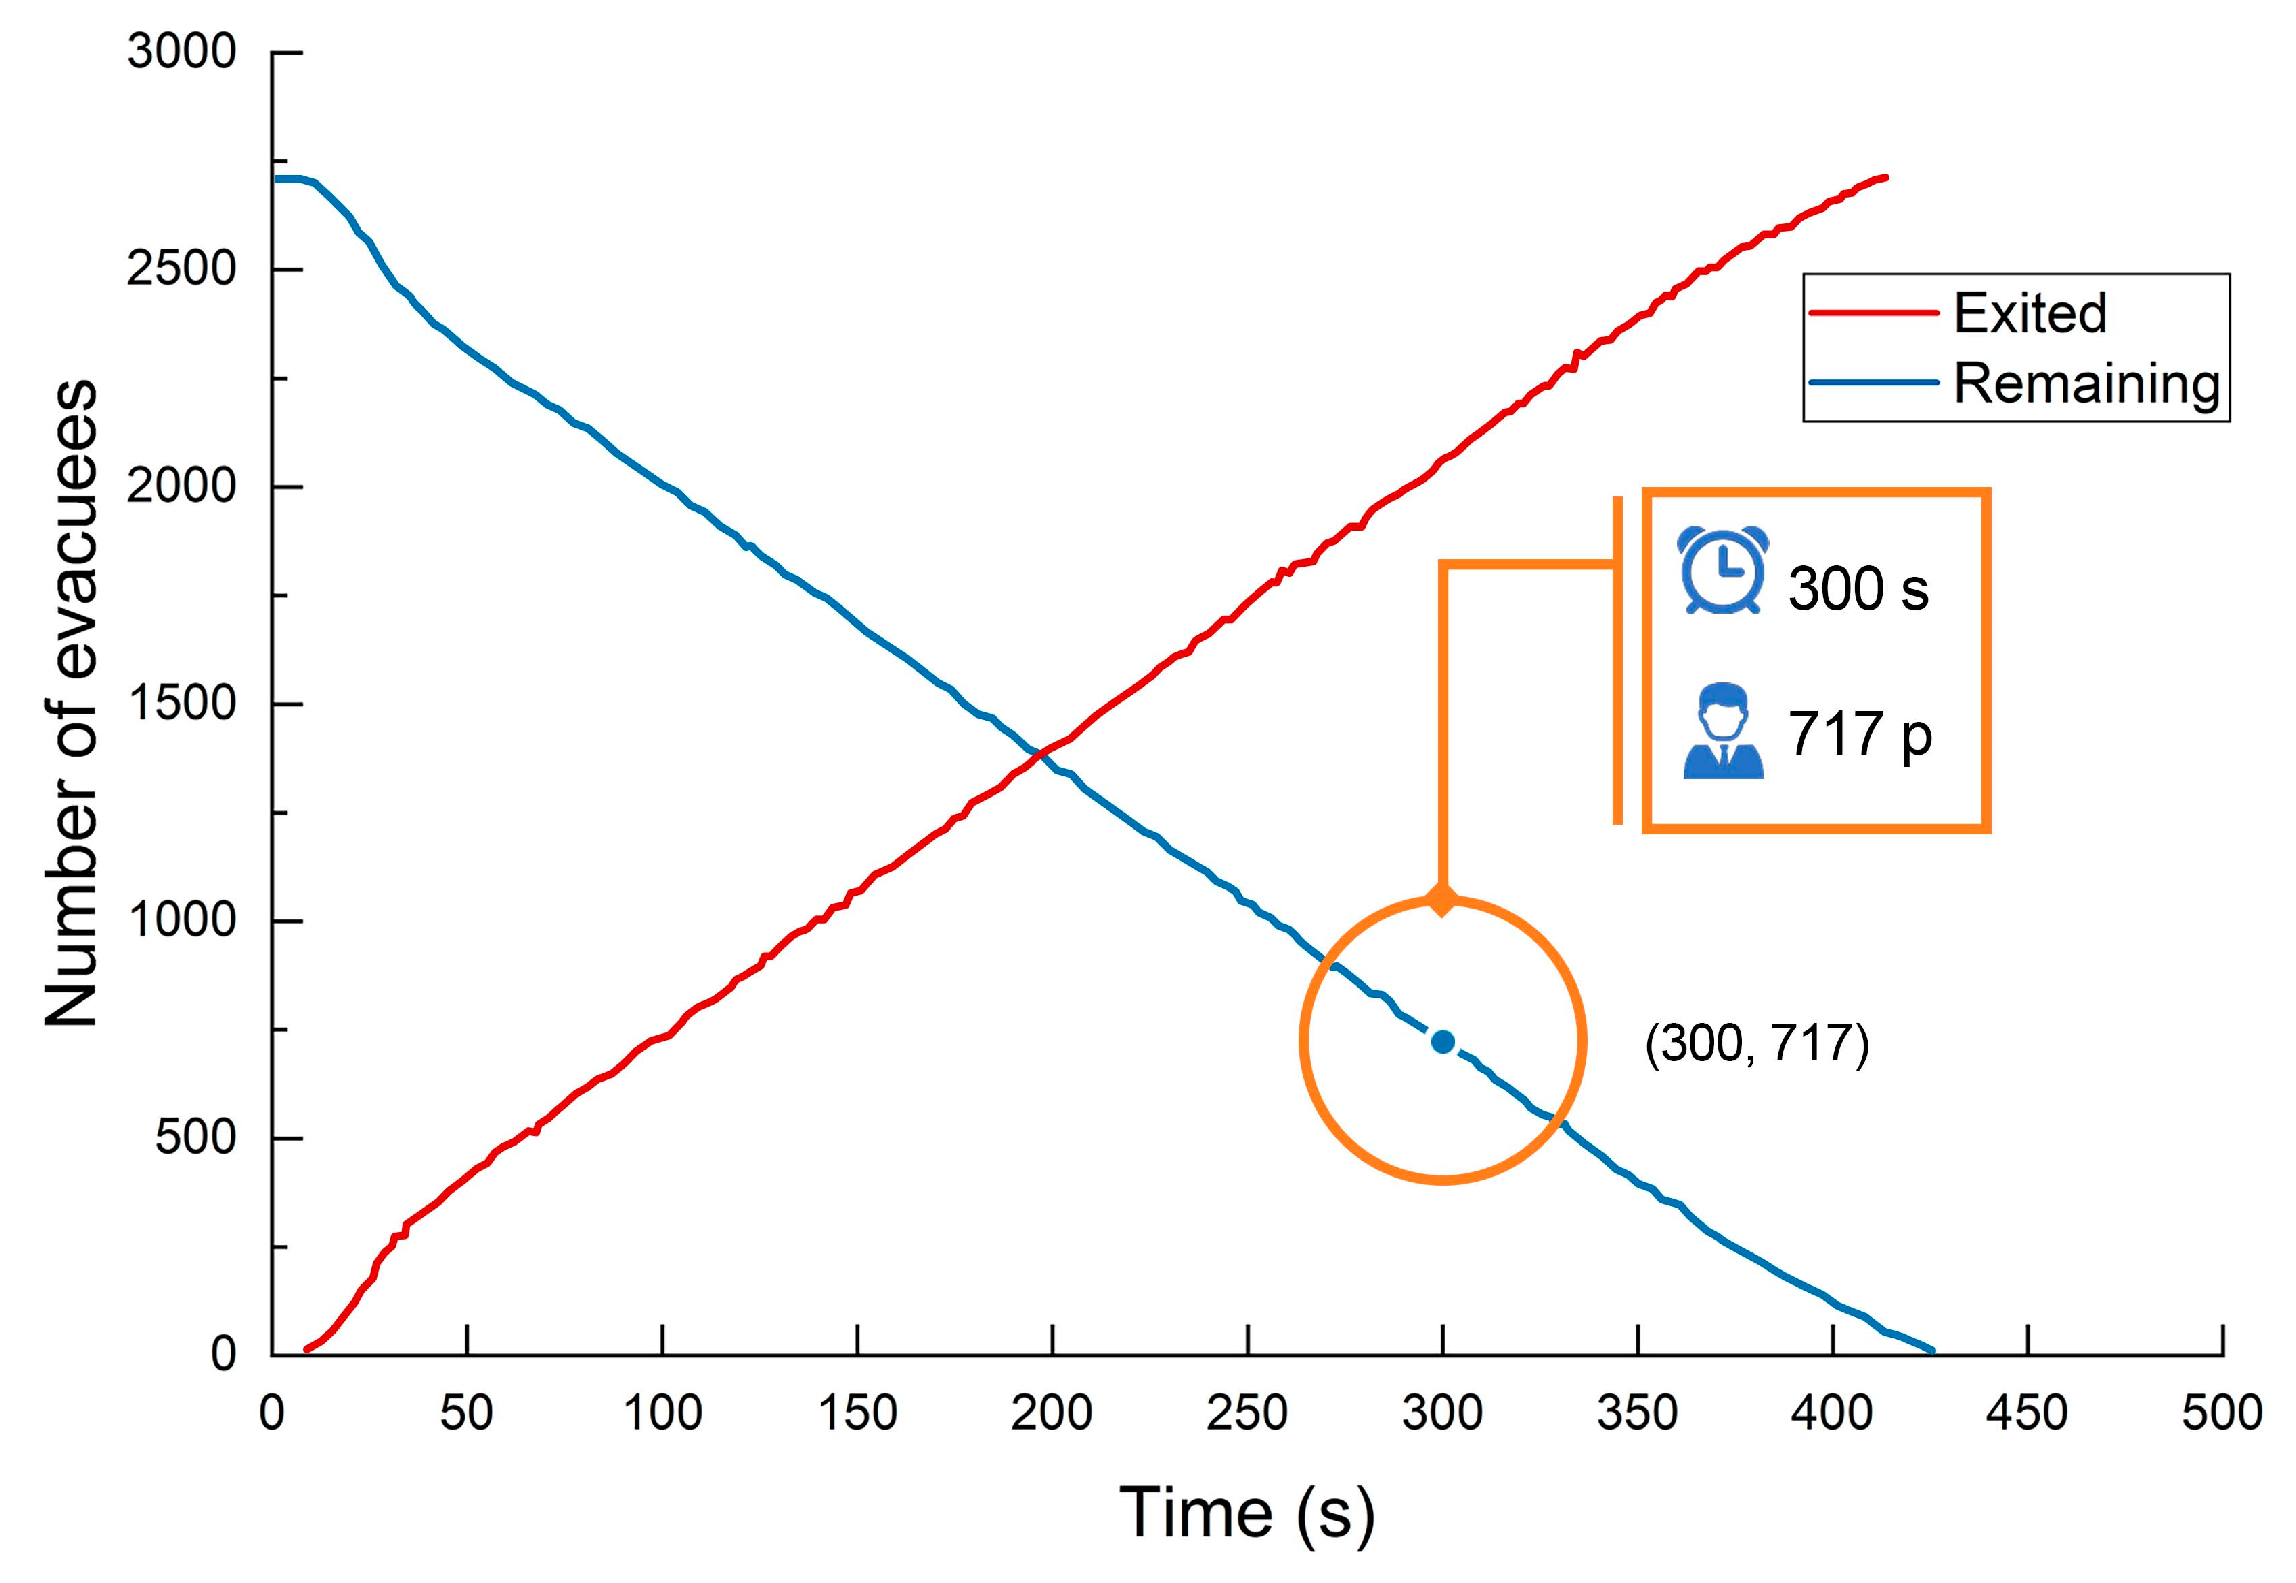
3.1.2. Determining RSET: Simulating Fire Emergency Evacuation with Pathfinder
3.1.3. Comparison Results of ASET and RSET
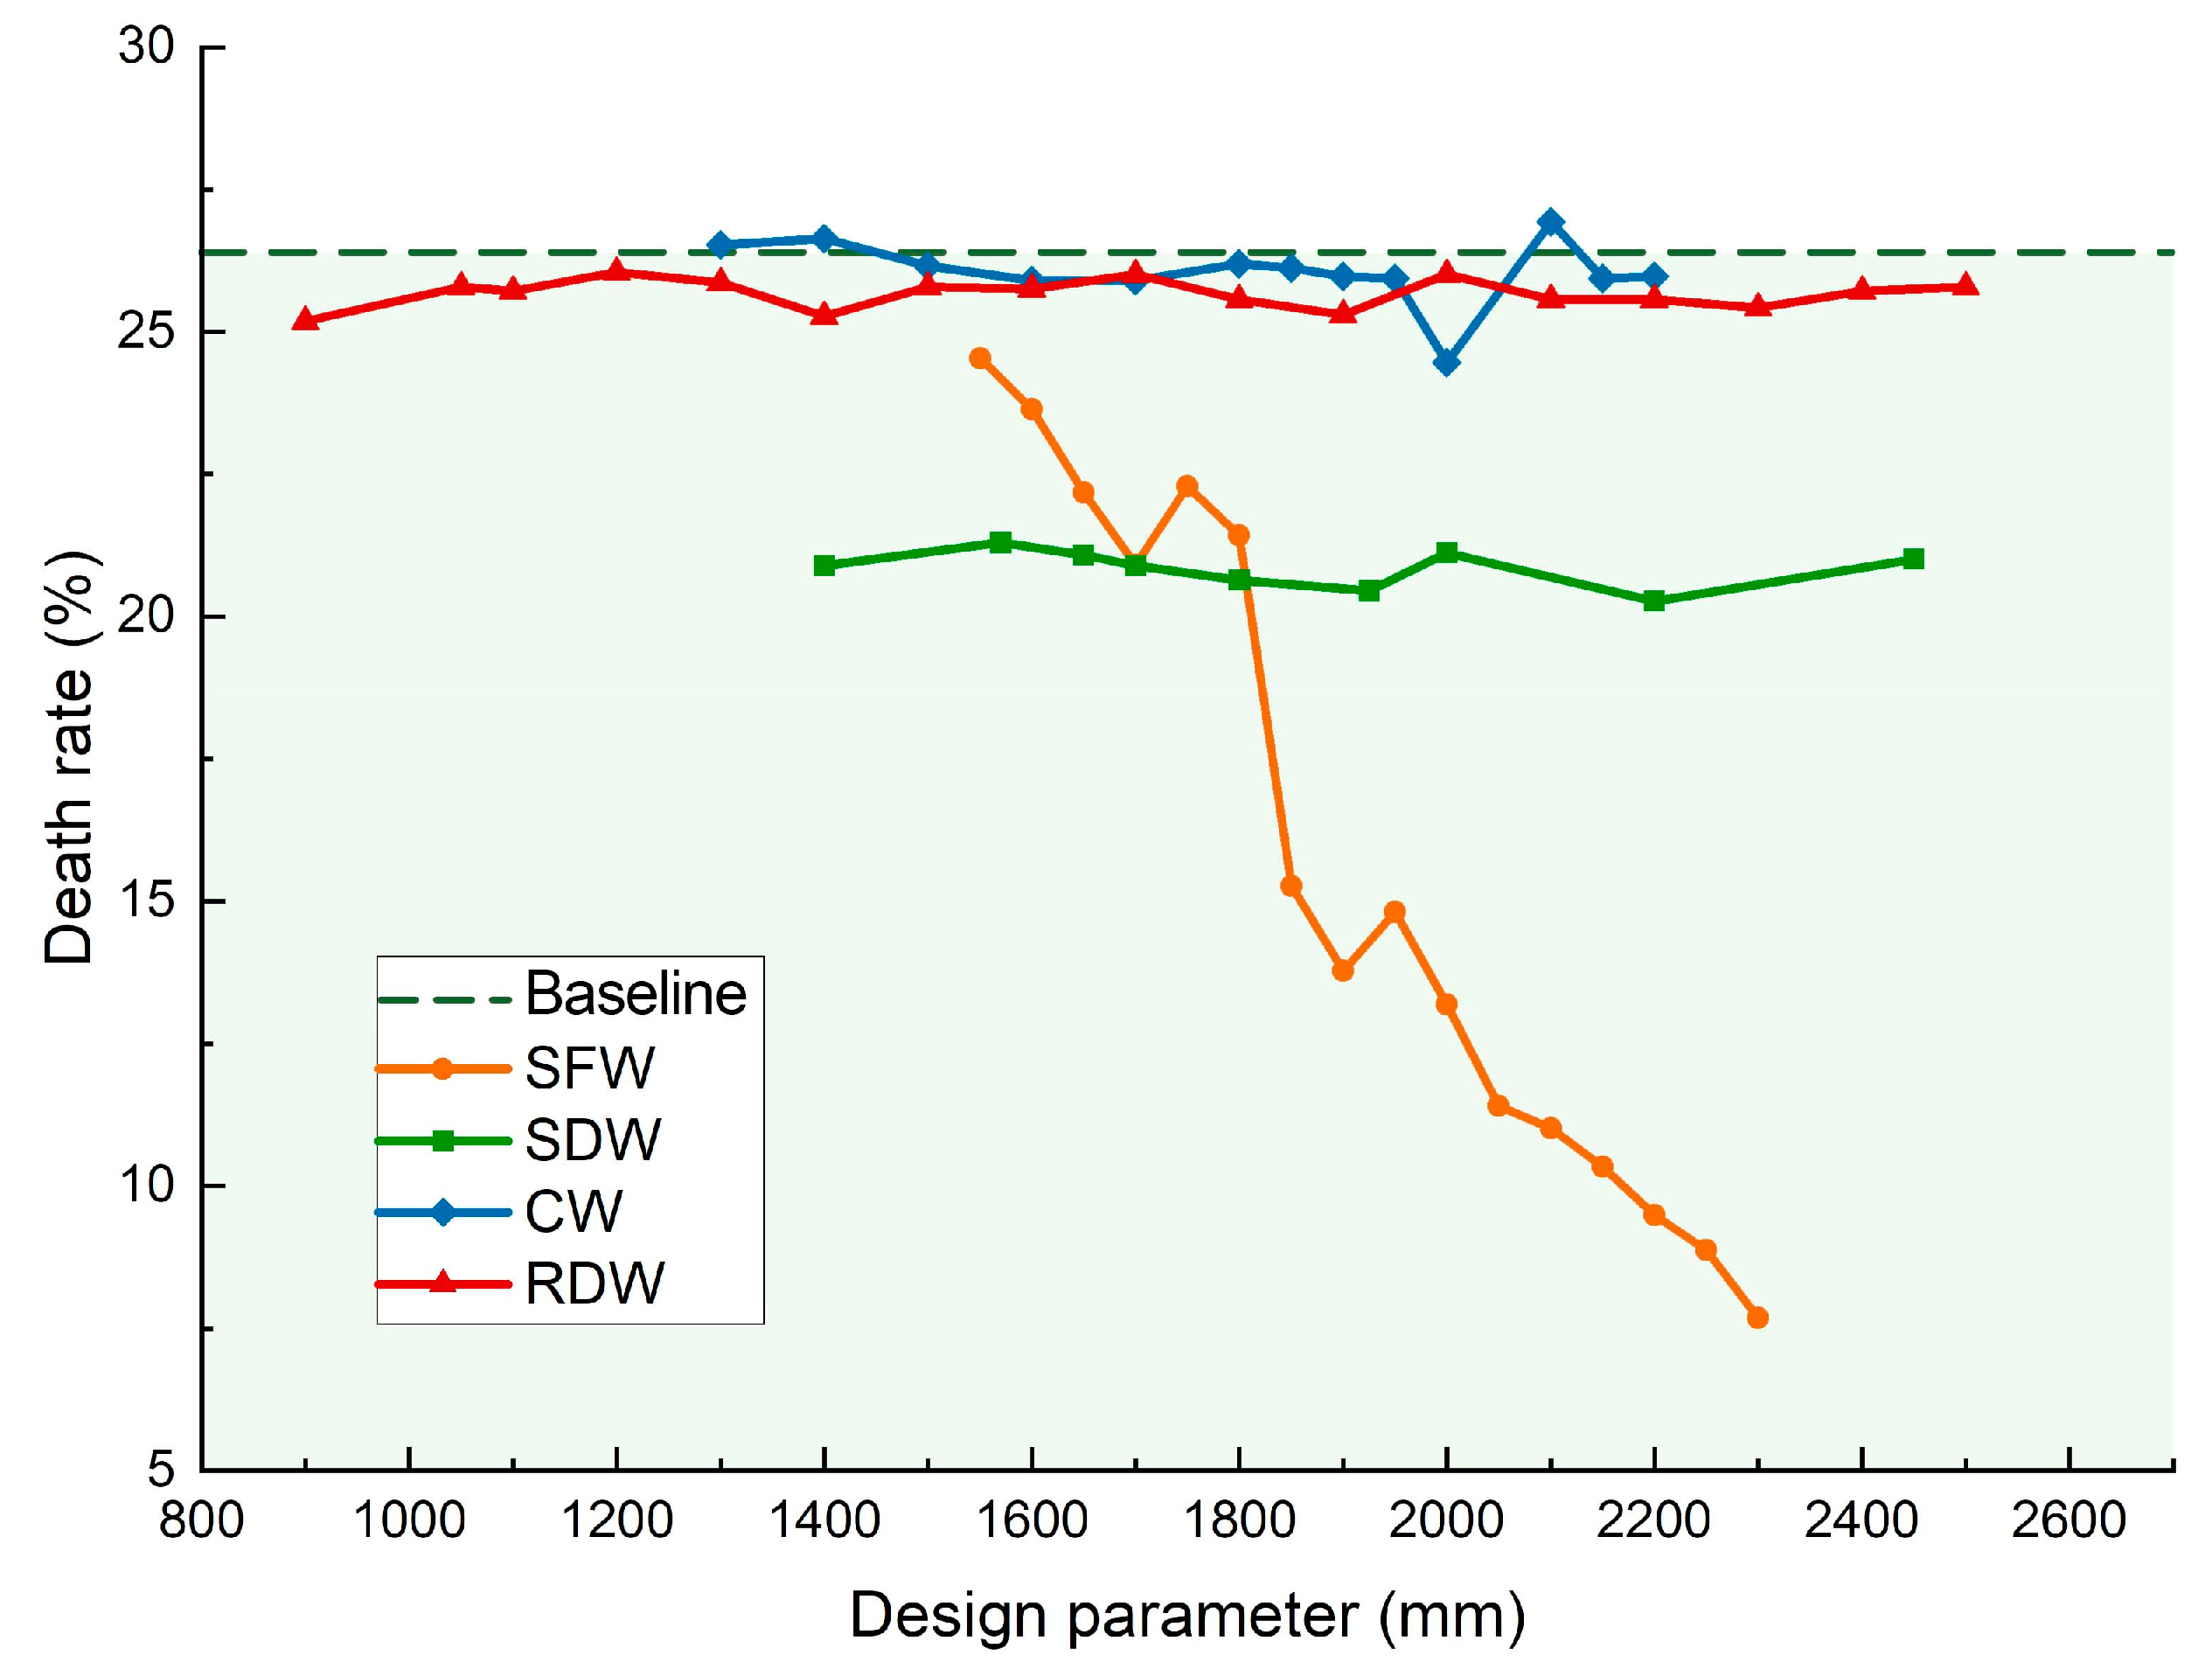
3.2. Effect of Design Parameters on Death Rate
3.3. Data Analysis and Egress System Optimization
3.3.1. Monofactor Analysis
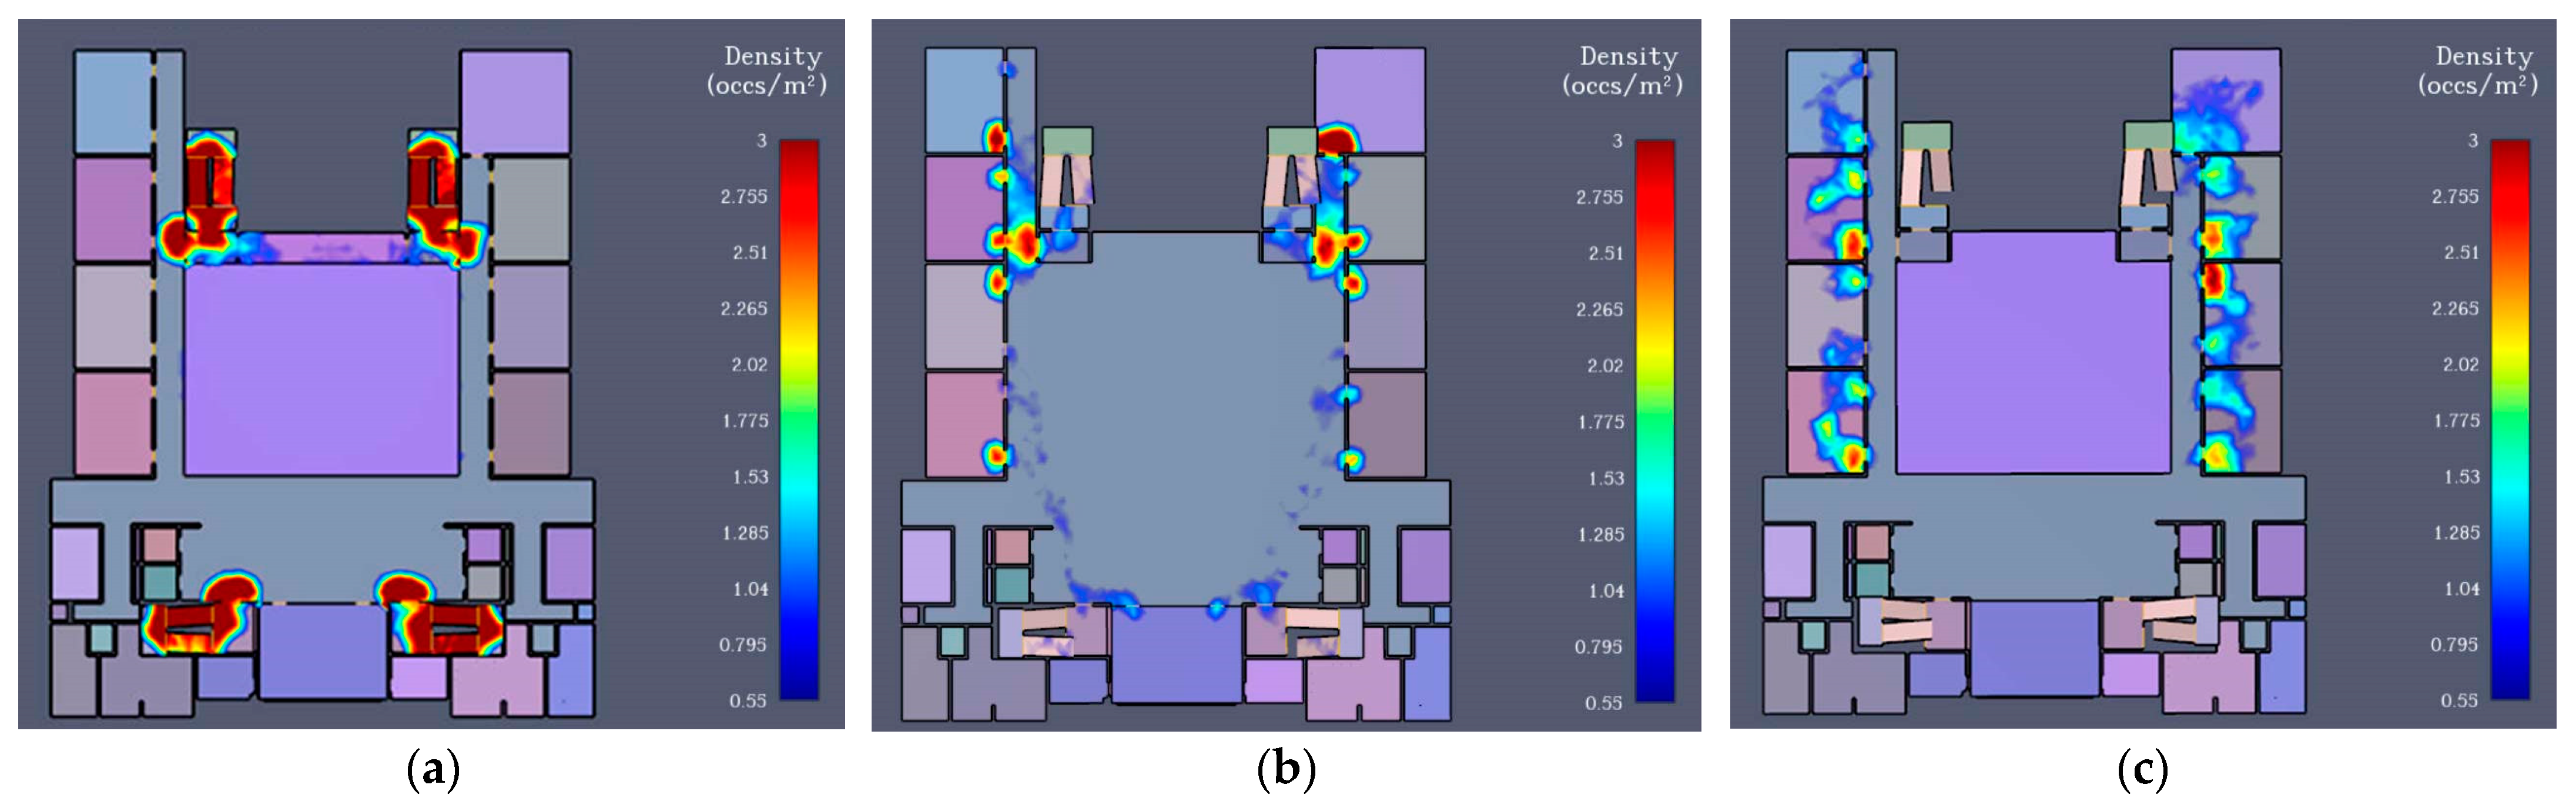
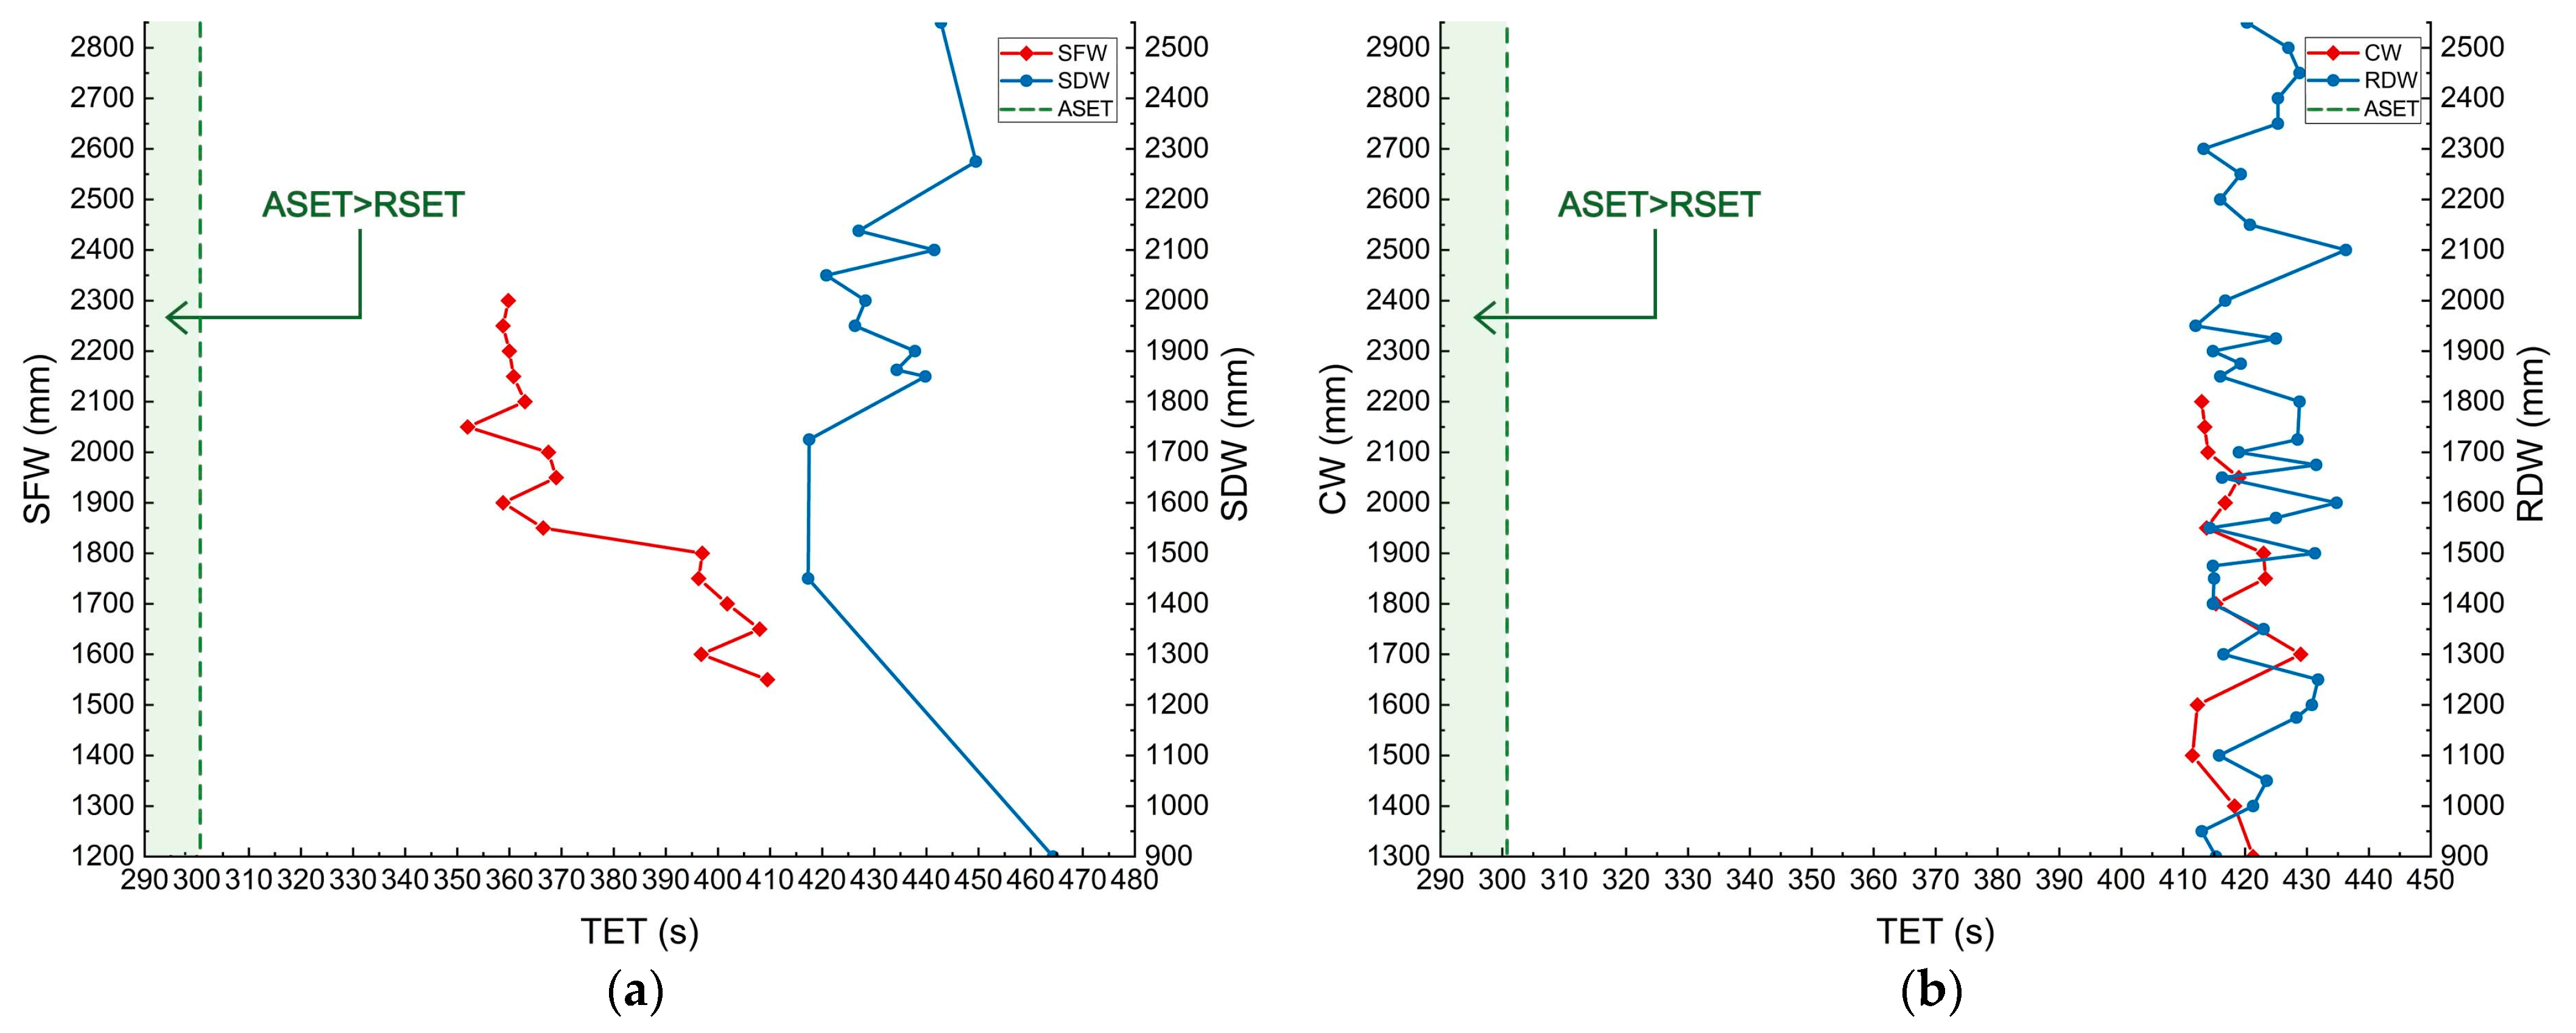
- The sensitivity factors for TET are SFW, SDW, and LDSF, all of which are design parameters of evacuation stairwells. As illustrated in Figure 12a, the stairwells are more likely to get congested than the others because they are at the end of the evacuation procedure for each level. This is in line with what the literature [55,64,65] analysis revealed.
- Additionally, the results indicates that CW and RDW are not sensitive to TET, which is inconsistent with the findings of earlier investigations [66,67]. This discrepancy results from the characteristics of building planar evacuation. The layout of the building, a series of rooms clustered around an atrium, is identical to how the rooms are arranged on the side facing the outer walkway. Furthermore, the atrium does not extend all the way to the top floor, creating a bigger area to accommodate the flow of passengers on the 6th, 8th, and 9th floors, resulting in relatively mild crowding in the corridors during the evacuation process (Figure 12b). Since there is no other crowd overlay and the evacuation burden is not particularly intense, RDW primarily affects the effectiveness of early personnel evacuation from the classroom to the corridor. As a result, its impact on TET is minimal (Figure 12c).
- SDW (Beta = −0.444) has more of an impact on TET than LDSF (Beta = −0.089). People enter the staircase by the SD and descend via the stairs. If the downstairs flight is positioned distant from the side of the stairwell door, it extends the evacuation distance for those on this floor. At the same time, they converge with the people on the upper floor. The merging behavior of the stairwell entry buffer would cut down the descending speed [38]. Meanwhile, the intensity of the behavior can be somewhat controlled by SDW, which also regulates the flow of individuals.
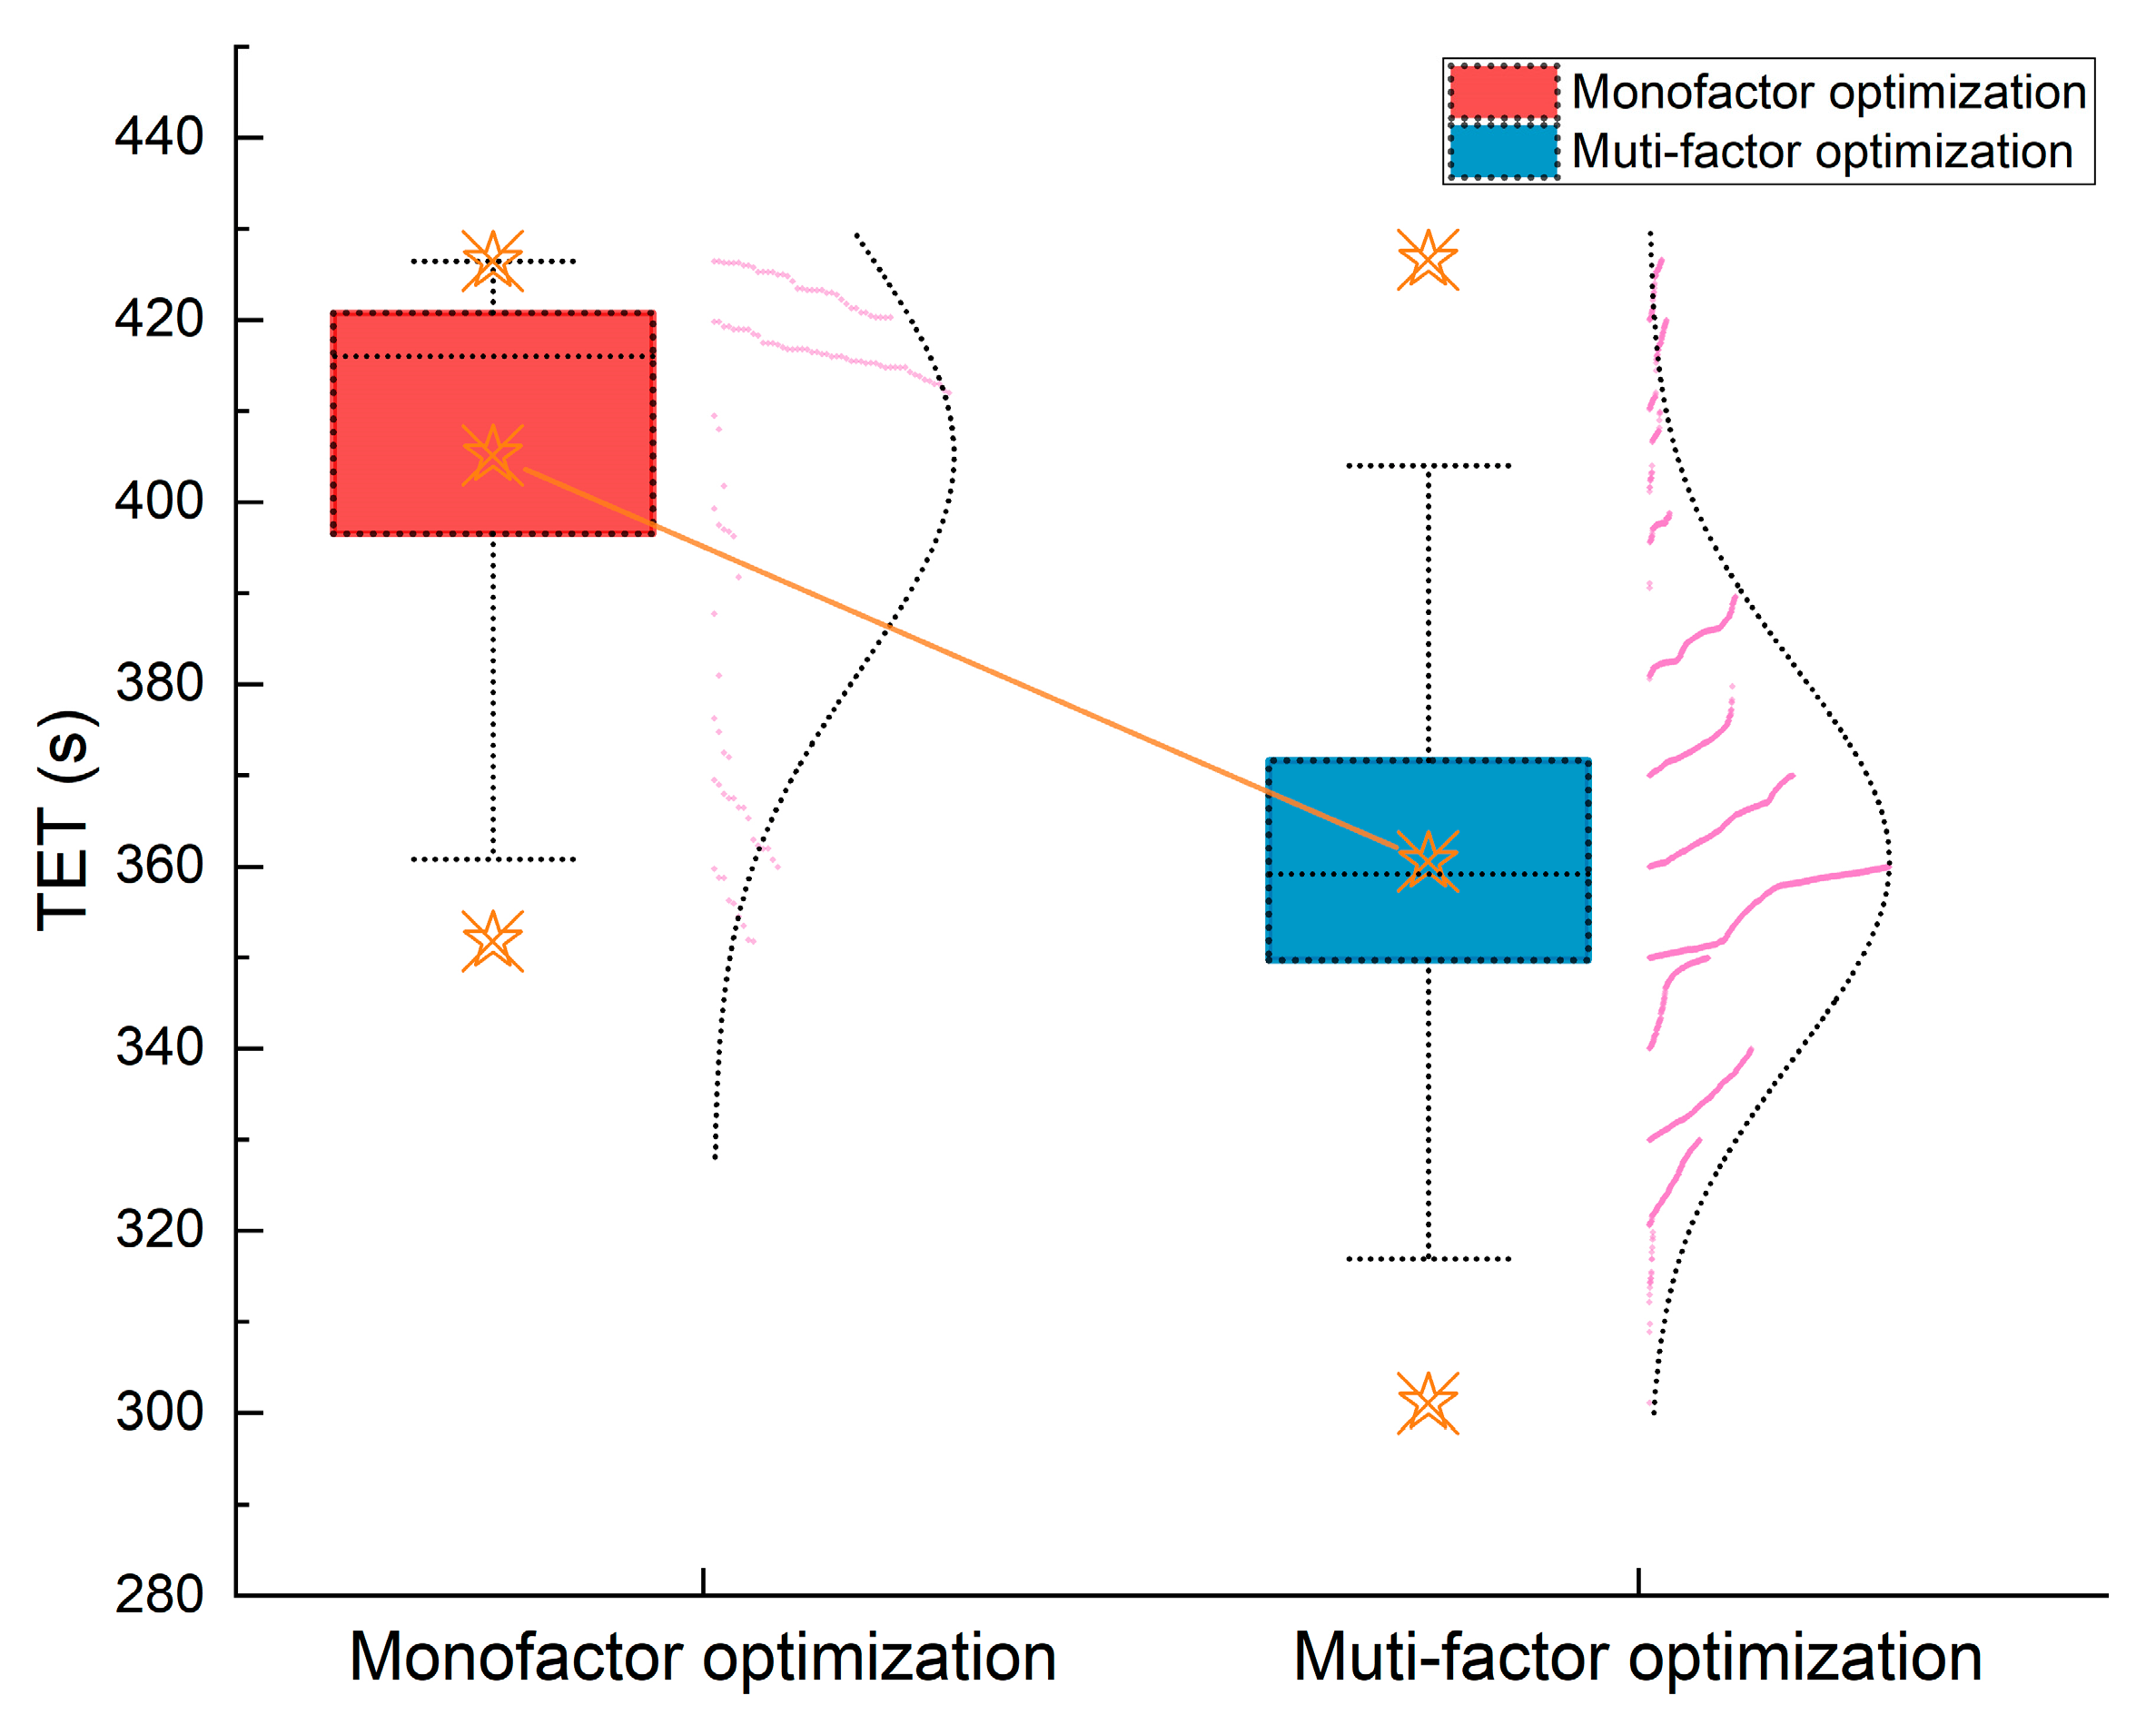
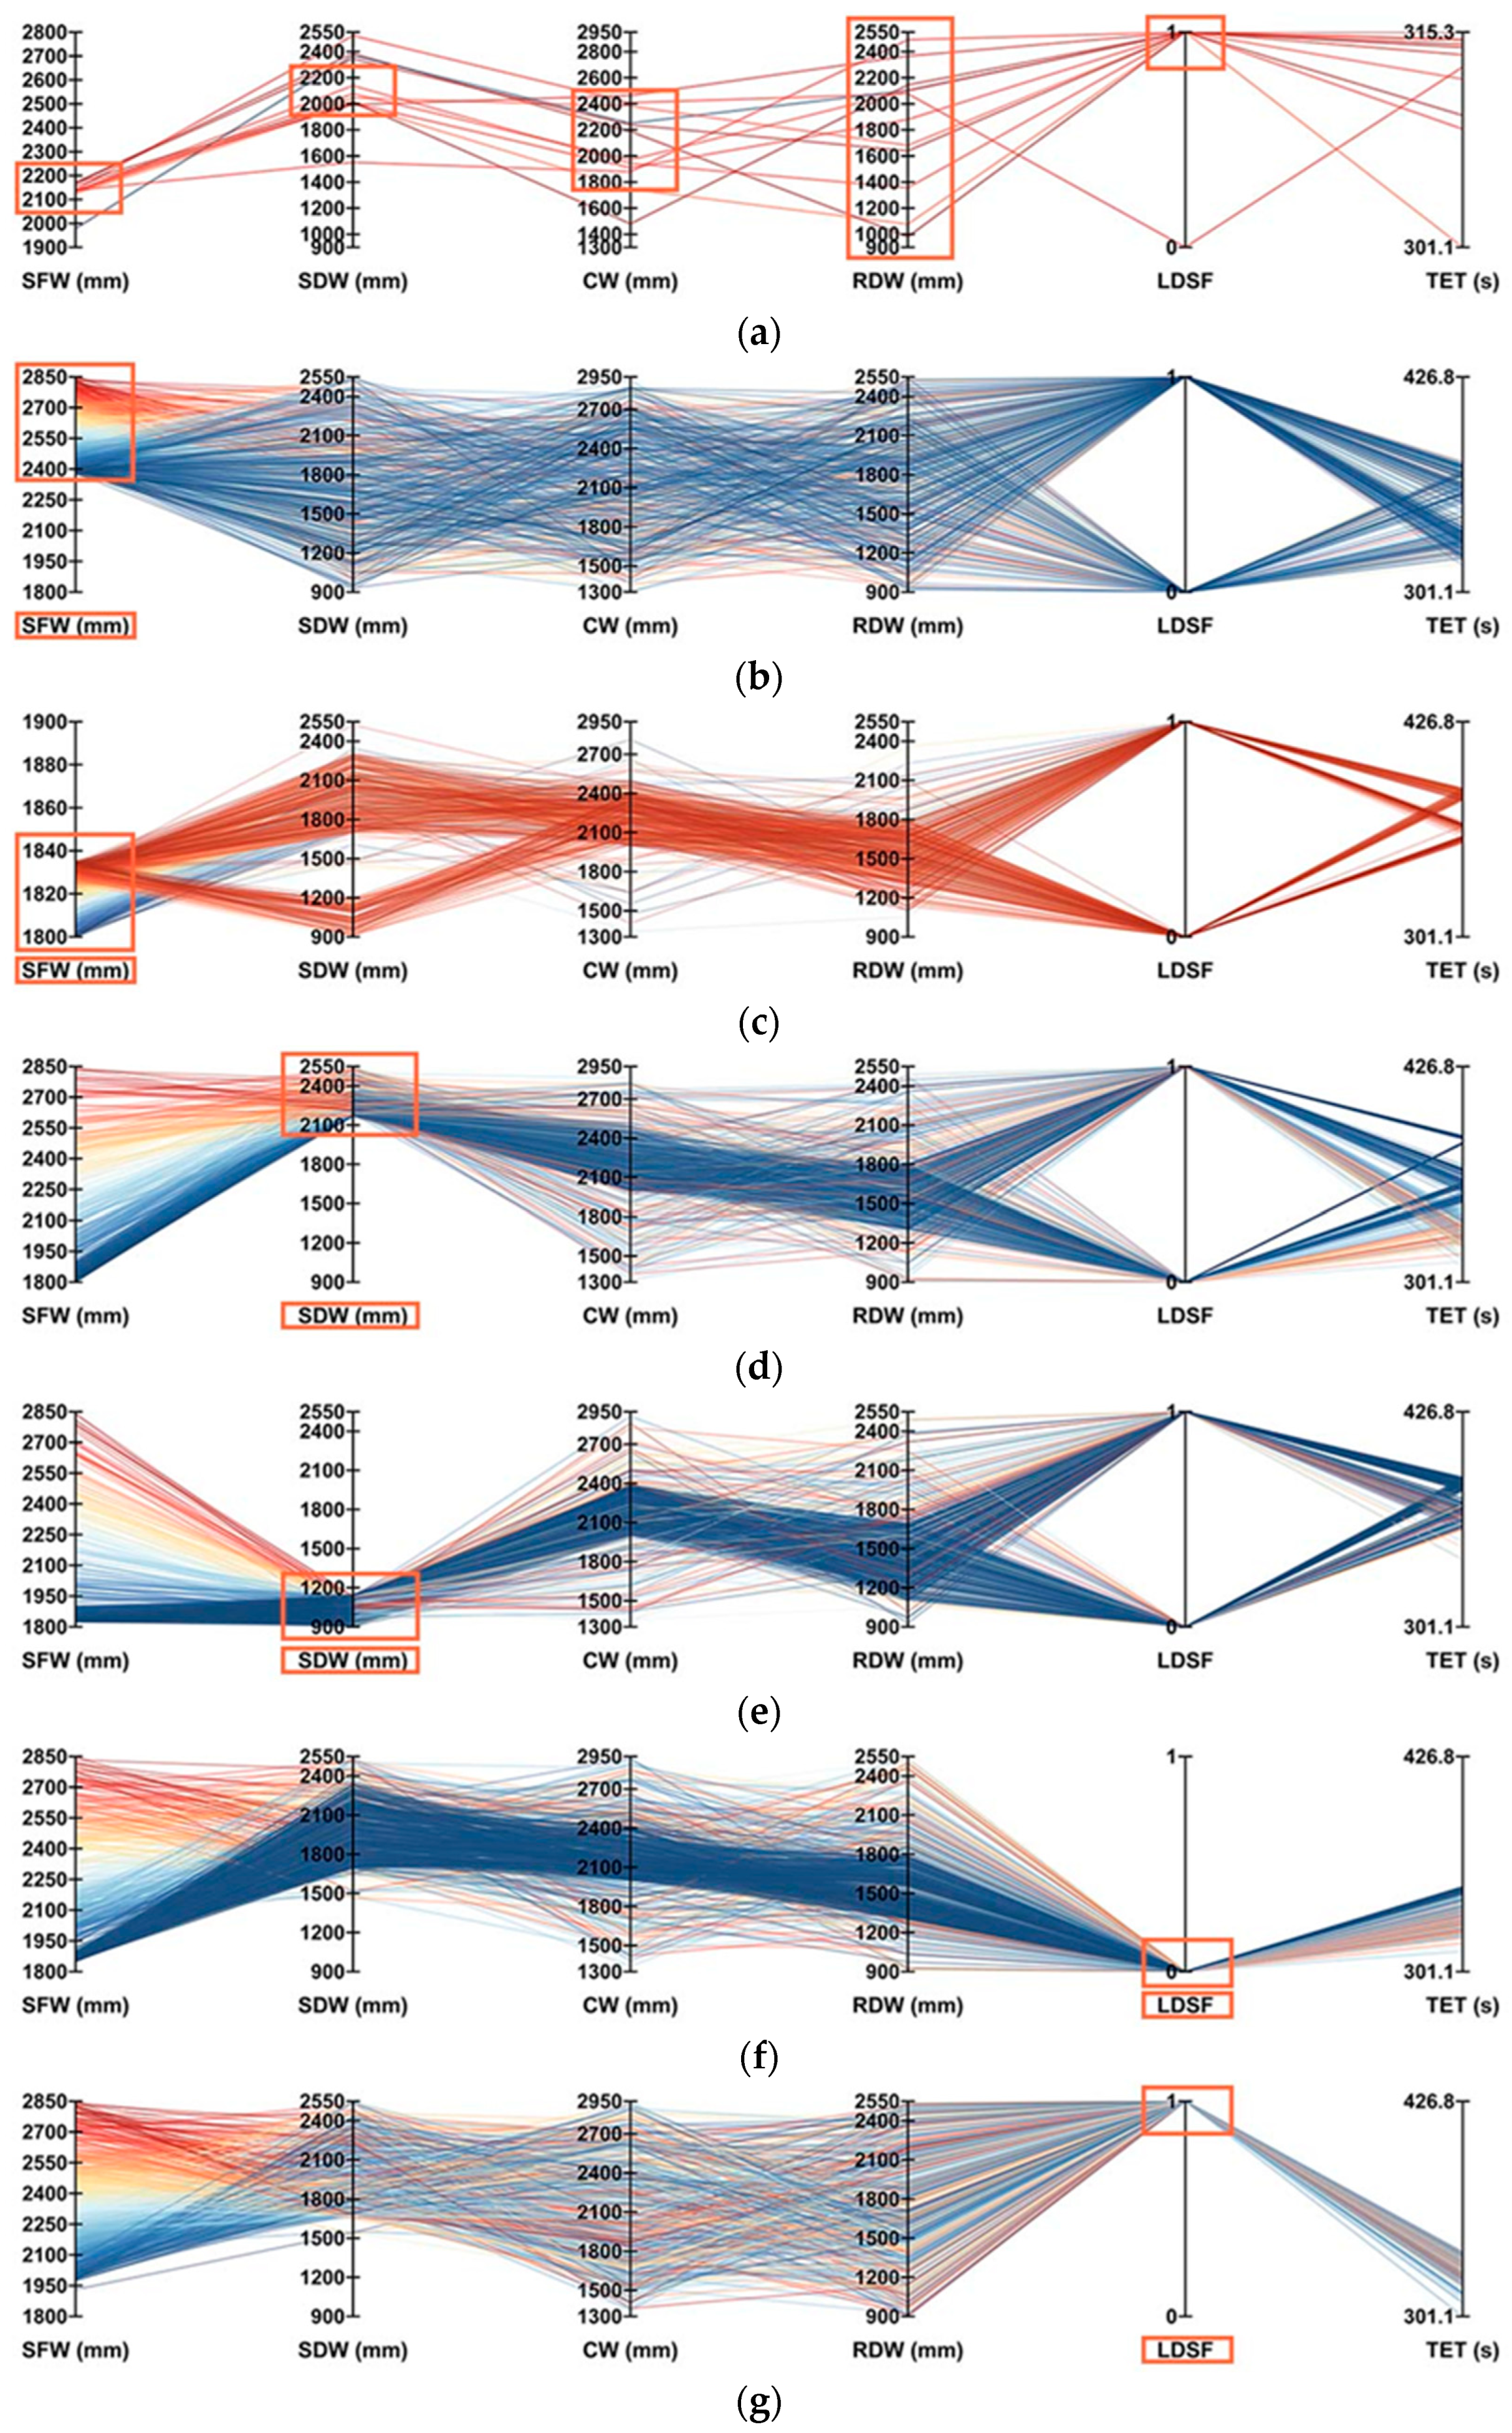
3.3.2. Muti-Factor Combination Effect Analysis
4. Conclusions
- Three evaluation factors—temperature, CO concentration, and visibility—are typically used to determine the ASET. The ASET in this paper was assessed through calculations and analysis to be the moment when visibility achieved its limited value in stairwell 4.
- The three variables relating to stairwells (SFW, SDW, LDSF) are all sensitive factors for TET, with SFW contributing the most to TET and SDW the second most. These three variables should be prioritized in the architectural program.
- Although neither could reach ASET, the multi-factor combinations with a maximum reduction in TET by 29.5%, outperforms the single-factor approach in terms of enhancing evacuation performance, and TET drops to the lowest when SFW [2100, 2200], SDW [2000, 2200], CW [1800, 2400], with LDSF being close to staircase door.
Author Contributions
Funding
Institutional Review Board Statement
Informed Consent Statement
Data Availability Statement
Conflicts of Interest
Nomenclature
| SFW | Stair Flight Width |
| SDW | Stairwell Door Width |
| CW | Corridor Width |
| RDW | Room Door Width |
| LDSF | Location of the Downward Stair Flight |
| TET | Total Evacuation Time |
| ASET | Available Safe Evacuation Time |
| RSET | Required Safe Evacuation Time |
| S1 | Slice 1 |
| S2 | Slice 2 |
References
- Deng, Q.; Zhang, B.; Zhou, Z.; Deng, H.Y.; Zhou, L.; Zhou, Z.Q.; Jiang, H.L. Evacuation Time Estimation Model in Large Buildings Based on Individual Characteristics and Real-Time Congestion Situation of Evacuation Exit. Fire 2022, 5, 204. [Google Scholar] [CrossRef]
- Available online: https://www.ctif.org/world-fire-statistics (accessed on 20 April 2023).
- Available online: https://www.nfpa.org/ (accessed on 20 April 2023).
- Xu, M.; Peng, D. Pyrosim-based numerical simulation of fire safety and evacuation behaviour of college buildings. Int. J. Saf. Secur. Eng. 2020, 10, 293–299. [Google Scholar] [CrossRef]
- Kodur, V.K.R.; Venkatachari, S.; Naser, M.Z. Egress Parameters Influencing Emergency Evacuation in High-Rise Buildings. Fire Technol. 2020, 56, 2035–2057. [Google Scholar] [CrossRef]
- Li, Y.; Lu, C.X.; Jin, J.G. Simulation of a pediatric hospital in evacuation considering groups. Simul. Model. Pract. Theory 2021, 107, 102150. [Google Scholar] [CrossRef]
- Zou, B.B.; Lu, C.X.; Li, Y. Simulation of a hospital evacuation including wheelchairs based on modified cellular automata. Simul. Model. Pract. Theory 2020, 99, 102018. [Google Scholar] [CrossRef]
- Li, Y.X.; Wang, D.Z.W.; Meng, M.; Wang, K. Simulation of Pedestrian Evacuation in University Canteen Based on Cellular Automata. IEEE Access 2019, 7, 130120–130132. [Google Scholar] [CrossRef]
- Rostami, R.; Alaghmandan, M. Performance-based design in emergency evacuation: From maneuver to simulation in school design. J. Build. Eng. 2021, 33, 101598. [Google Scholar] [CrossRef]
- Zang, Y.; Mei, Q.; Liu, S. Evacuation simulation of a high-rise teaching building considering the influence of obstacles. Simul. Model. Pract. Theory 2021, 112, 102354. [Google Scholar] [CrossRef]
- Guo, K.; Zhang, L.M. Simulation-based passenger evacuation optimization in metro stations considering multi-objectives. Autom. Constr. 2022, 133, 104010. [Google Scholar] [CrossRef]
- Salarian, A.H.; Mashhadizadeh, A.; Bagheri, M. Simulating Passenger Evacuation in Railway Station under Fire Emergency using Safe Zone Approach. Transp. Res. Rec. 2020, 2674, 806–812. [Google Scholar] [CrossRef]
- Zhu, R.H.; Becerik-Gerber, B.; Lin, J.; Li, N. Behavioral, data-driven, agent-based evacuation simulation for building safety design using machine learning and discrete choice models. Adv. Eng. Inform. 2023, 55, 101827. [Google Scholar] [CrossRef]
- Li, J.; Mei, X.; Wang, J.; Xie, B.; Xu, Y. Simulation Experiment Teaching for Airport Fire Escape based on Virtual Reality and Artificial Intelligence Technology. In Proceedings of the 2nd IEEE International Conference on Civil Aviation Safety and Information Technology, ICCASIT 2020, Weihai, China, 14–16 October 2020; pp. 1014–1017. [Google Scholar]
- Tweedie, S.W.; Rowland, J.R.; Walsh, S.J.; Rhoten, R.P.; Hagle, P.I. A methodology for estimating emergency evacuation times. Soc. Sci. J. 1986, 23, 189–204. [Google Scholar] [CrossRef]
- Zhong, Y. Research on Intelligent Control Method of Fire Emergency Lighting Distribution in High Rise Buildings. In Proceedings of the 2021 2nd International Workshop on Electronic communication and Artificial Intelligence, IWECAI 2021, Nanjing, China, 12–14 March 2021. [Google Scholar]
- Liu, Y.Q.; Li, Y.Z.; Ingason, H.; Liu, F. Control of thermal-driven smoke flow at stairways in a subway platform fire. Int. J. Therm. Sci. 2021, 165, 106937. [Google Scholar] [CrossRef]
- Omar, M.; Mahmoud, A.; Aziz, S.B. Fire Safety Index for High-Rise Buildings in the Emirate of Sharjah, UAE. Fire 2023, 6, 51. [Google Scholar] [CrossRef]
- Wang, N.; Gao, Y.; Li, C.-Y.; Gai, W.-M. Integrated agent-based simulation and evacuation risk-assessment model for underground building fire: A case study. J. Build. Eng. 2021, 40, 102609. [Google Scholar] [CrossRef]
- Snopkova, D.; De Cock, L.; Jurik, V.; Kvarda, O.; Tancos, M.; Herman, L.; Kubicek, P. Isovists compactness and stairs as predictors of evacuation route choice. Sci. Rep. 2023, 13, 2970. [Google Scholar] [CrossRef]
- Wang, K.; Yuan, W.; Yao, Y. Path optimization for mass emergency evacuation based on an integrated model. J. Build. Eng. 2023, 68, 106112. [Google Scholar] [CrossRef]
- Yakhou, N.; Thompson, P.; Siddiqui, A.; Abualdenien, J.; Ronchi, E. The integration of building information modelling and fire evacuation models. J. Build. Eng. 2023, 63, 105557. [Google Scholar] [CrossRef]
- Zhang, X.; Zhong, Q.; Li, Y.; Li, W.; Luo, Q. Simulation of Fire Emergency Evacuation in Metro Station Based on Cellular Automata. In Proceedings of the 3rd IEEE International Conference on Intelligent Transportation Engineering, ICITE 2018, Singapore, 3–5 September 2018; pp. 40–44. [Google Scholar]
- Liu, Z.; Gu, X.; Hong, R. Fire Protection and Evacuation Analysis in Underground Interchange Tunnels by Integrating BIM and Numerical Simulation. Fire 2023, 6, 139. [Google Scholar] [CrossRef]
- Gerges, M.; Demian, P.; Adamu, Z. Customising Evacuation Instructions for High-Rise Residential Occupants to Expedite Fire Egress: Results from Agent-Based Simulation. Fire 2021, 4, 21. [Google Scholar] [CrossRef]
- Wang, J.-L.; Chiou, J.-M.; Müller, H.-G.J.A.R.O.S. Functional data analysis. Annu. Rev. Stat. Its Appl. 2016, 3, 257–295. [Google Scholar] [CrossRef]
- Roscher, R.; Bohn, B.; Duarte, M.F.; Garcke, J. Explainable Machine Learning for Scientific Insights and Discoveries. IEEE Access 2020, 8, 42200–42216. [Google Scholar] [CrossRef]
- Mussone, L.; Bassani, M.; Masci, P. Analysis of factors affecting the severity of crashes in urban road intersections. Accid. Anal. Prev. 2017, 103, 112–122. [Google Scholar] [CrossRef] [PubMed]
- Wang, K.; Shi, X.P.; Goh, A.P.X.; Qian, S.Z. A machine learning based study on pedestrian movement dynamics under emergency evacuation. Fire Saf. J. 2019, 106, 163–176. [Google Scholar] [CrossRef]
- Horii, H. Crowd behaviour recognition system for evacuation support by using machine learning. Int. J. Saf. Secur. Eng. 2020, 10, 243–246. [Google Scholar] [CrossRef]
- Gu, J.L.; Wang, J.C.; Guo, X.W.; Liu, G.J.; Qin, S.J.; Bi, Z.L. A Metaverse-Based Teaching Building Evacuation Training System With Deep Reinforcement Learning. IEEE Trans. Syst. Man Cybern.-Syst. 2023, 53, 2209–2219. [Google Scholar] [CrossRef]
- Tkachuk, K.; Song, X.; Maltseva, I. Application of artificial neural networks for agent-based simulation of emergency evacuation from buildings for various purpose. In Proceedings of the 21st International Scientific Conference on Advanced in Civil Engineering: Construction-The Formation of Living Environment, FORM 2018, Moscow, Russia, 25–27 April 2018. [Google Scholar]
- Deng, H.; Ou, Z.B.; Zhang, G.J.; Deng, Y.C.; Tian, M. BIM and Computer Vision-Based Framework for Fire Emergency Evacuation Considering Local Safety Performance. Sensors 2021, 21, 3851. [Google Scholar] [CrossRef]
- Li, J.C.; Wang, J.H.; Li, J.; Wang, Z.R.; Wang, Y. Research on the influence of building convex exit on crowd evacuation and its design optimization. Build. Simul. 2022, 15, 669–684. [Google Scholar] [CrossRef]
- Syed Abdul Rahman, S.A.F.; Abdul Maulud, K.N.; Pradhan, B.; Syed Mustorpha, S.N.A.; Che Ani, A.I. Impact of evacuation design parameter on users’ evacuation time using a multi-agent simulation. Ain Shams Eng. J. 2021, 12, 2355–2369. [Google Scholar] [CrossRef]
- Tajima, Y.; Nagatani, T. Scaling behavior of crowd flow outside a hall. Phys. A Stat. Mech. Its Appl. 2001, 292, 545–554. [Google Scholar] [CrossRef]
- Weifeng, F.; Lizhong, Y.; Weicheng, F. Simulation of bi-direction pedestrian movement using a cellular automata model. Phys. A Stat. Mech. Its Appl. 2003, 321, 633–640. [Google Scholar] [CrossRef]
- Fang, Z.M.; Song, W.G.; Li, Z.J.; Tian, W.; Lv, W.; Ma, J.; Xiao, X. Experimental study on evacuation process in a stairwell of a high-rise building. Build. Environ. 2012, 47, 316–321. [Google Scholar] [CrossRef]
- Hurley, M.J.; Gottuk, D.T.; Hall, J.R., Jr.; Harada, K.; Kuligowski, E.D.; Puchovsky, M.; Watts, J.M., Jr.; Wieczorek, C.J. SFPE Handbook of Fire Protection Engineering; Springer: Berlin/Heidelberg, Germany, 2015. [Google Scholar]
- Available online: https://www.nfpa.org/Public-Education/Staying-safe/Safety-in-living-and-entertainment-spaces/High-rise-buildings/FAQs-about-building-evacuation (accessed on 20 April 2023).
- Rismanian, M.; Zarghami, E. Evaluation of crowd evacuation in high-rise residential buildings with mixed-ability population: Combining an architectural solution with management strategies. Int. J. Disaster Risk Reduct. 2022, 77, 103068. [Google Scholar] [CrossRef]
- Purser, D.A. Assessment of Hazards to Occupants from Smoke, Toxic Gases, and Heat. SFPE Handbook of Fire Protection Engineering, 5th ed.; Springer: New York, NY, USA, 2016; pp. 2308–2428. [Google Scholar]
- Zhang, H.; Miao, Z.-H.; Lv, H.-N.; Leng, Z.-L. Evacuation Simulation of Large Theater Based on Pyrosim and Pathfinder. In Proceedings of the 2022 6th International Conference on Data Mining, Communications and Information Technology, DMCIT 2022, Virtual, 29 April 2022. [Google Scholar]
- Shnal, T.; Pozdieiev, S.; Yakovchuk, R.; Nekora, O. Development of a Mathematical Model of Fire Spreading in a Three-Storey Building Under Full-Scale Fire-Response Tests. In Proceedings of the 2nd International Scientific Conference on EcoComfort and Current Issues of Civil Engineering, EcoComfort 2020, Lviv, Ukraine, 16–18 September 2020; pp. 419–428. [Google Scholar]
- Na, W.; Chen, C. A Study on the Evacuation Spacing of Undersea Tunnels in Different Ventilation Velocity Conditions. Fire 2022, 5, 48. [Google Scholar] [CrossRef]
- Choi, S.H.; Darkhanbat, K.; Heo, I.; Kim, K.S. Evaluation on Egress Safety of Nursing Hospital Considering the Smoke Exhaust System. Fire 2022, 5, 120. [Google Scholar] [CrossRef]
- Ju, Y. A fire simulation method of urban light rail station hall based on building information model and pyrosim software. In Proceedings of the 2021 International Conference on Applied Mathematics, Modelling and Intelligent Computing, CAMMIC 2021, Guilin, China, 26–28 March 2021. [Google Scholar]
- Yao, H.-W.; Lv, K.-F.; Li, Y.-X.; Zhang, J.-G.; Lv, Z.-B.; Wang, D.; Zhan, Z.-Y.; Wei, X.-G.; Song, H.-T.; Qin, H.-J. Numerical Simulation of Fire in Underground Commercial Street. Comput. Intell. Neurosci. 2022, 2022, 4699471. [Google Scholar] [CrossRef]
- Xu, L.; Huang, K.; Liu, J.; Li, D.; Chen, Y.F. Intelligent planning of fire evacuation routes using an improved ant colony optimization algorithm. J. Build. Eng. 2022, 61, 105208. [Google Scholar] [CrossRef]
- Xiong, K.; Weng, M.C.; Liu, F.; Lu, Y.H. Numerical Study on Evacuation Evaluation and Strategy of Theater with Rotating Auditorium. Buildings 2022, 12, 1202. [Google Scholar] [CrossRef]
- Li, M.-X.; Zhu, S.-B.; Wang, J.-H.; Zhou, Z. Research on Fire Safety Evacuation in a University Library in Nanjing. Procedia Eng. 2018, 211, 372–378. [Google Scholar] [CrossRef]
- Board. The Australian Building Codes Board. Available online: https://oia.pmc.gov.au/sites/default/files/posts/2021/07/Lead%20in%20Plumbing%20Products%20Final%20RIS%20-%20Accessible.pdf (accessed on 8 February 2009).
- Jin, T.; Yamada, T. Irritating effects of fire smoke on visibility. Fire Sci. Technol. 1985, 5, 79–90. [Google Scholar] [CrossRef]
- Yan, Z.; Han, X.; Li, M. Accurate assessment of RSET for building fire based on engineering calculation and numerical simulation. In Proceedings of the International Seminar on Applied Physics, Optoelectronics and Photonics, APOP 2016, Shanghai, China, 28–29 May 2016. [Google Scholar]
- Fang, Z.-M.; Song, W.-G.; Zhang, J.; Wu, H. A Multi-Grid Model for Evacuation Coupling with the Effects of Fire Products. Fire Technol. 2012, 48, 91–104. [Google Scholar] [CrossRef]
- Code, U.B.J.I.C.C., USA. International Building Code; UNICC: Geneva, Switzerland, 2021. [Google Scholar]
- Available online: http://www.jianbiaoku.com/webarbs/book/56160/3661447.shtml (accessed on 20 April 2023).
- Guo, K.; Zhang, L.M.; Wu, M.Z. Simulation-based multi-objective optimization towards proactive evacuation planning at metro stations. Eng. Appl. Artif. Intell. 2023, 120, 105858. [Google Scholar] [CrossRef]
- Tinaburri, A. Principles for Monte Carlo agent-based evacuation simulations including occupants who need assistance. From RSET to RiSET. Fire Saf. J. 2022, 127, 103510. [Google Scholar] [CrossRef]
- Gosmann, L.; Geitner, C.; Wieler, N. Data-driven forward osmosis model development using multiple linear regression and artificial neural networks. Comput. Chem. Eng. 2022, 165, 107933. [Google Scholar] [CrossRef]
- Flores-Sosa, M.; Leon-Castro, E.; Merigo, J.M.; Yager, R.R. Forecasting the exchange rate with multiple linear regression and heavy ordered weighted average operators. Knowl.-Based Syst. 2022, 248, 108863. [Google Scholar] [CrossRef]
- Ronchi, E.; Nilsson, D. Fire evacuation in high-rise buildings: A review of human behaviour and modelling research. Fire Sci. Rev. 2013, 2, 7. [Google Scholar] [CrossRef]
- Galea, E.R.; Wang, Z.; Veeraswamy, A.; Jia, F.; Lawrence, P.J.; Ewer, J. Coupled fire/evacuation analysis of the Station Nightclub fire. Fire Saf. Sci. 2008, 9, 465–476. [Google Scholar] [CrossRef]
- Daoliang, Z.; Lizhong, Y.; Jian, L. Exit dynamics of occupant evacuation in an emergency. Phys. A Stat. Mech. Its Appl. 2006, 363, 501–511. [Google Scholar] [CrossRef]
- Zhang, H.; Long, H.-C. Simulation of Evacuation in Crowded Places Based on BIM and Pathfinder. In Proceedings of the 5th International Conference on Machine Vision and Information Technology, CMVIT 2021, Virtual, 26 February 2021. [Google Scholar]
- Lei, W.; Li, A.; Gao, R. Effect of varying two key parameters in simulating evacuation for a dormitory in China. Phys. A Stat. Mech. Its Appl. 2013, 392, 79–88. [Google Scholar] [CrossRef]
- Li, L.; Yu, Z.; Chen, Y. Evacuation dynamic and exit optimization of a supermarket based on particle swarm optimization. Phys. A Stat. Mech. Its Appl. 2014, 416, 157–172. [Google Scholar] [CrossRef]
- Oh, S.-c.; Ha-Sung, K. Analysis of Evacuation Time According to Variation of Evacuation Stairs’ Width in Large-Scale Goshiwons. J. Converg. Cult. Technol. 2022, 8, 641–651. [Google Scholar]
- Yun-Seong, K.; Lee, Y.-L.; Kim, H.-W.; Kwon, Y.-J. A Study on the Analysis of Vertical Walking Speed Considering the Confluence of Occupants in the Stairwell of a High-rise Building. Fire Sci. Eng. 2021, 35, 9–16. [Google Scholar]


| References | Research Tools | Scenarios | Content |
|---|---|---|---|
| Fang, Z.M. (2012) [38] | Empirical study | High-rise commercial building | Factors affecting the evacuation speed of stairwells |
| Li, Y. (2020) [6] | Simulation | Hospital | Effect of overlap and acceleration on evacuation |
| Zang, Y. (2021) [10] | Campus | Effect of obstacles on evacuation | |
| Zhang, X. (2018) [23] | Subway station | Effect of floor plan on evacuation | |
| Liu, Y.Q. (2021) [17] | Subway station | Fire smoke flow simulation | |
| Wang, N. (2021) [19] | Underground shopping malls | Fire safety assessment | |
| Tajima, Y. (2001) [36] | Effect of door size of exit on evacuation | ||
| Weifeng, F. (2003) [37] | Bidirectional pedestrian movement characteristics | ||
| Rostami, R. (2021) [9] | Elementary school | Effect of parameters such as exit numbers on evacuation | |
| Kodur, V.K.R. (2020) [5] | High-rise office building | Effect of stair location on evacuation | |
| Li, J.C. (2022) [34] | Optimal ratio of parameters for convex exit | ||
| Syed Abdul Rahman, S.A.F. (2021) [35] | Campus | Evacuation emergency management | |
| Wang, K. (2019) [29] | Machine learning | Evacuees’ movement pattern | |
| Horii, H. (2020) [30] | Identification of crowd behavior | ||
| Gu, J.L. (2022) [31] | Campus | Emergency management and evacuation simulation | |
| Tkachuk, K. (2018) [32] | Prediction of the evacuation route | ||
| Wang, K. (2023) [21] | Intelligent algorithm | Evacuation route optimization | |
| Deng, H. (2021) [33] | Simulation, machine learning | Campus | Evacuation route planning |
| Guo, K. (2022) [11] | Subway station | Evacuation optimization | |
| Zhong, Y. (2021) [16] | Simulation, intelligent algorithm | Fire emergency lighting distribution |
| Scenarios | Evaluation |
|---|---|
| ASET > RSET | Safe |
| ASET < RSET | Dangerous |
| Temperature (°C) | Endurance Time (min) |
|---|---|
| <60 | >30 |
| 100 | 12 |
| 180 | 1 |
| CO Content (ppm) | Exposure Time | Harm Effect |
|---|---|---|
| 100 | Within 8 h | No feeling |
| 400–500 | Within 1 h | No feeling |
| 600–700 | Within 1 h | Headache, nausea, breathing disorder |
| 1000–2000 | Within 2 h | Consciousness, breathing disorders, coma, die within 2 h |
| 3000–5000 | Within 20–30 min | Death |
| 10,000 | Within 1 min | Death |
| Visibility Threshold (m) | Scenarios |
|---|---|
| 1 | Small spaces |
| 10 | Large spaces |
| Serial Number | Variables | Value Range |
|---|---|---|
| X1 | SFW | [1200, 2850] |
| X2 | SDW | [900, 2550] |
| X3 | CW | [1300, 2950] |
| X4 | RDW | [900, 2550] |
| X5 | LDSF | 0, 1 |
| Serial Number | Algorithms | MSE | RMSE | MAE | R2 | MAPE |
|---|---|---|---|---|---|---|
| 1 | Decision tree | 96.009 | 9.798 | 7.466 | 0.942 | 1.704 |
| 2 | Random Forest | 46.665 | 6.831 | 5.824 | 0.971 | 1.409 |
| 3 | Adaboost | 108.014 | 10.393 | 7.709 | 0.934 | 1.775 |
| 4 | Gradient Boosting Decision Tree (GBDT) | 85.019 | 9.220 | 7.461 | 0.948 | 1.759 |
| 5 | Extra Trees | 64.128 | 8.008 | 6.583 | 0.961 | 1.541 |
| 6 | CatBoost | 99.568 | 9.978 | 7.887 | 0.939 | 1.815 |
| 7 | K-Nearest Neighbor (KNN) | 67.905 | 8.240 | 6.643 | 0.959 | 1.557 |
| 8 | Back-Propagation (BP) neural network | 771.358 | 27.773 | 19.346 | 0.534 | 4.625 |
| 9 | Support Vector Machine (SVR) | 1364.423 | 36.938 | 33.006 | 0.177 | 7.960 |
| 10 | XGBoost | 84.082 | 9.169 | 8.035 | 0.949 | 1.887 |
| 11 | Light Gradient Boosting Machine (LightGBM) | 649.480 | 25.484 | 14.749 | 0.608 | 3.379 |
| 12 | Linear Regression (Gradient Descent) | 775.047 | 27.839 | 19.234 | 0.532 | 4.641 |
| Type | Gender | Ratio (%) | Shoulder Width (cm) | Height (m) | Walking Speed (m/s) |
|---|---|---|---|---|---|
| Youths | Man | 53 | 40 | 1.7 | 1.55 |
| Woman | 37 | 37 | 1.6 | 1.5 | |
| Middle-aged | Man | 5 | 41 | 1.7 | 1.52 |
| Woman | 5 | 38 | 1.6 | 1.4 |
| Type | Parameter Setting |
|---|---|
| RDW (mm) | 1000 |
| CW (mm) | 2160 |
| SDW (mm) | 1#2# staircases 1500 |
| 3#4# staircases 1300 | |
| SFW (mm) | 1#2# staircases 1530 |
| 3#4# staircases 1480 | |
| LDSF | Away from stairwell doors |
| Minimum | Maximum | Average | Standard Deviation | Number of Cases | |
|---|---|---|---|---|---|
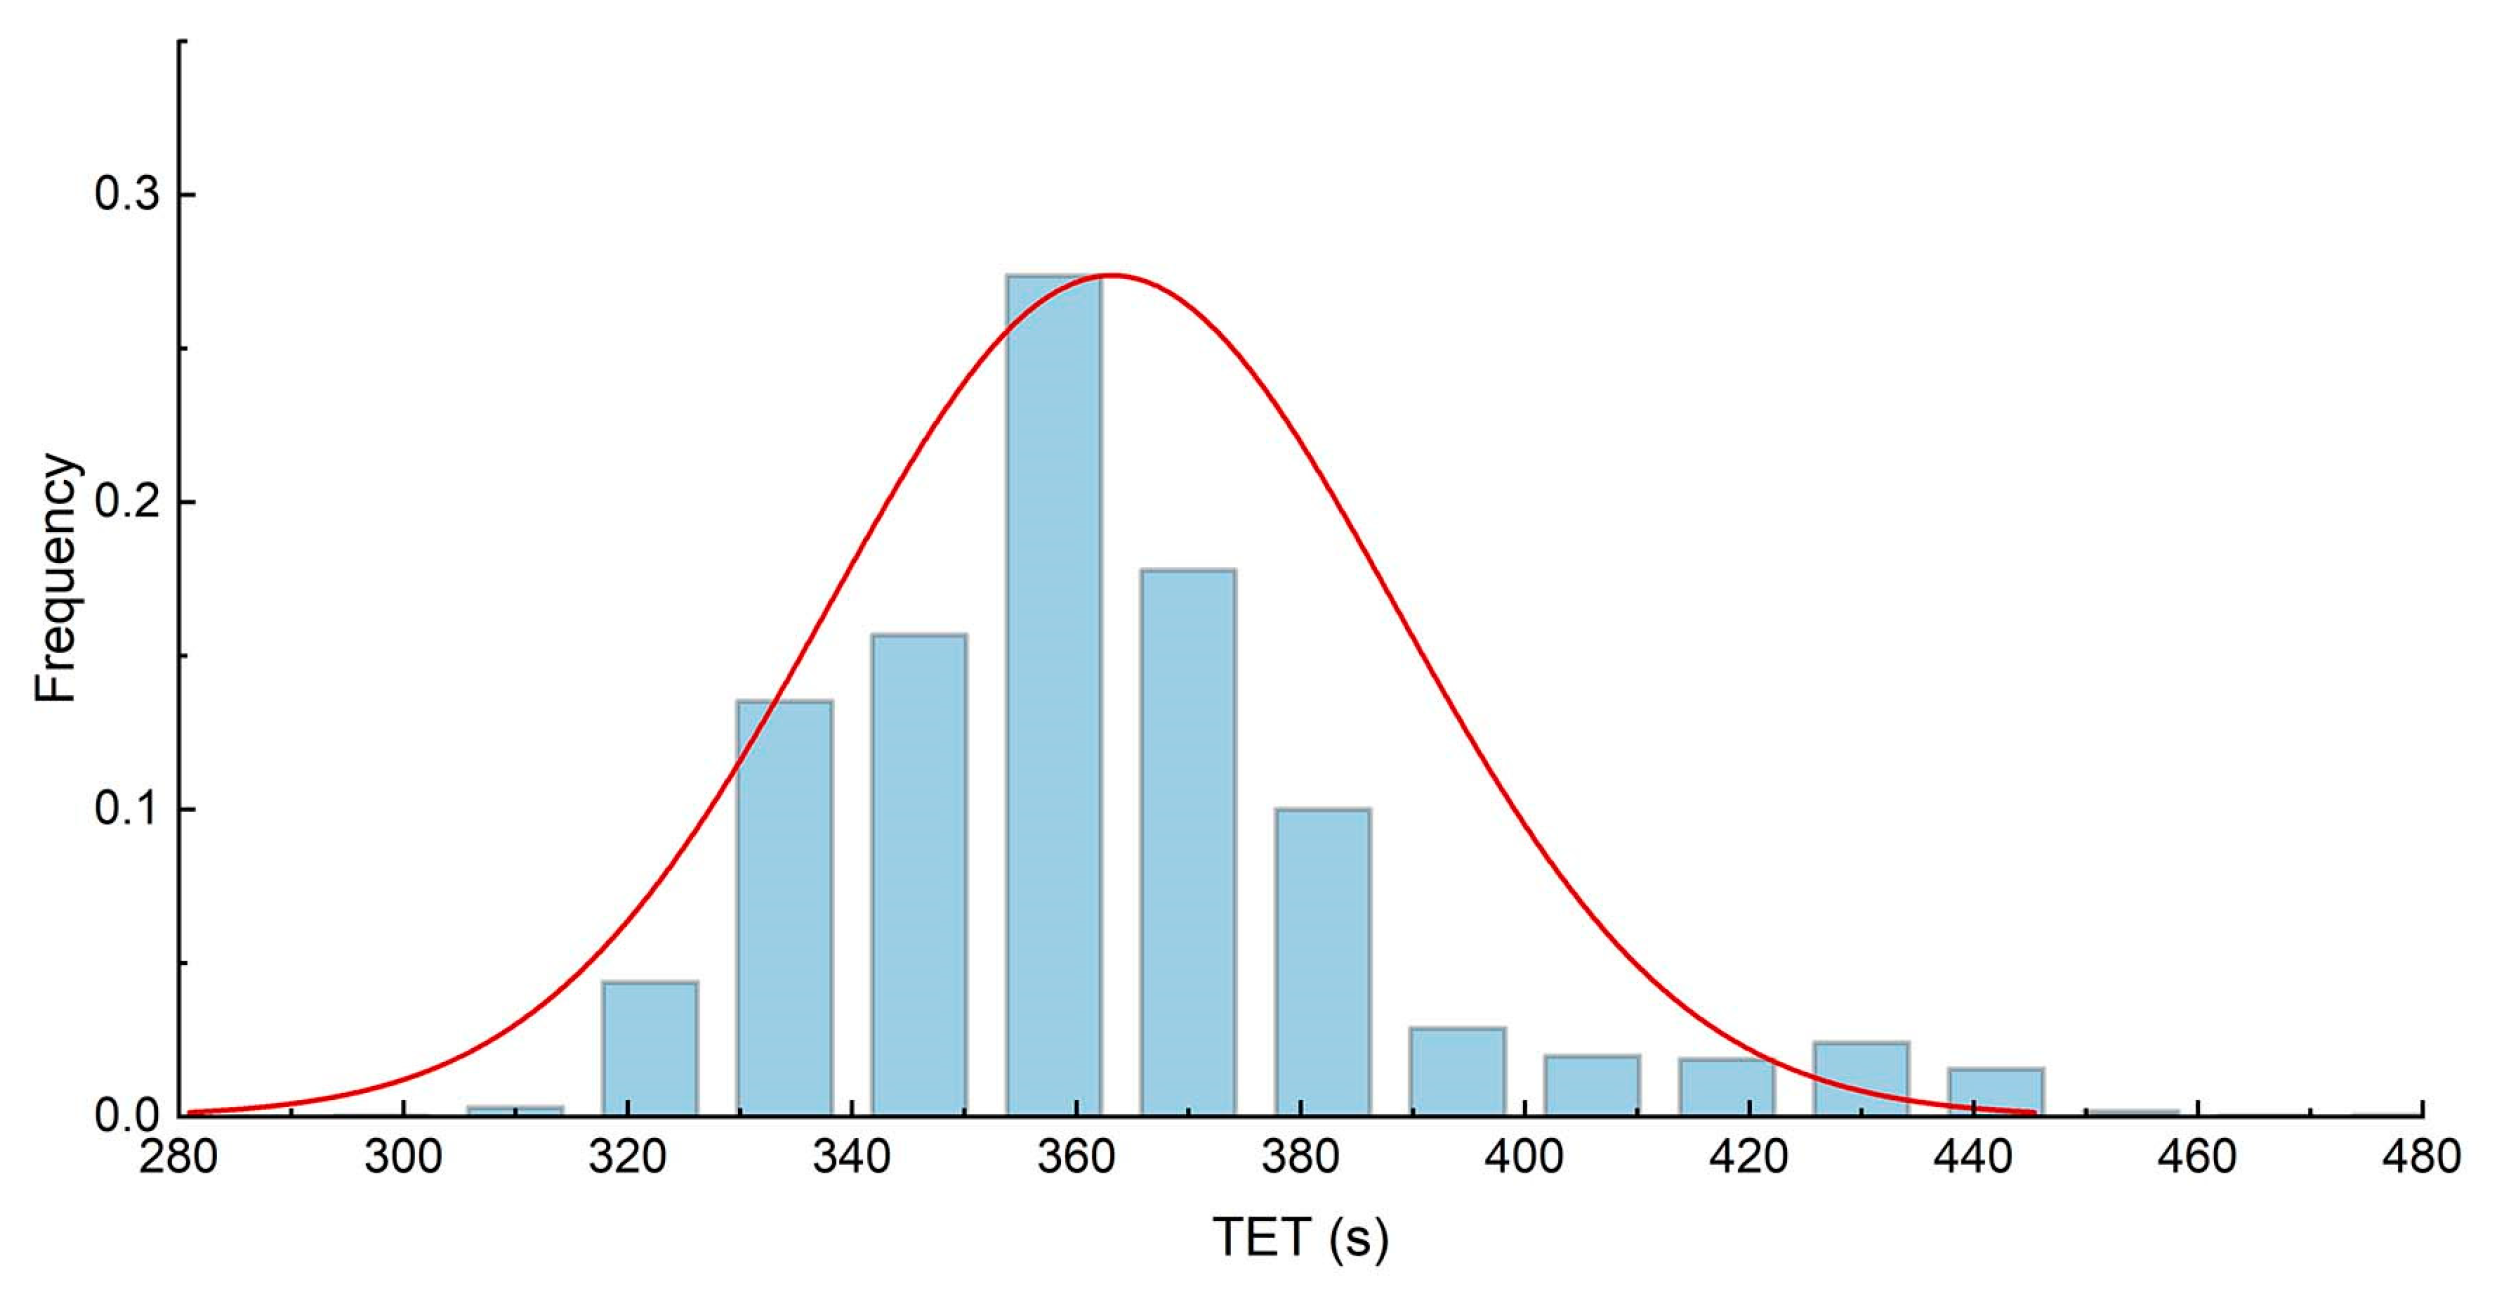
| Predicted value | 297.295 | 402.385 | 363.161 | 17.873 | 4000 |
| Residuals | −51.149 | 87.345 | 0.000 | 17.888 | 4000 |
| Standard predicted values | −3.685 | 2.195 | 0.000 | 1.000 | 4000 |
| Standard residuals | −2.858 | 4.880 | 0.000 | 0.999 | 4000 |
| Serial Number | Variables | Beta | p | VIF |
|---|---|---|---|---|
| 1 | SFW | −0.560 | 0.000 | 1.052 |
| 2 | SDW | −0.444 | <0.001 | 1.017 |
| 3 | CW | −0.030 | 0.007 | 1.008 |
| 4 | RDW | 0.005 | 0.674 | 1.046 |
| 5 | LDSF | −0.089 | <0.001 | 1.030 |
Disclaimer/Publisher’s Note: The statements, opinions and data contained in all publications are solely those of the individual author(s) and contributor(s) and not of MDPI and/or the editor(s). MDPI and/or the editor(s) disclaim responsibility for any injury to people or property resulting from any ideas, methods, instructions or products referred to in the content. |
© 2023 by the authors. Licensee MDPI, Basel, Switzerland. This article is an open access article distributed under the terms and conditions of the Creative Commons Attribution (CC BY) license (https://creativecommons.org/licenses/by/4.0/).
Share and Cite
Zhou, M.; Zhou, B.; Zhang, Z.; Zhou, Z.; Liu, J.; Li, B.; Wang, D.; Wu, T. Fire Egress System Optimization of High-Rise Teaching Building Based on Simulation and Machine Learning. Fire 2023, 6, 190. https://doi.org/10.3390/fire6050190
Zhou M, Zhou B, Zhang Z, Zhou Z, Liu J, Li B, Wang D, Wu T. Fire Egress System Optimization of High-Rise Teaching Building Based on Simulation and Machine Learning. Fire. 2023; 6(5):190. https://doi.org/10.3390/fire6050190
Chicago/Turabian StyleZhou, Muchen, Bailing Zhou, Zhuo Zhang, Zuoyao Zhou, Jing Liu, Boyu Li, Dong Wang, and Tao Wu. 2023. "Fire Egress System Optimization of High-Rise Teaching Building Based on Simulation and Machine Learning" Fire 6, no. 5: 190. https://doi.org/10.3390/fire6050190