Article

The Spatiotemporal Changing Dynamics of Miombo Deforestation and Illegal Human Activities for Forest Fire in Kundelungu National Park, Democratic Republic of the Congo

by
Yannick Useni Sikuzani
1,
Médard Mpanda Mukenza
2,*,
François Malaisse
3,
Paul Kazaba Kaseya
1 and
Jan Bogaert
3
1
Ecology, Ecological Restoration and Landscape Research Unit, Faculty of Agricultural Sciences, Université de Lubumbashi, Lubumbashi P.O. Box 1825, Democratic Republic of the Congo
2
Department of Renewable Natural Resources Management, Faculty of Agricultural Sciences, Université Technologique Katumba Mwanke, Lubumbashi P.O. Box 74, Democratic Republic of the Congo
3
Biodiversity and Landscape Unit, Université de Liège-Gembloux Agro-BioTech, 5030 Gembloux, Belgium
*
Author to whom correspondence should be addressed.
Fire 2023, 6(5), 174; https://doi.org/10.3390/fire6050174
Submission received: 21 March 2023 / Revised: 17 April 2023 / Accepted: 21 April 2023 / Published: 23 April 2023

Abstract

:
In the Kundelungu National Park (KNP), southeast of the Democratic Republic of Congo, illicit human activities including recurrent bushfires contribute to constant regression of forest cover. This study quantifies the landscape dynamics and analyses the spatio-temporal distribution of bushfire occurrence within KNP. Based on classified Landsat images from 2001, 2008, 2015 and 2022, the evolutionary trend of land cover was mapped and quantified through landscape metrics. The spatial transformation processes underlying the observed landscape dynamics were identified based on a decision tree. Finally, the spatio-temporal fire risk assessment was carried out after defining the burnt areas for each year between 2001 and 2022. The obtained results, expressed by the process of dissection and attrition of patches, show that the forest cover has regressed from 2339 km2 to 1596 km2 within the PNK, with an annual deforestation rate varying from 0.8% to 3.4% between 2001 and 2022. Over the same period, the average distance between forest patches has increased significantly, indicating fragmentation and spatial isolation. On the other hand, savannahs as well as field and fallow mosaics have expanded within KNP through the creation of new patches. In addition, several active fires affected more savannahs between 2001 (70 km2 in Integral Zone, 239 km2 in Annex Zone and 309 km2 in KNP) and 2022 (76 km2 in Integral Zone, 744 km2 in Annex Zone and 819 km2 in KNP), limiting their capacity to evolve into forests. Overall, anthropogenic pressure is higher in the Annex Zone of the KNP. Illegal agricultural development and vegetation fires have thus doubled the level of landscape disturbance in 21 years. Our observations justify the need to strengthen protection measures for KNP by limiting repeated human intrusions.

1. Introduction

Degradation and loss of forest ecosystems remain among the challenges associated with environmental and natural resource management [1,2]. In the tropics, the area of forest ecosystems has declined from 19.65 million km2 in 1990 to 17.70 million km2 in 2015 [3] because of land use and land cover changes to meet various human needs [4,5]. Unlike other tropical areas, in Africa, it is generally small-scale processes that drive regional deforestation and forest degradation [6]. Such processes include slash-and-burn agriculture [7]. As a result, nearly 60% of the land brought under cultivation in Africa in the 1980s and 1990s was previously intact forest [8]. Moreover, slash-and-burn agriculture is a degradation process characterized by increasingly short fallow periods [6] and reinforced by the untimely use of fires as the main means of opening the fields of a peasant population living in extreme poverty [9,10,11]. Without question, these bush fires contribute massively to the reduction of vegetation cover in general and to the destruction of woody resources [12].
In Central Africa, the area of evergreen and semi-deciduous forests was estimated to be approximately 200 million hectares in January 2020, of which nearly 10% showed visible signs of disturbance [13]. These disturbances, generally of anthropogenic origin, reduce the capacity of forest ecosystems to provide ecosystem services such as carbon sequestration, biodiversity conservation, climate regulation and water cycling [14,15,16]. Consequently, in Central Africa deforestation has led to the disappearance or rarefaction of a significant number of plant species [17]; however, anthropogenic pressure on forest resources varies with forest type, among other things. Ref. [18] agrees that rates of loss of evergreen forests (−0.2% per year) are lower than rates of loss of miombo forests (−2.3% per year), an ecosystem composed mainly of species belonging to the genera Brachystegia, Julbernardia and Isoberlinia [19,20].
The Democratic Republic of Congo (DRC) is the country in Africa with the largest remaining area of undisturbed tropical rainforest (105.8 million ha), despite having experienced a decline in forest cover of around 1.4 million ha/year between 2000 and 2019 [13]. Supported by significant population growth, the average annual rate of deforestation in the DRC has doubled from 0.11% between 1990 and 2000 to 0.22% between 2000 and 2005 [21], leading to an erosion of biodiversity [22,23], including in southern Katanga where the state of miombo forests remains critical. This is partly due to the intensity of mining activities and the extent of (peri-)urbanization [24,25,26] accompanied by high energy and agricultural commodity needs [27,28].
To reduce the pressure on forests, about 11% of the Congolese territory consists of protected areas, and this proportion is expected to increase to 15% in the coming decades [29]. Among these protected areas, national parks have been demarcated for the purpose of ecosystem protection/conservation and recreation [30]; however, due to weak law enforcement, protected areas are subject to strong anthropogenic pressures [13,31,32]. Although forest cover loss is relatively low in protected areas, gross forest loss in protected areas increased by 64% between 2000 and 2010 compared to the 2000–2005 period in these conservation tools [21]. For example, the annual deforestation rate doubled from 0.18% during 1986–2003 to 0.38% during 2003–2016 in Yangambi Biosphere Reserve [29], while miombo cover, which was 85.3 km2 in 1979, dropped to 11.2 km2 in 222,018 in Lufira Biosphere Reserve [33].
Kundelungu National Park (KNP), located in Haut-Katanga province, is one of the most threatened protected areas in the DRC. It consists of an Integral Zone (IZ) of 220,000 ha, an Annex Zone (AZ) of 540,000 ha and a buffer zone with a radius of 50 km [34]. In the Strict Nature Reserve, apart from sightseeing, all human activity is prohibited. The surrounding area, however, is inhabited and people live and fish there [35]. Although KNP staff may have an acceptable level of expertise to enforce the protected area regulations, insufficient equipment and financial means make their surveillance ineffective [35]. Additionally, the boundary of KNP, although known to the management authorities and neighbouring land users, is not adequately marked in some places, especially as the markings have never been maintained since they were first placed [34]. As a result, local people regularly enter KNP to carry out various activities, including poaching, farming, and fishing, in an illegal manner [34]. It should be noted that poaching and agricultural exploitation, carried out illegally, are often preceded by bushfires. Agricultural clearing fires are more widespread. Machetes are used to clear the space for cultivation and the plant biomass is burnt. It is considered necessary in areas of new agricultural clearings because it enriches the soil with ash and thus improves agricultural fertility and cleans the soil of various plant pests. As for hunting fires, which cause significant material and sometimes human damage, they are practiced repeatedly in the same areas throughout the dry season.
Although KNP has already been the subject of a few scientific studies, notably on human–wildlife interactions [36], little information exists to date on the state of its natural ecosystems. In this context, quantifying the dynamics of its landscapes seems very timely to shed light on the ecological processes taking place there, which is crucial to guide decision-makers and its managers. Given that land-use change due to the repeated intrusion of riparian populations into KNP can occur at different spatio-temporal scales, it is relevant to use remote sensing and geographic information systems (GIS). These tools are known to be effective for monitoring phenomena that can be observed at different spatio-temporal scales, such as deforestation [37]. Applied as a complement, landscape ecology analysis tools allow for a better appreciation of the ecological processes underlying the spatio-temporal dynamics of anthropogenic effects on natural landscapes [38].
The present study aims to assess the impact of illicit anthropogenic activities on the spatio-temporal dynamics and stability of forest ecosystems within KNP. We verify the hypothesis that, due to illicit agricultural development, forest ecosystems have lost their coverage in the landscape because of fragmentation and spatial isolation of patches. In addition, the recurrent passage of wildfires limits the capacity of savannahs to evolve into forest ecosystems.

2. Materials and Methods

2.1. Study Area: Kundelungu National Park

With the extent of 760,000 ha, KNP is located between 9°24′8.85″ and 10°58′54.67″ south latitude and between 27°15′11.94″ and 28°2′5.53″ east longitude, at an altitude that varies between 1200 and 1700 m. KNP is totally located in the territory of Kasenga, while the annex area is entirely in the territory of Mitwaba in the Upper Katanga province (Figure 1). KNP has a dry tropical climate of type Aw5 according to the Köppen classification system, characterized by a rainy season from November to March. The dry season occurs from May to September and is separated from the rainy season by two transition months (April and October) according to ref. [39]. The temperature fluctuates between 16 and 33 °C with an annual average of 20 °C, while the average annual rainfall is around 1300 mm [40,41]. Established on Ferralsols, KNP is part of the Zambezian centre of endemism [42]. Its vegetation is composed of not only high-altitude savannahs (>1200 m) but also of open miombo forest [35,43]. Animal species found are, among others, warthogs (Phacochoerus africanus), bushpigs (Potamochoerus sp.), bushbucks (Tragelaphus scriptus), oribis (Ourebia ourebi), buffaloes (Syncerus cafer), sable antelopes (Hippotragus niger), common hippopotamus (Hippopotamus amphibius), etc. [34]. Within the KNP, there is a network of rivers which shelters some spectacular waterfalls (e.g., the Lofoï). Around the park and in its adjoining area there are a few villages with at least 3500 inhabitants each. Local communities live mainly off agriculture [36], but also off hunting, fishing, and charcoal production, including within the KNP [34].

2.2. Landsat Images and MODIS 6 (MCD64A1)

To cover the whole of KNP and its near periphery, 11 Landsat image scenes (30 m spatial resolution) taken during the full dry season were acquired from the EarthExplorer platform (http://glovis.usgs.gov.com (accessed on 7 August 2022), with a time step of 7 years (Table 1). This choice was dictated by availability and low cloud cover [44,45,46,47]. In addition, these images allow for the monitoring of the state of forest ecosystems during the post socio-political conflict period in the region (2001–2008), the post global economic crisis period (2008–2015), as well as the period during which KNP has received more support from foreign partners to improve its governance (2015–2022). Furthermore, MODIS (Moderate-resolution Imaging Spectroradiometer) data collected for each year (between 2001 and 2022) in the middle of the dry season, with a spatial resolution of 500 m on https://search.earthdata.nasa.gov/ (accessed on 17 March 2023), were used to analyse vegetation fires in the KNP.

2.3. Image Pre-Processing and Classification

Radiometric correction of the images, based on the application of the gap mask [48], removed scan line errors on Landsat ETM+ (Enhanced Thematic Mapper Plus) images, under ENVI 5.3 software. Subsequently, Landsat image mosaics were created (with three scenes per image) to cover the entire KNP. In addition, an unsupervised classification of Landsat images (2001, 2008, 2015 and 2022) was carried out in ArcGIS 10.8 using false colour composition from the mid-infrared, near-infrared and red bands to better discriminate the vegetation [49]. From this unsupervised classification, a visual interpretation was used to identify the land cover classes within KNP [46]. Training data were identified through visual interpretation on Landsat images and supported by higher resolution images in Google Earth.
A supervised classification supported by the maximum likelihood classifier was subsequently applied to each Landsat image [50]. This classification was supported on 160 training areas collected in the study area in the middle of the dry season of the year 2022, using a GPSMAP 64st Garmin (accuracy of about 3 m). The various field missions in 2022 have been decisive, especially for the for the classification of the Landsat images of 2001, 2008 and 2015. Indeed, the verifications and observations of local populations and KNP resource persons made it possible to correct the supervised classifications. Consecutively, five land cover classes, corresponding to the main land cover of the region, were selected on the basis of the objective of this study (Table 2). In order to avoid the phenomenon of mixed pixels with regard to the spatial resolution of the Landsat images used, some land cover classes were merged due to their radiometric similarity. Finally, a 3 × 3 majority filter was applied to the classified land cover data to reduce the salt-and-pepper effect.
In addition, another 150 geographical coordinates were collected in the field, independently of those used for the supervised classification, to construct the confusion matrix. From this matrix, the overall accuracy and the Kappa index were calculated to test the reliability of the supervised classifications [51,52,53,54]. Both indices are reliable measures in the evaluation of thematic classifications [54].

2.4. Characterisation of Landscape Dynamics and Active Fires in KNP

The impact of human activities on the morphology of the KNP landscape was highlighted by calculating seven landscape metrics under Fragstats 4.2 software. At the land cover level, the class area (calculated at the scale of KNP, the Integral Zone and the Annex Zone), the average area, the number of patches, the fractal dimension, the largest patch index and the average Euclidean distance to the nearest neighbor (at the scale of KNP) were determined. These metrics provide information on the fragmentation of patches within a class, especially when the area decreases, the number of patches increases, the complexity of the patch shape is simplified and the average distance between two patches increases [55,56]. Additionally, the average area will be high in a low-disturbance landscape when the patches of a land cover class are large, spacious and fewer in number [57]. At the landscape scale, a disturbance index, defined as the ratio of the cumulative area of anthropogenic classes in the landscape to the cumulative area of the natural class [55], was calculated to better assess the level of anthropisation within KNP.
Furthermore, the spatial transformation processes underlying the spatio-temporal dynamics of land cover classes were identified using a decision tree [56]. This decision tree algorithm enables detection of these processes based on three parameters that have to be determined before and after the transformation of the landscape: area, perimeter and number of patches of the focal landscape class [56]. Then, the change in each of the three characteristic parameters is used to arrive at one of the following 10 spatial transformation processes: aggregation, creation, displacement, enlargement, attrition, deformation, dissection, fragmentation, perforation and shrinkage. To dissociate the process of fragmentation from that of dissection, a value of t, derived from the ratio of the total area of a land cover class at the final date to that at the initial date, was compared with the threshold of t = 0.75. Values above 0.75 suggest dissection, while those below or equal to 0.75 indicate the prevalence of fragmentation [58]. To characterise the rate of deforestation within KNP, an annual deforestation rate was calculated using the equation proposed by [59].
Finally, the impact of vegetation fires on the landscape dynamics of the KNP was highlighted on the one hand by the elaboration of estimation maps and on the other hand by the monitoring of the spatio-temporal evolution of burnt areas [60]. The spatial-temporal analysis of the fires was carried out using ArcGIS 10.8 software, i.e., spectral extraction of fire values from MODIS images and removal of pixel values containing information other than fire (i.e., unburnt areas) [61]. Indeed, the MODIS data over the period of one month are presented as a series of elementary images described by several pieces of information including: unburned, approximate days of fire corresponding to the Gregorian calendar, snow or high aerosol, continental water, marine water (sea and ocean) and unclassified because not enough data. Thus, the further processing in this study was only concerned with pixel values between 1 and 366 that provide information on fires [62]. To maximize the detection probability, we kept the fire pixels with high and low detection confidence levels, excluding the fire pixels that were mapped on agricultural areas, as recommended in the product documentation [61]. In addition, using the shapefile, the KNP area was clipped onto the MODIS map layers. This provided the first statistics on burnt areas and maps of the spatial distribution of fires [63]. Subsequently, the cropped images were first projected in UTM 35 S projection (corresponding to the study area), before being vectorised (transformation from hdf to shp format), while keeping the pixel size at 500 m.
The final step in processing the burnt-area time series was to perform a spatial and temporal aggregation of the pixels to generate annual databases consisting of single fire events in the study area [64]. Thus, consistent fire events were formed based on 2 fundamental rules [64]; namely, (1) pixels should be directly adjacent to each other or at a maximum distance of 1 pixel to minimize inaccuracies due to coarse spatial resolution of the sensor, such as partial burns (spatial rule); and (2) pixels should have fire dates at a maximum temporal distance of 16 days. This rule is based on the accuracy interval of 8 days before and after the detection date specific to the product algorithm (Time Rule). Furthermore, to assess the impact of fire insurance on landscape composition, the burnt area and land cover maps in KNP were overlaid for each year (2001, 2008, 2015 and 2022) on ArcGIS 10.8 software. Subsequently, on the same software, the burnt areas per year in each land cover class were extracted by using their respective polygons.

3. Results

3.1. Classification and Mapping

Supervised classification of the Landsat images used for land cover mapping in KNP revealed overall accuracy values of 92.44%, 92.44%, 94.22% and 99.11% for each of the classified images, and Kappa values of 0.90, 0.91, 0.93 and 0.97 for the years 2001, 2008, 2015 and 2022, respectively (Table 3). This suggests statistically reliable discrimination between land cover classes; however, some confusions, most importantly between the savannah class and the rest of the land cover (except for the water and wetlands class, Pr = 100%), were noted. Furthermore, on the land cover maps of KNP derived from the supervised classification of Landsat images, considerable changes were noted between 2001 and 2022, characterized mainly by the progressive spatial evolution of savannahs and the mosaic of fields and fallows to the detriment of forest, which recorded a regressive spatial dynamic (Figure 2). For the rest of the analysis, the land cover classes including ‘water and wetlands’, ‘built-up and bare soil’ and ‘other land cover’ were excluded from the analyses, in view of their relative stability in the landscape, except for the calculation of the disturbance index.

3.2. Landscape Composition Dynamics

Over the entire period between 2001 and 2022, forests have lost their cover to anthropogenic land cover classes at the scale of KNP in both its constituent zones: the IZ and the AZ (Figure 3). In the evolution of land cover, forests are tending to disappear, particularly in the AZ, where they remain very poorly represented in terms of proportion. Conversely, over the same period, savannahs and the mosaic of fields and fallow have increased considerably in scale in KNP and in the AZ; however, in both zones, the evolution of savannahs has undergone a transition period (2008–2015) marked by a drop in area. Even so, this periodic loss of savannah area has only slowed down the growth of the class without reversing the trend. On the other hand, in the IZ, the savannahs have also increased their area between 2001 and 2022 unlike the fields and fallows, which fell significantly in area and remained relatively small.
Three main trends can be noted: deforestation in all areas of KNP, with a trend towards complete disappearance in the AZ; savanization in all areas of KNP; and finally, agricultural development throughout KNP and the AZ, as opposed to a trend towards the abandonment of agricultural activities in the IZ.

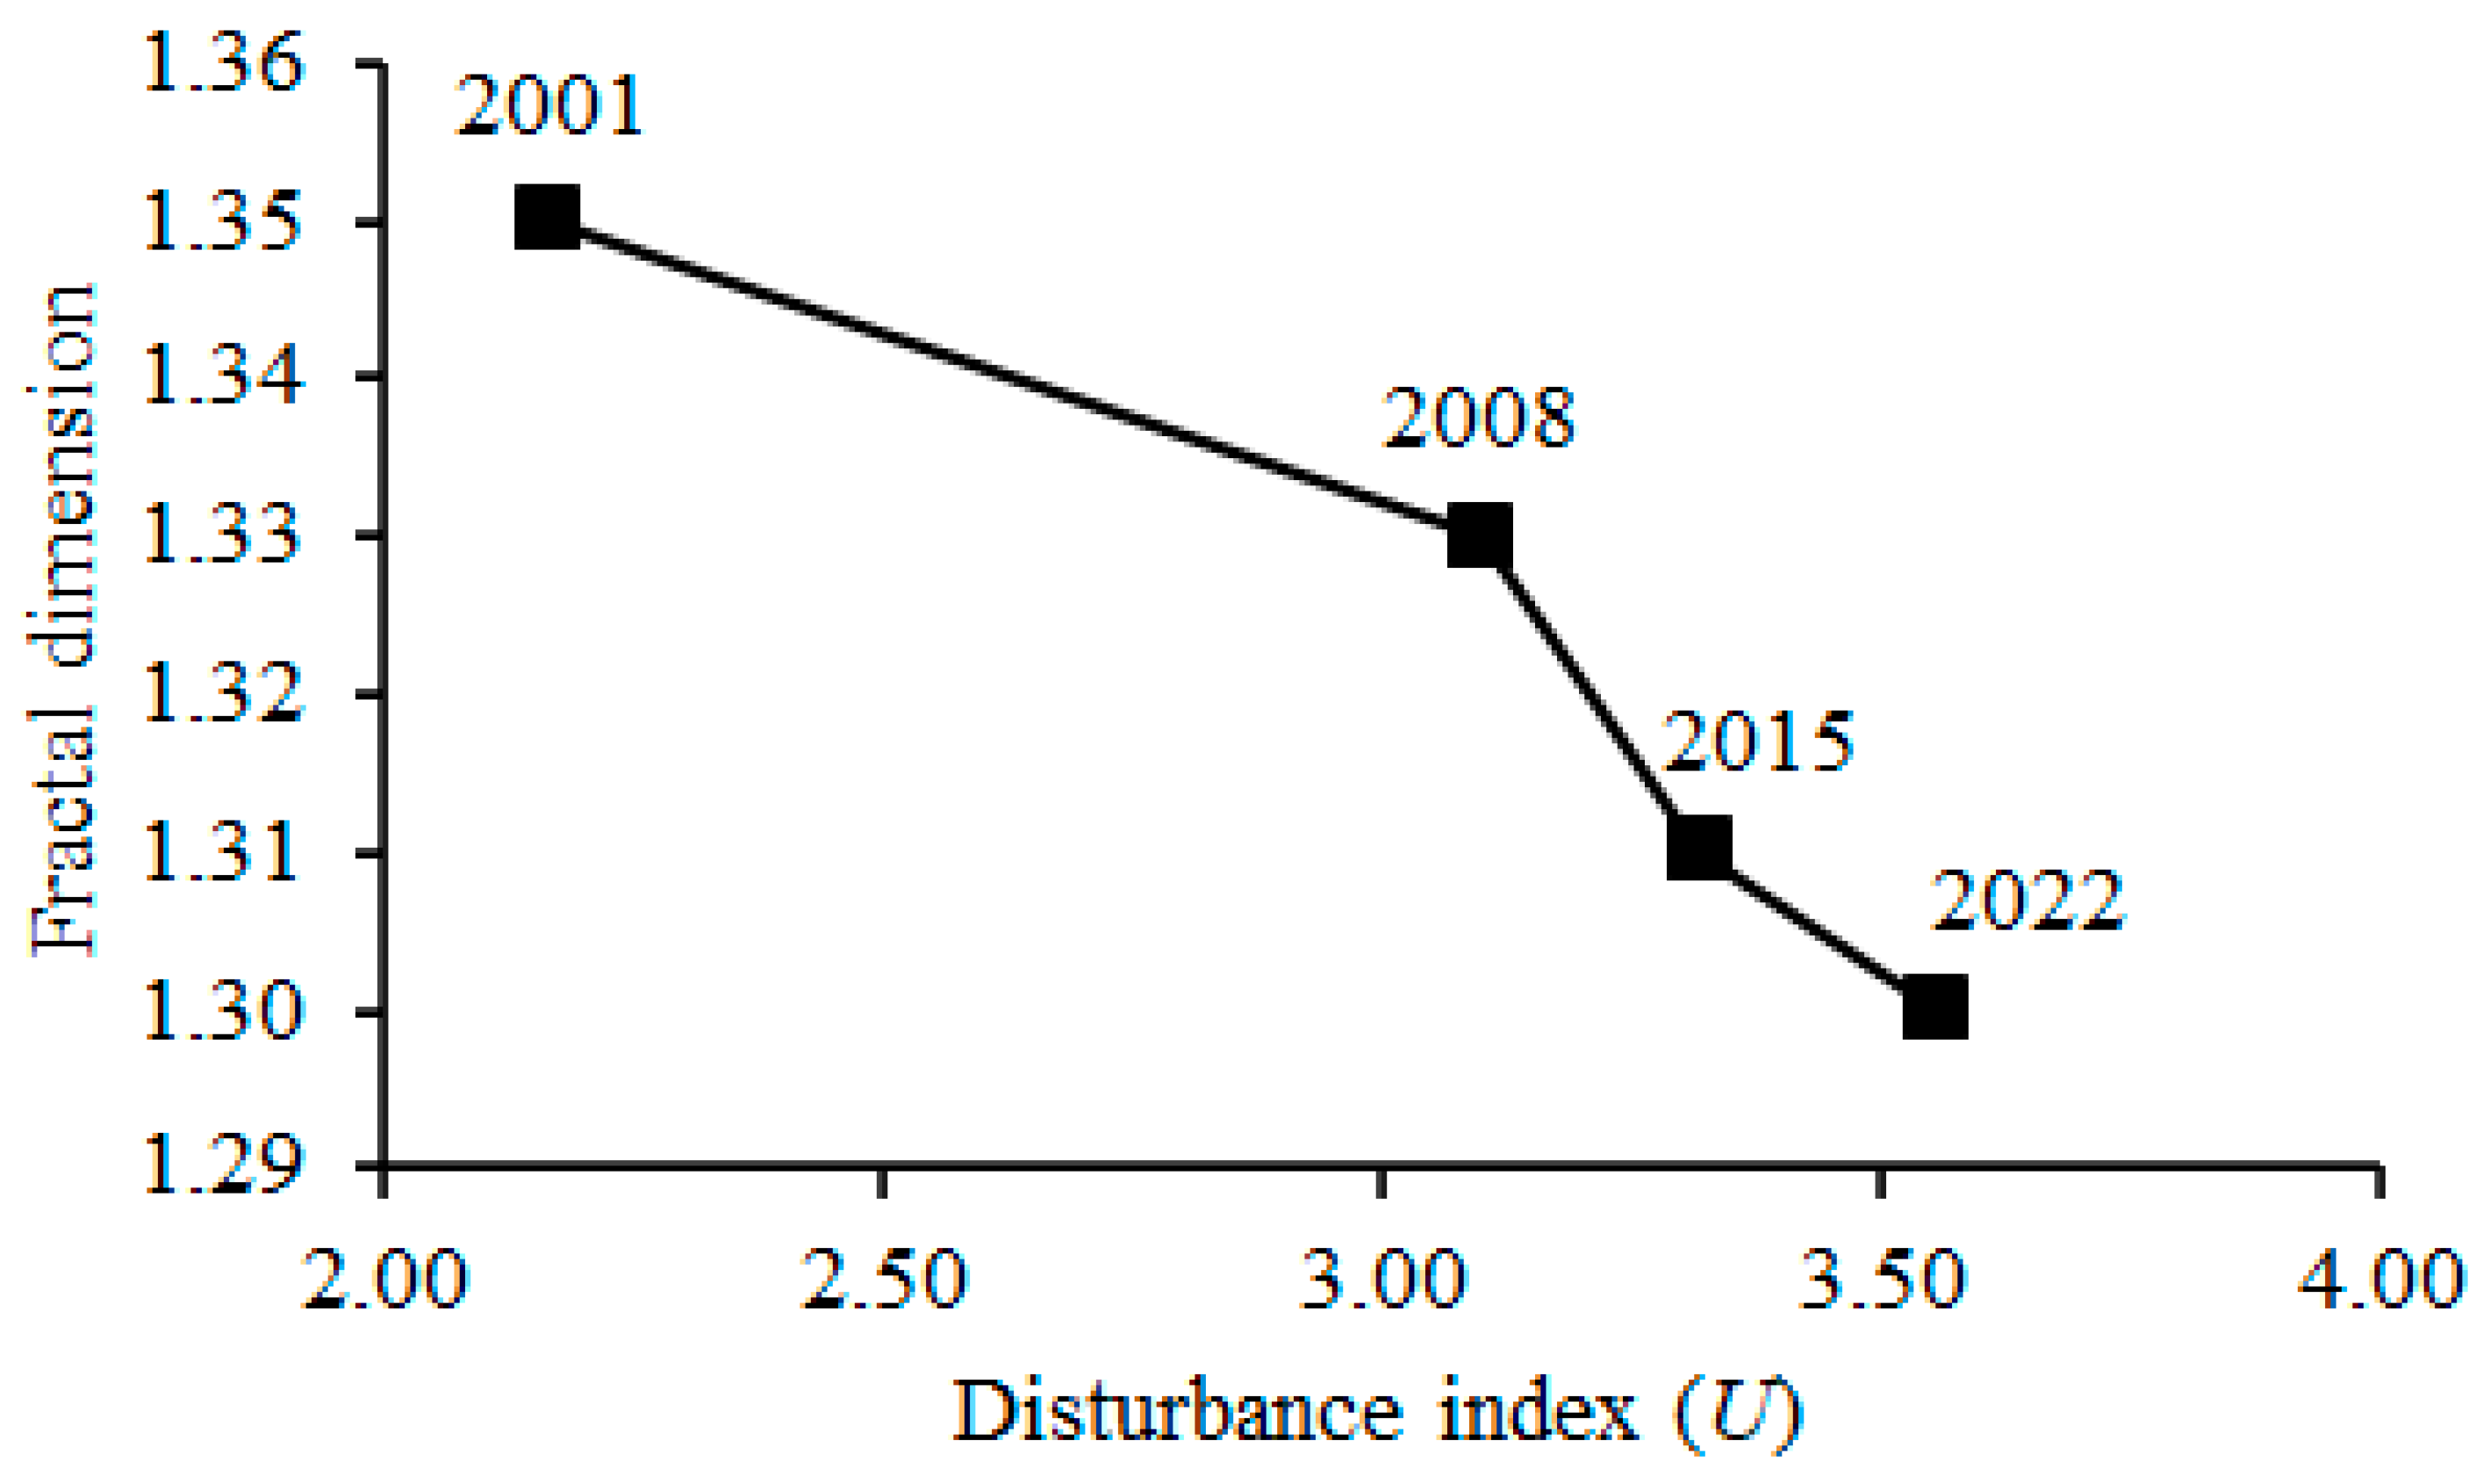
3.3. Land-Cover Pattern Dynamics and Quantification of the Level of Disturbance

Between 2001 and 2022, large forest patches have increased in importance because of the gradual disappearance of the small patches, which is reflected in the increase in the largest patch index value and the average area (Table 4). Furthermore, within KNP, the average distance between forest patches has continuously increased from 138.43 m to 169.41 m between 2001 and 2022, suggesting a trend towards fragmentation and spatial isolation of patches. These results are corroborated by the fact that during the periods between 2001 and 2022, forests recorded the processes of attrition and dissection of patches (tobs 0.92 > 0.75) materialized by the continuous loss in class area in parallel with the decrease (2001–2008 and 2008–2015) and increase in the number of patches (2015–2022) (Table 4). For savannahs, the average area of patches remained almost stable between 2001 and 2022, while the largest patch index value decreased from 84.54% to 62%, reflecting a relative increase in the size of small patches in the landscape. Indeed, the class area of savannah patches increased (2001–2008 and 2015–2022) in parallel with the increase in the number of patches, suggesting a process of patch creation. Between 2008 and 2015, a decrease in class area in parallel with an increase in the number of patches was recorded. This is an indication of patch dissection (tobs 0.77 > 0.75). As for the fields and fallows, they experienced stability in the average patch area and largest patch index values within KNP. In addition, the mosaic of fields and fallows has experienced the process of creation over all the periods observed between 2001 and 2022 because of the continuous increase in their class area and number of patches.
Finally, the increase in the level of disturbance in KNP almost doubled between 2001 and 2022, from 2.17 to 3.56, leading to a trend towards a decrease in the complexity of forest patch shape (Figure 4). This suggests that forest patches are shrinking in area and becoming increasingly compact. The higher values of the fractal dimension index correspond to lower values of the disturbance index within KNP and vice versa. This makes the effect of anthropisation of the landscape more obvious.

3.4. Spatio-Temporal Distribution of the Vegetation Fire within the KNP

The annual distribution (Figure 5 and Figure 6) of burned areas within KNP, the IZ and the AZ in the four years (2001, 2008, 2015 and 2022) was not homogeneous (CV ˃ 30%). KNP had large areas burned (819 km2) in 2022, compared to 2001, which showed only 309 km2 of burned land. In 21 years, the annual area burned within KNP has more than doubled. The accumulation of burned areas has occurred mainly on the periphery of the AZ in contrast to the IZ, where it has occurred more in the centre, most notably in 2008.
Between 2001 and 2022, apart from the IZ, where burnt areas decreased and then almost stabilized, burnt areas have steadily increased in size from 239 km2 to 744 km2 in the AZ. This suggests that the extent of burned areas in this part of KNP has tripled in 21 years. It should also be noted that the presence of fires in KNP has disturbed the balance of forest ecosystems by preventing their regeneration from savannahs. Overall, between 2001 and 2022, large areas of land are burning in KNP every year. Similarly, all land cover types are burnt each year, with a much higher frequency in the savannahs, where the area burnt has increased considerably, from 95 km2 in 2001 to 395 km2 in 2022 (Figure 7). It should be noted that during this same period, the whole of KNP and the AZ experienced a progressive dynamic of savannah and mosaic of fields and fallows while losing forest areas (Figure 2). Our results suggest that fires have two origins in the study area: agriculture in forest ecosystems to open fields and hunting in the savannahs.

4. Discussion

4.1. Methodology

Despite their coarse spatial resolution, Landsat images are suitable for large-scale studies as they provide a global view of the entire landscape [9,28,65]. In the context of the Katangan Copper Arc region (southeast of DR Congo), the use of Landsat images helped to highlight the main landscape dynamics, namely peri-urbanization, deforestation, savanization and agricultural development [9]. Moreover, the time step between images (7 years, less than 10 years) is acceptable for analysing land cover change in areas subject to rapid change [66]. Spatial changes and transformation processes within KNP have been also highlighted by the calculation of spatial structure indices, which are recognized as reliable indicators for assessing human impact on the observed landscape morphology [56,67]. In addition, MODIS data were used to assess the risk of vegetation fires. This collection has already led to a better detection of small fires, a significant reduction of unmapped areas and a reduction of the temporal uncertainty of the fire date [68,69].

4.2. Illegal Human Activities, Bushfire Dynamics and Deforestation of Miombo in KNP

The results of our study reveal continued deforestation in KNP, which is much more marked in its Annex Zone, where there is a clear tendency of forests disappearance. The IZ is also not spared from this scourge. The annual deforestation rate for KNP is estimated at 3.4% between 2001 and 2008, 0.8% between 2008 and 2015, and 1.2% between 2015 and 2022. Overall, these deforestation rates are much higher than the estimated national deforestation rate of 0.2% [3,21,70]. This may be explained by the development of illicit anthropic activities within the study area (KNP) coupled a poor management. Furthermore, according to Potapov et al. [21], the rate of deforestation depends on environmental factors in interaction with the society [67]. Indeed, most protected areas in DR Congo do not have a very strong conservation status and are regularly subject to illegal exploitation [21]. In addition, as its periphery is still occupied by villages, KNP has been subject to various anthropogenic pressures since its creation [36]. The main activities of the population in the neighbouring villages are in fact based on agriculture, hunting, gathering, and logging. In the region, it is well established that most charcoal cuts are clearcuts, with only 22% of respondents recognized to proceed by select species. Wood cutting is selective for wood used in construction and for making tools [71]. Forest resources also provide non-timber forest products commonly consumed in villages (fruits) or used in traditional medicine. They are also a complementary source of income to the sale of agricultural products for local communities. In the same line of thoughts, ref. [72] revealed that charcoal production (40%) and fuelwood production (32%) are the main drivers of deforestation and miombo degradation in the Dzalanyama Forest Reserve in Malawi. In addition, the proximity of KNP to National Road 5 is also a non-negligeable factor in the anthropisation of its landscapes, particularly as conditions are favourable for the sale of forest products collected by local communities [20,26,46,73]. The multiple and repeated intrusion of local populations into the forests for various activities, notably timber cutting, and agriculture [9,19], has as a major consequence the regression of the forests. In Zambia, ref. [74] also recognized the importance of major roads alongside protected areas in the process of degradation of their natural resources.
In addition, the poor socio-economic situation of local people in the region can also account for the regressive trend of forest ecosystems. Indeed, local communities hardly get good yields of the main crops in their family farms, while their daily income is below USD 1.25 per day [75].
Results revealed higher proportions of forests declined between 2001 and 2008, which is the post-conflict period in the region [76], characterized by a decay of economic conditions in the region. Additionally, during this period, the populations therein were fighting for their subsistence in a deleterious economic context with little concern for the sustainability of resources [77]. A significant loss of miombo cover was noted in the same region by ref. [33] and over the same period (1998–2008) within the Lufira Biosphere Reserve. In the same way, the work of ref. [78] on the Mont Péko National Park in Côte d’Ivoire identified the conflict as a major driver of forest-area decrease, with the situation being accentuated in the post-conflict period when populations seek to reconstitute themselves. The post-conflict assessment of the state of the classified forest of Haut-Sassandra in Côte d’Ivoire also revealed a regression from 37,749 hectares in 2001 to 7844 hectares in 2013 (i.e., 79, 22% regression) as opposed to the areas of fallow-crop mosaics that, rather, increased from 9910 hectares to more than 36,374 hectares in the same period [79].
The results of our study further revealed that despite the loss of forest and the increase in savannah space observed in the IZ of KNP, fields and fallow land have dropped significantly in area in this zone and have remained relatively low (between 2001 and 2022), compared to the AZ. This is justified by the fact that more attention is paid to the IZ than to the AZ, where human activities are allowed until now, whereas all human activities are prohibited in the IZ apart from sightseeing tourism and research [34,35].
Overall, the analysis of the results suggests a conversion of forest areas to non-forest, mainly savannahs and the field and fallow mosaic that have increased their hold on the landscape. In the KNP context, due to the poor monitoring and management system, there is recurrent intrusion of farmers for collection timber and other forest products, as well as farming and hunting. Over several years, these activities have led to significant savanization in the park, confirming the conclusions of ref. [19] that the importance of savannahs increases with the level of anthropisation of the landscape in southern Katanga.
Although it is recognised that perforation comes before dissection, followed by shrinkage or fragmentation when a natural landscape undergoes anthropisation [80], our analysis of structural dynamics within KNP between 2001 and 2022 gave the opposite result, probably due to the difference in spatial scale and time step [49]. In the context of KNP, forest loss was driven by patch removal and dissection, corroborating the results of ref. [54] in the same area. The low rate of deforestation observed between 2015 and 2022 is due to the unification of KNP with Upemba National Park (UNP) to improve management. In the period of socio-political instability in Burundi, for example, the limitation of the anthropic effect linked to the delimitation of the Bururi forest reserve, coupled with the increase in the number of forest guards, would have influenced the gain in forest area and perimeter observed between 2001 and 2011. Similarly, the involvement of local populations in forest protection could have further limited human pressure, thereby favouring the regeneration of degraded areas [81]; however, the project that led to this merger was only of short duration (2017–2020), hence, we cannot rule out the possibility of increased human pressure on this park in the coming decades [67].
Furthermore, because of anthropogenic activities in the study area, the average distance between two neighbouring forest patches increased from 138.43 m in 2001 to 169.41 m in 2022 (a difference of 30.98 m). Furthermore, the shape index calculated for the forest patches revealed a simplicity of their shape, which at the same time reflects their disturbance. In this respect our results follow the same trend previously reported in the Babagulu Forest Region in DR Congo [45] and in the Sudanese zone in northern Benin [50].
KNP is regularly subject to active vegetation fires during the dry season. Refs [82] corroborate that several protected areas in sub-Saharan Africa have high to very high fire activity during the dry season; however, these fires, especially late fires, are destructive to plant seeds and a potential modifier of species diversity, distribution and composition. [83,84]. With the spatial evolutionary trend of the fields and fallows within KNP, it can be deduced that the fires detected during the study period would be linked to the conquest of new agricultural lands, as was the case in the Bururi Forest Reserve in Burundi [85]. This situation is particularly critical as there are only limited and targeted education and awareness-raising programmes for local populations, which are not based on comprehensive planning.
Furthermore, the spatio-temporal evolution of the burned areas indicates that fires accumulated continuously on the periphery of the AZ, whereas in the IA, these fires settled in the centre and increased (between 2001 and 2008) before decreasing thereafter (between 2008 and 2022). This is justified by the presence of a chain of villages on the periphery of the park’s annex area, where populations constantly burn the forests near their habitats to open new fields. However, although the central part of the Park’s annexed area is made up of savannahs, this part is also crossed by important watercourses generating humidity that limits the spread of fire. In the centre of the IZ, by contrast, the presence of fires can be justified by the fact that a considerable proportion of land in the middle part is made of bare soil on which grassy vegetation grows in the rainy season, which end up being burned during the dry season. In addition, the increase in burned areas in the IZ in 2008 is the result of inefficient and precarious management practices resulting from the reduced number of eco-guards [34]. Indeed, the period between 2001 and 2008 corresponds to the period of political instability in the region, making households vulnerable and turning to the exploitation of KNP’s natural resources for their survival. On the other hand, the post-conflict period was accompanied by an increase in the number of eco-guards, who concentrated their activities more in the IZ, as opposed to the AZ, where land conflicts with local populations are permanent. Nevertheless, with the activities of the eco-guards being concentrated on the periphery of the IZ, the local population regularly finds their way into the central part where they exert hunting activities, generally accompanied by fires.
In addition, the spatio-temporal analysis of fires revealed that in the AZ and KNP, the burned areas were large in 2022 compared to 2001. Indeed, in 2001, the village surrounding KNP were not as populated as compared to today; therefore, KNP experienced fewer intrusions and less pressure from the village population [36], with the pressure increasing every year between 2001 and 2022, resulting in burning of large areas of land. Similarly, it is noted that all land cover types are covered by fire each year, but with special mention for the savannahs; however, it is recognised that, the areas burnt are usually the same, generally associated with savannah and grassland physiognomies [86]. It should be noted that degraded areas are the most exposed to fire, such as areas that have experienced deforestation. These areas, relatively dense with woody vegetation in 2001, have been degraded in 2008, 2015 and 2022. These changes could be ascribed to both the passage of fire and recurrent anthropogenic activities, such as agriculture and village expansion; however, due to the inhibition of buds and seeds of forest species, which would prevent their regeneration, our findings showed that the forest area decreased, while the burned area increased. This hypothesis regarding the action of fire on forest resources is also put forward by other authors [87,88]. In addition, the degradation of certain dense areas in 2001 in KNP that have become degraded or transformed into ‘non-forest’ zones could be caused by soil degradation due to the frequency of fire. The degradation of edaphic conditions will make certain species disappear, with ref. [89] confirming that fires modify the composition of soils by increasing their potassium content. Finally, in a global way, the surface area of fires has increased between 2001 and 2022 but through a sequence of increase–decrease–increase. These processes can be justified by the instability of park management in DR Congo, with changes occurring almost every year, which does not allow for a stable and more efficient management system [34].

4.3. Conservation Implications

The forest landscape dynamics of KNP demonstrated in this study are characterised by deforestation, a phenomenon also recognised by several authors in the region [9,28,33]. Due to the development of illicit anthropogenic activities (mainly logging and agriculture), wildfires and ineffective management, KNP has undergone mutations. Given the fragile state of KNP management and the precarious socio-economic conditions of the local (poor) population, the objectives of conserving forest resources must be maintained. This will limit illegal exploitation of resources [90] and later the risk of the park being downgraded [33,91]. Indeed, the people living in KNP are extremely poor, with low levels of education, rapid population growth and high dependence on small-scale agriculture and natural resources for food, energy, health care and income. As a result, the remaining patches of miombo are under severe threat from shifting cultivation, charcoal production, bushmeat consumption and overexploitation of various resources. Furthermore, for the success of the day-to-day management of KNP, the involvement of local people seems to be one of the indispensable alternatives (solutions) that can contribute to reducing human pressure on the resources, and perpetuate the services provided by KNP. Another very effective approach could be the development of alternative income-generating activities (e.g., agroforestry), as suggested by ref. [54] for the Kasomeno area in Upper Katanga. This approach has already produced convincing results [92,93], allowing reduction of pressure on natural resources from poor riparian populations. In most cases however, the management plan for protected areas focuses more on legal protection than the sustainable livelihoods of local communities, which has led to conflicts between local people and reserve managers [94]. In addition, there is a pressing need to improve criminal justice efforts to combat illegal activities on natural resources [95,96], in KNP. However, this activity should be, in collaboration with local people, preceded by demarcation with easily identifiable markers in areas where there are no natural boundaries.
Our study identified the recurrent passage of vegetation fires as a major factor impairing the forests to evolve in KNP. This is crucial, especially since even in the absence of anthropogenic pressures, the miombo takes a long time to recover [19]. To circumvent this situation and promote forest regeneration, two solutions can be envisaged in the context of KNP. Firstly, the practice of early fire should be promoted within KNP as a firebreak [97] and as a good tool for environmental preservation [98]. This practice has proved successful in combating wildfire in Madagascar [99]. Likewise, it has allowed a dense forest to recover and a wooded savannah to be maintained on savannah soils in central Côte d’Ivoire [100]. Finally, it is important to strengthen human, technical and organisational capacities within KNP, through education, awareness-raising, information and training activities on bushfire control techniques, which are the important components in the bushfire management plan [101].

5. Conclusions

This study contributed to the assessment of landscape and bushfire dynamics within Kundelungu National Park, in south-eastern DR Congo. It used remote sensing, mapping, and landscape ecology analysis tools to quantify landscape dynamics and analysed the spatio-temporal distribution of fire occurrences. Due to illegal agricultural development and recurrent bushfires, the study area has experienced spatial changes in the landscape, materialised by the continuous regression of forest areas (through the process of suppression and dissection). These changes were particularly marked between 2001 and 2008, which was the post-conflict period in the region. Although the forest may still constitute the matrix of the landscape, the average distance between its patches has clearly increased, indicating fragmentation and spatial isolation. Conversely, the area and number of patches of agricultural and fallow land have increased over the entire period from 2001 to 2022, amplifying the level of disturbance, which has doubled from 2.17 to 3.56. This disturbance is also the result of several wildfire attacks that have accumulated burned areas between 2001 and 2022 within KNP, particularly in the Annex Zone.
This study has limited itself to demonstrating the role of illegal activities and wildland fires in KNP on forest ecosystem imbalance. The results provide an understanding of the damage caused by human activities within KNP. They allowed quantifying areas of intense fire activity and illegal farming that need special attention. In addition to reduce human intrusion into the park, this study proposes the development of alternative survival strategies for local people as well as strengthening the skills of available human resources in the early management of fires, which prevent savannahs from evolving into forests. These results will be useful for future studies. They will be used as a starting point for even more important analyses on other research questions.

Author Contributions

Y.U.S.: conceptualisation, methodology and writing—original draft preparation; M.M.M.: data curation and writing—original draft preparation; F.M. and P.K.K.: writing—review and editing; J.B.: supervision, writing—original draft and funding acquisition. All authors have read and agreed to the published version of the manuscript.

Funding

The research was funded by ARES-CCD (Belgium), through the Research for development project ‘Renforcement des capacités de gestion durable de la forêt claire de miombo par l’évaluation de l’impact environnemental de la production de charbon de bois et l’amélioration des pratiques vis-à-vis des ressources forestières (CHARLU)’.

Institutional Review Board Statement

Not applicable.

Informed Consent Statement

Not applicable.

Data Availability Statement

All data presented in this study are available upon request from the corresponding author.

Conflicts of Interest

The authors declare that the research was conducted in the absence of any commercial or financial relationships that could be construed as a potential conflict of interest.

References

  1. Vancutsem, C.; Achard, F.; Pekel, J.F.; Vieilledent, G.; Carboni, S.; Simonetti, D.; Nasi, R. Long-term (1990–2019) monitoring of forest cover changes in the humid tropics. Sci. Adv. 2021, 7, eabe1603. [Google Scholar] [CrossRef] [PubMed]
  2. Mama, A.; Bamba, I.; Sinsin, B.; Bogaert, J.; De Cannière, C. Déforestation, savanisation et développement agricole des paysages des savanes-forêts dans la zone soudano-guinéenne du Bénin. Bois For. Trop. 2014, 322, 65–75. [Google Scholar] [CrossRef]
  3. Keenan, R.J.; Reams, G.A.; Achard, F.; de Freitas, J.V.; Grainger, A.; Lindquist, E. Dynamics of global forest area: Results from the FAO Global Forest Resources Assessment. For. Ecol. Manag. 2015, 352, 9–20. [Google Scholar] [CrossRef]
  4. Defourny, J.-P.; Delhage, C.; Kibambe, L.J.-P. Analyse Quantitative des Causes de la Déforestation et de la Dégradation des Forêts en République Démocratique du Congo; Rapport Final; FAO: Kinshasa, Democratic Republic of the Congo, 2011. [Google Scholar]
  5. Gillet, P.; Vermeulen, C.; Feintrenie, L.; Dessart, H. Quelles sont les causes de la déforestation dans le bassin du Congo? Synthèse bibliographique et étude des cas. Biotechnol. Agron. Société Et Environ. 2016, 20, 183–194. [Google Scholar] [CrossRef]
  6. Eba’a Atyi, R.; Hiol Hiol, F.; Lescuyer, G.; Mayaux, P.; Defourny, P.; Bayol, N.; Nasi, R. Les forêts du Bassin du Congo: état des Forêts; CIFOR: Bogor, Indonésie, 2021. [Google Scholar]
  7. Curtis, P.G.; Slay, C.M.; Harris, N.L.; Tyukavina, A.; Hansen, M.C. Classifying drivers of global forest loss. Science 2018, 361, 1108–1111. [Google Scholar] [CrossRef]
  8. Gibbs, H.K.; Ruesch, A.S.; Achard, F.; Clayton, M.K.; Holmgren, P.; Ramankutty, N.; Foley, J.A. Tropical forests were the primary sources of new agricultural land in the 1980s and 1990s. Proc. Natl. Acad. Sci. USA 2010, 107, 16732–16737. [Google Scholar] [CrossRef] [PubMed]
  9. Cabala, K.S.; Useni, S.Y.; Sambieni, K.R.; Bogaert, J.; Munyemba, K.F. Dynamique des écosystèmes forestiers de l’Arc Cuprifère Katangais en République Démocratique du Congo. Causes, Transformations spatiales et ampleur. Tropicultura 2017, 35, 192–202. [Google Scholar]
  10. Mukenza, M.M.; Mwenya, I.K.; Kalumbu, J.T.; Misonga, A.K.; Sikuzani, Y.U.; Kaleba, C.S. Perception de la dégradation de la fertilité des sols et de sa gestion par les agriculteurs de la cité de Kasenga en République Démocratique du Congo. Geo-Eco-Trop 2021, 45, 211–220. [Google Scholar]
  11. Cizungu, N.C.; Tshibasu, E.; Lutete, E.; Mushagalusa, C.A.; Mugumaarhahama, Y.; Ganza, D.; Bogaert, J. Fire risk assessment, spatiotemporal clustering and hotspot analysis in the Luki biosphere reserve region, western DR Congo. Trees For. People 2021, 5, 100104. [Google Scholar] [CrossRef]
  12. Buramuge, V.A.; Ribeiro, N.S.; Olsson, L.; Bandeira, R.R. Exploring Spatial Distributions of Land Use and Land Cover Change in Fire-Affected Areas of Miombo Woodlands of the Beira Corridor, Central Mozambique. Fire 2023, 6, 77. [Google Scholar] [CrossRef]
  13. Vancutsem, C.; Achard, F.; Pekel, J.F.; Vieilledent, G.; Carboni, S.; Simonetti, D.; Nasi, R. Long-term (1990–2019) monitoring of tropical moist forests dynamics. bioRxiv 2020. [Google Scholar] [CrossRef]
  14. Baral, H.; Guariguata, M.R.; Keenan, R.J. A proposed framework for assessing ecosystem goods and services from planted forests. Ecosyst. Serv. 2016, 22, 260–268. [Google Scholar] [CrossRef]
  15. Baccini, A.; Walker, W.; Carvalho, L.; Farina, M.; Sulla-Menashe, D.; Houghton, R.A. Tropical forests are a net carbon source based on aboveground measurements of gain and loss. Science 2017, 358, 230–234. [Google Scholar] [CrossRef]
  16. Silva, C.H., Jr.; Aragão, L.E.; Anderson, L.O.; Fonseca, M.G.; Shimabukuro, Y.E.; Vancutsem, C.; Saatchi, S.S. Persistent collapse of biomass in Amazonian Forest edges following deforestation leads to unaccounted carbon losses. Sci. Adv. 2020, 6, eaaz8360. [Google Scholar] [CrossRef]
  17. Doumenge, C.; Palla, F.; Madzous, I.; Ludovic, G. Aires protégées d’Afrique centrale (État 2020). 2021. Available online: https://agritrop.cirad.fr/598789/1/ID598789.pdf (accessed on 14 April 2023).
  18. Green, J.M.; Larrosa, C.; Burgess, N.D.; Balmford, A.; Johnston, A.; Mbilinyi, B.P.; Platts, P.J.; Coad, L. Deforestation in an African biodiversity hotspot: Extent, variation, and the effectiveness of protected areas. Biol. Conserv. 2013, 164, 62–72. [Google Scholar] [CrossRef]
  19. Malaisse, F. How to Live and Survive in Zambezian Open Forest (Miombo Ecoregion); Presses Agronomiques de Gembloux: Gembloux, Belgium, 2010. [Google Scholar]
  20. Sikuzani, Y.U.; Malaisse, F.; Kaleba, S.C.; Kankumbi, F.M.; Bogaert, J. Le rayon de déforestation autour de la ville de Lubumbashi (Haut-Katanga, RD Congo): Synthèse. Tropicultura 2017, 35, 215–221. [Google Scholar] [CrossRef]
  21. Potapov, P.V.; Turubanova, S.A.; Hansen, M.C.; Adusei, B.; Broich, M.; Altstt, A.; Mane, L.; Justice, C.O. Quantifyng forest cover loss in Democratic Republic of the Congo, 2000–2010, with Landsat ETM+data. Remote Sens. Environ. 2012, 122, 106–116. [Google Scholar] [CrossRef]
  22. Kabulu, D.J.P.; Vranken, I.; Bastin, J.F.; Malaisse, F.; Nyembwe, S.; Useni, S.Y.; Michel, L.; Bogaert, J. Approvisionnement en charbon de bois des ménages lushois: Quantités, alternatives et conséquences. Anthropisation des Paysages Katangais; Bogaert, J., Colinet, G., Mahy, G., Eds.; Presses Agronomiques de Gembloux: Gembloux, Belgium, 2018; pp. 297–311. [Google Scholar]
  23. Vranken, I.; Kabulu Djibu, J.P.; Munyemba Kankumbi, F.; Mama, A.; Iyongo Waya Mongo, L.; Bamba, I.; Laghmouch, M.; Bogaert, J. Ecological impact of habitat loss on African landscapes and diversity. Adv. Environ. Res. Nova Sci. Publ. Hauppauge 2011, 14, 365–388. [Google Scholar]
  24. Sikuzani, Y.U.; André, M.; Mahy, G.; Kaleba, S.C.; Malaisse, F.; Kankumbi, F.M.; Bogaert, J. Interprétation paysagère du processus d’urbanisation à Lubumbashi: Dynamique de la structure spatiale et suivi des indicateurs écologiques entre 2002 et 2008. In Anthropisation des Paysages Katangais; Presses Agronomiques de Gembloux: Gembloux, Belgium, 2018; Volume 281, 281p. [Google Scholar]
  25. Useni Sikuzani, Y.; Boisson, S.; Cabala Kaleba, S.; Nkuku Khonde, C.; Malaisse, F.; Halleux, J.M.; Munyemba Kankumbi, F. Dynamique de l’occupation du sol autour des sites miniers le long du gradient urbain-rural de la ville de Lubumbashi, RD Congo. Biotechnol. Agron. Société Environ. 2020, 24. [Google Scholar] [CrossRef]
  26. Kaleba, S.C.; Sikuzani, Y.U.; Yamba, A.M.; Kankumbi, F.M.; Bogaert, J. Activités anthropiques et dynamique des écosystèmes forestiers dans les zones territoriales de l’Arc Cuprifère Katangais (RD Congo). Tropicultura 2022, 40, 27. [Google Scholar] [CrossRef]
  27. Useni Sikuzani, Y.; Khoji Muteya, H.; Langunu, S.; Gerardy, A.; Bogaert, J. Amplification of anthropogenic pressure heavily hampers natural ecosystems regeneration within the savanization halo around Lubumbashi city (Democratic Republic of Congo). Int. J. Env. Sci. Nat. Res. 2019, 17, 555958. [Google Scholar] [CrossRef]
  28. Khoji, M.H.; N’Tambwe, N.D.-D.; Malaisse, F.; Waselin, S.; Sambiéni, K.R.; Cabala, K.S.; Munyemba, K.F.; Bastin, J.-F.; Bogaert, J.; Useni, S.Y. Quantification and Simulation of Landscape Anthropization around the Mining Agglomerations of Southeastern Katanga (DR Congo) between 1979 and 2090. Land 2022, 11, 850. [Google Scholar] [CrossRef]
  29. Kyale, K.J.; Wardell, D.A.; Mikwa, J.-F.; Masimo, J.K.; Maindo, M.N.A.; Oszwald, J.; Doumenge, C. Dynamique de la déforestation dans la Reserve de biosphère de Yangambi (République Démocratique du Congo): Variabilité spatiale et temporelle au cours des 30 dernières années. Bois. For. Trop. 2019, 341, 15–28. [Google Scholar] [CrossRef]
  30. Héritier, S. Les parcs nationaux entre conservation durable et développement local. Géocarrefour 2007, 82, 171–175. [Google Scholar] [CrossRef]
  31. UINC: UICN-PAPACO. Evaluation des aires Protégées de la République Démocratique du Congo. In La Lettre des Aires Protégées en Afrique de l’Ouest “The West African Protected Areas Newsletter”; 2011; 68p, Available online: http://papaco.org/fr/wp-content/uploads/2015/07/lettreAPAO-40-0311-FR.pdf (accessed on 10 February 2023).
  32. Tingu, C.; Mathunabo, A.; Bondjembo, T.; Mabhungu, P. Impact des activités anthropiques sur la viabilité des ressources naturelles du Parc National de la Salonga (PNS), en RD Congo: Cas des activités des Yaelima dans le bloc sud. J. D’economie De Manag. D’environnement Droit 2019, 2, 86–101. [Google Scholar]
  33. Sikuzani, Y.U.; Muteya, H.K.; Bogaert, J. Miombo woodland, an ecosystem at risk of disappearance in the Lufira Biosphere Reserve (Upper Katanga, DR Congo)? A 39-years analysis based on Landsat images. Glob. Ecol. Conserv. 2020, 24, e01333. [Google Scholar] [CrossRef]
  34. UICN/PACO. Parcs et réserves de la République Démocratique du Congo: Évaluation de l’efficacité de gestion des aires protégées. Ouagadougou, BF: UICN/PACO. 2010. Available online: https://portals.iucn.org/library/node/9909 (accessed on 21 February 2023).
  35. Vanleeuwe, H.; Henschel, P.; Pelissier, C.; Moyer, D. Recensement des grands mammifères et impacts humains-Parcs nationaux de l’Upemba et des Kundelungu. Wildl. Conserv. Soc. 2009. Available online: https://www.researchgate.net/publication/266020978 (accessed on 8 March 2023).
  36. Paul, K.K.; Maurice, B.M.; Benjamin, K.M.; Albert, A.Y.; Didier, T.K.M. Faune mammalienne, chasse et conflits humains faune en périphérie du Parc national de Kundelungu (RD Congo). J. Appl. Biosci. 2019, 139, 14147–14156. [Google Scholar] [CrossRef]
  37. Lemenkova, P.; Debeir, O. R Libraries for Remote Sensing Data Classification by K-Means Clustering and NDVI Computation in Congo River Basin, DRC. Appl. Sci. 2022, 12, 12554. [Google Scholar] [CrossRef]
  38. Bogaert, J.; André, M. L’écologie du paysage: Une discipline unificatrice. Tropicultura 2013, 31, 1–2. [Google Scholar]
  39. Van Engelen, V.W.P.; Verdoodt, A.; Dijkshoorn, K.; Van Ranst, E. Soil and Terrain Data Base of Central African; SOTERCAF, Version 1.0; FAO: Rome, Italy, 2006; 22p. [Google Scholar]
  40. Saad, L.; Parmentier, I.; Colinet, G.; Malaisse, F.; Faucon, M.P.; Meerts, P.; Mahy, G. Investigating the vegetation–soil relationships on the copper–cobalt rock outcrops of Katanga (D.R. Congo), an essential step in a biodiversity conservation plan. Restor. Ecol. 2012, 20, 405–415. [Google Scholar] [CrossRef]
  41. FAO; WRB. World Reference Base for Soil Resources 2006; World Soil Resources Reports N 103; FAO: Rome, Italy, 2006. [Google Scholar]
  42. White, F. La Végétation de L’afrique: Mémoire Accompagné de la Carte de la Végétation de l’Afrique; ORSTOM-UNESCO: Paris, France, 1983; 384p. [Google Scholar]
  43. Rodgers, W.A. The Miombo Woodlands; Mclanahan, S., Young, T., Eds.; East African Ecosystems and Their Conservation; Oxford University Press: New York, NY, USA, 1996. [Google Scholar]
  44. Barima, Y.S.S.; Egnankou, W.M.; N’doumé, A.T.C.; Kouamé, F.N.; Bogaert, J. Modélisation de la dynamique du paysage fores- tier dans la région de transition forêt-savane à l’est de la Côte d’Ivoire. Télédétection 2010, 9, 129–138. [Google Scholar]
  45. Mama, A.; Sinsin, B.; De Cannière, C.; Bogaert, J. Anthropisation et dynamique des paysages en zone soudanienne au nord du Bénin. Tropicultura 2013, 31, 78–88. [Google Scholar]
  46. Useni, S.Y.; Cabala, K.S.; Nkuku, K.C.; Amisi, M.Y.; Malaisse, F.; Bogaert, J.; Munyemba, K.F. Vingt-cinq ans de monitoring de la dynamique spatiale des espaces verts en réponse à l’urbanisation dans les communes de la ville de Lubumbashi (Haut-Katanga, R.D. Congo). Tropicultura 2017, 35, 300–311. [Google Scholar]
  47. Salomon, W.; Sikuzani, Y.U.; Kouakou, A.T.M.; Barima, S.S.; Theodat, J.M.; Bogaert, J. Monitoring of Anthropogenic Effects on Forest Ecosystems within the Municipality of Vallières in the Republic of Haiti from 1984 to 2019. Trees For. People 2021, 6, 100–135. [Google Scholar] [CrossRef]
  48. Nkwunonwo, U.C. Land use/Land cover mapping of the Lagos Metropolis of Nigeria using 2012 SLC-off Landsat ETM+ Satellite Images. Int. J. Sci. Eng. Res. 2013, 4, 1217–1223. [Google Scholar]
  49. Barima, Y.S.S.; Barbier, N.; Bamba, I.; Traore, D.; Lejoly, J.; Bogaert, J. Dynamique paysagère en milieu de transition ivoirienne. Bois Trop. 2009, 299, 15–25. [Google Scholar] [CrossRef]
  50. Masimo, K.J.; Adipalina, G.B.; Ngenda, O.E.; Maestripieri, N.; Saqalli, M.; Rossi, V.; Iyongo Waya, M.L. Suivi de l’anthropisation du paysage dans la région forestière de Babagulu, République Démocratique du Congo. VertigO 2020, 20. [Google Scholar] [CrossRef]
  51. Landis, J.R.; Koch, G.G. The measurement of observer agreement for categorical data. Biometrics 1977, 33, 159–174. [Google Scholar] [CrossRef] [PubMed]
  52. Pontius, R.G. Quantification error versus location incomparison of categorical maps. Photogramm. Eng. Remote Sens. 2000, 66, 1011–1016. [Google Scholar]
  53. Skupinski, G.; Tran, D.B.; Weber, C. Les images satellites Spot multi-dates et la métrique spatiale dans l’étude du changement urbain et suburbain le cas de la basse vallée de la Bruche (Bas-Rhin, France). Cybergeo Eur. J. Geogr. 2009. Available online: http://cybergeo.revues.org/21995 (accessed on 10 April 2023).
  54. Mukenza, M.M.; Muteya, H.K.; Nghonda, D.-D.N.; Sambiéni, K.R.; Malaisse, F.; Kaleba, S.C.; Bogaert, J.; Sikuzani, Y.U. Uncontrolled Exploitation of Pterocarpus tinctorius Welw. And Associated Landscape Dynamics in the Kasenga Territory: Case of the Rural Area of Kasomeno (DR Congo). Land 2022, 11, 1541. [Google Scholar] [CrossRef]
  55. O’Neill, R.V.; Krummel, J.R.; Garner, R.H.; Sugihara, G.; Jackson, B.; Deangelis, D.L.; Milne, B.T.; Turner, M.G.; Zygmunt, B.; Christensen, S.W.; et al. Indices of landscape pattern. Landsc. Ecol. 1988, 1, 153–162. [Google Scholar] [CrossRef]
  56. Bogaert, J.; Ceulemans, R.; Salvador-Van, E.D. Decision tree algorithm for detection of spavial processes in landscape transformation. Environ. Manag. 2004, 33, 62–73. [Google Scholar] [CrossRef] [PubMed]
  57. Kaleba, S.C.; Useni Sikuzani, Y.; Mwana, Y.A.; Bogaert, J.; Kankumbi, F.M. Analyse structurale de la dynamique forestière dans la région de I’Arc Cuprifére Katangais en République Démocratique du Congo: II. Analyse complémentaire de la fragmentation forestière. Tropicultura 2018, 36, 621–630. [Google Scholar]
  58. Haulleville, T.; Rakotondrasoa, O.L.; Rakoto Ratsimba, H.; Bastin, J.F.; Brostaux, Y.; Verheggen, F.J.; Bogaert, J. Fourteen years of anthropization dynamics in the Uapaca bojeri Baill. forest of Madagascar. Landsc. Ecol. Eng. 2018, 14, 135–146. [Google Scholar] [CrossRef]
  59. Puyravaud, J.P. Standardizing the calculation of the annual rate of deforestation. For. Ecol. Manag. 2002, 177, 593–596. [Google Scholar] [CrossRef]
  60. Cirezi, N.C.; Bastin, J.F.; Tshibasu, E.; Lonpi, E.T.; Chuma, G.B.; Mugumaarhahama, Y.; Bogaert, J. Contribution of ‘human induced fires’ to forest and savanna land conversion dynamics in the Luki Biosphere Reserve landscape, western Democratic Republic of Congo. Int. J. Remote Sens. 2022, 43, 6406–6429. [Google Scholar] [CrossRef]
  61. Boschetti, L.; Roy, D.; Hoffmann, A.A.; Humber, M. MODIS Collection 5 Burned Area Product-MCD45. User’s Guide Ver 2009, 2, 1–2. [Google Scholar]
  62. Dahan, K.S.; N’da, H.D.; Kaudjhis, C.A. Dynamique spatiotemporelle des feux de 2001 à 2019 et dégradation du couvert végétal en zone de contact forêt-savane, Département de Toumodi, Centre de la Côte d’Ivoire. Afr. Sci. 2021, 19, 94–113. [Google Scholar]
  63. Andriamanantena, H.N.H.; Rakotondraompiana, S.; Rakotoniaina, S.; Razanaka, S. Répartitions spatiale et temporelle des feux à Madagascar. Rev. Française Photogrammétrie Télédétection 2021, 223, 38–58. [Google Scholar] [CrossRef]
  64. Fornacca, D.; Ren, G.; Xiao, W. Performance of three MODIS fire products (MCD45A1, MCD64A1, MCD14ML), and ESA Fire_CCI in a mountainous area of Northwest Yunnan, China, characterized by frequent small fires. Remote Sens. 2017, 9, 1131. [Google Scholar] [CrossRef]
  65. Sikuzani, Y.; Cabala, K.; Halleux, J.M.; Bogaert, J.; Munyemba, K. Caractérisation de la croissance spatiale urbaine de la ville de Lubumbashi (Haut-Katanga, RD Congo) entre 1989 et 2014. Tropicultura 2018, 38, 98–108. [Google Scholar]
  66. Burel, F.; Baudry, J. Ecologie du Paysage: Concepts, Méthodes et Applications; Editions Tec & Doc: Paris, France, 2012; 359p. [Google Scholar]
  67. Bogaert, J.; Mahamane, A. Ecologie du paysage: Cibler la configuration et l’échelle spatiale. Ann. Sci. Agron. Bénin 2005, 7, 1–15. [Google Scholar] [CrossRef]
  68. Giglio, L.; Schroeder, W.; Hall, J.; Justice, C. MODIS Collection 6 Active Fire Product User’s Guide Revision, B. NASA. 2018. Available online: https://www.earthdata.nasa.gov/s3fspublic/imported/MODIS_C6_Fire_User_Guide_B.pdf (accessed on 25 July 2022).
  69. Giglio, L.; van der Werf, G.R.; Randerson, J.T.; Collatz, G.J.; Kasibhatla, P. Estimation of burned area using MODIS active fire observations. Atmos. Chem. Phys. 2006, 6, 957–974. [Google Scholar] [CrossRef]
  70. De Wasseige, C.; De Marken, P.; Bayol, N.; Hiol, F.; Mayaux, P.; Desclée, B.; Nasi, R.; Billand, A.; Defourny, P.; Eba Atyi, R. Les Forêts du Bassin du Congo: Etats des Forêts 2010; Office de publication de l’Union Européenne: Luxembourg, 2012; p. 276. [Google Scholar]
  71. Hick, A.; Hallin, M.; Tshibungu, A.; Mahy, G. La place de l’arbre dans les systèmes agricoles de la région de Lubumbashi. In Anthropisation des Paysages Katangais; Presses Agronomiques de Gembloux: Gembloux, Belgium, 2018; p. 111. [Google Scholar]
  72. Katumbi, N.; Nyengere, J.; Mkandawire, E. Drivers of deforestation and forest degradation in Dzalanyama forest reserve in Malawi. Int. J. Sci. Res. 2015, 6, 889–893. [Google Scholar]
  73. Bamba, I.; Yedmel, M.S.; Bogaert, J. Effets des routes et des villes sur la forêt dense dans la province orientale de la République Démocratique du Congo. Eur. J. Sci. Res. 2010, 43, 417–429. [Google Scholar]
  74. Watson, F.G.; Becker, M.S.; Milanzi, J.; Nyirenda, M. Human encroachment into protected area networks in Zambia: Implications for large carnivore conservation. Reg. Environ. Chang. 2014, 15, 415–429. [Google Scholar] [CrossRef]
  75. PNUD (Programme des Nations Unies pour le Développement). Unité de Lutte Contre la Pauvreté, Province du Katanga. In Profil, Résumé. Pauvreté et Conditions de vie des Ménages; 2009; 19p, Available online: https://www.undp.org/sites/g/files/zskgke326/files/migration/cd/UNDP-CD-Profil-PROVINCE-Katanga.pdf (accessed on 13 January 2021).
  76. Cabala, K.S.; Useni, S.Y.; Munyemba, K.F.; Bogaert, J. Activités anthropiques et dynamique spatiotemporelle de la forêt claire dans la Plane de Lubumbashi. In Anthropisation des Paysages Katangais; Bogaert, J., Colinet, G., Mahy, G., Eds.; Les Presses Universitaires de Liège: Liège, Belgique, 2018; pp. 253–266. [Google Scholar]
  77. Trefon, T.; Cogels, S. A stakeholder approach to naturel resource management in peri-urban Central Africa. In Proceedings of the International Symposium on Tropical Forests in a Changing Global Context, Brussels, Belgium, 8–9 November 2004; Royal Academy of Overseas Sciences-Unesco: Bruxelles, Belgium, 2005; 24p. [Google Scholar]
  78. Ousmane, S.; N’da Dibi, H.; Kouassi, K.H.; Kouassi, K.E.; Ouattara, K. Crises politico-militaires et dynamique de la végétation du Parc national du Mont Péko en Côte d’Ivoire. Bois Des. Trop. 2020, 343, 27–37. [Google Scholar] [CrossRef]
  79. Sangne, C.Y.; Barima, Y.S.S.; Bamba, I.; N’Doumé, C.T.A. Dynamique forestière post-conflits armés de la Forêt classée du Haut-Sassandra (Côte d’Ivoire). VertigO 2015, 15. [Google Scholar] [CrossRef]
  80. Bogaert, J.; Barima, Y.S.S.; Iyongo, W.M.L.; Bamba, I.; Mama, A.; Toy, M.; Lafortezza, R. Forest fragmentation: Causes, ecological impacts, and implications for landscape management. In Globe; Li, C., Lafortezza, R., Chen, J., Eds.; Springer: Beijing, China; Berlin/Heidelberg, Germany, 2011; pp. 273–296. [Google Scholar]
  81. Havyarimana, F.; Masharabu, T.; Kouao, J.K.; Bamba, I.; Nduwarugira, D.; Bigendako, M.J.; Bogaert, J. La dynamique spatiale de la forêt située dans la réserve naturelle forestière de Bururi au Burundi. Tropicultura 2017, 35, 158–172. [Google Scholar]
  82. Grégoire, J.-M.; Simonetti, D. Dynamique des brûlis dans les aires protégées du réseau SUN (Bénin, Burkina Faso, Niger et Sénégal). JRC Sci. Tech. Res. Ser. 2008, 48829. [Google Scholar]
  83. Tyukavina, A.; Hansen, M.C.; Potapov, P.V.; Stehman, S.V.; Smith-Rodriguez, K.; Okpa, C.; Aguilar, R. Types, and rates of forest disturbance in Brazilian Legal Amazon, 2000–2013. Sci. Adv. 2017, 3, e1601047. [Google Scholar] [CrossRef]
  84. Hislop, S.; Haywood, A.; Jones, S.; Soto-Berelov, M.; Skidmore, A.; Nguyen, T.H. A satellite data driven approach to monitoring and reporting fire disturbance and recovery across boreal and temperate forests. Int. J. Appl. Earth Obs. Geoinf. 2020, 87, 102034. [Google Scholar] [CrossRef]
  85. Elias, N.; Didier, M. Caractérisation et organisation spatio-temporelle des feux actifs au Burundi de 2001 à 2016 sur base des données MODIS. Bull. Sci. Env. Biodivers 2019, 3, 16–31. [Google Scholar]
  86. Schmidt, I.B.; Eloy, L. Fire regime in the Brazilian Savanna: Recent changes, policy and management. Flora 2020, 268, 151613. [Google Scholar] [CrossRef]
  87. Houinato, M.; Sinsin, B.; Lejoly, J. Impact des feux de brousse sur la dynamique des communautés végétales dans la forêt de Bassila (Bénin). Acta Bot. Gall. 2001, 148, 237–251. [Google Scholar] [CrossRef]
  88. Bucini, G.; Lambin, E.F. Fire impacts on vegetation in Central Africa: A remote-sensing-based statistical analysis. Appl. Geogr. 2002, 22, 27–48. [Google Scholar] [CrossRef]
  89. Cao, A.N.; Wyatt, T. The Sustainable Development Goals Link to human Security: An Exploration of Illegal Logging in Vietnam. In The Emerald Handbook of Crime, Justice and Sustainable Development; Blaustein, J., Fitz-Gibbon, K., Pino, N.W., White, R., Eds.; Emerald Publishing Limited: Bingley, UK, 2020; pp. 513–532. [Google Scholar] [CrossRef]
  90. Balole, E.; Ouedraogo, F.; Michel, B.; Chouamo, I.R.T. Croissance Démographique et Pressions sur les Ressources Naturelles du Parc National des Virunga; Bogaert, J., Halleux, J.M., Eds.; Territoires périurbains: Développement, enjeux et perspectives dans les pays du Sud; Presses Agronomiques de Gembloux: Gembloux, Belgium, 2015; pp. 85–94. [Google Scholar]
  91. Sillans, R. Les Savanes de L’afrique Centrale; Paul Chevalier: Paris, France, 1959; 433p. [Google Scholar]
  92. Reyniers, C. Agroforesterie et déforestation en République démocratique du Congo. Miracle ou mirage environnemental? Mondes Développement 2019, 3, 113–132. [Google Scholar] [CrossRef]
  93. Bisiaux, F.; Peltier, R.; Muliele, J.-C. Plantations industrielles et agroforesterie au service des populations des plateaux batéké, Mampu, en République démocratique du Congo. Bois Des. Trop. 2009, 301, 21–32. [Google Scholar] [CrossRef]
  94. Maikhuri, R.K.; Nautiyal, S.; Rao, K.S.; Chandrasekhar, K.; Gavali, R.; Saxena, K.G. Analysis and resolution of protected area–people conflicts in Nanda Devi Biosphere Reserve, India. Environ. Conserv. 2000, 27, 43–53. [Google Scholar] [CrossRef]
  95. Brito, B.; Barreto, P. Enforcement against illegal logging in the Brazilian Amazon. In Compliance and Enforcement in Environmental Law; Edward Elgar Publishing: Cheltenham, UK, 2011. [Google Scholar] [CrossRef]
  96. Goncalves, M.P.; Panjer, M.; Greenberg, T.S.; Magrath, W.B. Justice for Forests. Improving Criminal Justice Efforts to Combat Illegal Logging; The World Bank: Washington, DC, USA, 2012. [Google Scholar]
  97. Louppe, D.; Oattara, N.K.; Coulibaly, A. The effects of brush fires on vegetation: The Aubreville fire plots after 60 years. Commonw. For. Rev. 1995, 74, 288–292. [Google Scholar]
  98. Fournier, A.; Yameogo, U. Pourquoi et comment utiliser le feu comme outil de gestion en savane. Manuel de Gestion des Aires Protégées d’Afrique Francophone. 2009, pp. 509–514. Available online: https://www.researchgate.net/publication/235674763 (accessed on 8 March 2023).
  99. Rarivomanana, H.T. Analyse de la mise en œuvre des stratégies de lutte contre les feux à Madagascar: Cas de la région Sofia. 2017. Available online: http://hdl.handle.net/2268.2/3372 (accessed on 25 March 2023).
  100. Louppe, D.; Oliver, R.; Ouattara, N.; Fortier, M. Impacts des feux répétés sur les sols de savanes du centre de la Côte d’Ivoire. In Aménagement Intégré des Forêts Naturelles des Zones Tropicales Sèches de L’afrique de l’Ouest: Actes du Séminaire International; 16 au 20 Novembre 1998, Ouagadougou (Burkina Faso); Savadogo Prosper, D., Ed.; IUFRO; CNRST: Ouagadougou, Burkina Faso, 2001; pp. 161–173. [Google Scholar]
  101. Arbonnier, M.; Gueye, B. Vers une Stratégie de Gestion des Feux de Brousse dans la Zone D’intervention de Wula-Nafaa: Régions de Tambacounda, Kolda et Sedhiou; USAID, 2010; 121p. Available online: https://agritrop.cirad.fr/558795/ (accessed on 1 March 2023).
Figure 1. Geographical location of the Kundelungu National Park (KNP) in the Upper Katanga Province in south-eastern DR Congo. The KNP consists o two parts: the Integral Zone (2460 km2) and the Annex Zone (5576 km2).
Fire 06 00174 g001
Figure 2. Land cover maps of KNP in 2001, 2008, 2015 and 2022 obtained from supervised classifications of Landsat images based on the maximum likelihood algorithm. A continuous regression of forest areas in favour of anthropogenic land cover classes, mainly savannahs, is noted.
Fire 06 00174 g002
Figure 3. Evolution in landscape composition at the scale of (a) Kundelungu National Park, its (b) Integral Zone (IZ) and (c) Annex Zone (AZ) in 2001, 2008, 2015 and 2022. The sum of the percentages (%) per zone does not add up to 100% because the land cover classes including ‘water and wetland’, ‘built and bare soil’ and ‘other land cover’ were excluded from the analyses due to their relative stability in the landscape.
Fire 06 00174 g003
Figure 4. Evolution of the fractal dimension index of the ‘Forest’ class as a function of the landscape disturbance index in Kundelungu National Park between 2001 and 2022. “U” is defined as the ratio of the cumulative area of anthropogenic classes (Savannah, Fields and fallow and other land cover) in the landscape and the cumulative area of natural classes (Forest and Water and wetlands).
Fire 06 00174 g004
Figure 5. Maps of burned areas in KNP (in 2001, 2008, 2015 and 2022) based on MODIS data (MCD64A1). Fires burned over a larger area in 2022 than in 2001. With the exception of the IZ, fires are often on the edge of the AZ because the environment in this part of the park is made up of a network of watercourses that maintain moisture.
Fire 06 00174 g005
Figure 6. Evolution over time (in 2001, 2008, 2015 and 2022) of the total area burnt in KNP, IZ and AZ. The burned area is constantly increasing in KNP and AZ but decreasing in IZ.
Fire 06 00174 g006
Figure 7. Area burned per land cover unit (forest, savannah, and field and fallow) in KNP in 2001, 2008, 2015 and 2022. Wetlands are not considered by this analysis because of their stability in terms of humidity, which does not allow the passage of fires. Fires are more settled in the savannahs, preventing the latter from evolving towards the forest which has also recorded burned areas.
Fire 06 00174 g007
Table 1. Characteristics of Landsat image scenes used to cover the study area in 2001, 2008, 2015 and 2022. In total, 2 (Operational Land Imager) to 3 (Thematic Mapper and Enhanced Thematic Mapper Plus) Landsat image scenes of 30 m spatial resolution were used to cover KNP. Landsat products come from the US space agency, NASA, and are distributed by the US Geological Survey (USGS) and the Department of Agriculture.
SensorsDatesPath/RowSpatial Resolution (m)
Thematic Mapper (TM)13 August 2001173/06630
13 August 2001173/06730
3 June 2001172/06830
15 July 2008173/06630
15 July 2008173/06730
8 July 2008172/06830
Enhanced Thematic Mapper Plus
(ETM+)
11 July 2015173/06630
11 July 2015173/06730
4 July 2015172/06830
Operational Land Imager (OLI)6 July 2022173/06630
6 July 2022173/06730
Table 2. Land cover classes obtained after supervised classification of Landsat images based on the maximum likelihood algorithm.
Land Cover ClassDescriptionNumber of Training Areas (Polygons)
ForestNatural land cover, comprising mainly open miombo forest, patches of dense dry forest and patches of gallery forest.30
SavannahGenerally anthropogenic land cover. It is a grassy and shrubby formation characterised by a low density of trees.37
Field and fallowThis anthropogenic land cover class consists of post-harvest agricultural land, abandoned agricultural land or land occupied by annual and off-season crops33
Water and wetlandNatural land cover, consisting mainly of watercourses (rivers) and their surroundings remaining wet even during the dry season30
Other land coverBare soil, inhabited areas, and unclassified spaces. This is generally anthropic land cover.30
Table 3. Classification accuracy of Landsat images from 2001, 2008, 2015 and 2022 based on the maximum likelihood algorithm. Pu: user’s accuracy; Pr: producer’s accuracy. Discrimination between land cover classes remains reliable. The values in the table are in pixels.
Reference DataClassified Data
Classified Image from 2001
ForestsSavannahsFields and FallowsWater and WetlandOther Land CoverTotalPr (%)
Forest44.004.002.000.000.0050.0088.00
Savannah6.0046.001.000.001.0054.0085.19
Fields and Fallow0.001.0040.000.000.0041.0097.56
Water and Wetland0.000.000.0045.000.0045.00100.00
Other 0.002.000.000.0054.0056.0096.43
Total50.0053.0043.0045.0055.00Overall Accuracy92.44%
Pu (%)88.0086.7993.02100.0098.18Kappa0.90
Classified Image from 2008
Forest45.000.001.000.000.0046.0097.83
Savannah5.0048.005.000.001.0059.0081.36
Fields and Fallow0.003.0037.000.000.0040.0092.50
Water and Wetland0.000.000.0045.000.0045.00100.00
Other 0.002.000.000.0054.0056.0096.43
Total50.0053.0043.0045.0055.00Overall Accuracy92.44%
Pu (%)90.0090.5786.05100.0098.18Kappa0.91
Classified Image from 2015
Forest48.002.000.000.000.0050.0096.00
Savannah2.0049.002.000.004.0057.0085.96
Fields and Fallows0.002.0041.000.001.0044.0093.18
Water and Wetland0.000.000.0045.000.0045.00100.00
Other0.000.000.000.0050.0050.00100.00
Total50.0053.0043.0045.0055.00Overall Accuracy94.22%
Pu (%)96.0092.4595.35100.0090.91Kappa0.93
Classified Image from 2022
Forest48.000.000.000.000.0048.00100.00
Savannah2.0052.000.000.000.0054.0096.30
Fields and Fallows0.001.0042.000.000.0043.0097.67
Water and Wetland0.000.000.0045.000.0045.00100.00
Other0.000.001.000.0055.0056.0098.21
Total50.0053.0043.0045.0055.00Overall Accuracy98.11%
Pu (%)96.0098.1197.67100.00100.00Kappa0.97
Table 4. Land cover class configuration indices in 2001, 2008, 2015 and 2022 and identification of the spatial transformation process (STP) based on the decision tree of ref. [56]. LPI: largest patch index (%), ENN: Euclidean nearest neighbour distance between patches (m), CA: class area (km2), MA: mean area, NP: total number of patches. A trend towards landscape homogenization and transformation of natural ecosystems into anthropogenic land cover, evidence of the anthropisation process, is noted.
ForestSavannahField and Fallow
CA_20012339.173309.4736.09
MA_20010.160.300.02
NP_200115,03111,2061896
LPI_200179.0884.544.31
ENN_2001138.43134.32296.96
CA_20081838.783635.4476.66
MA_20080.410.330.02
NP_2008451711,0403940
LPI_200890.8380.762.63
ENN_2008189.63126.83225.31
STP 2001–2008AttritionCreationCreation
CA_20151737.592787.14100.62
MA_20150.750.180.02
NP_2015231815,7766427
LPI_201592.4250.684.25
ENN_2015226.93132.03215.24
STP 2008–2015AttritionDissectionCreation
CA_20221596.373434.47216.14
MA_20220.520.290.03
NP_2022304512,0166973
LPI_202289.6362.004.43
ENN_2022169.41121.41188.34
STP 2015–2022DissectionAggregationCreation
Disclaimer/Publisher’s Note: The statements, opinions and data contained in all publications are solely those of the individual author(s) and contributor(s) and not of MDPI and/or the editor(s). MDPI and/or the editor(s) disclaim responsibility for any injury to people or property resulting from any ideas, methods, instructions or products referred to in the content.

