Article

The Interaction between a Liquid Combustion Front and a Fire Barrier Made of CO2 Hydrate

1
Heat Mass Transfer Laboratory, National Research Tomsk Polytechnic University, Tomsk 634050, Russia
2
Melentiev Energy Systems Institute SB RAS, 130 Lermontov Street, Irkutsk 664033, Russia
3
Kutateladze Institute of Thermophysics, Novosibirsk 630090, Russia
*
Author to whom correspondence should be addressed.
Fire 2023, 6(3), 124; https://doi.org/10.3390/fire6030124
Submission received: 11 January 2023 / Revised: 24 February 2023 / Accepted: 14 March 2023 / Published: 17 March 2023

Abstract

:
This paper presents experimental research into the propagation of a liquid fuel combustion front interacting with a fire barrier made of CO2 hydrate and ice. The combustible liquids studied here were kerosene, gasoline, Diesel fuel, oil, petroleum, and alcohol. The experiments with gas hydrate involved fire barriers based on powder and tablets. Heat and mass transfer and phase transitions in the area between the fire barrier and the combustion front were found to play a fundamental role. The liquid fuel combustion fronts propagate at a velocity ranging from 0.1 m/s to 3 m/s under natural convection. Forced convection leads to 2- to 5-fold changes in the flame propagation velocities. According to our experiments, 2–4 cm is the minimum width of a CO2 hydrate fire barrier for stopping the flame combustion front. We also determined the contribution of the gas hydrate dissociation to fire suppression and identified the conditions of the combustion front stoppage. The dimensionless processing of experimental data made them scalable to industrial applications. Finally, the experimental findings were also used to develop physical and mathematical models predicting the necessary and sufficient amount of CO2 hydrate in a fire barrier to provide the effective deceleration and stoppage of a flame combustion front.

1. Introduction

Liquid fuels quite often ignite spontaneously during storage and transportation. Sometimes this happens because of depressurization followed by fuel spillage or because vapors interact with potential sources of fire hazard (high-temperature surfaces, open flame, bare conductors, etc.) [1,2,3,4,5]. The flame spreads very quickly over the surface of a rapidly evaporating liquid fuel, which is extremely dangerous [6,7,8,9,10]. This factor plays a pivotal role in the development of fires resulting from combustible liquid leaks [11,12,13]. It is crucial to study the mechanism and patterns of the flame front propagation for fire safety and accident prevention [14,15,16]. It is becoming increasingly clear that the most effective way of combating different types of compartment fires is by their containment in small areas by suppressing the combustion fronts in confined spaces [17,18,19]. Fire barriers are widely used as a fire containment tool under various conditions of combustion front propagation [20,21]. They are normally based on water, soil, clay, sand, ice, mixtures, and foaming agent, which prevent the combustion front from spreading [22,23,24]. Ma et al. [25] used a thermosensitive hydrogel to effectively suppress class A fires. According to the research findings, after the phase transition, the hydrogel had a high viscosity and low surface tension, which helped the gel to attach to the surface of the burning material and act as an effective barrier to prevent combustion products from mixing with oxygen. As a result, combustion quickly stopped. The crucial role of fluorocarbon and hydrocarbon surfactants in firefighting foam formulations was established in Ref. [26]. Surfactants affect the ability of foam to form a barrier between a fuel-pool surface and the fire, thus suppressing the fire. The main patterns of using fluorocarbon and fluorine-free firefighting foams as barriers to fuel transport during liquid pool fire are outlined by Hinnant et al. [27]. It is shown that a foam layer of a certain size is an effective barrier to fuel vapor transport. The research findings suggest surfactants suppress the fuel adsorption and solubility onto bubble lamellae surfaces, thus slowing down the fuel transport through the foam. Research into n-heptane fuel suppression by an aqueous foam has shown rapid (<10 s) and significant (25 °C) cooling of the fuel near the foam-fuel interface [28]. The foam layer not only forms a fuel-transport barrier to the fire but also significantly cools the surface by heat conduction and slows down fuel evaporation, thus suppressing the fire. Experiments with firefighting barriers have shown the considerable advantage of combined extinguishing agents containing not only water and foaming agent but also additives blocking the oxygen and reducing the temperature in the combustion zone [29].
Gas hydrate is a system consisting of an ice cage with gas trapped inside [30]. The applications of gas hydrates are expanding as new knowledge is gained of their characteristics and production opportunities. There is an important objective to increase the gas concentration in gas hydrate as well as to produce the so-called double and multi-component hydrates containing two or more gases. Today, several applications of CO2 hydrates are known [31]. For instance, carbon dioxide hydrate can be used for seawater desalination [32], CO2 capture and storage [33,34,35], and the cooling and production of carbonated solid foods [36,37,38]. CO2 hydrates can be used as fire suppressants because ice melting, water evaporation, and gas hydrate dissociation reduce the temperature in the combustion zone, and nonflammable gases released from dissociating hydrates [39] block oxygen as well as pyrolysis and combustion products from the combustion zone [40]. There are examples [41,42,43] of using CO2-based firefighting systems for compartment fire containment and suppression. Such systems have both strengths and weaknesses [41,42] compared to alternative fire suppressants based on liquid and solid extinguishing agents. CO2 hydrate is not yet widely used for fire containment and suppression due to the lack of reliable information on the appropriate thermal conditions as well as sufficient gas and water vapor concentrations for effective firefighting [40,44]. The unique composition of gas hydrates (carbon dioxide and a large content of water in the form of ice) heightens the interest in their use as fire barriers for liquid fire containment and suppression as compared to conventional barriers made, for instance, from foam. It is important to determine the difference between the combustion front exposure to hydrate powder and ice granules. These aspects motivated us to conduct the present research.
A promising objective is to create a database of dimensionless criteria that would make it possible to extend our research findings and estimates based on those findings to different fire scales and types of fuels. It is important to develop generalized physical and mathematical models for predicting the effective conditions of liquid fire containment and suppression where fuels have different vaporization rates and combustion front velocities. Flammable liquids are traditionally known to be the greatest fire hazard. In this context, it is necessary to determine the effective conditions for the containment of fires involving liquids with the help of carbon dioxide hydrate powder. The objectives of this work were (1) to study experimentally and theoretically the liquid combustion front propagation and deceleration before a fire barrier made of ice or CO2 hydrate and (2) to develop a model predicting the effective conditions of fire containment.

2. Experimental Technique

Liquid combustion front propagation was studied using a hollow rectangular-sectioned channel, 40 mm wide, 10 mm high, and 1 m long (Figure 1). This design allowed us to measure the combustion front velocity for typical flammable liquids under different ignition conditions. The width of the channel was selected to hold a gas hydrate fire barrier as long as 40–50 mm with a maximum discharge density. A ventilation system with a variable flow rate could generate forced air flow with a velocity of up to 10 m/s at one end of the channel. The experiments involved the most widespread combustible liquids (see Table 1 for their properties). These liquids were chosen because they covered almost the entire potential field of application for promising extinguishing agents.
The fire barrier was made of gas hydrate based on CO2 in the form of granulated powder (0.2–0.5 mm in radius) and cylindrical tablets (20 mm in diameter and 5 mm high). The mass CO2 concentration in the hydrate was 25–29%. The duration of complete hydrate dissociation was determined as a function of temperature (Figure 2) with sample tablets being heated in a muffle furnace. A polynomial approximation curve was also obtained with a mathematical expression describing this relationship. The resulting mathematical expression allows extrapolation to higher heating temperatures.
The dissociation characteristics of carbon dioxide from hydrate samples were experimentally studied upon radiative heating with heat fluxes comparable to those typical of compartment fires. The thermal decomposition of a CO2 hydrate tablet was studied in high-temperature air in a ceramic tube of an R 50/250/13 muffle furnace at an air temperature ranging from 500 to 900 °C. A carbon dioxide hydrate sample was taken out of a Dewar vessel filled with liquid nitrogen, weighed on an AJH-620CE electronic balance with an accuracy of ±0.001 g, and placed on a fine metal mesh. This whole procedure took no more than 10 s. A reservoir with a hydrate was introduced into the tubular heater of the muffle furnace using a positioning mechanism. The thermal decomposition was recorded using a high-speed Phantom v411 camera (1280 × 800 pix, 100 fps). The resulting footage was analyzed in the Tema Automotive software. The ice used in the experiments was prepared in a freezer at −15 °C. Before the experiments, the ice was mechanically crushed into powder with a granule size of 0.3–0.5 mm.
Each experiment measuring the flame combustion front included the following stages:
  • the channel was filled with combustible liquids with varying initial volumes;
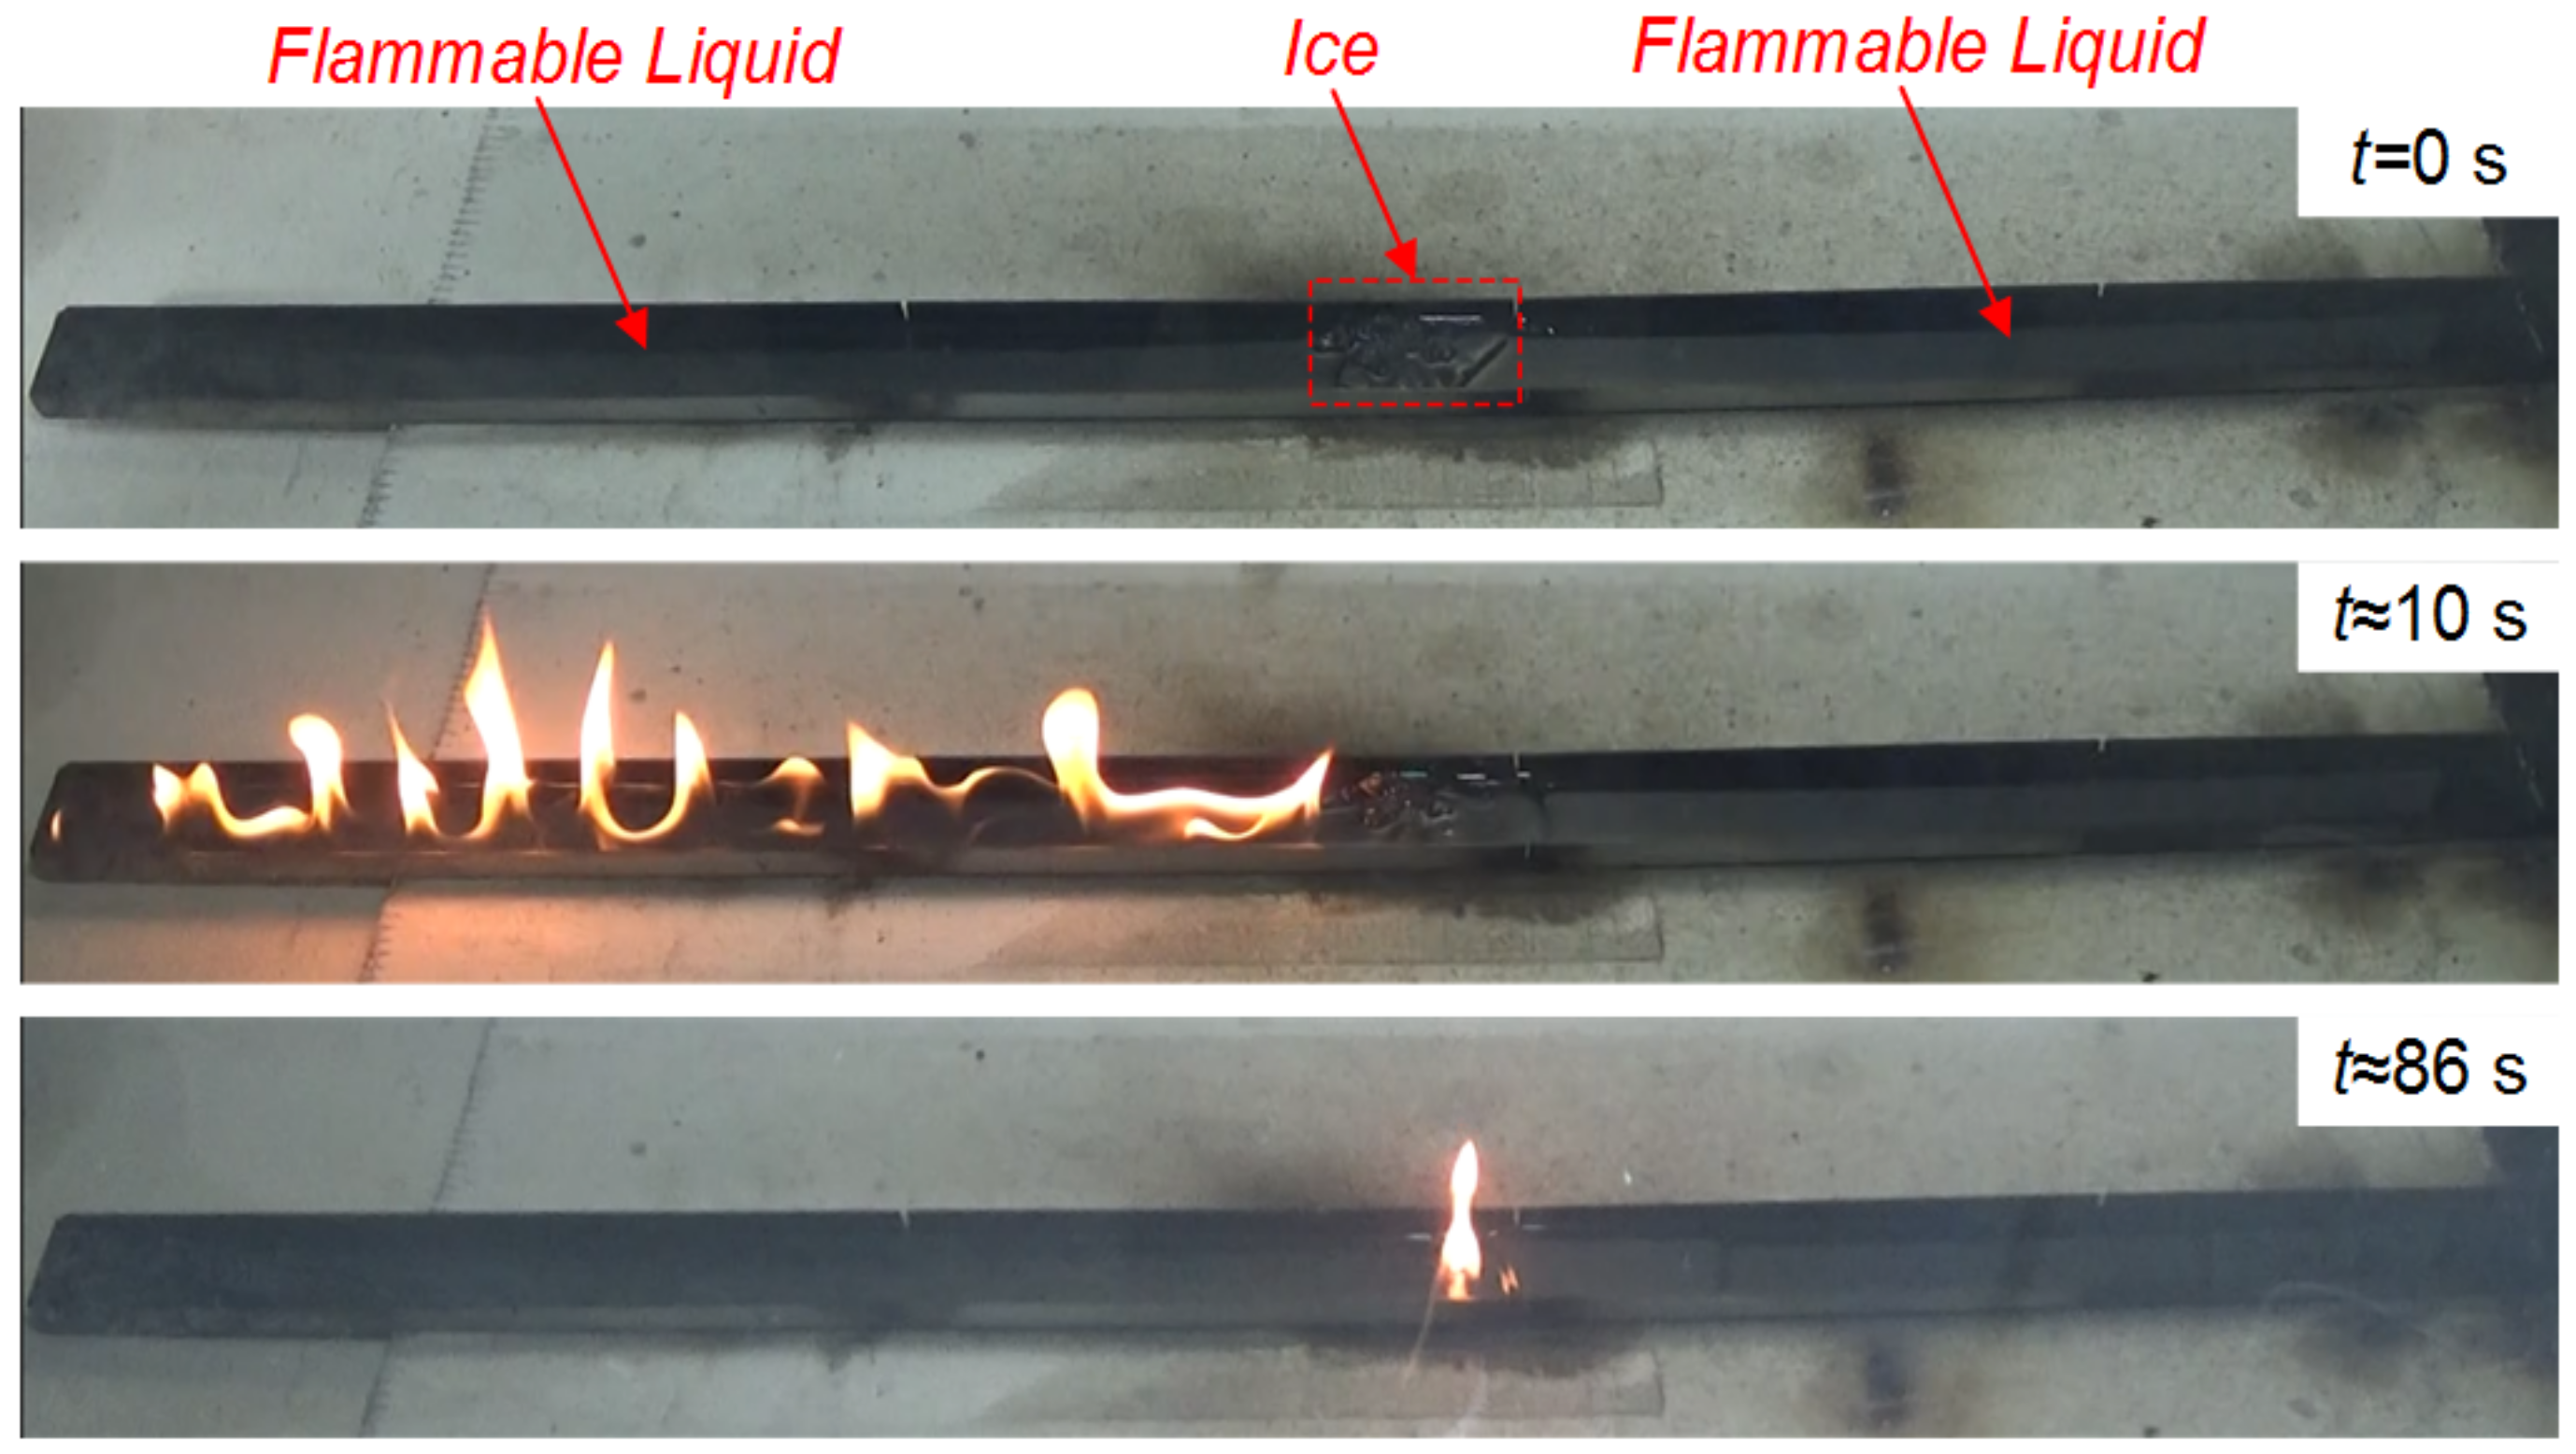
  • gas hydrate (granulated powder or tablet) was taken out of a Dewar vessel, weighed on an electronic balance controlling for the holder mass, and then poured into the marked zone of the working channel to make a fire barrier;
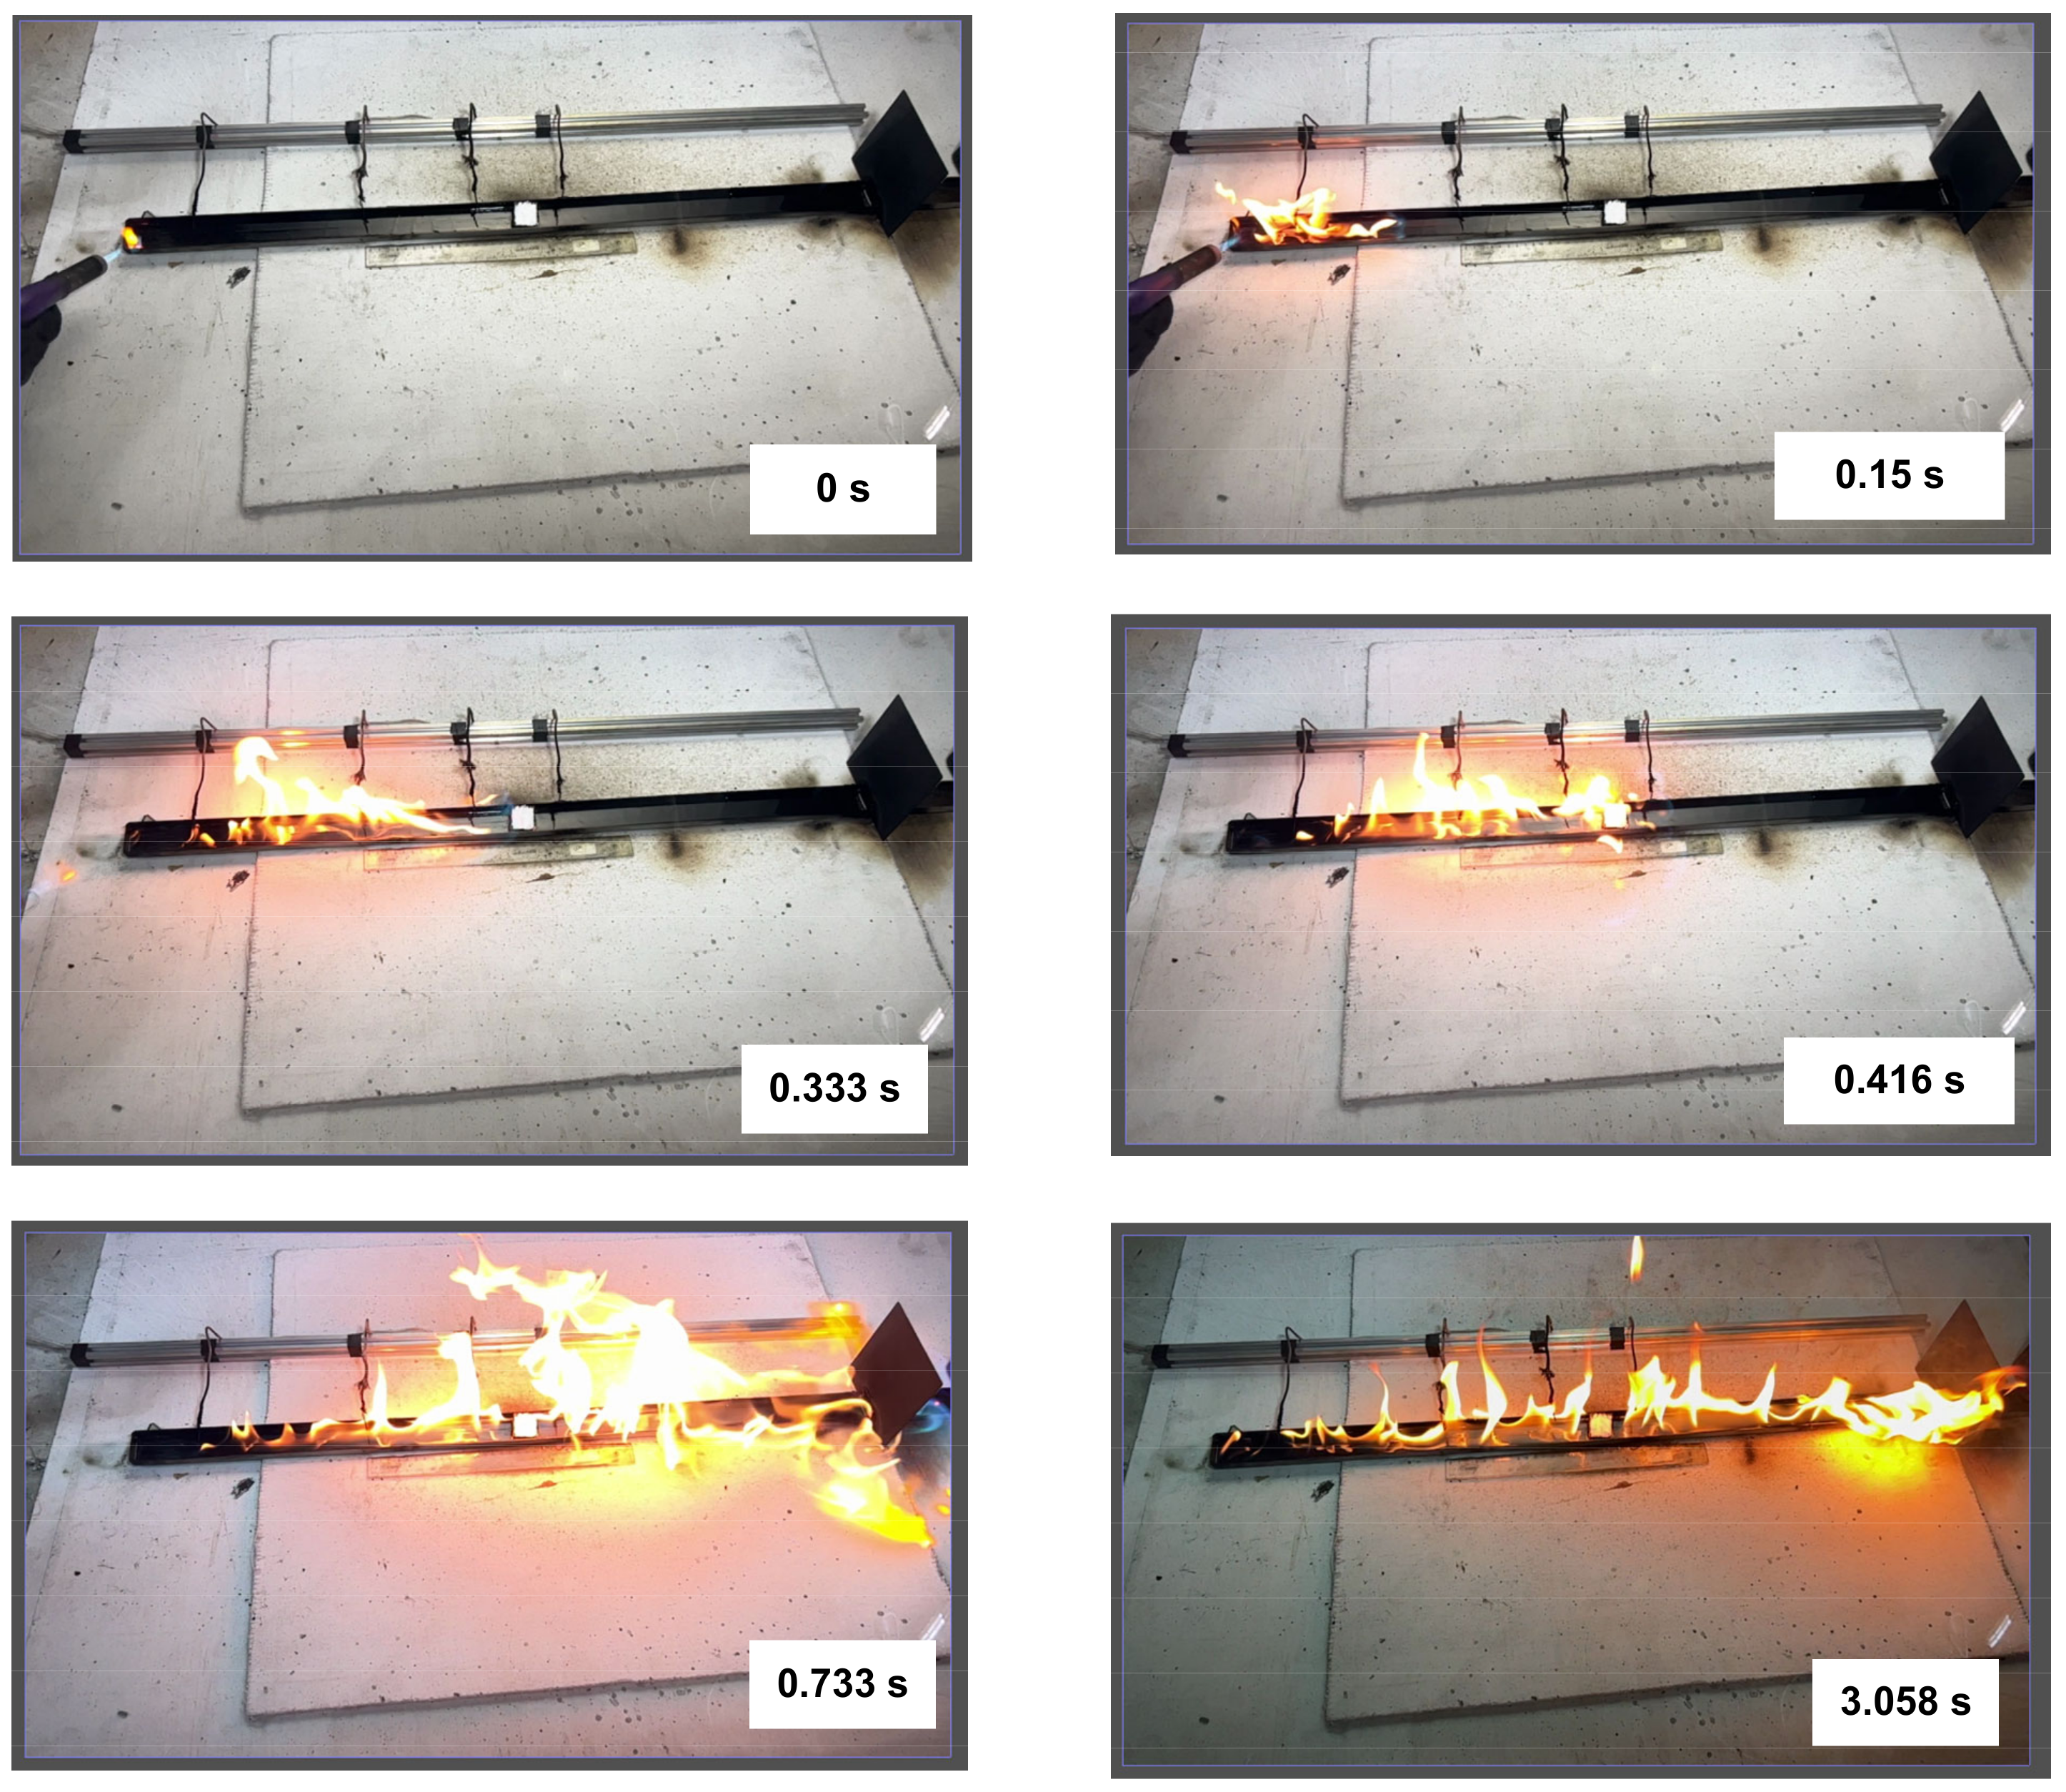
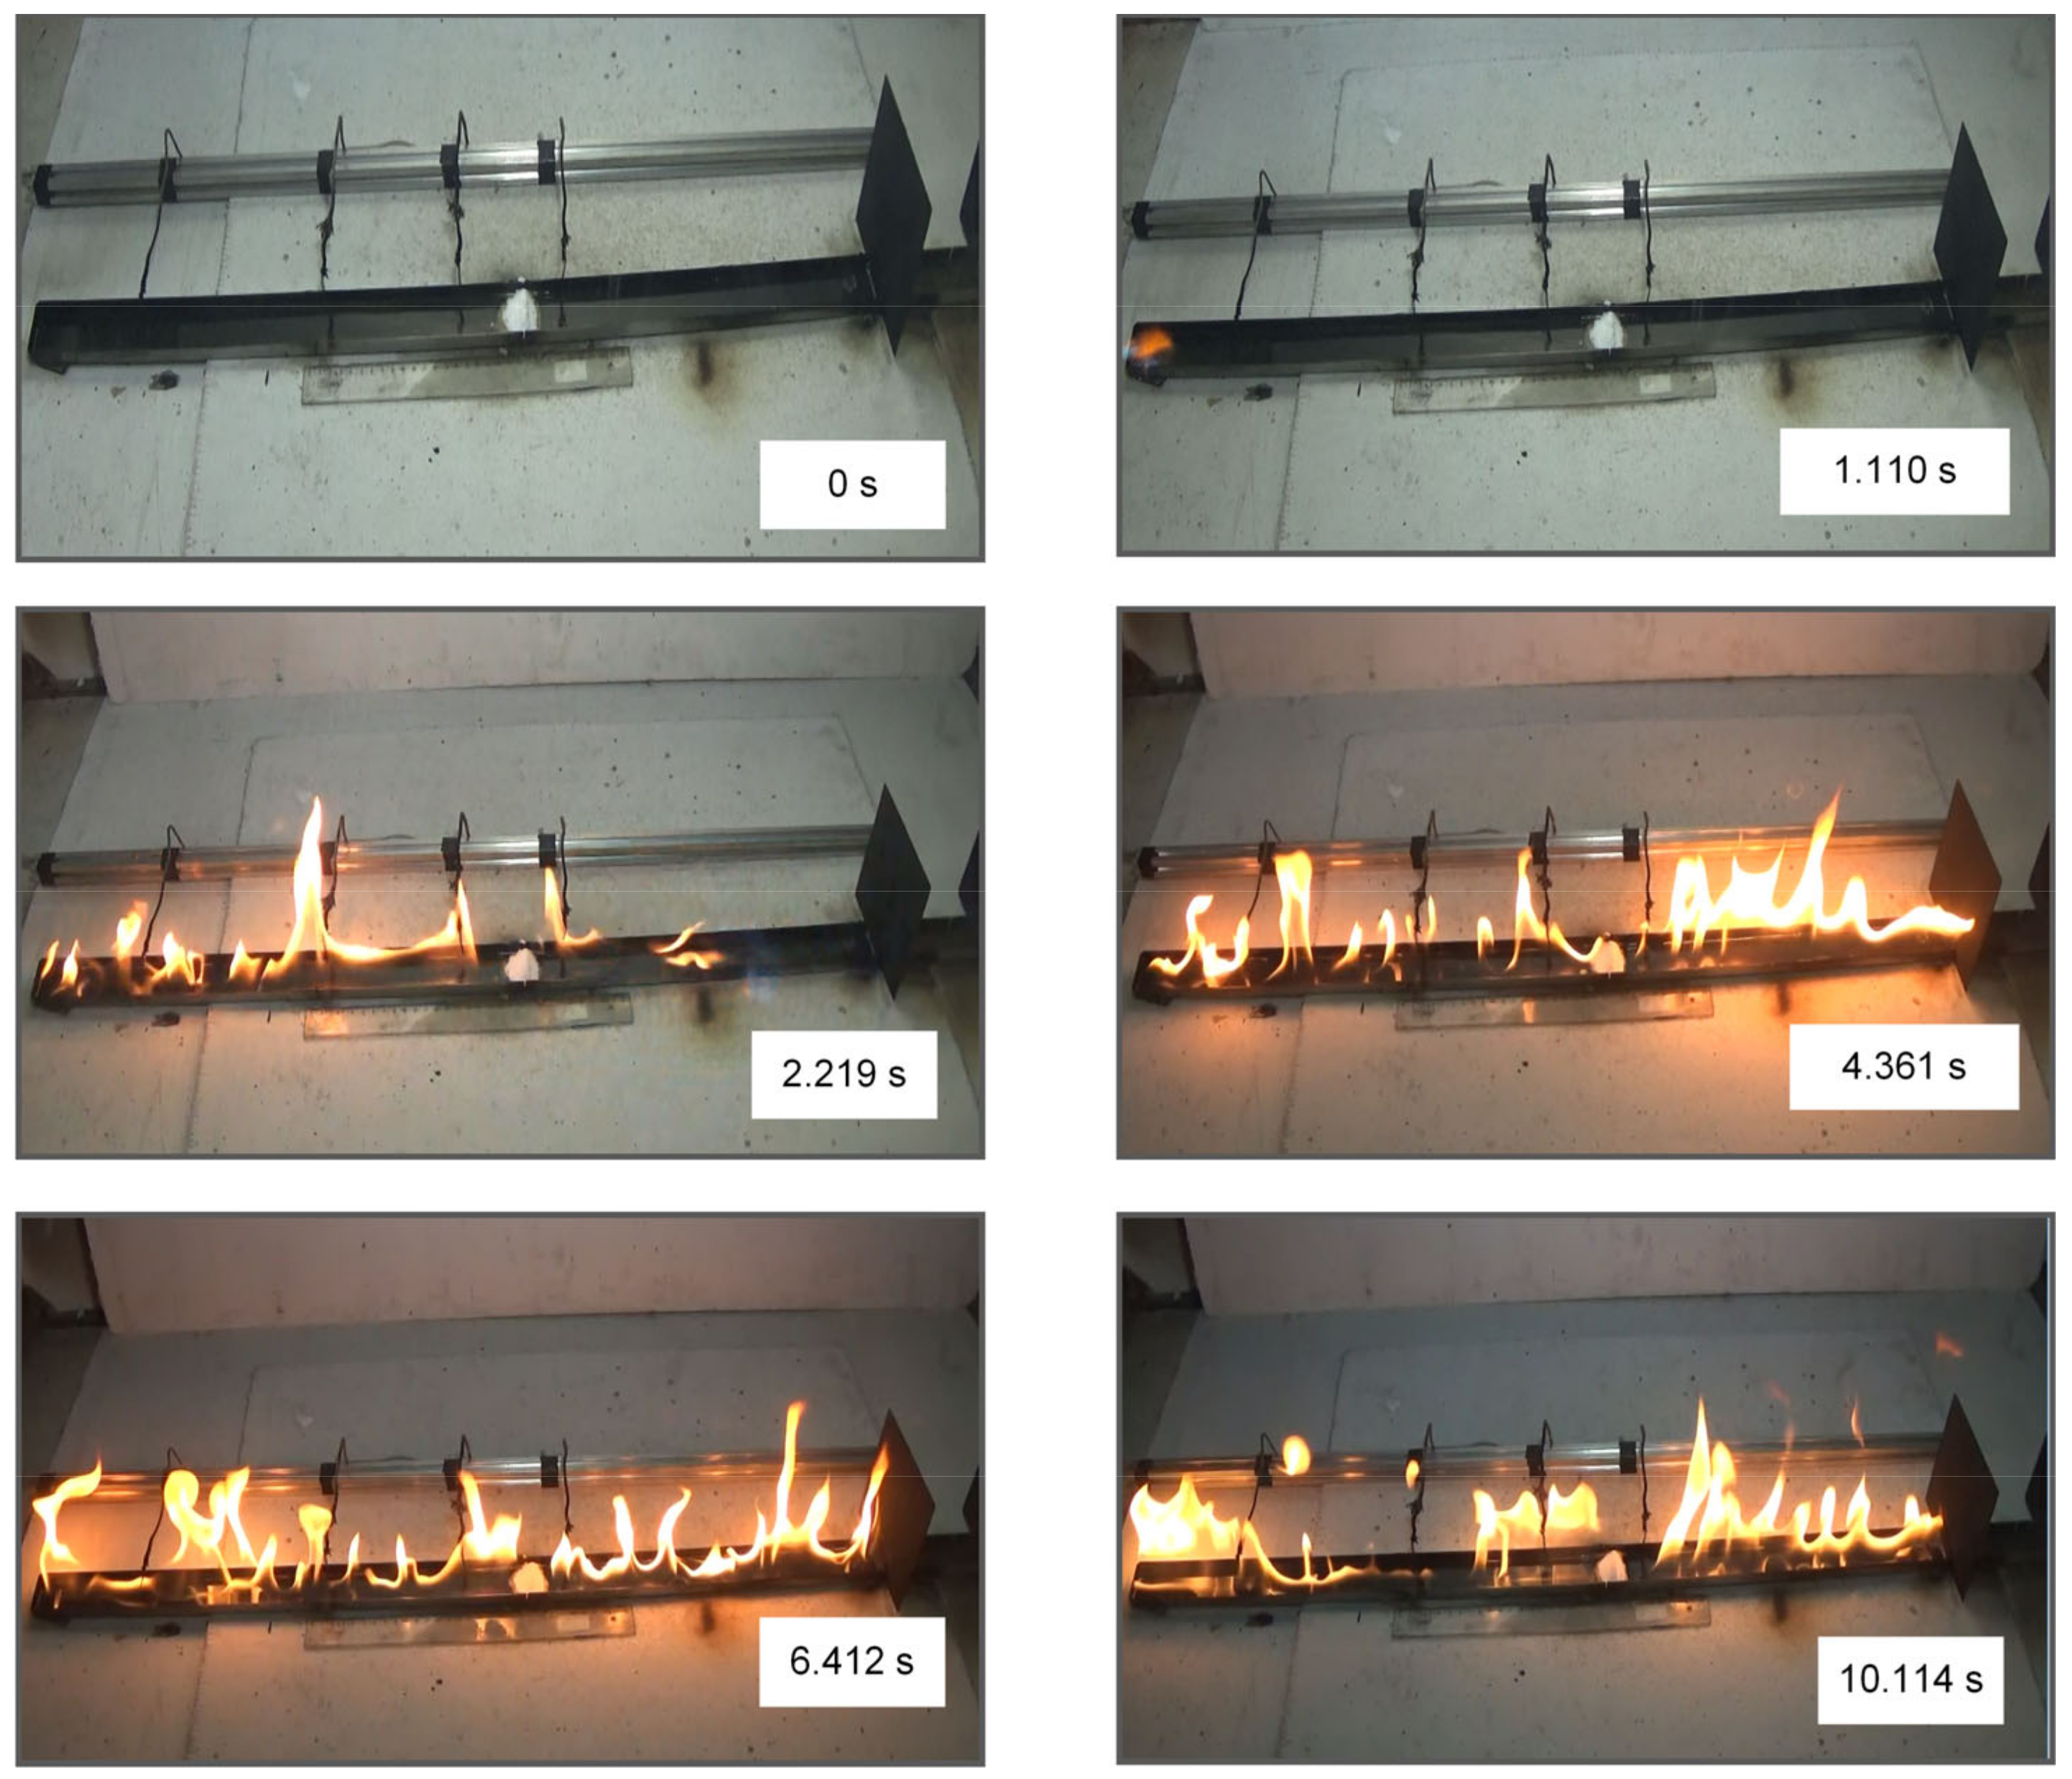
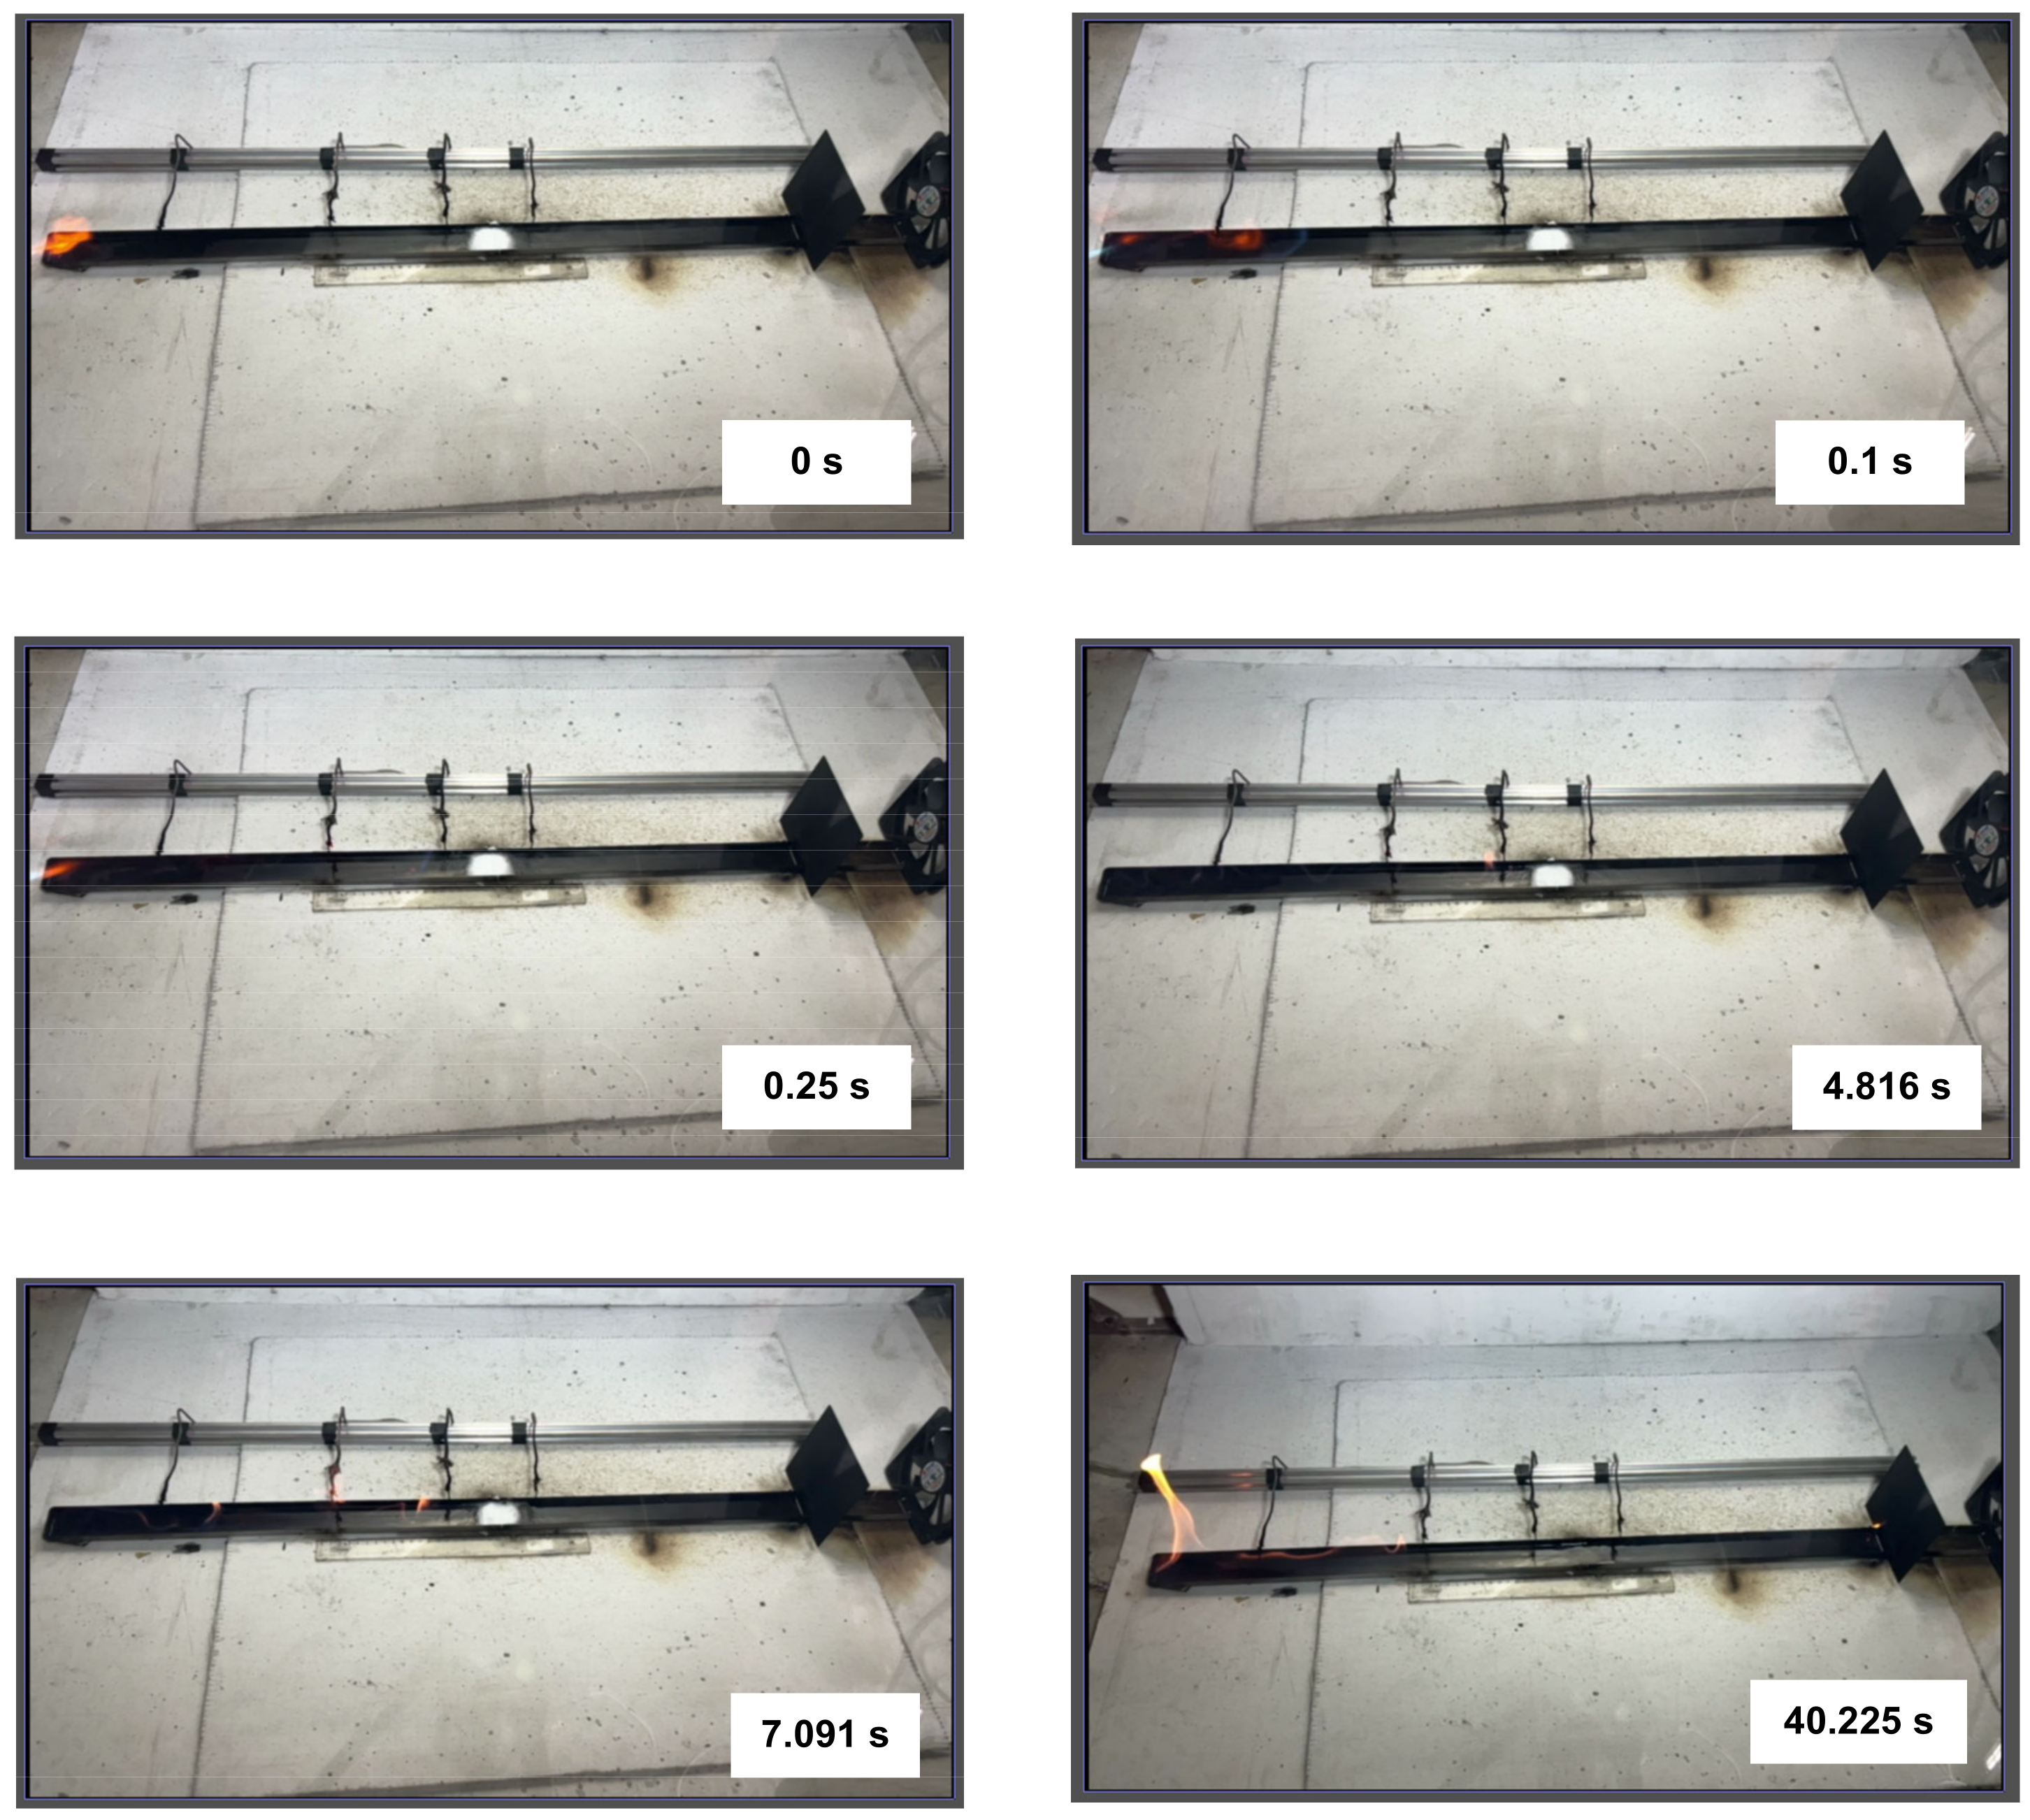
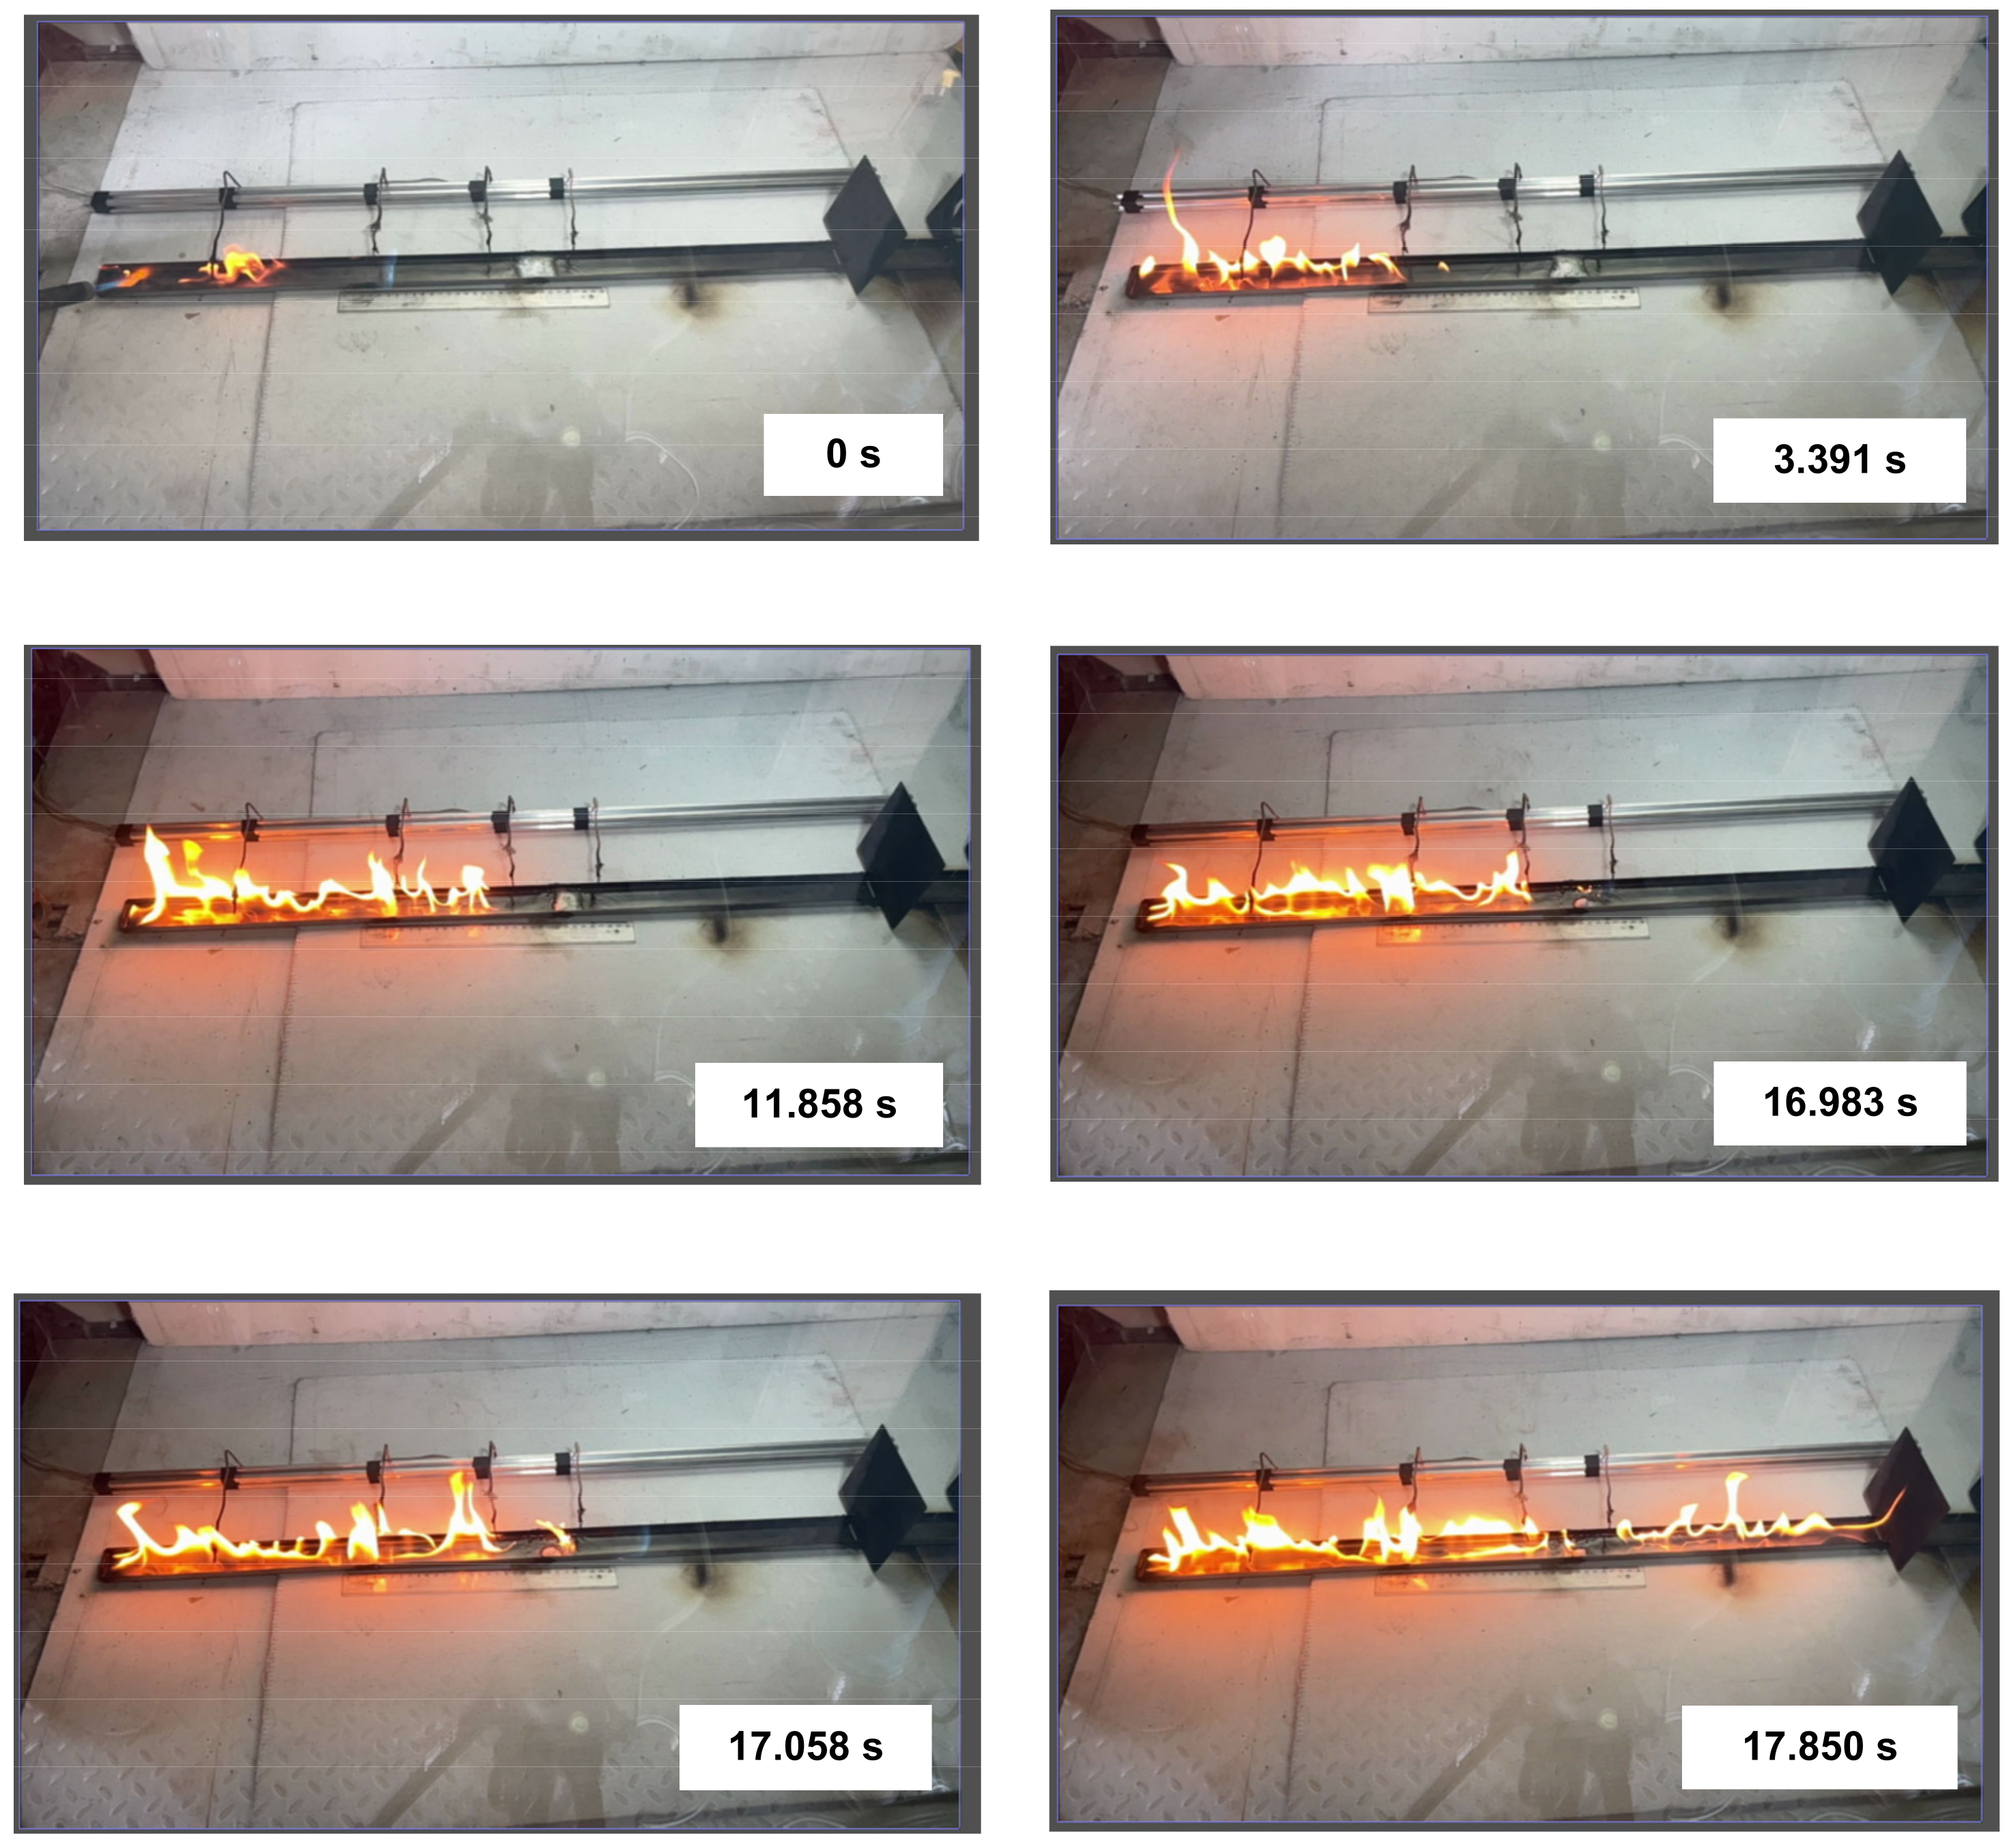
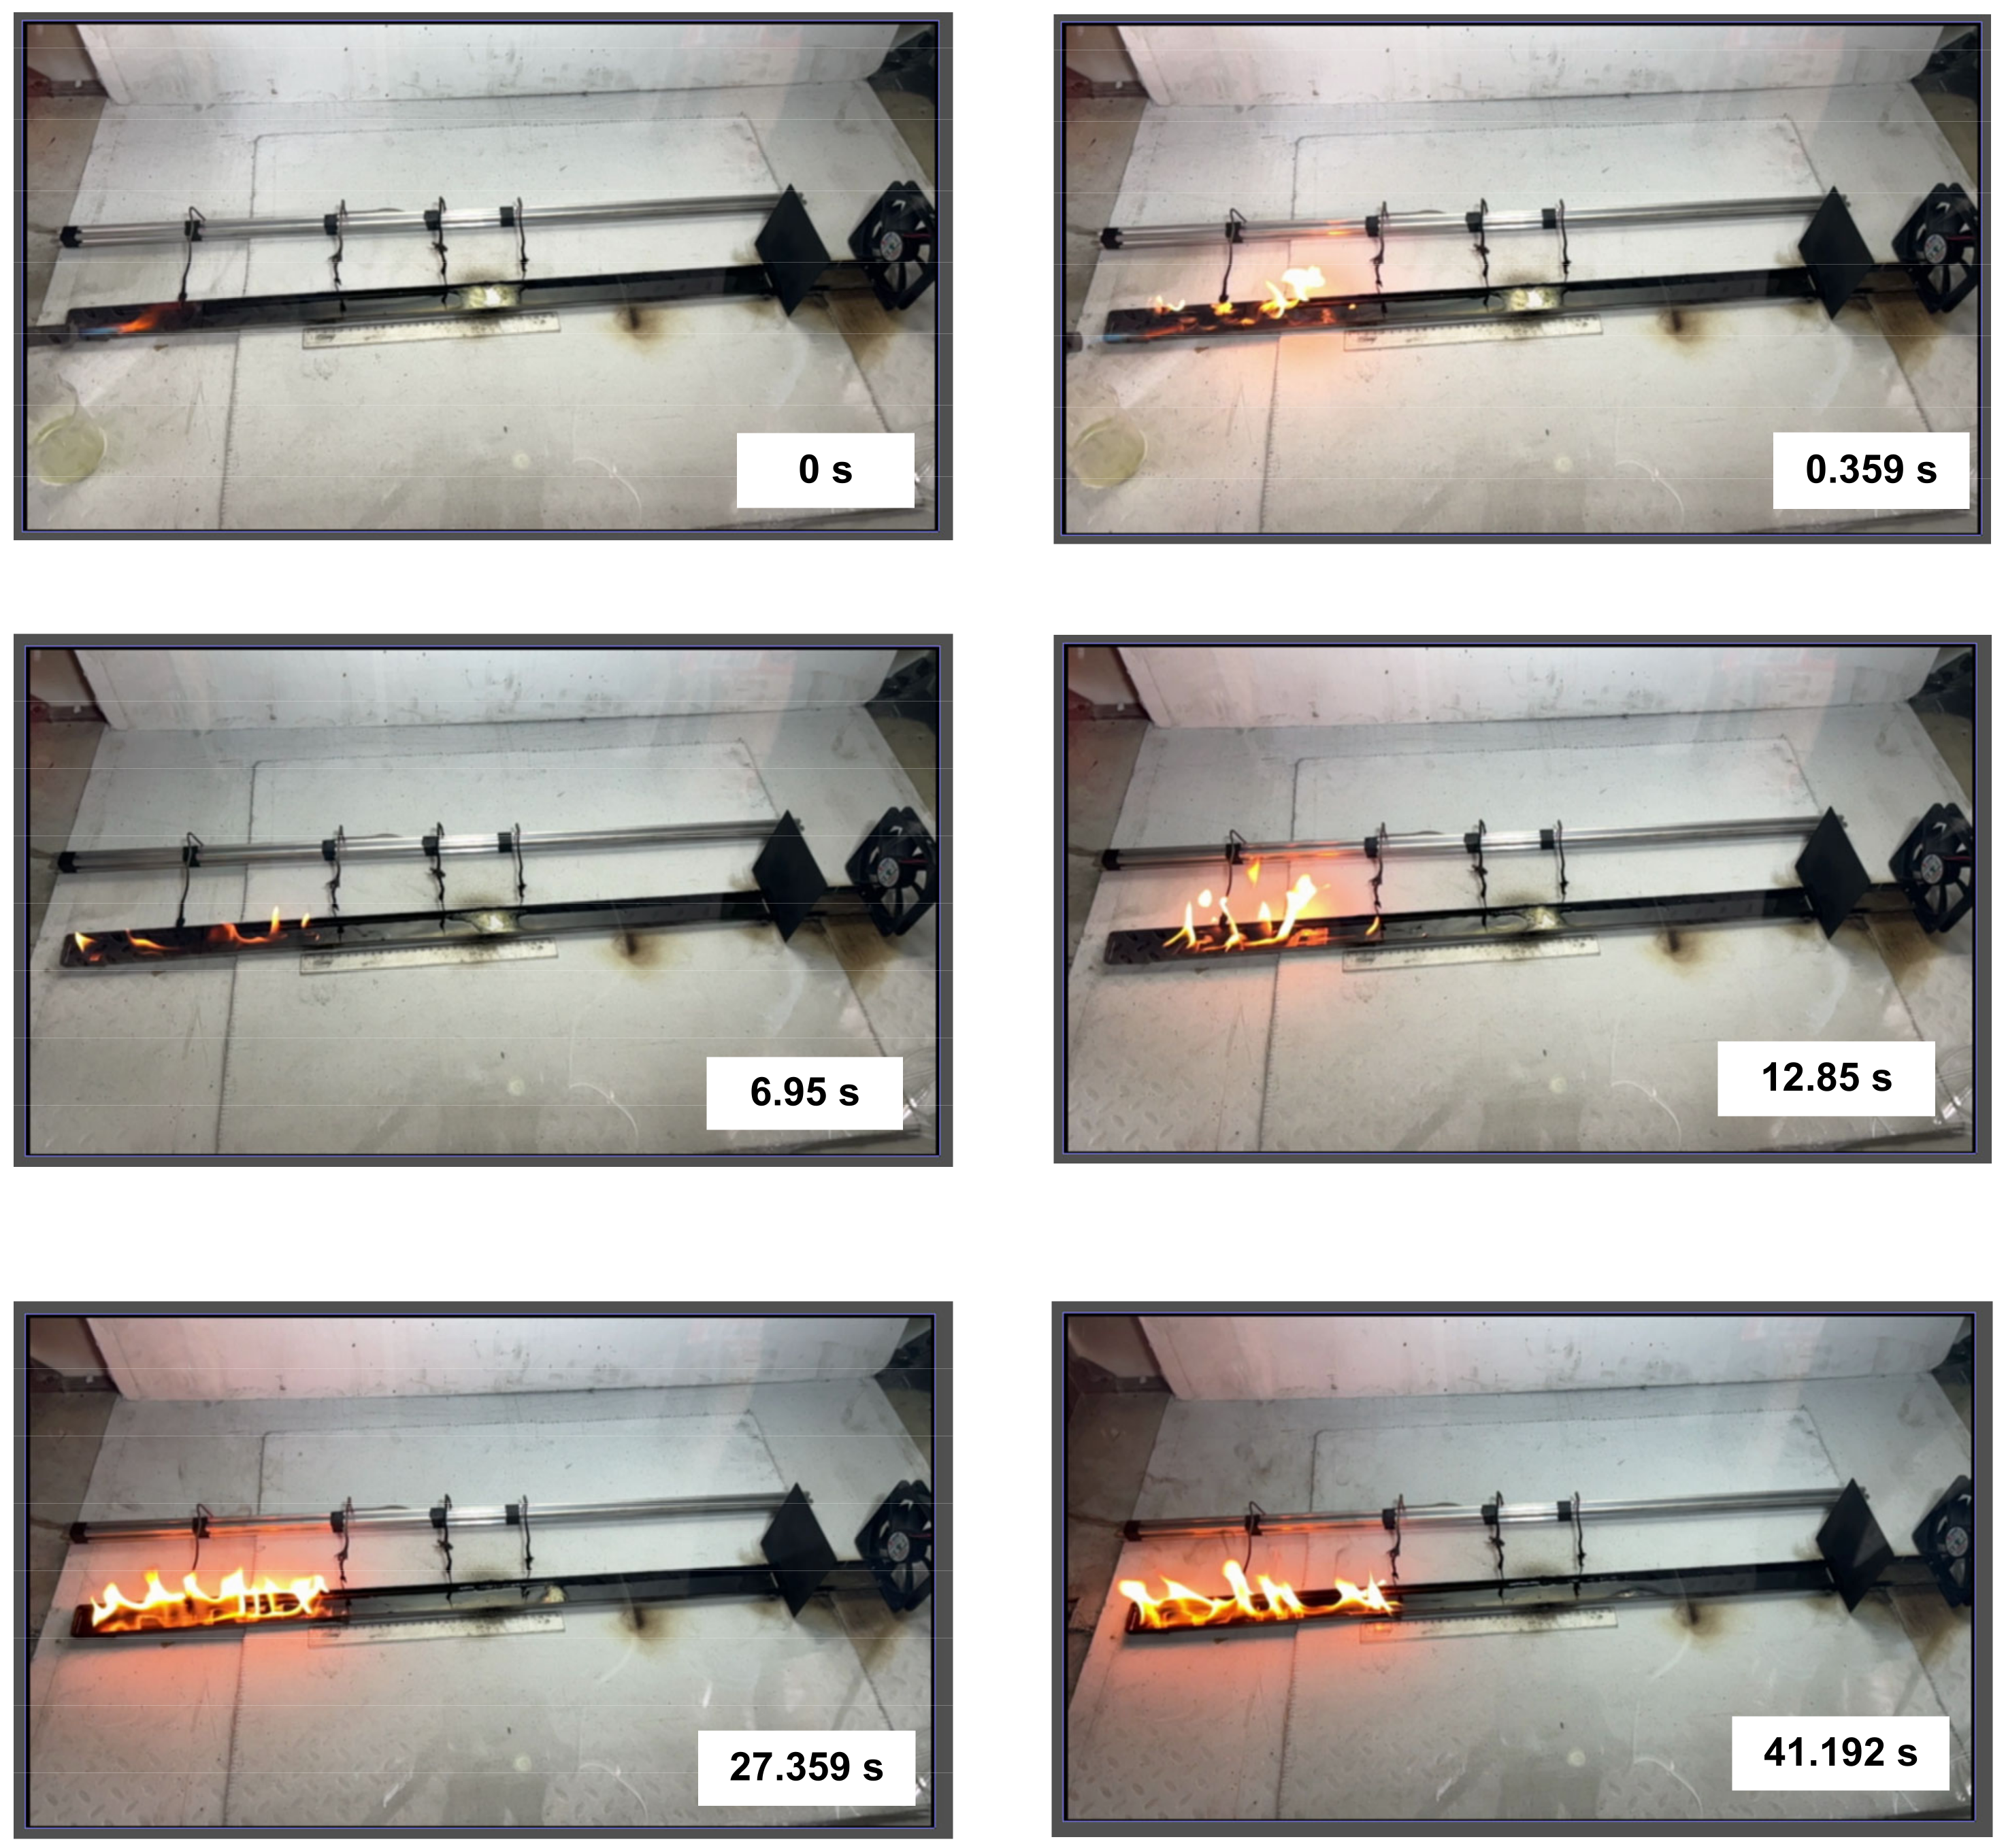
  • using a gas burner, the liquid was ignited at the left end of the channel;
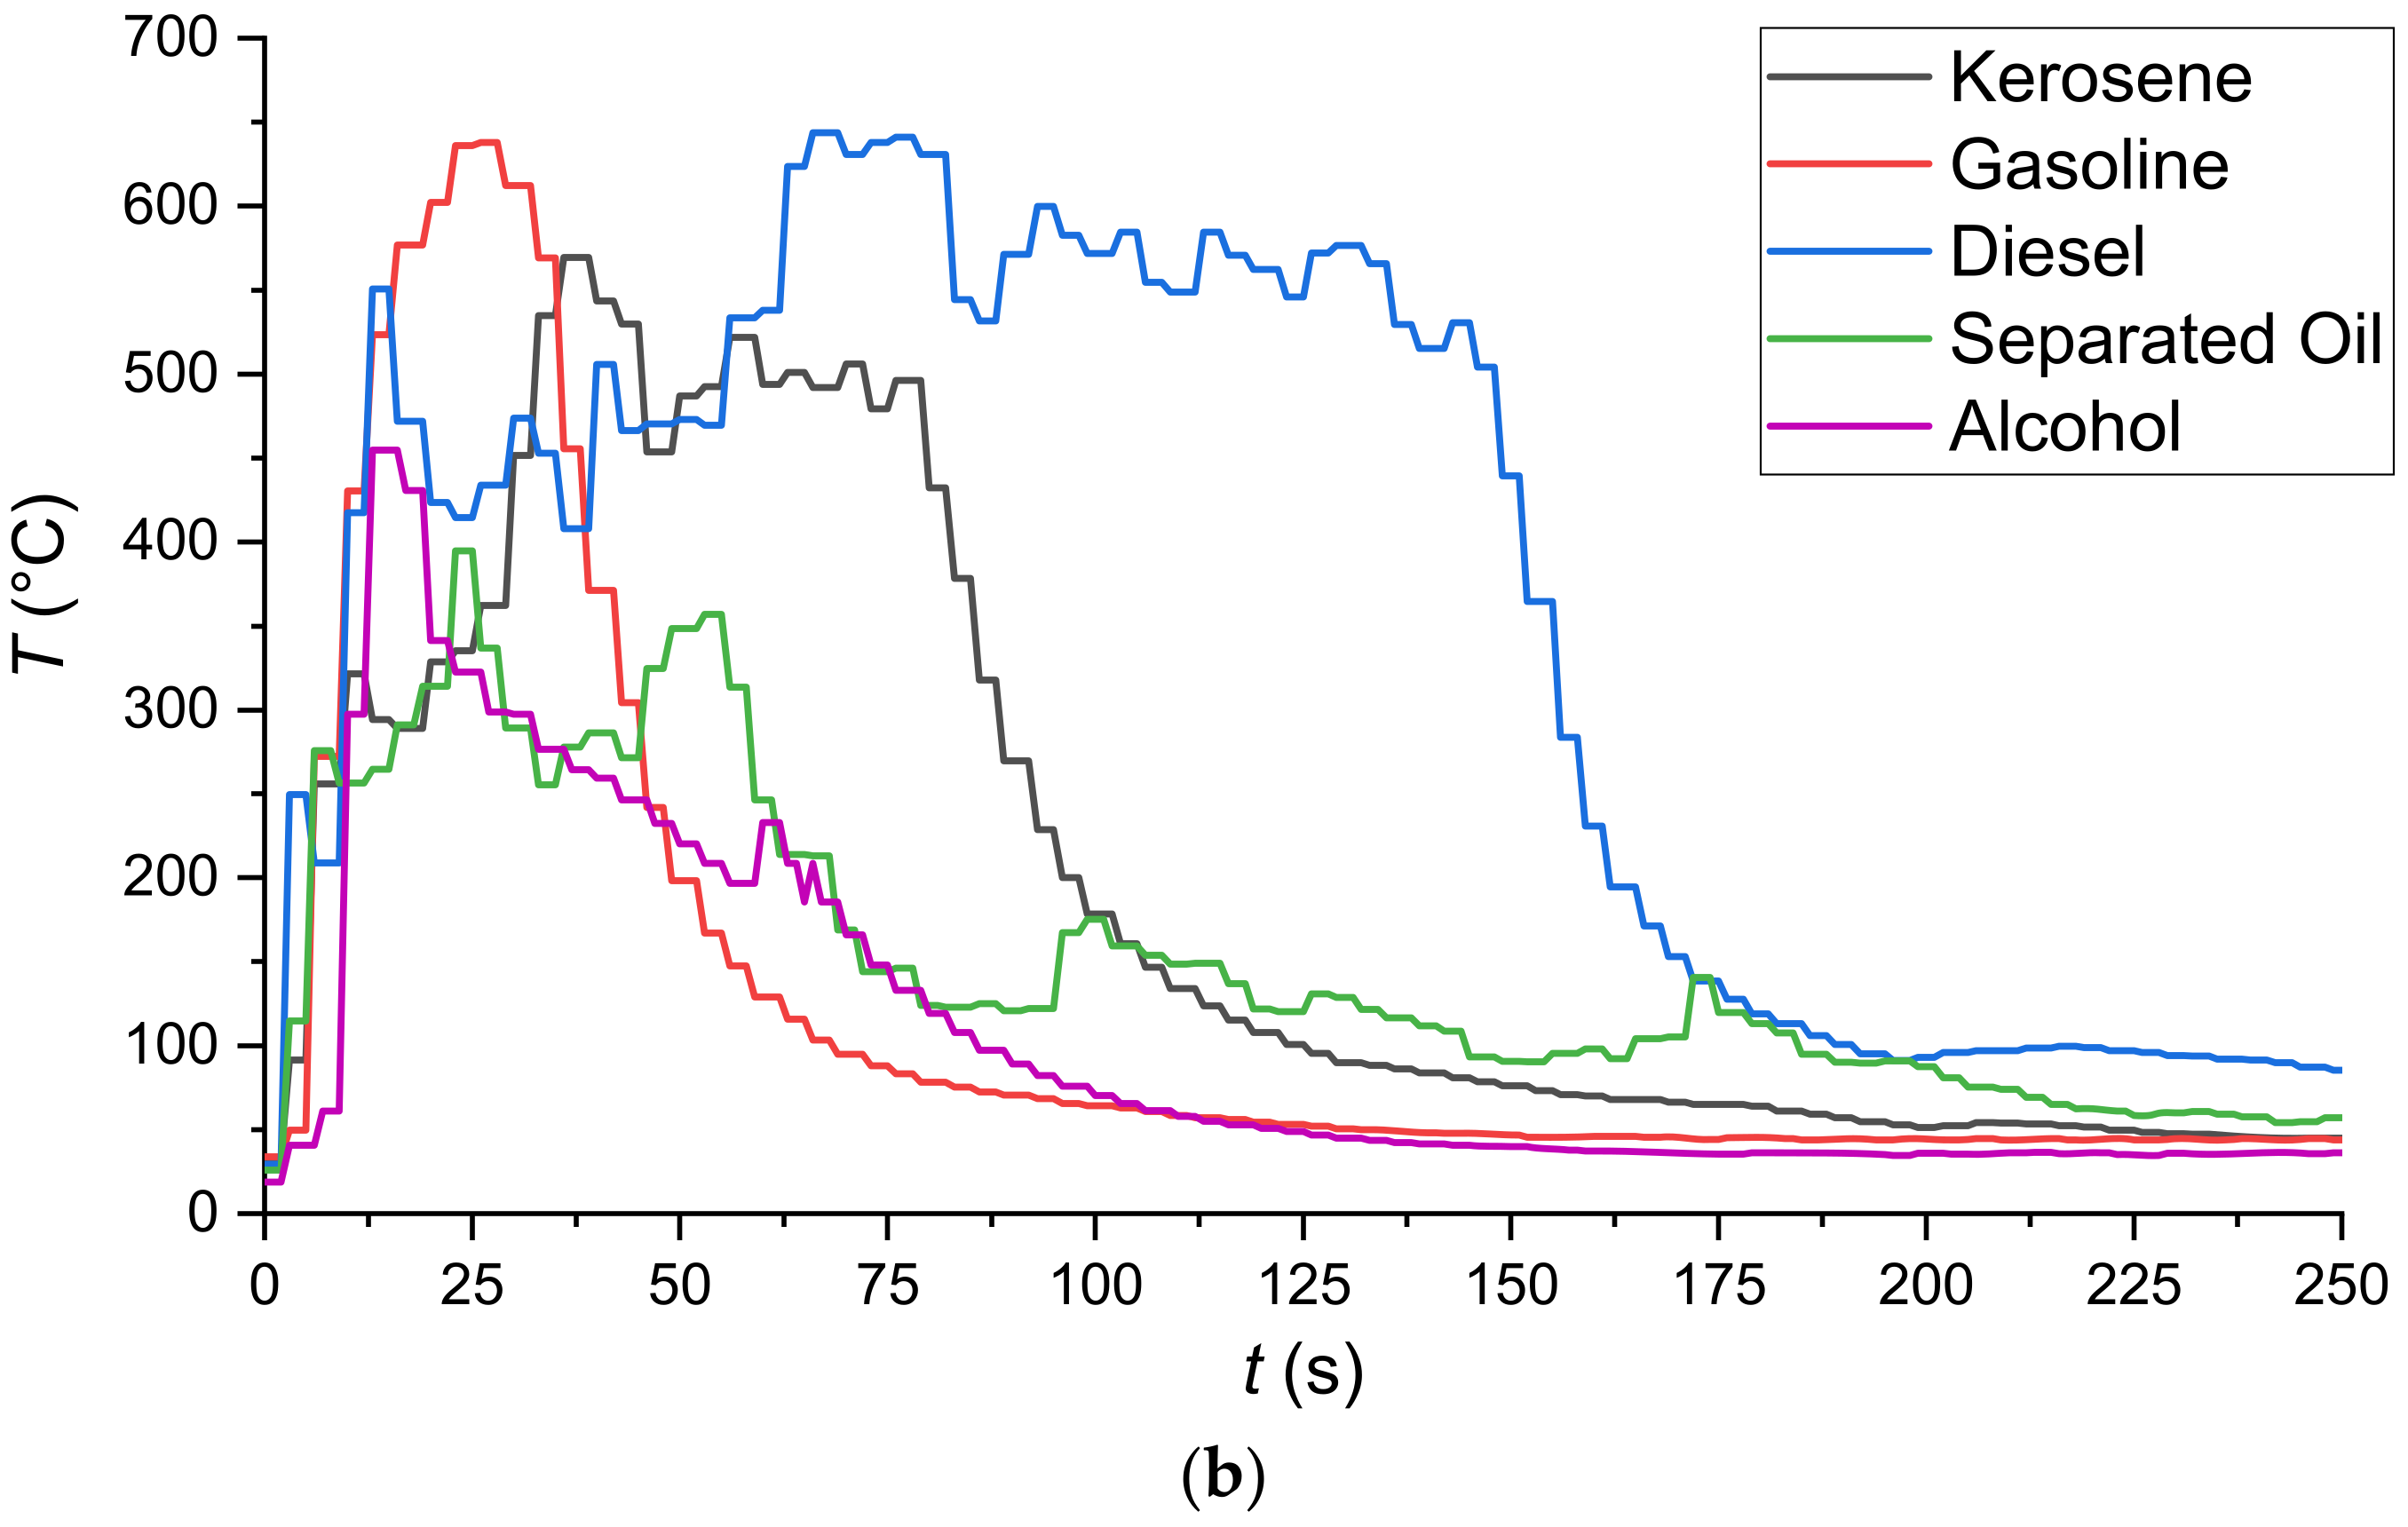
  • using fast-response thermocouples and a high-speed camera, the liquid combustion front propagation to the fire barrier was recorded;
  • depending on the experimental conditions, the flame quenching was then recorded after contact with the fire barrier or passing through it;
  • the recording of the key characteristics of the process stopped after the complete flame extinction.
The main recorded parameters were as follows (Figure 3): vapor combustion front velocity, liquid burnout rate, temperature in the flame zone, duration of flaming combustion, as well as gas hydrate dissociation, ice melting, and water evaporation rates. The parameters were measured using thermocouples (type K; 233–1573 K; accuracy ±1.5 K at T = 233–573 K, ±0.004 x T at T = 574–1573 K), camera No. 1 (1280 × 1280 pix, 240 fps), and camera No. 2 (1440 × 1080 pix, 1 fps). Two cameras were necessary because one was used for continuous recording of the entire experiment while the second was used for high-speed recording of the combustion development, vapor combustion front propagation, and flame interaction with the fire barrier.
An important point to note is that the temperature of the gas hydrate is much lower than the temperature of the fuel film. Thus, when in contact with the fuel film, the near-surface layer of the gas hydrate instantaneously heats, dissociates, and releases CO2. The intense gas release prevents a significant penetration of the fuel into the powder pores. At the same time, a CO2 hydrate powder is 70–75% water, which is immiscible with most of the flammable liquids considered in the experiments (except alcohol). This also helps the hydrate surface to repel the fuel. Moreover, the fuel temperature is much lower than the temperature of the flame and combustion products. For this reason, the submerged part of the hydrate and that above the fuel film will dissociate unevenly in time due to the difference in temperature (Figure 2). However, on average less than 10% of the total volume of the gas hydrate was submerged in the fuel as part of the experiments. That is why this aspect was disregarded during the analysis of the experimental findings.
The variable input parameters in the experiments were as follows: type of combustible liquid (kerosene, gasoline, Diesel fuel, alcohol, petroleum, or oil), volume of combustible liquid (10–30 mL), type of extinguishing agent in the fire barrier (ice or CO2 hydrate), mass of extinguishing agent (3–15 g), type of sample (loose layer or tablet), number of tablets (1–3), and number of fire barriers (1–3). The experiments involved ice and CO2 hydrate (powder and tablets) to compare the contribution of melting, evaporation, dissociation, and heat exchange. Figure 3 presents the measurement scheme in the experiments. The thermocouples in the experiments were located at a height of about 50 mm from the fuel surface.

3. Experimental Results and Discussion

The combustible liquids used in the experiments exhibited significantly different vapor combustion front propagation and burnout regimes. As a result, the integral characteristics of the processes under study also differed significantly (Table 2, Figure 4). The vapor combustion front velocities differed during the ignition and further flame combustion. Highly non-monotonic temperature variations in different cross-sections of the flame combustion zone were also revealed in the process. This happened due to the changing concentrations of the oxidizer, combustible liquid vapors, and combustion products over time due to the diffusive-convective heat and mass transfer. Supplementary Material Video S1 presents the footage showing the flame front velocity through the working channel during vapor ignition (first wave) and liquid burnout front velocity. The durations of the processes under study were specified to demonstrate the key differences. Before the main experiments, preliminary series was conducted to determine how the temperatures changed at different heights above the fuel film (Figure 4a). As observed (Figure 4a), the trends in temperature variation dynamics at different heights (20–100 mm) from the fuel film have an overall similar shape. At the same time, to ensure that the thermocouple junction recorded nothing but the flame temperature, the thermocouple was installed at 50 mm according to the data from Table 2.
The experiments show that gasoline (Figure 5) evaporates rapidly to form a fire-hazardous air-vapor environment above the surface of the entire channel filled with it. During the ignition, the combustion front was recorded to spread rapidly at the left end of the channel, going along the surface of the liquid in the channel and the gas phase outside the channel (above it, and to the left and right of it). As a result, the flame combustion zone was formed almost instantaneously across the entire channel. The flame combustion zone was divided into two characteristic sections by the fire barrier. The liquid-vapor ignition and flame fronts propagated almost simultaneously in both sections. Due to the rapid release of the light fraction, the flame was relatively high compared to other liquids. Similar patterns were observed in the experiments with separated oil (Figure 6) containing a large proportion of light fractions. The experiments helped us identify interesting aspects of oil combustion front deceleration as it moved towards the fire barrier from one direction (Supplementary Material Video S2, the timer began at the start of the ignition process, which is used as reference time) and from both directions (Supplementary Material Video S3, the start of ignition is used as reference time). However, if the heat from the combustion zone was several times higher than that spent on the gas hydrate dissociation, ice melting, and water evaporation, the combustion was more intense after the main fraction of gas passed through the fire barrier (in Supplementary Material Video S4, the moment when these effects emerged is used as reference time). This happened because water was the prevalent substance remaining in the fire barrier, as it boiled at high temperatures at combustion. This enhanced the fragmentation of the burning liquid film, i.e., water spraying in the combustion zone.
The alcohol combustion front (Figure 7) spread at a much lower velocity and with a lower flame height. The combustion front slowed down as it reached the fire barrier in the form of CO2 hydrate powder. We recorded fluctuations in the combustion front velocity and direction due to the melting and evaporation fronts moving towards it, as well as carbon dioxide dissociation. After quite a long time of such fluctuations, the flame combustion front moved through the fire barrier because the alcohol dissolved in water. The alcohol evaporation rate is high enough to form a combustible air-vapor environment. Only when the gas hydrate dissociation times were longer than the alcohol evaporation and burnout times, were the combustion fronts contained and suppressed. As the alcohol dissolved in water at a variable rate in each experiment, the data dispersion was the highest among all the liquids studied.
Experiments with kerosene (Figure 8) showed the most stable combustion compared to other liquids in the working channel. This was the reason to use this combustible liquid in most of the subsequent experiments with varying key parameters. The flame height during kerosene combustion changed negligibly along the channel length except for the zone around the fire barrier. Due to the intense inflow of inert gas formed during the gas hydrate dissociation, the chemical reactions slowed down considerably. Supplementary Materials Videos S5 and S6 (the start of ignition is used as reference time) present the typical footage of the experiments showing the flame combustion front repeatedly approaching the fire barrier and moving away from it. The opposing processes happening simultaneously enhance the non-monotonic nature of variations in the velocities and directions of liquid fuel combustion fronts as well as ice melting and water evaporation rates in the fire barrier. At the same time, the fire barrier was found to shift slightly as the flame combustion front moved forward, displacing the barrier along its path. At high heat fluxes from the combustion front, the structure and thickness of the fire barrier changed significantly. The greater the gas concentration in the fire barrier, the greater the shift amplitudes of combustion, melting, evaporation, and dissociation fronts. If the gas hydrate dissociation time was much shorter than the liquid combustion time (low gas hydrate mass in the barrier), the combustion front spread through the fire barrier, though slowing down significantly for a certain period (Supplementary Material Video S7, the start of ignition is used as reference time).
The experiments with gas hydrate tablets in the fire barrier show that liquid combustion can be contained even if the fire barrier is discontinuous (in the form of sectors or cells) and revealed some important patterns of the process. For instance, Supplementary Materials Videos S8 and S11 (the start of ignition is used as reference time) show typical footage and the patterns established in the process. In the first case, the combustion front failed to pass through the fire barrier, and in the second case, the front stopped moving for some time and was then observed to spread beyond the barrier. For the successful containment of liquid combustion using gas hydrate tablets, it is important to minimize the distance between them. A series of evaluation experiments showed that the distance between tablets should not exceed 5–7 mm. Under such conditions, the liquid combustion front approaching the samples led to rapid ice melting and filling the cavities between tablets with water. Intense gas hydrate dissociation led to the formation of a multi-layer fire barrier before the combustion front. As the tablets shifted when exposed to the combustion front, this cellular fire barrier made of a set of tablets became wider than a loose layer of hydrate powder.
Diesel fuel (Figure 9) contains a small proportion of light fractions. That is why vapor ignition took much longer compared to the other liquids studied. This factor is the reason for much lower liquid combustion front velocities before the fire barrier. Moderate combustion front velocities made it possible to contain the fire effectively. These experiments were notable for the intense water droplet fragmentation in the combustion front because ice melting and water evaporation intensified when the hydrate was heated. This formed immiscible films of water and Diesel fuel. As the water was superheated to the boiling point, vapor bubbles were formed under the Diesel fuel film, which impeded their release. As a result, pressure increased under the film. When a certain critical pressure was exceeded, the film burst and vapor bubbles were released and swept away together with a certain volume of water and Diesel fuel from the film surface. As the fraction of water was rather low, heterogeneous liquid fragments ignited in the flame and actively broke up again. The experiments have shown that such breakup occurs in a cascade manner. These conditions should be controlled as they determine the growth of the combustion area. Quite similar patterns were observed for industrial oil because the viscosity, surface tension, evaporation rate, ignition temperature, and heat of combustion of oil and Diesel fuel are comparable.
It was experimentally established that the necessary and sufficient mass of CO2 hydrate for the containment and suppression of a flame combustion front of burning liquids without intense vapor combustion (such as kerosene and Diesel) was about 3 g under the experimental conditions (Figure 1). In the case of intense flame combustion of liquids, the mass of hydrate used in the fire barrier should be increased. Models were developed for predicting the threshold size of fire barriers and the gas hydrate mass and for evaluating the contribution of ice melting, water evaporation, and gas hydrate dissociation. To distinguish between the effects of these processes, more experiments were conducted with a fire barrier from ice to eliminate the contribution of the gas hydrate dissociation. The experiments were conducted using the following widespread combustible liquids: kerosene, gasoline, Diesel fuel, alcohol, and separated oil. A combustible liquid with a volume of 25 mL was poured into the working channel and spread evenly across the entire area of the latter. Ice was prepared from tap water by keeping it in a freezer for 12 h. The resulting ice was crushed mechanically, weighed on a Vibra HT 84RCE laboratory microbalance with an increment of 10−5 g, and then placed into the same area as the hydrate samples in earlier experiments. A combustible liquid was ignited on one of the sides of the working channel using a propane burner. Figure 10 presents typical experimental images of the ice fire barrier.
The experiments revealed the main aspects of the process under study as well as the degree of ice fire barrier effectiveness in impeding the propagation of the flammable liquid combustion front. A sample of crushed ice was weighed before being poured into the fire barrier. The mass of the sample varied from 5 g to 15 g, and the width of the fire barrier ranged from 2 to 5 cm, respectively. The height of the fire barrier made of ice powder was 1–2 cm and was kept comparable to that of the barrier made of carbon dioxide hydrate powder. The analysis of the experimental footage and its processing helped us formulate the key liquid-specific conclusions:
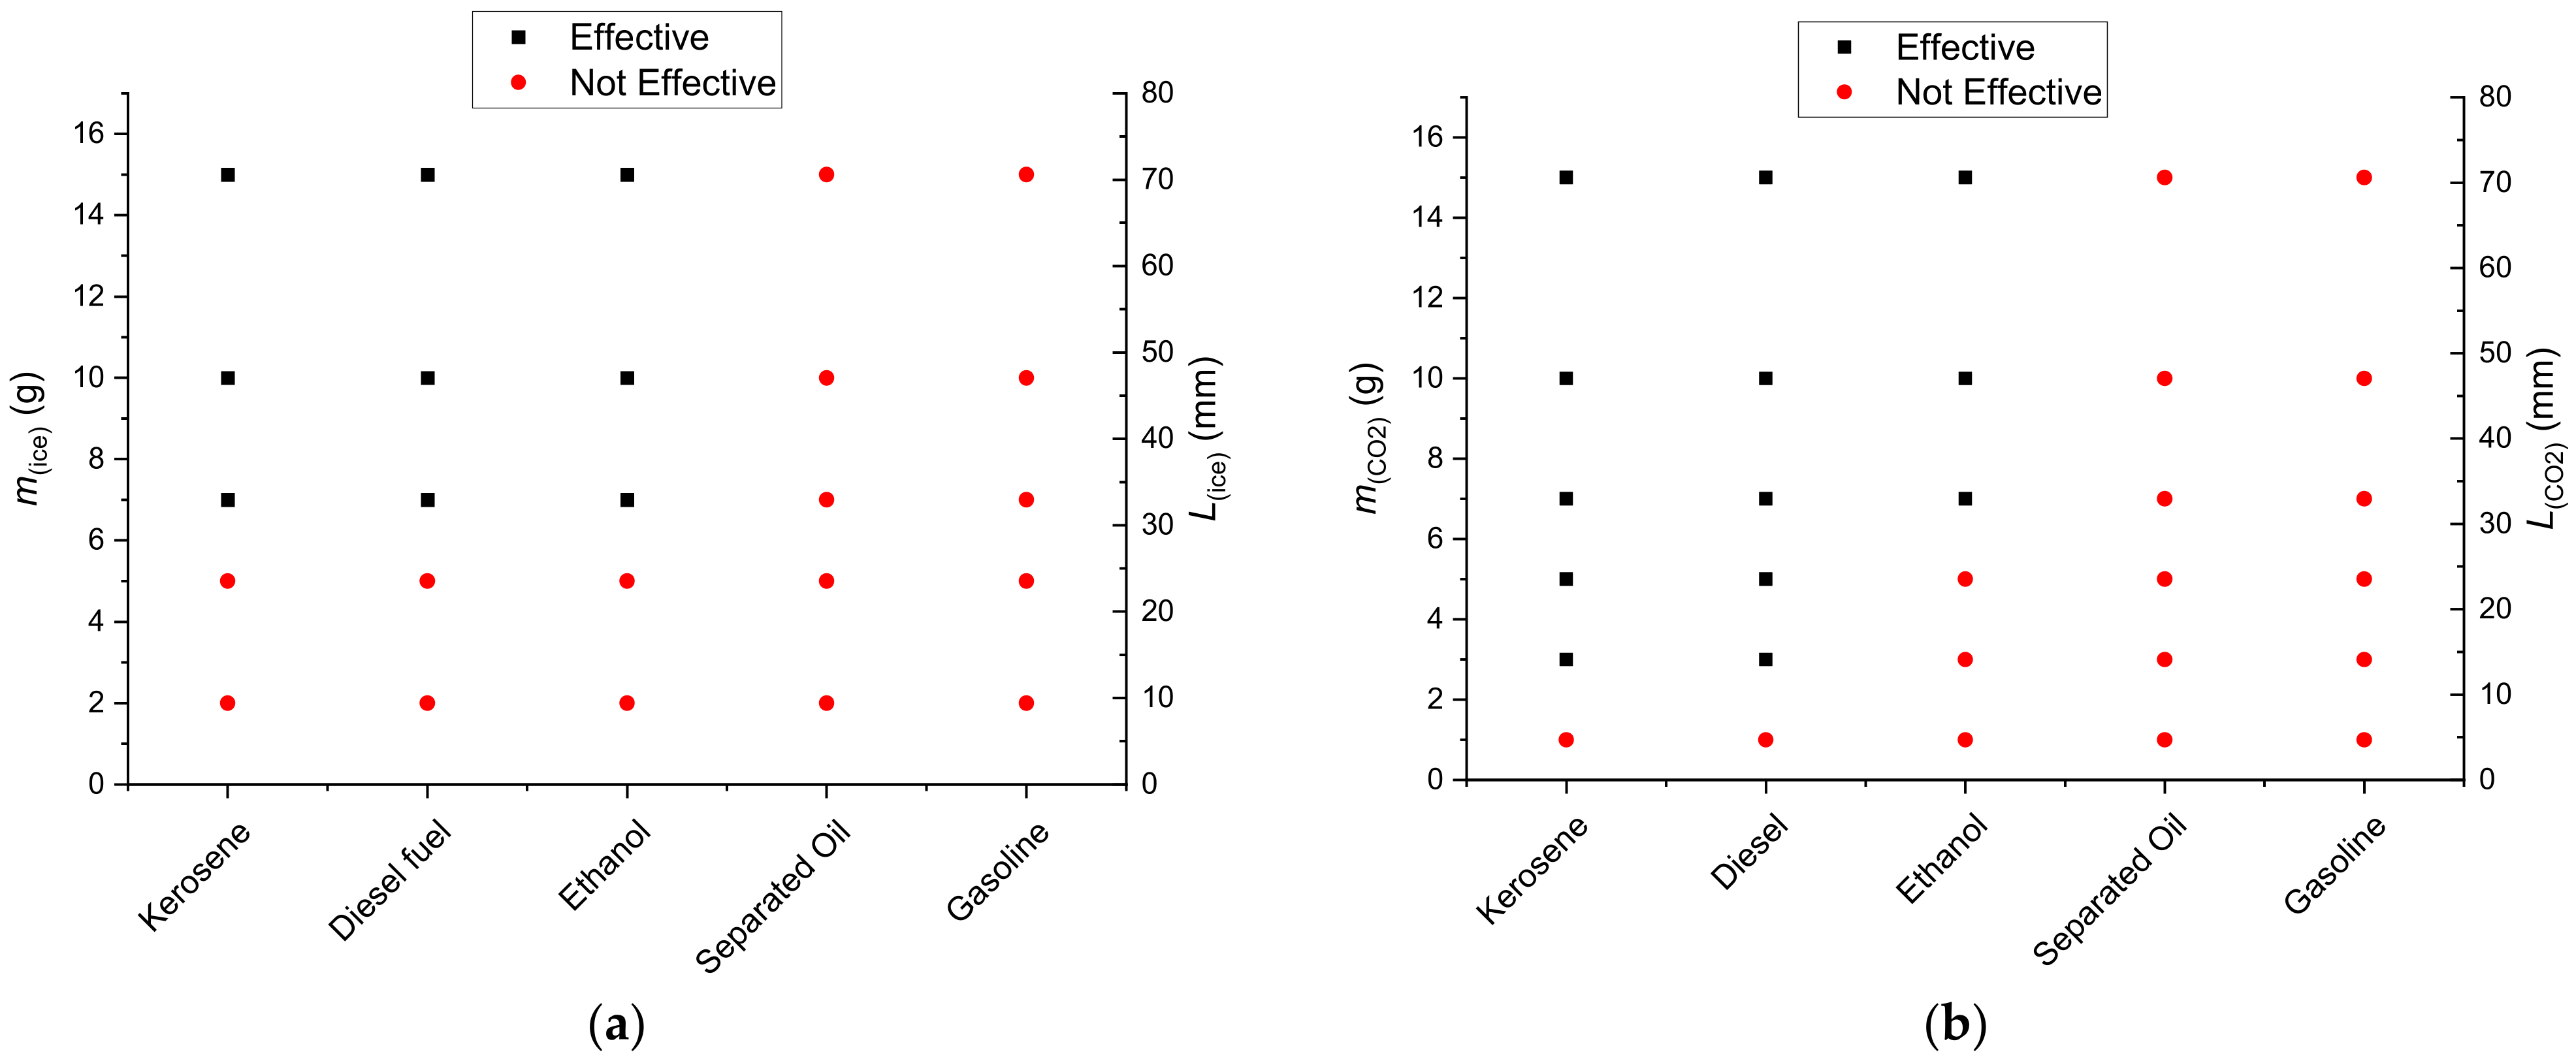
  • Kerosene. A fire barrier made of ice effectively contained the fire and slowed down the combustion front. The necessary and sufficient mass of ice for impeding the flame front propagation was 7 g. The ice-melting front propagated quite monotonously in the experiment. The resulting water filled the entire width of the working channel and further displaced the combustion front. When the mass of ice was about 5 g, the water failed to fill the whole width of the channel, so the flame front passed through the fire barrier. It is also important to note that a fire barrier made of water with similar properties to the one produced from ice melting also effectively impedes the combustion front propagation.
  • Gasoline. Ice-based fire barriers did not slow down the gasoline combustion front. The combustion front propagation was accompanied by the ignition of gasoline vapors. For this reason, an effective fire barrier should be long enough to block not only the combustible liquid but also vapors over the gasoline surface.
  • Diesel fuel. Ice as a fire barrier exhibited high efficiency. Just as with kerosene, the necessary and sufficient mass of ice for impeding the flame front propagation was 7 g. All the processes were also similar to those detailed earlier in the experiments with kerosene;
  • Alcohol. Ice in a fire barrier stopped the flame effectively. The necessary and sufficient mass of ice for impeding the flame front propagation was 7 g. Unlike in the experiments with kerosene and Diesel fuel, the combustion front was located directly against the fire barrier. The water formed as a result of ice melting did not displace the combustible liquid but mixed with it, somewhat reducing the combustion intensity. In the case of alcohol, ice was effective if it did not melt until the full burnout of the combustible liquid before the fire barrier. Otherwise, the flame front could pass through the fire barrier.
  • Separated oil. Ice showed low efficiency as the main substance for a fire barrier in the experiments with separated oil. Just as with gasoline, light fractions in the composition of separated oil clearly affected the flame front propagation. The flame front reached the fire barrier and dwelt there for 2–5 s; after that, oil vapors ignited behind the fire barrier and the combustion front passed through it.
Figure 11 shows effective (combustion front cannot pass the barrier, and the flame quenches) and ineffective (combustion front passed through the barrier) masses of ice and gas hydrate powder (m(ice), m(CO2)) in a fire barrier obtained experimentally. The map specifies the width of the fire barrier Lice with varying ice powder mass. Figure 11 shows that the flame front containment requires about half as much hydrate by weight as ice (for kerosene and diesel fuel), other things being equal. This result clearly illustrates the additional effect of hydrate dissociation and CO2 release (for kerosene and diesel fuel) on fire suppression efficiency.
Typical footage was singled out showing the ice fire barrier performance against kerosene (Supplementary Material Video S10), alcohol (Supplementary Material Video S11), and gasoline fires (Supplementary Material Video S12). The experiments with a fire barrier made of ice powder revealed a number of interesting patterns. The ice powder fire barrier significantly expanded in width when ice melting intensified and usually turned into a homogeneous water film covering a combustible liquid. This film spread in the direction of the combustion front propagation. The whole fire barrier often shifted by several centimeters after the ice melted. The higher the flame was in the front (and, hence, the greater the heat flux), the further the water film moved from its initial position. If, however, several local water films were formed in the fire barrier while the ice melted, the flame combustion front passed between them almost instantaneously after reaching the barrier. Therefore, ice and water filling the whole width of the barrier was a prerequisite for the stop of the combustion front. A prerequisite for fire containment in general was that the time of liquid burnout before the barrier should be shorter than the water film evaporation time in the fire barrier while remaining intact and covering the whole width of the channel. In all the experiments with consistent fire containment, water film in the barrier retained its width equal to the width of the working channel. As for the width of the fire barrier, it played an important role in the experiments with combustible liquids with a large proportion of light fractions and significant flame height before the barrier. Unlike in the experiments with gas hydrate powder, the combustion front moved towards the barrier at a certain stable velocity and stopped after reaching the water film formed due to ice melting in the barrier. The water film expanded due to the intense ice heating and melting. As a result, the combustion front boundary shifted about 1 cm in the opposite direction. In comparison, the flame combustion front boundary shifted more significantly in the experiments with gas hydrate powder. This shift was pulsating due to the non-monotonous release of carbon dioxide and water vapors as well as ice melting. In the corresponding experiments, the combustion front shifted in the opposite direction by 5–10 cm. These aspects are crucial in the case of combustible liquids with a high flame in the front and a large proportion of volatile fractions. The wider the fire barrier next to a burning liquid, the higher the probability of successful fire containment. A set of effects related to the carbon dioxide hydrate dissociation, ice melting, and water evaporation contributes to the stable deceleration of the combustion front. If these processes last longer than the time it takes the liquid to burn out in front of the barrier, consistent fire containment is provided.
The fuel volume and, hence, the thickness of the fuel film only affects the fuel combustion time (with the constant burnout rate, the relationship between the burnout time and fuel volume is virtually linear). As fuel combustion largely occurs in the gas phase and on the surface, the efficiency of the fire barrier does not directly depend on the thickness (height) of the fuel film. However, with an increase in the fuel film thickness, the volume of the fuel in front of the fire barrier increases as well, which prolongs combustion. Longer combustion time can indirectly cause full dissociation of CO2 hydrate (when used) and partial boiloff of the resulting water, which may help the combustion front to overcome the fire barrier. Thus, given the linear relationship between the fuel burnout time and its volume, the fire front can be effectively stopped if the volume of the extinguishing agent (hydrate or ice) is increased in direct proportion to the thickness of the fuel film.

4. Mathematical Modeling

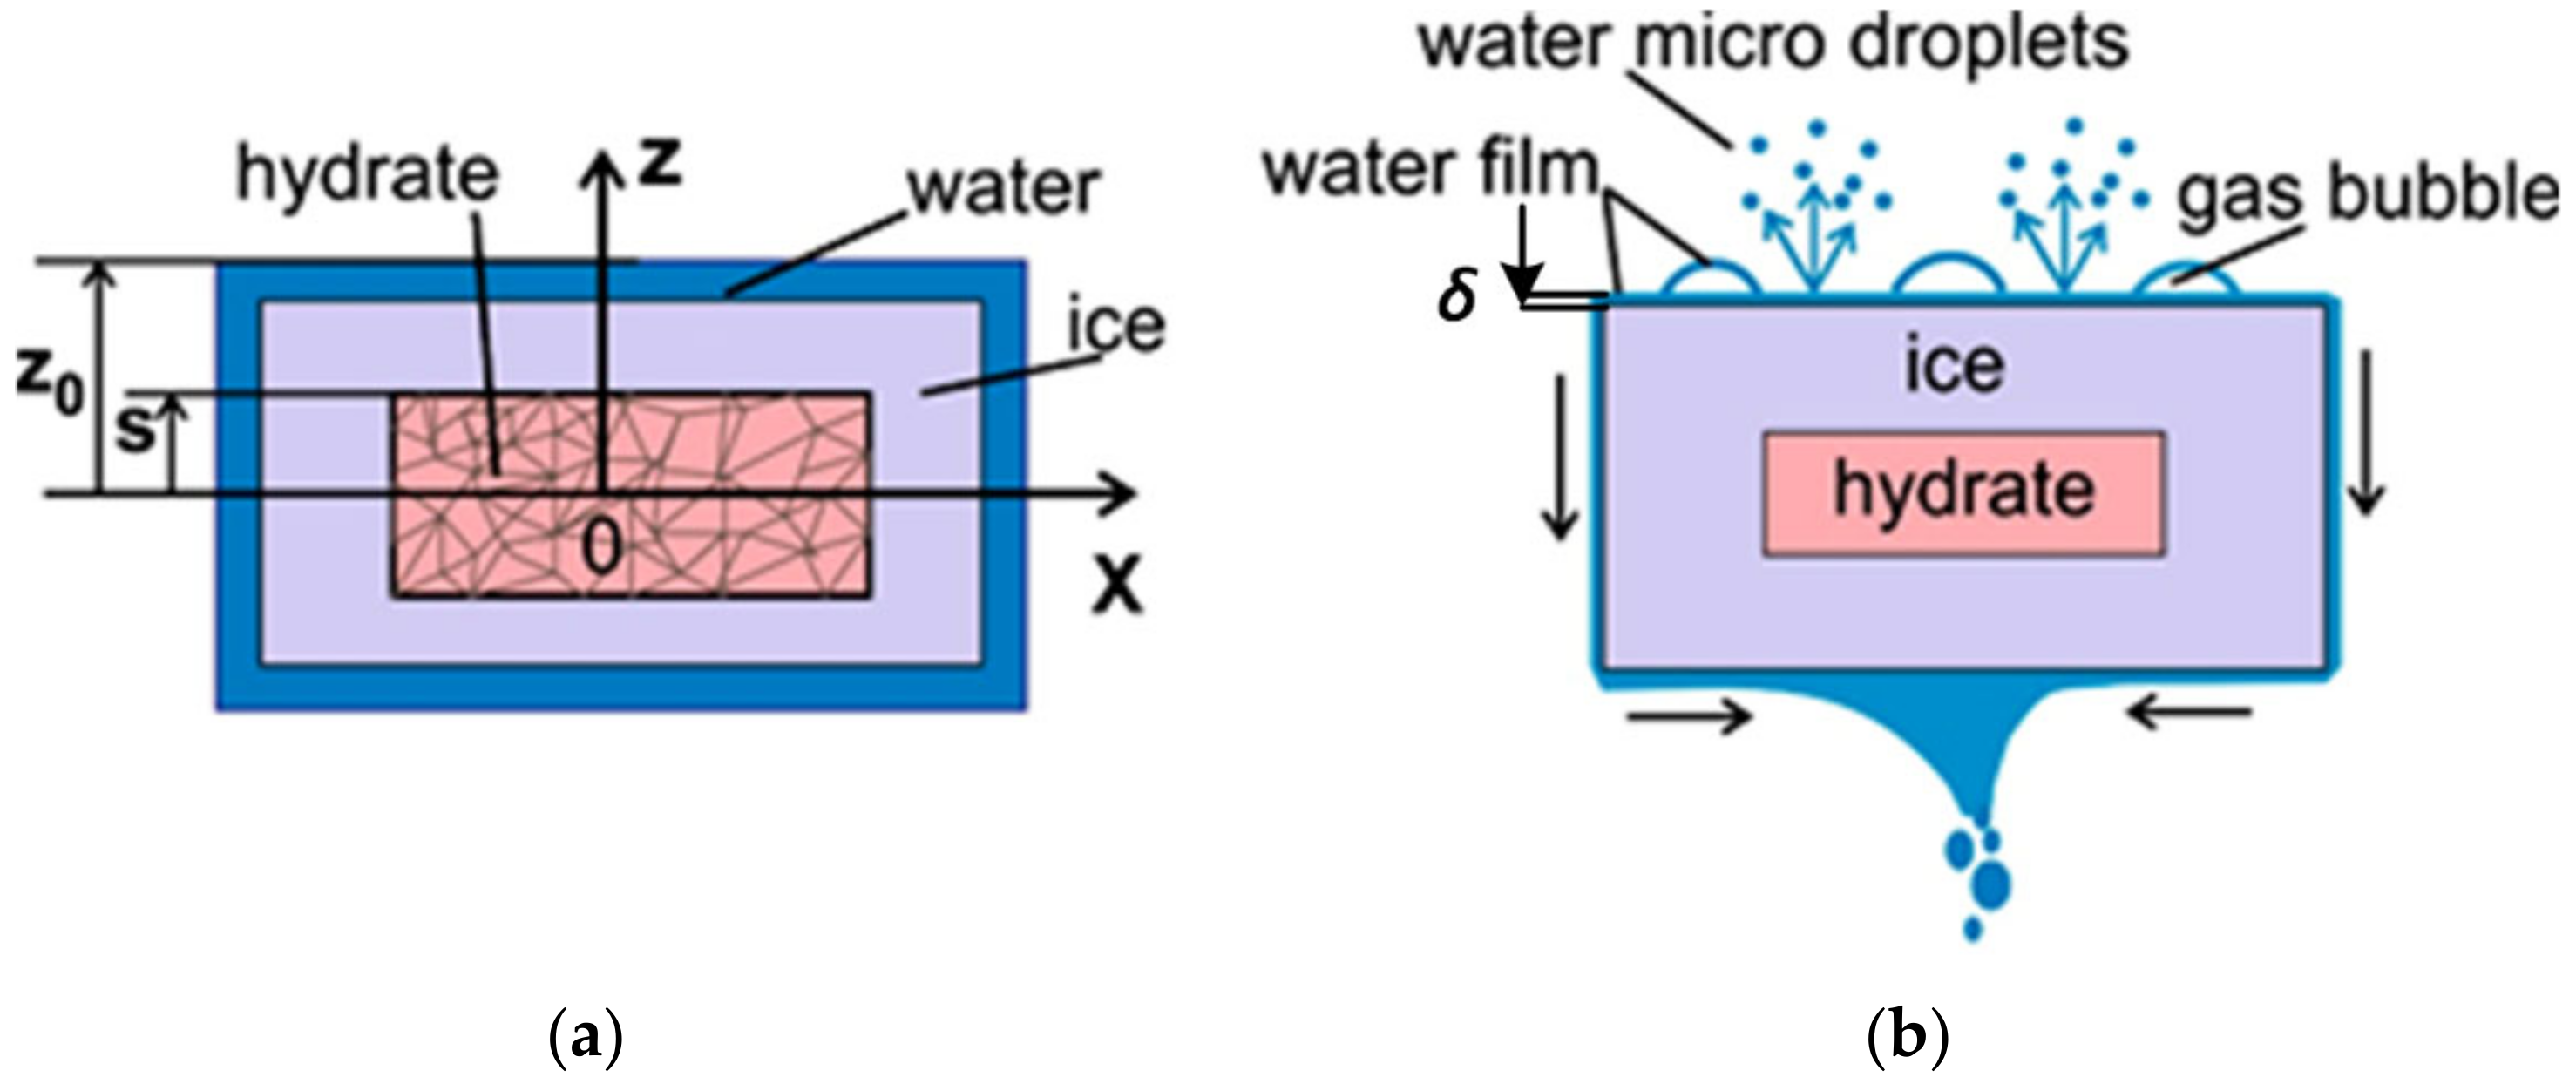
4.1. Physical Problem Statement

In this research, we calculated the key characteristics of fire containment and suppression over a liquid fuel film spread over a layer of water. The aim of the mathematical modeling was to identify the main physical mechanisms defining the flame combustion front velocity and the criteria determining the flame propagation and stoppage. The previous section stated that high flame front velocities were recorded for a set of different combustible liquids. Two significantly different problem statements can be singled out: (i) the fuel surface area is limited, and the fuel layer’s thickness significantly exceeds the capillary constant; (ii) the fuel surface area is not limited, and the height of the liquid fuel film is constant and equal to the capillary constant. Further sections will present the modeling results for the second scenario of fuel film combustion. The first scenario is another special case in the solution with a variable fuel layer height. During the high-temperature dissociation of carbon dioxide hydrate powder, a large amount of CO2 is released, which displaces the oxidizer and suppresses flame combustion. Three physical mechanisms were singled out from the experimental data obtained. The distinguishing features of the mechanisms were as follows:
(i) The heat of phase transitions (water evaporation, ice melting, and gas hydrate dissociation) leads to a temperature decrease in the flame zone below a critical point, at which combustion becomes unstable. The flame stability issues were neglected during modeling. All the key heats and the thermal balance equation were taken into account when modeling the gas hydrate dissociation.
(ii) The second important point is related to the movement of the flame front. The experiments have shown that the flame front can leap over a gas hydrate barrier and move further due to the combustion of fuel vapors. It is necessary to determine the critical width of the hydrate powder barrier that would make the front stop without leaping over it even in the case of intense vapor diffusion and convection.
(iii) The combustion front may stop for a short time if the total CO2 hydrate dissociation time is shorter than the fuel burnout time.
In line with the three above mechanisms, it is necessary to find out if it is appropriate to use three models of flame suppression, i.e., to analyze three simplified key parameters defining the fire containment and suppression (and taking the scaling of the firefighting process into account).

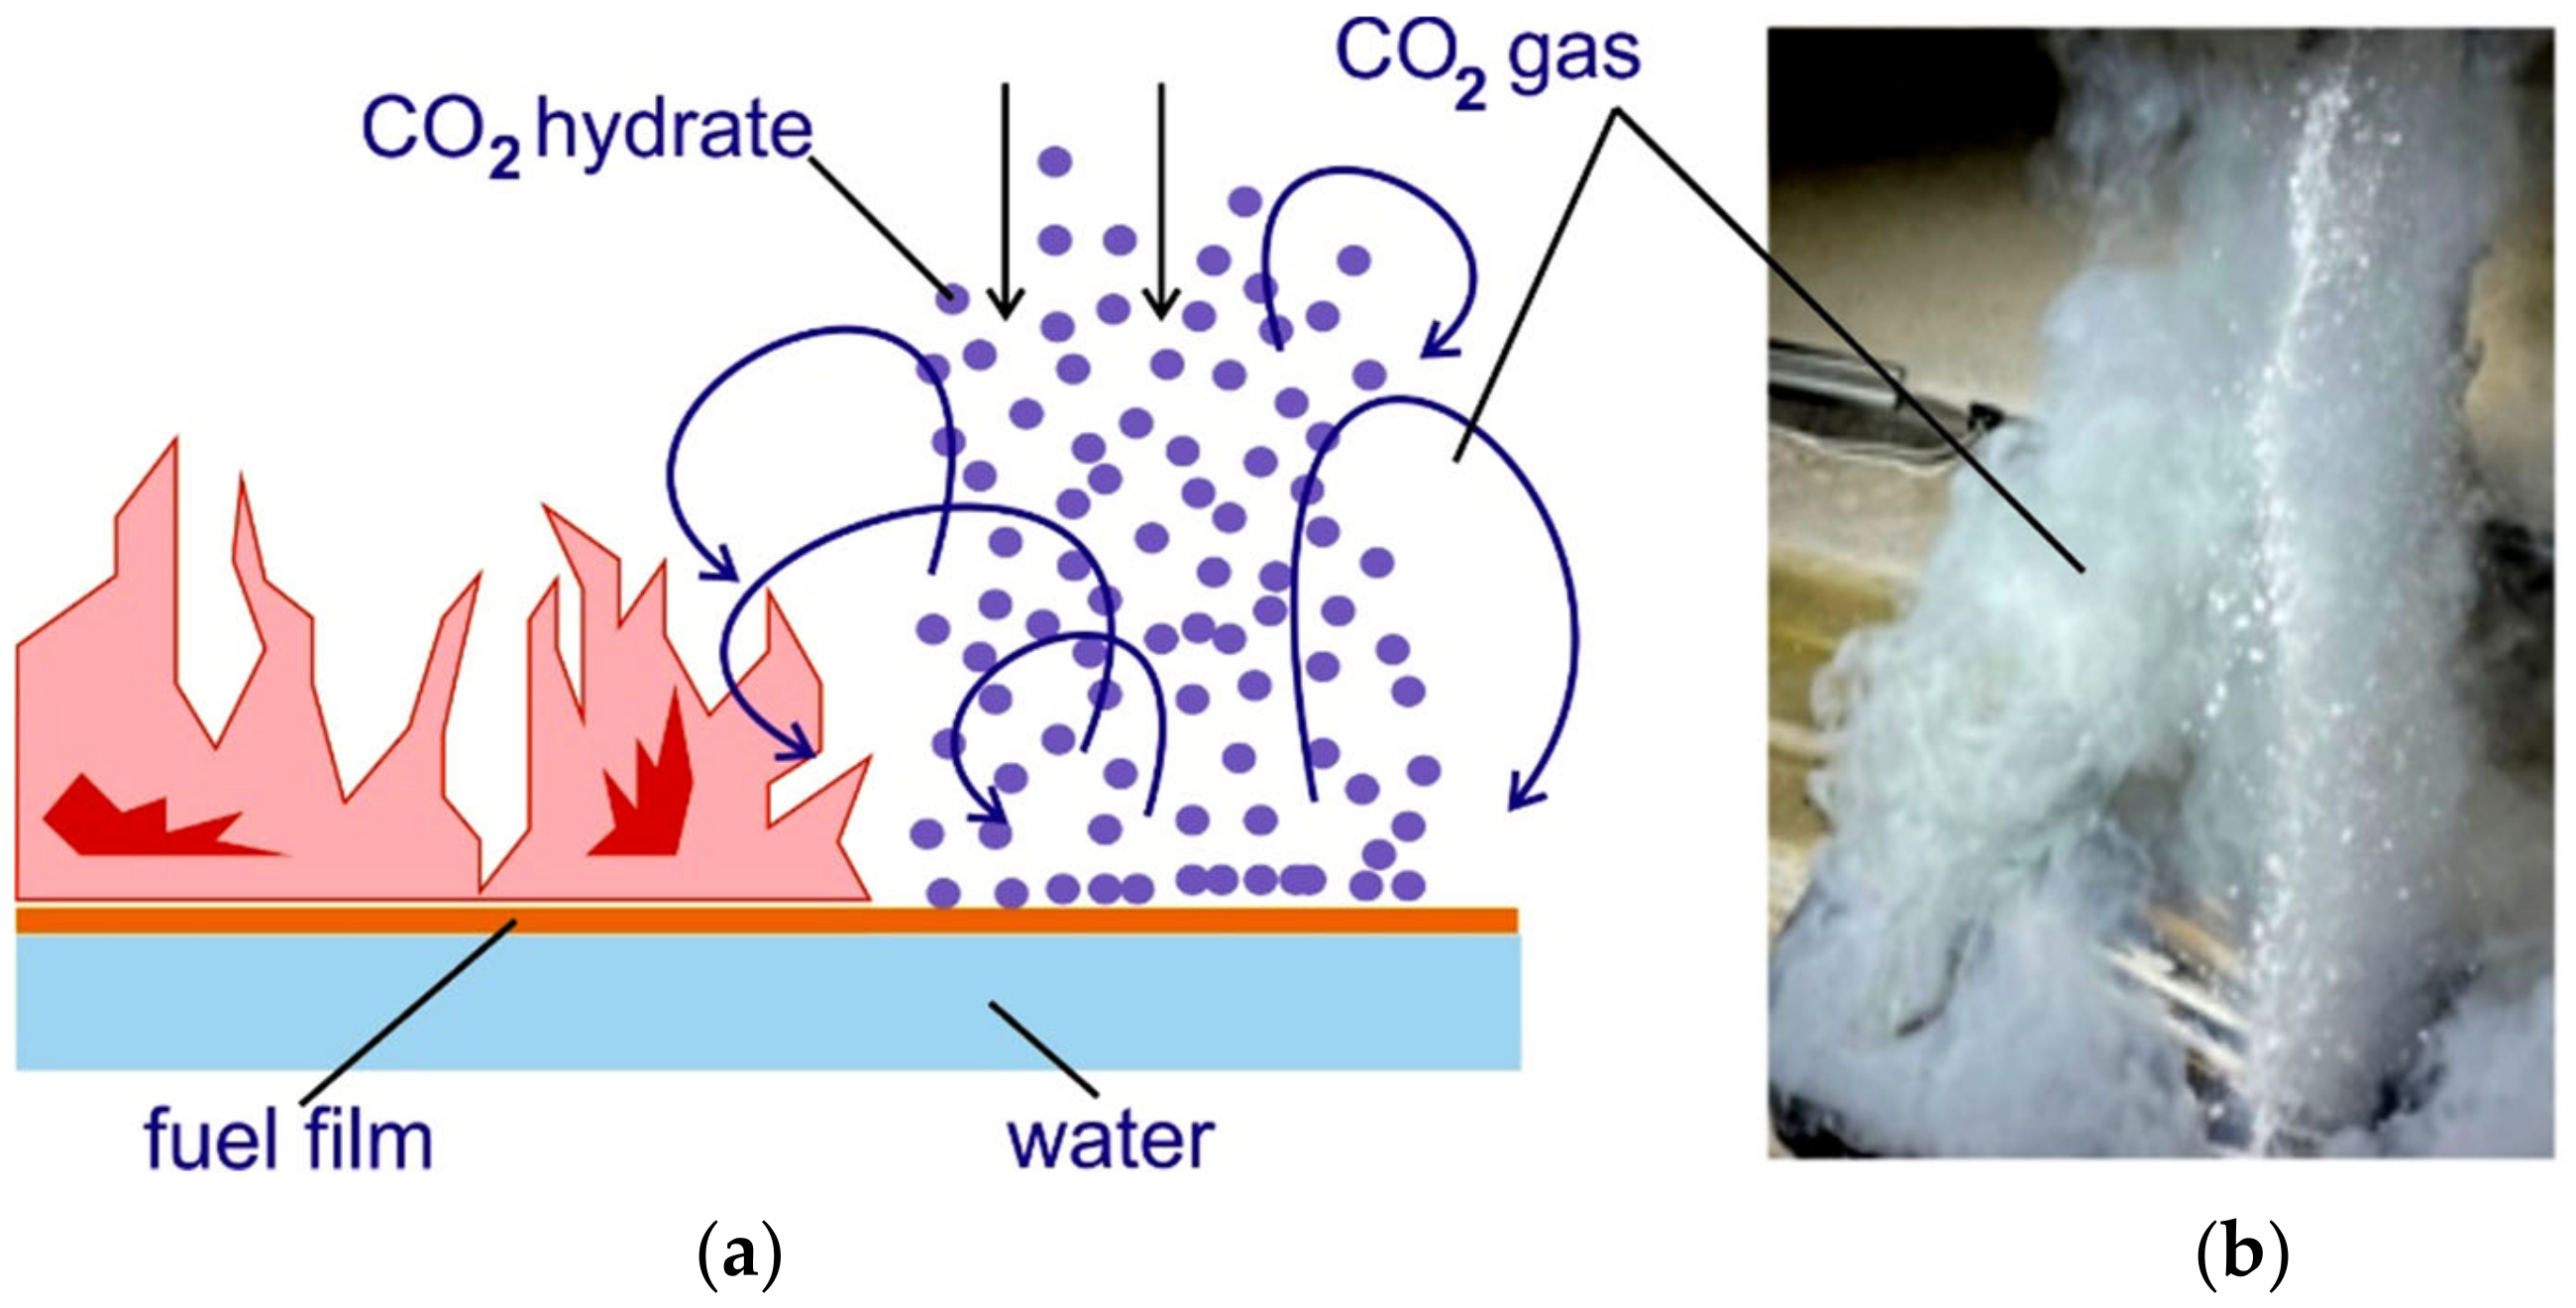
4.2. Fire Containment by Displacing the Oxidizer from the Combustion Zone

Our earlier work explored liquid fuel fire suppression by spreading CO2 hydrate powder over an open flame [49]. The scheme is presented in Figure 12. Granulated CO2 powder free-falling onto the surface of burning fuel triggers the inflow of carbon dioxide displacing the oxygen in the air (Figure 12a). At high gas temperatures and relatively long-term pouring of the powder, the oxidizer displacement and fire suppression occur within a short period of time. Figure 12b presents images from the experiment with fire suppression by carbon dioxide hydrate within 1 s (powder discharge into the fire). Our model implies the use of a simplified problem statement with fixed boundary conditions that can be reproduced in an experiment to validate the dissociation kinetics. In contrast with the previous work, here the fire barrier is fixed. This calls for changes in the problem statement.
Instead of falling, let us examine the dissociation of a stationary square-shaped CO2 hydrate sample (hereinafter granule). The gas hydrate dissociation rate is modeled using Equation (1) [50,51]:
X t = 3 k R B ρ H r 0 X 2 / 3 P e q P 0
where X = mH/m0 is the CO2 hydrate conversion, which depends on the powder temperature.
This expression describes the dissociation of a spherical gas hydrate particle (degree of particle transformation over dissociation time). A separate layer consists of spherical particles. Gas hydrate powder consists of a multitude of layers. At first, the thermal field is modeled. Then, at a certain temperature, the dissociation of separate particles is modeled in the first layer. After that, we transition to the next powder layer. Combustion supplies a high heat flux to the powder layer. As a result, self-preservation can be neglected, and the dissociation can be calculated while neglecting the filtration resistance of the porous layer [52].
The density ρ of gas hydrate powder and mass fraction X of gas hydrate are factored in Equation (2) [50,52] (ρH is the hydrate density, ρI is the ice density, ε = (ρHρ)/ρ, ε is the porosity coefficient of a powder layer):
ρ 1 ε = X ρ H + 1 X ρ I
The dissociation of two types of granule is considered: a) cylindrical granule, 3 mm in diameter, with the initial value z0 = 1.5 mm (half the height H) (Figure 13a,b) cylindrical tablet with the diameter D0 = 19 mm and height H = 2z0 = 6 mm. The temperature of the gas phase around a granule is 1050 °C, which corresponds to the typical average fire temperature [53]. Gas hydrate dissociates into three layers: gas, ice, and water; s is the coordinate of the gas hydrate dissociation front movement. A three-dimensional dissociation problem can be reduced to a one-dimensional problem with the dissociation along the direction of the smallest geometrical size [54]. The porosity of CO2 hydrate powder is 0.6. A granule consists of particles 0.3 mm in diameter. The particles are porous with the surface pore density σ = 4 × 10¹⁰ (1/m2) and the pore radius rp = 0.6 μm [50,52].
The description of gas hydrate dissociation accounts for the heat of dissociation, ice melting, and water evaporation. The dissociation rate depends heavily on the external heat flux [55]. The heat flux increases manyfold during combustion, which leads to a tenfold increase in the dissociation rate. The heat flux to the surface of the gas hydrate comes from the high-temperature gas region. Variations in the enthalpy of gas hydrate over time are related to the thermal conductivity of all the phases as well as all the heat transfers mentioned above. As the heat of water evaporation qev significantly exceeds other heats, the accuracy of the dissociation modeling depends on the accuracy of the evaporation model. Water film (Figure 13b) drains by gravity and due to splashing water microdroplets formed after gas bubble implosion. Carbon dioxide bubbles grow under a water film. Due to the absence of models describing the above process of hydrodynamic water removal, the volume of draining water was varied by means of the heat flux ratio qev(ef)/qev(max); qev(max) is the maximum evaporation heat when all water evaporates from the water film surface (Figure 12a and Figure 13a, no film draining and water droplet splashing); qev(ef)—a part of the water is removed (Figure 13b), which leads to a reduction in the evaporation heat (the gas hydrate dissociation rate increases with a decrease in qev(ef)). When modeling the heat flux ratio, the evaporations were taken as qev(ef)/qev(max) = 0.25; 0.5; 0.75; 1.
The boundary conditions for describing the gas hydrate reaction front movement s as well as for the external sample boundary z0 (Figure 12a) correspond to temperature gradients and heat fluxes: λ T z z = s t + = λ T z z = s t + ρ i c e r i c e j i c e ,   T z z = 0 = 0 ,   λ T z z = z t = α c T e T + ε σ T e 4 T 4 + r w j w , where ρice is the ice density, jice is the ice melting rate, jice = ds/dt, rice is the ice specific fusion heat, αc is the gas heat-transfer coefficient, Te is the surrounding air temperature, ε is the emissivity coefficient, σ is the Stefan–Boltzmann constant, rw is the specific water evaporation heat, and jw is the evaporation rate of the water film. Heat exchange in the gas phase is expressed through the Nusselt number Nu  N u = α c L λ g = 0.664 Re 0.5 Pr 0.33 , the Reynolds number ( R e = U 0 L ν ), and the Prandtl number P r = ν a , as well as the Sherwood number (Sh = βL/Dg) [56,57], where λg is the gas mixture thermal conductivity, ν is the gas kinematic viscosity, a is the gas thermal diffusivity, L is the characteristic size (L = D0/2, D0 is the diameter of a gas hydrate cylinder). The water film evaporation rate is expressed as j w = β F ρ v * ρ v a [56,57,58], where β is the water vapor mass transfer coefficient in the gas phase during water film evaporation, Dg is the diffusion coefficient of the water vapor-gas mixture, ρ v * is the equilibrium density of water vapor, ρ v a is the water vapor density in the ambient air, and F is the water film surface area (equal to the external surface of the cylinder).
Figure 14a details the calculated variations in the gas hydrate fraction over dissociation time provided that the mass balance holds for gas hydrate, ice, and water: Ch + Cice + Cw = 1. A decrease in the qev(ef)/qev(max) from 1 to 0.25 (by four times) led to a 60% decrease in the carbon dioxide hydrate dissociation time. The maximum dissociation rateof the gas hydrate is observed at the starting time. At the final stage, the dissociation rate drops sharply. Figure 14b presents the calculated water film surface temperature variation curves over time. The temperature of the lower water film surface equals the ice melting temperature. Within 0.5–1 s, a water film is formed with a free surface temperature reaching high values. The temperature then drops and increases again. The maximum value of Ts (about 90 °C) is reached at qev(ef)/qev(max) = 0.25 (25% of water participates in evaporation, while the rest drains down from the gas hydrate surface). At qev(ef)/qev(max) = 1, the maximum temperature Ts approximates 70 °C. A reduction in Ts with an increase in the amount of draining water is related to the decreasing water film thickness δ (Figure 13). The thinner the water film, the lower the transversal temperature gradient in the film (if the heat flux is quasi-constant).
In view of the above, it is important to determine the water film thickness δ. Figure 14c details the calculation of the film thickness δ over time. The value of δ increases with time. With an increase in qev(ef)/qev(max), the maximum film thickness increases as well. In all the cases under consideration, a limited maximum value of the film thickness is achieved (0.5–0.6 mm).
Figure 15 models the carbon dioxide release rate variation during high-temperature CO2 hydrate dissociation. The calculations are given for one granule (curve 1) and one cylinder (curve 2). The curves have pronounced extrema. For a small granule (D0 = 3 mm), the time corresponding to the maximum value of the VCO2 is about 40 times shorter than for a large cylinder (D0 = 19 mm). Moreover, although the mass of a small granule is dozens of times smaller than that of a large cylinder, the peak of curve 1 is about 3.5 times higher than that of curve 2.
Following the analysis of the experimental findings, a hypothesis was formulated that the condition of oxidizer displacement by carbon dioxide Y = V C O 2 V O 2 > k has to be satisfied for effective fire containment and suppression. Here, V C O 2 is the rate of carbon dioxide release from the cylinder surface, and V O 2 is the oxygen velocity due to air buoyancy. The latter can be estimated using the equation V O 2 = 0.23 2 g β T b , where b is one-half of the barrier width onto which gas hydrate is discharged from above (b = 0.025 m, ∆T is the temperature difference between the combustion zone and ambient gas-air medium, 0.23, controlling for the mass concentration of oxygen in the air. The velocity V O 2 = 1.5 m/s. Let us assume that k = 1. For Y to exceed 1, 150 large cylinders are needed ( V C O 2 = 0.01 × 150 = 1.5 m/s). With large cylinders, the dissociation rate is low, which leads to low carbon dioxide release rates. In this case, no intense oxygen displacement occurs. The suppression of flaming combustion is only possible through the effects related to the heat of endothermic phase transitions.
Let us consider the conditions of fire suppression by small granules (3 mm high and 3 mm in diameter). About 43 granules are needed to reach the velocity V O 2 = 1.5 m/s. The maximum value for CO2 equals 0.035 m/s (Figure 14) ( V C O 2 = 0.035 × 43 = 1.5 m/s). The mass of 43 small granules is 0.3 g when porosity is taken into account. This mass is almost three times smaller than the mass of one big cylinder. The experimental findings have shown that 1.2–1.3 g of CO2 hydrate powder is needed to contain a fire with a liquid fuel film surface area of 0.2 × 10⁻⁴ m2. The powder was poured evenly from above onto the surface of the burning fuel. Then the fire containment and suppression requires a four times bigger mass of powder with small granules, i.e., 4 × 0.3=1.2 g (the mass of 43 granules is 0.3 g). In this case, the parameter Y = k = 4. A four times increase in the parameter Y is related to the mutual influence of falling particles. As a result, the temperature of gas between the particles decreases significantly, which leads to a deceleration of the carbon dioxide release. Also, the maximum peak was observed for 1 s, while the fall of granules from a height of 0.2–0.3 m took 0.2 s. With this time, only a small volume of carbon dioxide will be released during the fall. The remaining volume of the gas will be released from the powder layer after the fall of the granules, which will also slow down the CO2 release. The condition of oxygen displacement is formulated as Y = V C O 2 V O 2 > 4.
Let us express the above-mentioned fuel film surface area as F0 = 0.2 × 10⁻⁴ m2. To increase the fuel surface area by n times (n = F/F0), the mass of the gas hydrate powder must be increased by n times as well. The condition of fire suppression takes the form
Y = V C O 2 V O 2   >   4 ,   ( V m a x ) co 2 = f ( d g ,   T ) ,   m ef = N m 1   ( Y = 4 ,   n = 1 ) ,
m = nmef (n > 1, dg = 3 mm),
where m1 is the mass of one granule with its porosity taken into account, and Vmax is the maximum CO2 release rate (from the dissociation of one powder granule). The gas release rate (Vmax) for one granule is derived from the average diameter dg of a granule and the average temperature T of the gas between the granules. N is the number of granules, at which the parameter Y > 4. The mass mef is the mass of the powder (all granules) required for fire suppression when n = 1. With the average granule diameter dg = 3 mm, the mass of the powder for fire suppression mef = 1.2–1.3 g (according to the experiment). Then the fire area and the mass of CO2 hydrate (to suppress the flaming combustion) can be scaled using an estimation equation (Equation (2)). With a 10-times increase in the fuel film surface area, the mass of the CO2 hydrate powder m Equation (2) required for fire containment and suppression will be 13 g. To verify this relationship, an additional experiment was conducted on fire suppression with a liquid film area of 2 × 10⁻⁴ m2 (10 times bigger than F0). A total of 13–15 g of carbon dioxide hydrate powder was required to fully suppress the fire within 1–2 s. The powder was poured evenly from above onto the combustion zone. Thus, Equations (1) and (2) can determine the mass of the carbon dioxide hydrate powder with a varying surface area of the burning material. This procedure allows scaling for both the mass of the CO2 hydrate and the fuel combustion surface area. In the case of variations in the porosity and average diameter of granules, it is necessary to calculate the Vmax of CO2.

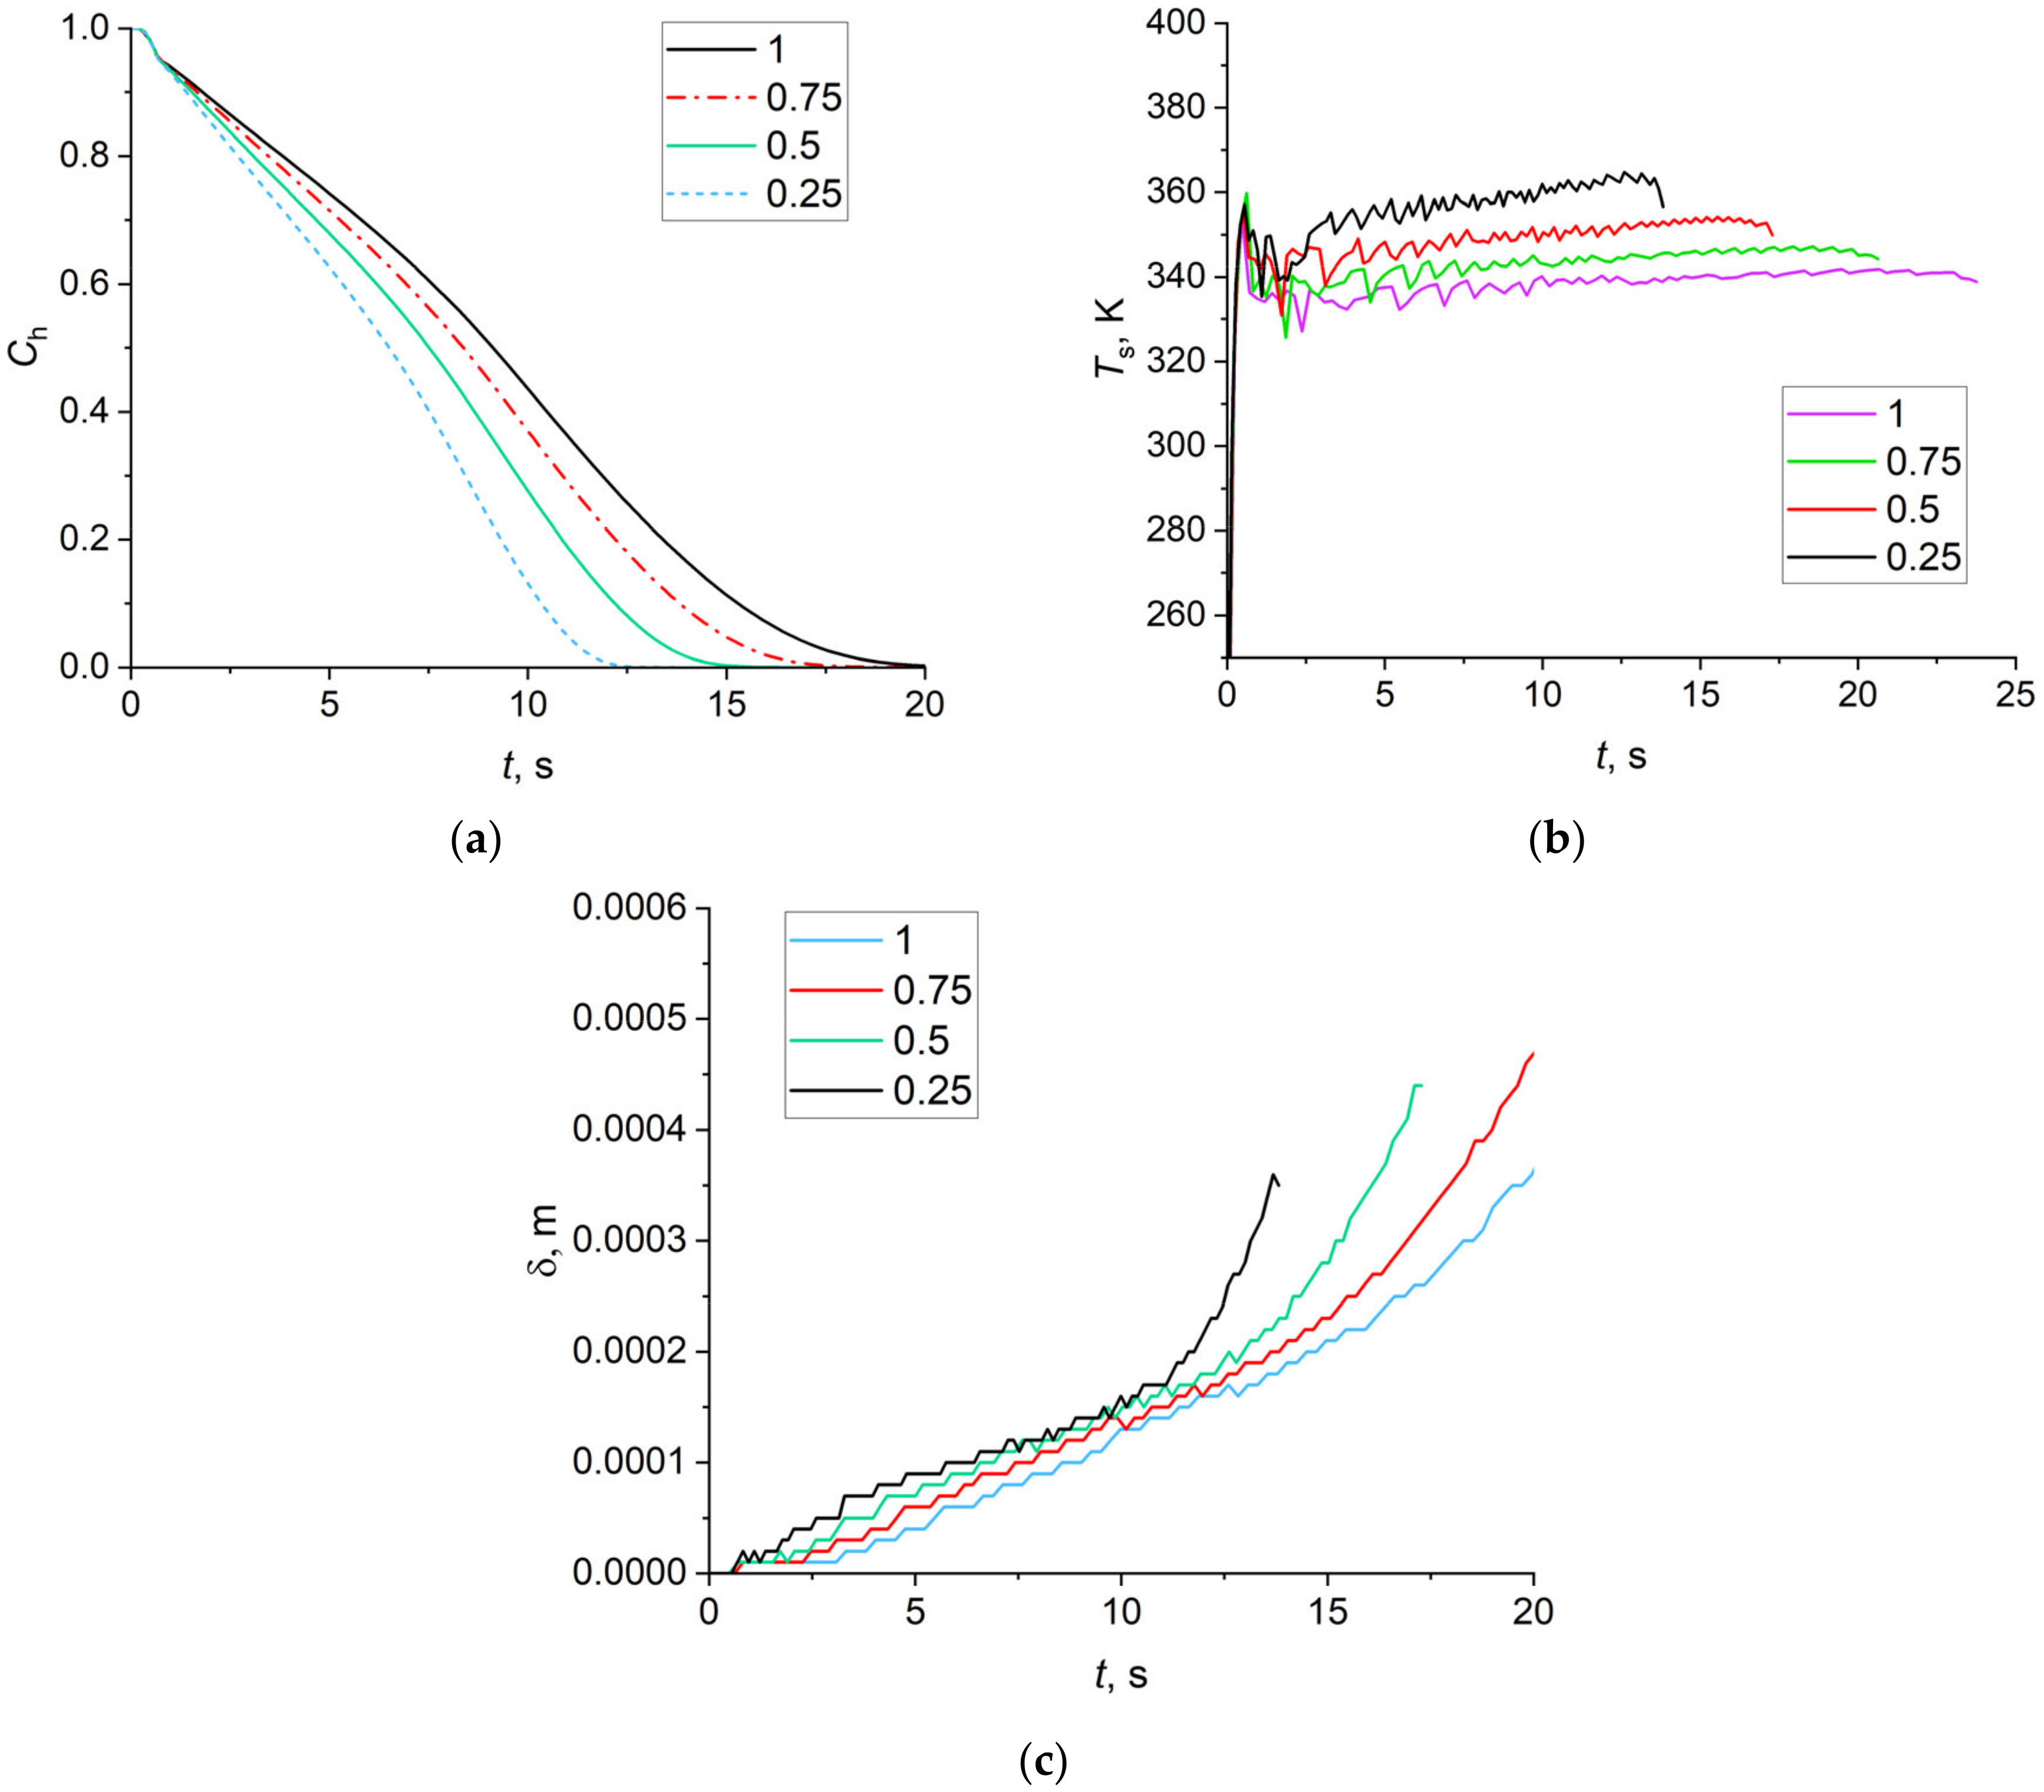
4.3. Stoppage of Flame Propagation Front by a Fire Barrier Made of Carbon Dioxide Hydrate

Section 3 specified the recorded parameters of the flame front movement (left to right) over different liquid fuel films in the working channel. With a 5–10 mm CO2 hydrate barrier, the combustion front over a gasoline film passed through the separating element rather quickly. As a result, the flame continued to move to the right of the barrier. With a barrier width of 20–25 mm, the flame front stopped in front of the barrier and then continued its movement after dozens of seconds, i.e., after the gas hydrate ice melted, and water spread over the surface of the test area. Let us look at how the flame front passes through the gas hydrate barrier from left to right (from point B to point B1) (Figure 16a). Gas hydrate powder in the form of a barrier was poured on the surface of the fuel film. The CO2 hydrate layer was 5–7 mm high. Let us consider the first mechanism when the oncoming ambient airflow velocity is zero, i.e., under the conditions of natural convection (Figure 16a,b).
Without the ambient air velocity, the flame is directed upwards. According to the experimental data, the height of the flame for the fuels under study ranged from 30 to 70 mm (Table 2). High-speed video recording showed that the fast movement of a flame front caused fluctuations in the flame height; vortex structures were also formed near the flame edge. The higher the flame, the larger the characteristic size of the vortex structures. Figure 16b is a schematic triangle whose base length (BC) equals the gas hydrate barrier width (bh), and side length (AB) equals the flame height (Hf). It follows from the experiments that with bh < 15–20 mm, the gasoline and alcohol combustion front passes from point B to point B1. Let us assume that the flame transport is related to the size of the above-mentioned vortex structures, whose diameter can be related to the flame height through similarity of triangles: B C / B A = (bh)*/(Hf)* = (bh)ef/(Hf). Then (bh)ef will be written as
(bh)ef = (bh)*(Hf/(Hf)*)
where (bh)* = 20 mm corresponds to the experimental value of the gas hydrate barrier width with the maximum experimental flame height (Hf)* = 70 mm, when the combustion front does not pass through the fire barrier. The effective width of the carbon dioxide hydrate barrier (bh)ef corresponds to a greater flame height Hf. For instance, with a flame height of 700 mm, the effective width of the gas hydrate barrier approximates 200 mm.
Let us consider the second mechanism of flame propagation from left to right, when there is a certain velocity of the ambient airflow (imitated wind load) Ua that does not cause flames to break off (Figure 16c). Earlier experiments visualizing the flux lines in the combustion zone used the PIV technique [55,59]. With Ua = 0 m/s, the flame was directed vertically upward. When the ambient air velocity was higher than the gas buoyancy velocity Uc, the flame tilted towards the wall in the direction of the ambient air. Let us consider the boundary scenario when Ua is many times higher than Uc (the flame slope becomes quasi-parallel to the wall). Then the width of the carbon dioxide hydrate barrier equals the flame height without wind bh = Hf. For instance, with Hf = 70 mm, the barrier width (bh)ef will also equal 70 mm.
The third flame propagation mechanism (flame transport through the gas hydrate barrier) is related to a strong wind entraining a part of the flame (the wind speed is dozens of meters per second) (Figure 16d). In this case, due to the vortices entraining a part of the high-temperature flame, the effective width of the layer (bh)ef needs to be increased ((bh)ef > Hf, Hf is the flame height with Ua = 0). To study this case, a much larger scale is necessary (flame height and fuel test zone width of about 0.5–1 m). With a low flame height (about 70 mm), the air velocity of 5–10 m/s leads to flame suppression. The third case of flame break-off in larger-scale experiments is the object of our prospective studies.

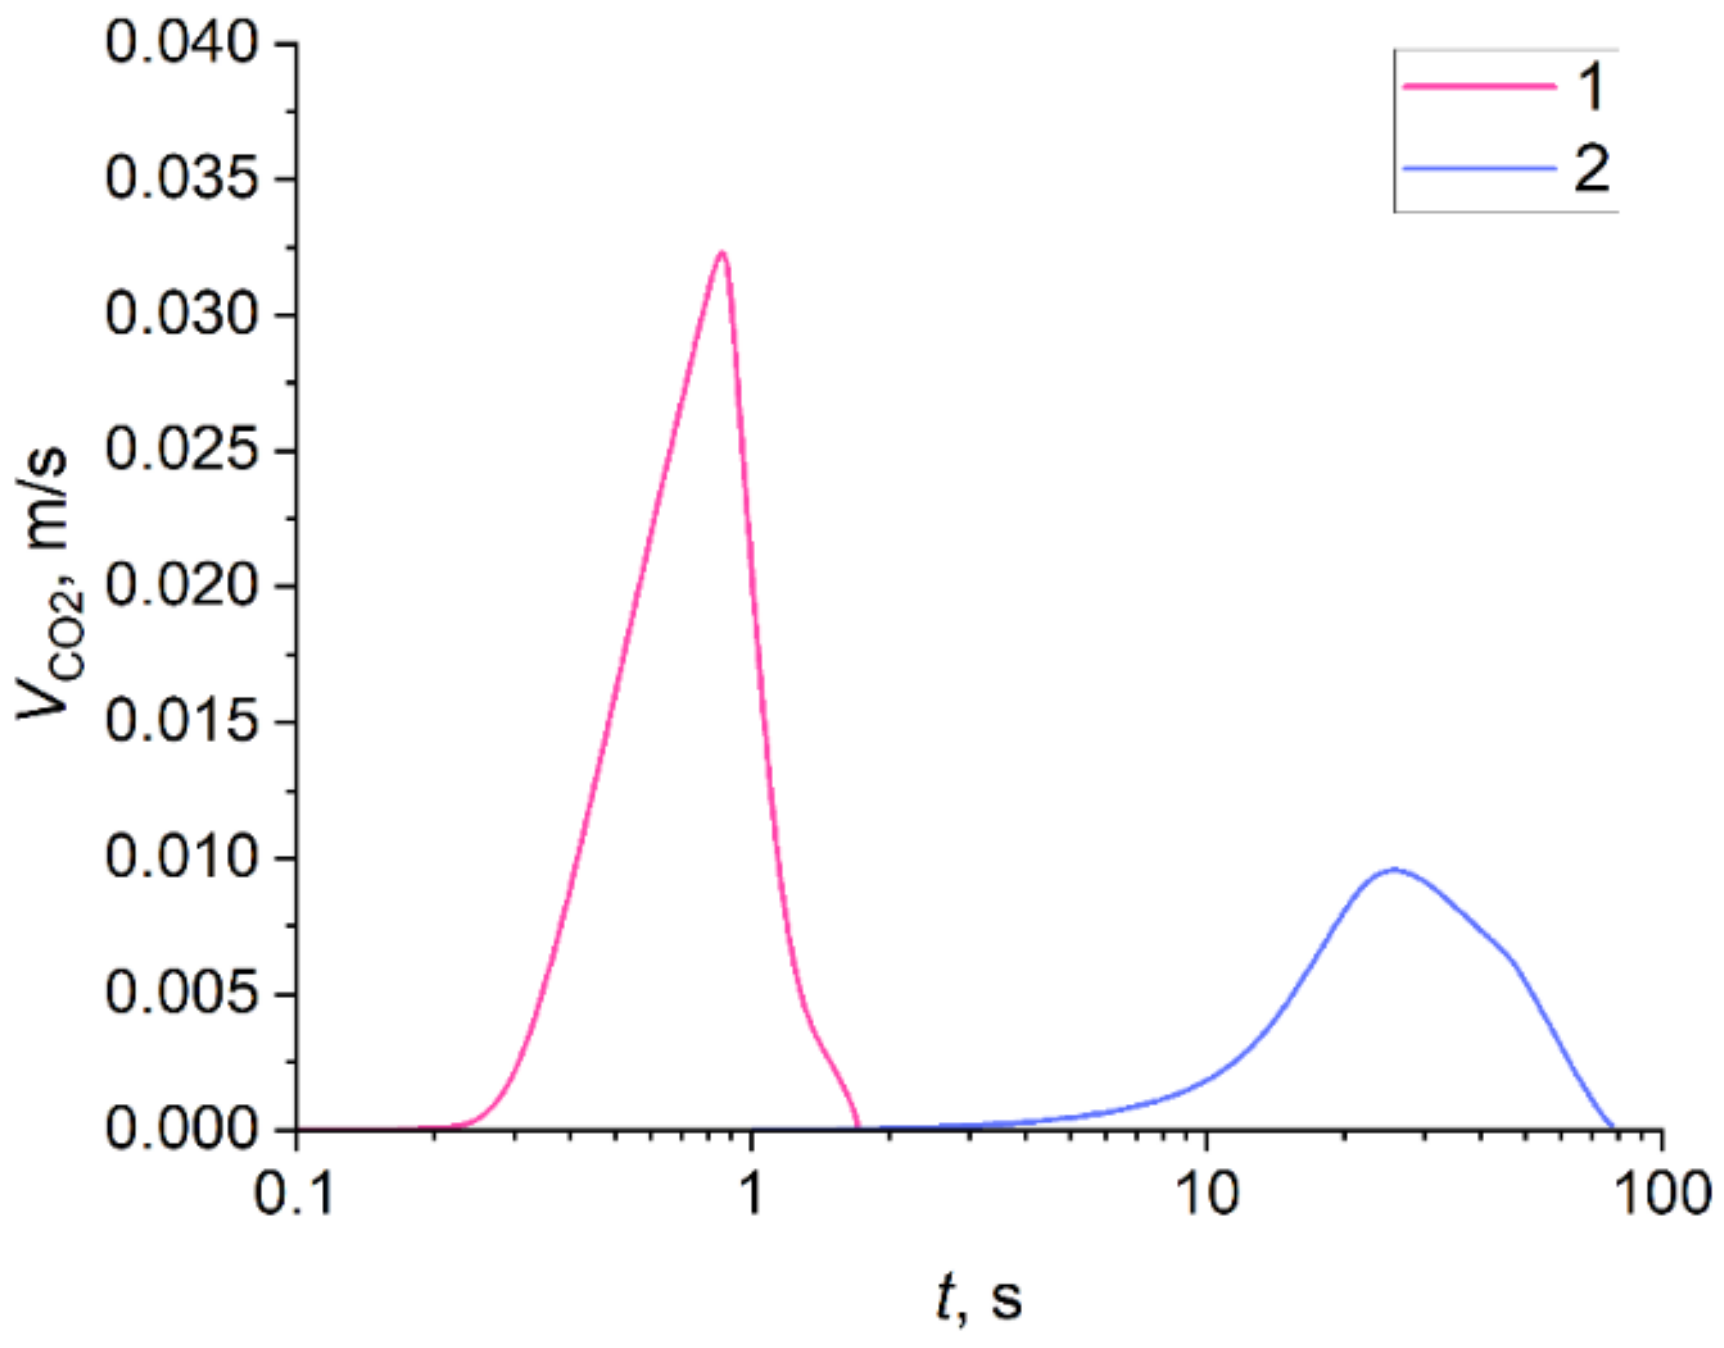
4.4. Ratio of Liquid Fuel Combustion Time to CO2 Hydrate Dissociation Time and to Water Film Evaporation Time

The previous section determined the effective width of a carbon dioxide hydrate barrier to stop the oncoming flame front. The experiments showed that after the gas hydrate dissociation, ice melting, and partial water evaporation, the flame front continued its movement from left to right after several dozen seconds. To prevent the flame from moving from left to right, the typical gas hydrate dissociation time needs to exceed the fuel burnout time in front of the barrier. The calculations indicate that the water evaporation time (tw) significantly exceeds the carbon dioxide dissociation time (td). The water evaporation heat is much higher than the heat of hydrate dissociation and ice melting. For a simplified estimate, the time of complete evaporation tcw is a better criterion for the combustion front stoppage than the dissociation time. These characteristic times were calculated using an interaction scheme between the fuel film and the gas hydrate barrier (Figure 17). A liquid fuel film has spread over the water surface. The fuel is burning to the left of the carbon dioxide hydrate barrier. There is no combustion to the right of the barrier.
The fuel combustion kinetics (f) is expressed by the Arrhenius equation dmf/dt = k0exp(−Ea/RT), where Ea is the activation energy. The length of the fuel line af equals the length of the gas hydrate barrier ah (a = af = ah = 1 m). The width of the fuel line bf and the width of the gas hydrate barrier bh are varied. With the given values af = const, bf = const, ρf = const (ρf is the fuel density), the fuel burnout rate will be written as d(hf)/dt = k01exp(−Ea/RT), k01 = k0/(ρfbfaf)). The thickness of the fuel film decreases with the combustion time. Time integration will give us an expression for the complete fuel combustion time: tcf = h0f/(k01exp(−Ea/RT)), where h0f is the initial fuel film height. The initial height of liquid fuel after spreading can either (i) have the order of magnitude of the capillary constant if the fuel spread area is not limited or (ii) exceed the capillary constant if the fuel spread area is limited.
The following parameters were used in the calculations: Nusselt number Nu = 4.4, Sherwood number Sh = 14. These values were obtained by modeling the high-temperature carbon dioxide hydrate dissociation. They are in the best agreement with the experimental data in terms of the temperature of the free water film surface and full gas hydrate dissociation time. The temperature of the gas phase over the powder equals 1050 °C. The height of the hydrate layer equals 6 mm. The porosity of the hydrate powder is 0.6. The diameter of gas hydrate particles equals 0.33 mm. The entire volume of water evaporates, i.e., the condition Qev(ef)/Qev(0) = 1 holds (no water is removed due to the film draining, and the whole volume of liquid spreads over the fuel surface). The first option was chosen for modeling (the initial height of the film equals the capillary constant of the liquid fuel). The initial mass of the fuel and carbon dioxide hydrate was varied by altering the widths of the fuel line (bf) and hydrate barrier (bh). When varying bf and bh in a wide range, we established that consistent fire suppression requires the following condition to hold:
tcw/tcf ≥ 1
This condition is the basic one for successful liquid fire containment and suppression using fire barriers. The analysis of experimental data and modeling results showed that this condition held in all the cases when the combustion front was stopped. It should be specified as the basic criterion when developing fire containment technologies using gas hydrates. Calculations were carried out using the resources of the High-Temperature Circuit Multi-Access Research Center (project No. 13.CKP.21.0038) (Igor Donskoy).

5. Conclusions

(i) This research has experimentally established the variation ranges of the flame front propagation velocities for the most hazardous liquids (gasoline, kerosene, Diesel fuel, petroleum, alcohol, and oil) ignited from an open fire. The liquid fuel combustion fronts propagate at a velocity ranging from 0.1 m/s to 3 m/s under natural convection. Forced convection leads to 2- to 5-fold changes in the flame propagation velocities. Using high-speed video recording, the differences have been established in the flame propagation velocities in an air-vapor environment and directly over the liquid surface. They are significantly different for kerosene, Diesel fuel, and oil. The greater the concentration of light fractions in a combustible liquid, the smaller these differences. A fire barrier made of gas hydrate can stop the flame front propagation provided that the gas hydrate dissociation time exceeds the liquid burnout time.
(ii) Interesting experimental findings have been obtained for several fire barriers and several CO2 hydrate tablets placed at a certain distance from each other. A set of barriers suppresses the flame propagation rather effectively because a greater surface area provides a greater CO2 and water vapor inflow. The higher the flame front propagation velocity and temperature in the combustion zone, the more effective a group of barriers becomes. It was experimentally established that the necessary and sufficient mass of CO2 hydrate for the containment and suppression of a flame combustion front of burning liquids without intense vapor combustion (such as kerosene, Diesel fuel, and oil) was about 3 g under the experimental conditions. The experiments with a fire barrier made of ice powder revealed a number of interesting patterns. In all the experiments with consistent fire containment, water film in the barrier retained its width equal to the width of the working channel. Unlike in the experiments with gas hydrate powder, the combustion front moved towards the barrier at a certain stable velocity and stopped after reaching the water film formed due to ice melting in the barrier. In the corresponding experiments, the combustion front shifted in the opposite direction by 5–10 cm. These aspects are crucial in the case of combustible liquids with a high flame in the front and a large proportion of volatile fractions.
(iii) The experimental findings allowed us to identify three mechanisms of the interaction between a liquid combustion front and a fire barrier. The mechanisms differ by a set of dominating effects and processes. A model has been developed for three mechanisms of liquid fire containment by gas hydrate fire barriers describing the main processes, effects, and factors, such as heat and mass transfer, dissociation, melting, evaporation, and burnout. With the help of the model, the research findings have been extended to different-scale objects. In particular, we have established the necessary and sufficient size of the fire barrier, the mass of the gas hydrate, and the volume of gas in the hydrate to provide the liquid fire containment on an area of 1–10 m2.

Supplementary Materials

The following supporting information can be downloaded at: https://www.mdpi.com/article/10.3390/fire6030124/s1. Videos S1–S12 can be found on this link.

Author Contributions

Conceptualization, data curation, S.M.; investigation, S.M., I.D., R.V., V.M. and O.G.; writing—original draft, S.M. and O.G.; writing—review and editing, R.V., S.M. and O.G. All authors have read and agreed to the published version of the manuscript.

Funding

The research was supported by the program of the National Research Tomsk Polytechnic University (Priority-2030-NIP/EB-006-375-2023).

Institutional Review Board Statement

Not applicable.

Informed Consent Statement

Not applicable.

Data Availability Statement

Not applicable.

Conflicts of Interest

The authors declare no conflict of interest.

References

  1. Li, Y.; Meng, D.; Yang, L.; Shuai, J. Experimental study on the burning rate of continuously released spill fire on open surface with measurement of burning fuel thickness. Case Stud. Therm. Eng. 2022, 36, 102217. [Google Scholar] [CrossRef]
  2. Liu, T.; Yin, X.-Y.; Liu, Y.-C.; Tang, Y.; Huang, A.-C.; Dong, X.-L.; Liu, Y.-J. Influence of Water Mist Temperature Approach on Fire Extinguishing Effect of Different Pool Fires. Processes 2022, 10, 1549. [Google Scholar] [CrossRef]
  3. Wang, Z.; Xiong, Y.; Cheng, X.; Liu, M. Experimental study on the flame propagation characteristics of heavy oil oxy-fuel combustion. J. Energy Inst. 2019, 92, 1630–1640. [Google Scholar] [CrossRef]
  4. Wang, X.; Chen, Q.; Ying, Y.; Liu, D. Effects of n-Butanol Addition on the Combustion Characteristics of n-Heptane Counterflow Diffusion Flame at Elevated Pressure. Fire 2022, 5, 154. [Google Scholar] [CrossRef]
  5. Sun, X.; Huang, H.; Zhao, J.; Song, G. Experimental Study of the Effect of Slope on the Spread and Burning Characteristics of a Continuous Oil Spill Fire. Fire 2022, 5, 112. [Google Scholar] [CrossRef]
  6. Liu, C.; Ding, L.; Jangi, M.; Ji, J.; Yu, L.; Wan, H. Experimental study of the effect of ullage height on flame characteristics of pool fires. Combust. Flame 2020, 216, 245–255. [Google Scholar] [CrossRef]
  7. Lin, Y.; Delichatsios, M.A.; Zhang, X.; Hu, L. Experimental study and physical analysis of flame geometry in pool fires under relatively strong cross flows. Combust. Flame 2019, 205, 422–433. [Google Scholar] [CrossRef]
  8. Li, G.; Du, Y.; Liang, J.; Wang, S.; Wang, B.; Qi, S. Characteristics of gasoline–air mixture explosions with different obstacle configurations. J. Energy Inst. 2018, 91, 194–202. [Google Scholar] [CrossRef]
  9. Zhao, R.; Liu, D. Chemical effects of carbon dioxide in ethylene, ethanol and DME counter-flow diffusion flames: An experimental reference for the fictitious CO2 flame. J. Energy Inst. 2022, 100, 245–258. [Google Scholar] [CrossRef]
  10. Zhao, S.; Liu, B.; Zhao, B.; Li, T.; Shu, Q. Numerical Simulation of Ethanol Air Diffusion Flame Quenching under Transverse AC Electric Field. Fire 2022, 5, 196. [Google Scholar] [CrossRef]
  11. Liu, C.; Wan, H.; Ji, J.; Gao, Z.; Lin, S.; Wang, L.L. Flame spread characteristics and a multi-cylinder radiation model for diesel tray fires against a sidewall. Int. J. Therm. Sci. 2019, 139, 433–439. [Google Scholar] [CrossRef]
  12. Ding, F.; Kang, W.; Yan, L.; Xu, Z.; Guo, X. Influence of gas–liquid ratio on the fire-extinguishing efficiency of compressed gas protein foam in diesel pool fire. J. Therm. Anal. Calorim. 2021, 146, 1465–1472. [Google Scholar] [CrossRef]
  13. Fukumoto, K.; Wen, J.X.; Li, M.; Ding, Y.; Wang, C. Numerical simulation of small pool fires incorporating liquid fuel motion. Combust. Flame 2020, 213, 441–454. [Google Scholar] [CrossRef]
  14. Lei, J.; Huang, P.; Liu, N.; Zhang, L. On the flame width of turbulent fire whirls. Combust. Flame 2022, 244, 112285. [Google Scholar] [CrossRef]
  15. Kim, W.; Anraku, S.; Endo, T.; Choi, K. Flammability and flame propagation of propane/L-leucine powder hybrid mixtures. Powder Technol. 2020, 372, 694–702. [Google Scholar] [CrossRef]
  16. Tian, D.; Xu, L.; Liu, D. Effects of Carbon Chain Length on N-Alkane Counterflow Cool Flames: A Kinetic Analysis. Fire 2022, 5, 170. [Google Scholar] [CrossRef]
  17. Zou, Y.; Li, K.; Yuan, B.; Chen, X.; Fan, A.; Sun, Y.; Shang, S.; Chen, G.; Huang, C.; Dai, H.; et al. Inspiration from a thermosensitive biomass gel: A novel method to improving the stability of core-shell “dry water” fire extinguishing agent. Powder Technol. 2019, 356, 383–390. [Google Scholar] [CrossRef]
  18. Huang, Y.; Li, Y.; Dong, B.; Li, J. Predicting the main geometrical features of horizontal rectangular source fuel jet fires. J. Energy Inst. 2018, 91, 1153–1163. [Google Scholar] [CrossRef]
  19. De Cachinho Cordeiro, I.M.; Liu, H.; Yuen, A.C.Y.; Chen, T.B.Y.; Li, A.; Wang, C.; Cao, R.; Yeoh, G.H. On the Large Eddy Simulation Modelling of Water Suppression Systems Droplet Impact and Coverage Area. Fire 2022, 5, 165. [Google Scholar] [CrossRef]
  20. Derosa, M.I.; Litton, C.D. Development and Evaluation of Fire Barriers to Reduce Fire Hazards on large mining Equipment. Fire Technol. 2013, 49, 253–268. [Google Scholar] [CrossRef]
  21. Jia, J.; Tian, X.; Wang, F. Research on smoke control for an underground mall fire, based on smoke barrier and mechanical smoke exhaust system. Sci. Rep. 2022, 12, 13071. [Google Scholar] [CrossRef] [PubMed]
  22. Tang, Z.; Xu, G.; Yang, S.; Deng, J.; Xu, Q.; Chang, P. Fire-retardant foam designed to control the spontaneous combustion and the fire of coal: Flame retardant and extinguishing properties. Powder Technol. 2021, 384, 258–266. [Google Scholar] [CrossRef]
  23. Lin, S.; Liu, Z.; Qian, J.; Gu, Z.; Ali, M.; Zhao, H. Laboratory investigation of powder deflagration flame propagation and quenching behaviors suppressed by ZrO2 ceramic foam. Powder Technol. 2021, 388, 17–25. [Google Scholar] [CrossRef]
  24. Tang, Y.; Wang, H. Development of a novel bentonite–acrylamide superabsorbent hydrogel for extinguishing gangue fire hazard. Powder Technol. 2018, 323, 486–494. [Google Scholar] [CrossRef]
  25. Ma, L.; Huang, X.; Sheng, Y.; Liu, X.; Wei, G. Experimental study on thermosensitive hydrogel used to extinguish class a fire. Polymers 2021, 13, 367. [Google Scholar] [CrossRef] [PubMed]
  26. Hinnant, K.M.; Giles, S.L.; Smith, E.P.; Snow, A.W.; Ananth, R. Characterizing the Role of Fluorocarbon and Hydrocarbon Surfactants in Firefighting-Foam Formulations for Fire-Suppression. Fire Technol. 2020, 56, 1413–1441. [Google Scholar] [CrossRef]
  27. Hinnant, K.M.; Giles, S.L.; Ananth, R. Measuring fuel transport through fluorocarbon and fluorine-free firefighting foams. Fire Saf. J. 2017, 91, 653–661. [Google Scholar] [CrossRef] [Green Version]
  28. Conroy, M.W.; Fleming, J.W.; Ananth, R. Surface Cooling of a Pool Fire by Aqueous Foams. Combust. Sci. Technol. 2017, 189, 806–840. [Google Scholar] [CrossRef]
  29. Sheng, Y.; Li, Y.; Yan, C.; Peng, Y.; Ma, L.; Wang, Q. Influence of nanoparticles on the foam thermal stability of mixtures of short-chain fluorocarbon and hydrocarbon surfactants. Powder Technol. 2022, 403, 117420. [Google Scholar] [CrossRef]
  30. Dagan, Y.; Bar-Kohany, T. Flame propagation through three-phase methane-hydrate particles. Combust. Flame 2018, 193, 25–35. [Google Scholar] [CrossRef]
  31. Rossi, F.; Gambelli, A.M.; Sharma, D.K.; Castellani, B.; Nicolini, A.; Castaldi, M.J. Experiments on methane hydrates formation in seabed deposits and gas recovery adopting carbon dioxide replacement strategies. Appl. Therm. Eng. 2019, 148, 371–381. [Google Scholar] [CrossRef]
  32. Kang, K.C.; Linga, P.; Park, K.N.; Choi, S.J.; Lee, J.D. Seawater desalination by gas hydrate process and removal characteristics of dissolved ions (Na+, K+, Mg2+, Ca2+, B3+, Cl, SO42−). Desalination 2014, 353, 84–90. [Google Scholar] [CrossRef]
  33. Liu, N.; Meng, F.; Chen, L.; Yang, L.; Liu, D. Investigating the effects of MWCNT-HB on gas storage performance of CO2 hydrate. Fuel 2022, 316, 123289. [Google Scholar] [CrossRef]
  34. Zhang, X.; Wang, J.; Yang, H.; Li, J.; Li, Y.; Wu, Q. Formation and storage characteristics of CO2 hydrate in porous media: Effect of liquefaction amount on the formation rate, accumulation amount. Appl. Therm. Eng. 2022, 214, 118747. [Google Scholar] [CrossRef]
  35. Prah, B.; Yun, R. CO2 hydrate slurry transportation in carbon capture and storage. Appl. Therm. Eng. 2018, 128, 653–661. [Google Scholar] [CrossRef]
  36. Sato, T.; Takeya, S.; Nagashima, H.D.; Ohmura, R. Preservation of carbon dioxide clathrate hydrate coexisting with sucrose under domestic freezer conditions. J. Food Eng. 2014, 120, 69–74. [Google Scholar] [CrossRef]
  37. Choi, J.W.; Kim, S.; Kang, Y.T. CO2 hydrate cooling system and LCC analysis for energy transportation application. Appl. Therm. Eng. 2015, 91, 11–18. [Google Scholar] [CrossRef]
  38. Liu, R.; Gao, F.; Liang, K.; Yuan, Z.; Ruan, C.; Wang, L.; Yang, S. Experimental study on the correlation between rapid formation of gas hydrate and diffusion of guest molecules. Appl. Therm. Eng. 2019, 154, 393–399. [Google Scholar] [CrossRef]
  39. Wei, J.; Cheng, Y.; Yan, C.; Li, Q.; Han, S.; Ansari, U. Decomposition prevention through thermal sensitivity of hydrate formations around wellbore. Appl. Therm. Eng. 2019, 159, 113921. [Google Scholar] [CrossRef]
  40. Hatakeyama, T.; Aida, E.; Yokomori, T.; Ohmura, R.; Ueda, T. Fire extinction using carbon dioxide hydrate. Ind. Eng. Chem. Res. 2009, 48, 4083–4087. [Google Scholar] [CrossRef]
  41. Lv, D.; Tan, W.; Zhu, G.; Liu, L. Gasoline fire extinguishing by 0.7 MPa water mist with multicomponent additives driven by CO2. Process Saf. Environ. Prot. 2019, 129, 168–175. [Google Scholar] [CrossRef]
  42. Liu, C. Fire fighting of wind extinguisher with CO2 gas assisted. Appl. Mech. Mater. 2012, 130–134, 1054–1057. [Google Scholar] [CrossRef]
  43. Tran, M.V.; Scribano, G.; Chong, C.T.; Ng, J.H.; Ho, T.X. Numerical and experimental study of the influence of CO2 dilution on burning characteristics of syngas/air flame. J. Energy Inst. 2019, 92, 1379–1387. [Google Scholar] [CrossRef]
  44. Sugahara, A.; Nakano, H.; Yokomori, T.; Ohmura, R.; Ueda, T. Effect of fuel boiling point of pool flame for the flame extinction by CO2 hydrate. In Proceedings of the ASPACC 2015—10th Asia-Pacific Conference on Combustion, Beijing, China, 19–22 July 2015. [Google Scholar]
  45. GOST 32513-2013; Automotive Fuels. Unleaded petrol. Specifications: Minsk, Belarus, 2015.
  46. GOST 10227-86; Jetfuels. Specifications: Minsk, Belarus, 1987.
  47. GOST 305-82; Diesel Fuel. Specifications: Minsk, Belarus, 1982.
  48. GOST 5962-2013; Rectified Ethyl Alcohol from Edible Raw Material. Specifications: Minsk, Belarus, 2013.
  49. Gaidukova, O.; Misyura, S.; Donskoy, I.; Morozov, V.; Volkov, R. Pool Fire Suppression Using CO2 Hydrate. Energies 2022, 15, 9585. [Google Scholar] [CrossRef]
  50. Misyura, S.Y.; Donskoy, I.G. Improving the efficiency of storage of natural and artificial methane hydrates. J. Nat. Gas Sci. Eng. 2022, 97, 104324. [Google Scholar] [CrossRef]
  51. Antonov, D.V.; Donskoy, I.G.; Gaidukova, O.S.; Misyura, S.Y.; Morozov, V.S.; Nyashina, G.S.; Strizhak, P.A. Dissociation characteristics and anthropogenic emissions from the combustion of double gas hydrates. Environ. Res. 2022, 214, 113990. [Google Scholar] [CrossRef] [PubMed]
  52. Misyura, S.Y.; Donskoy, I.G. Co-modeling of methane hydrate dissociation and combustion in a boundary layer. Combust. Flame 2022, 238, 111912. [Google Scholar] [CrossRef]
  53. Lackner, M.; Winter, F.; Agarwal, A.K. Vol.1: Fundamentals and safety. In Handbook of Combustion; Wiley-VCH: Weinheim, Germany, 2010. [Google Scholar]
  54. Misyura, S.Y.; Donskoy, I.G.; Manakov, A.Y.; Morozov, V.S.; Strizhak, P.A.; Skiba, S.S.; Sagidullin, A.K. Studying the influence of key parameters on the methane hydrate dissociation in order to improve the storage efficiency. J. Energy Storage 2021, 44, 103288. [Google Scholar] [CrossRef]
  55. Misyura, S.Y. Dissociation of various gas hydrates (methane hydrate, double gas hydrates of methane-propane and methane-isopropanol) during combustion: Assessing the combustion efficiency. Energy 2020, 206, 118120. [Google Scholar] [CrossRef]
  56. Grigoriev, V.A.; Zorin, V.M. Theoretical bases of heat engineering. In Thermal Engineering Experiment; Energoatom: Moscow, Russia, 1988. [Google Scholar]
  57. Kutateladze, S.S.; Leont’ev, A.I. Heat Transfer, Mass Transfer, and Friction in Turbulent Boundary Layers; Hemisphere: New York, NY, USA, 1989. [Google Scholar]
  58. Antonov, D.V.; Donskoy, I.G.; Gaidukova, O.S.; Misyura, S.Y.; Morozov, V.S.; Nyashina, G.S.; Strizhak, P.A. Dissociation and combustion of mixed methane-ethane hydrate. Fuel 2022, 325, 124771. [Google Scholar] [CrossRef]
  59. Misyura, S.Y. Non-stationary combustion of natural and artificial methane hydrate at heterogeneous dissociation. Energy 2019, 181, 589–602. [Google Scholar] [CrossRef]
Figure 1. Scheme (a) and appearance (b) of the channel with a combustible liquid for the experiments on measuring the flame front velocity.
Fire 06 00124 g001
Figure 2. Duration of complete hydrate dissociation versus temperature with a clarified measurement scheme in a muffle furnace.
Fire 06 00124 g002
Figure 3. Measurement scheme in the experiment recording the liquid combustion front containment by gas hydrate and ice.
Fire 06 00124 g003
Figure 4. Temperature variation dynamics obtained by thermocouple measurement: (a)—at different heights above the fuel surface (#1—20 mm; #2—50 mm; #3—100 mm); (b)—at a height of 50 mm from the fuel surface measured by thermocouple TC#2 (Figure 3).
Fire 06 00124 g004aFire 06 00124 g004b
Figure 5. Images of gasoline combustion front propagation.
Fire 06 00124 g005
Figure 6. Images of separated oil combustion front propagation.
Fire 06 00124 g006
Figure 7. Images of alcohol combustion front propagation.
Fire 06 00124 g007
Figure 8. Images of kerosene combustion front propagation.
Fire 06 00124 g008
Figure 9. Images of Diesel fuel combustion front propagation.
Fire 06 00124 g009
Figure 10. Typical images of the experiment at different stages of the Diesel fuel combustion front propagation before the ice barrier.
Fire 06 00124 g010
Figure 11. Effective and ineffective (at impeding the flame front propagation) masses of ice (a) and gas hydrate powder (b) as a fire barrier for a set of typical liquid fuels.
Fire 06 00124 g011
Figure 12. (a) Suppression of flaming combustion by granulated CO2 hydrate powder falling from above; (b) Release of carbon dioxide during high-temperature CO2 hydrate dissociation.
Fire 06 00124 g012
Figure 13. Gas hydrate dissociation without water film draining (a) and with water film draining and gas bubble implosion forming water microdroplets (b).
Fire 06 00124 g013
Figure 14. (a) Gas hydrate fraction Ch; (b) Temperature Ts of free water surface area; (c) Water film thickness δ (the values 0.25, 0.5, 0.75, and 1 correspond to the ratio qev(ef)/qev(max), qev(max) is the evaporation heat without water film draining, qev(ef) is the evaporation heat when some of the water drains; the initial diameter of CO2 hydrate cylinder D0 = 19 mm, the height of the cylinder H = 6 mm).
Fire 06 00124 g014
Figure 15. Carbon dioxide release rate from dissociating CO2 hydrate: 1—D0 = 3 mm, H = 3 mm; 2—D0 = 19 mm, H = 6 mm.
Fire 06 00124 g015
Figure 16. (a) Suppression of flaming combustion by granulated CO2 hydrate powder falling from above; (b) Release of carbon dioxide during high-temperature CO2 hydrate dissociation; (c) The flame slope from the air flow; (d) The flame separation from the air flow.
Fire 06 00124 g016
Figure 17. Schematic of the location of the burning fuel film and carbon dioxide hydrate barrier (hh is the height of the gas hydrate layer).
Fire 06 00124 g017
Table 1. Properties of combustible liquids used in the experiments [45,46,47,48].
General Properties
Type of FuelGasolineKeroseneDiesel FuelAlcoholUsed Motor OilPetroleum
Property
Kinematic viscosity,
mm2/s at 20 °C
0.71.341.529.77.57
Density at 20 °C, kg/cm3750780850830896849.2
Mass fraction of sulfur, %0.050.20.62.50.95
Autoignition
temperature, °C
24621621040021025
Flash temperature in open crucible, °C−4357621322365
Individual properties
Octane number91
Cetane number45
Viscosity index173
Mass fraction of water, wt%2.37
Volume fraction of ethyl alcohol, %96
Oxidation stability of gasoline, min360
Existent gum content, mg/100 cm3530
Table 2. Combustion and burnout front velocities, as well as flame height during the combustion of flammable liquids.
FuelVapor Combustion Front Velocities during the Ignition, m/sLiquid Burnout Front Velocities, m/sFlame Height during the Combustion of Flammable Liquids, cm
Kerosene10.94–6
Gasoline1.41.26–8
Separated oil1.81.54–7
Diesel fuel1.20.13–5
Alcohol1.31.14–6
Disclaimer/Publisher’s Note: The statements, opinions and data contained in all publications are solely those of the individual author(s) and contributor(s) and not of MDPI and/or the editor(s). MDPI and/or the editor(s) disclaim responsibility for any injury to people or property resulting from any ideas, methods, instructions or products referred to in the content.

