Article

Updated Land Use and Land Cover Information Improves Biomass Burning Emission Estimates

by
Guilherme Mataveli
1,2,*,
Gabriel Pereira
3,
Alber Sanchez
1,
Gabriel de Oliveira
4,
Matthew W. Jones
2,
Saulo R. Freitas
5 and
Luiz E. O. C. Aragão
1,6
1
Earth Observation and Geoinformatics Division, National Institute for Space Research, São José dos Campos 12227-010, SP, Brazil
2
School of Environmental Sciences, Tyndall Centre for Climate Change Research, University of East Anglia, Norwich NR4 7TJ, UK
3
Department of Geosciences, Federal University of São João del-Rei, São João del-Rei 36301-360, MG, Brazil
4
Department of Earth Sciences, University of South Alabama, Mobile, AL 36688, USA
5
Center for Weather Forecast and Climate Studies, National Institute for Space Research, São José dos Campos 12227-010, SP, Brazil
6
College of Life and Environmental Sciences, University of Exeter, Exeter EX4 4RJ, UK
*
Author to whom correspondence should be addressed.
Fire 2023, 6(11), 426; https://doi.org/10.3390/fire6110426
Submission received: 21 August 2023 / Revised: 23 October 2023 / Accepted: 3 November 2023 / Published: 7 November 2023
(This article belongs to the Special Issue Biomass-Burning)

Abstract

:
Biomass burning (BB) emissions negatively impact the biosphere and human lives. Orbital remote sensing and modelling are used to estimate BB emissions on regional to global scales, but these estimates are subject to errors related to the parameters, data, and methods available. For example, emission factors (mass emitted by species during BB per mass of dry matter burned) are based on land use and land cover (LULC) classifications that vary considerably across products. In this work, we evaluate how BB emissions vary in the PREP-CHEM-SRC emission estimator tool (version 1.8.3) when it is run with original LULC data from MDC12Q1 (collection 5.1) and newer LULC data from MapBiomas (collection 6.0). We compare the results using both datasets in the Brazilian Amazon and Cerrado biomes during the 2002–2020 time series. A major reallocation of emissions occurs within Brazil when using the MapBiomas product, with emissions decreasing by 788 Gg (−1.91% year−1) in the Amazon and emissions increasing by 371 Gg (2.44% year−1) in the Cerrado. The differences identified are mostly associated with the better capture of the deforestation process in the Amazon and forest formations in Northern Cerrado with the MapBiomas product, as emissions in forest-related LULCs decreased by 5260 Gg in the Amazon biome and increased by 1676 Gg in the Cerrado biome. This is an important improvement to PREP-CHEM-SRC, which could be considered the tool to build South America’s official BB emission inventory and to provide a basis for setting emission reduction targets and assessing the effectiveness of mitigation strategies.

1. Introduction

Biomass burning (BB) plays a key role in the biosphere–atmosphere interaction as it releases trace gases and aerosols that impact on the atmospheric composition [1], the incoming solar radiation and its propagation [2,3], and the water cycle by slowing it down [4], among other effects [5]. These synergic interactions contribute to climate change through positive (compounding) feedbacks [6]. BB also harms human health by increasing cardiovascular mortality and respiratory morbidity on smoky days [7,8], which are exacerbated during the dry season [9]. Moreover, it also leads to massive economic losses [10]. In such a scenario, an accurate estimation of BB emissions is required to measure the aforementioned impacts on the biosphere, atmosphere, human health, and economy.
Since BB emissions spread over most of the global vegetated areas [11,12], the integration of orbital remote sensing and modelling is the most effective approach to estimate them from regional to global scales [12,13,14,15]. BB emission estimation using orbital remote sensing and modelling follows the relationship between burned biomass and the emission factor (EF—mass emitted of a given species per mass of dry matter burned). The burned biomass can be estimated using two approaches; traditionally, it is estimated using the relationship among burned area, above-ground biomass (AGB), and combustion completeness [16]. This is the approach used in the global BB emission inventory Global Fire Emissions Database (GFED) [11,12]. However, there still are very high uncertainties in the parameters involved in this approach [17,18,19,20], which may lead to inaccurate estimates of BB emissions. For example, in a validation study conducted in the transition between the Amazon and Cerrado biomes in Brazil, the Moderate Resolution Imaging Spectroradiometer (MODIS) sensor global burned area product MCD64A1 showed an omission error of 36% [18].
Such uncertainties have led to an approach to estimate the burned biomass and associated emissions based on fire radiative power (FRP) [21,22], which does not require the use of burned area and AGB information as a primary input. FRP is a quantitative measurement that is directly related to the rate of burned biomass [22]. Currently, FRP is estimated to each active fire detected by several orbital sensors including, for example, the MODIS sensor. This approach is used by several global BB emission inventories such as Global Fire Assimilation System (GFAS) [23], Fire Energetics and Emissions Research (FEER) [24], and VIIRS-based Fire Emission Inventory version 0 (VFEIv0) [25].
Novel approaches to improve the accuracy of BB emissions focused on increasing the spatial resolution of the estimates [12] and combining active fire data from sensors onboard of polar- and geostationary-orbiting satellites to improve the representation of the FRP diurnal cycle [26,27], as well as updating parameters involved in the estimate of BB emissions (e.g., the EFs and AGB) [28,29]. Nevertheless, additional parameters must be evaluated and better represented to estimate the BB emissions more accurately; for example, land use and land cover (LULC) is a critical parameter to estimate the burned biomass and associated emissions in both burned area and FRP approaches, as the EFs are LULC-based [28,30]. The combined effects of LULC and AGB lead to substantial differences (approximately three times) in the mean estimates of carbon monoxide (CO) when using the burned area approach [29].
While global BB emission inventories are based on a more general parametrization, we have tools that are specifically designed to estimate BB emissions on a regional scale. In South America, which accounts for approximately 15% of the annual global carbon emissions associated with BB [11], it is common to use the PREP-CHEM-SRC tool. This estimator of trace gas and aerosols provides estimates from distinct sources, including BB, in flexible spatial resolutions [31]. PREP-CHEM-SRC offers the possibility of becoming the official tool to build a South American BB emission inventory, as it shows better agreement with reference data than global inventories in this part of the world [27,32]. However, despite its recent improvements [27], PREP-CHEM-SRC version 1.8.3 still uses outdated LULC information [33]. Currently, the official version of PREP-CHEM-SRC 1.8.3 is based on the global MCD12Q1 collection 5.1 product [34], which has consistent inaccuracies on a regional scale [33]. Additionally, the MCD12Q1 collection 5.1 LULC product was discontinued in 2013 and, consequently, the estimates beyond 2013 use outdated LULC information.
The use of LULC data made available by the MapBiomas project [35], which provides annual LULC maps for the entire Brazilian territory and other portions of South America since 1985, can potentially improve the surface parameters required to estimate the BB emissions when using PREP-CHEM-SRC 1.8.3. Therefore, in this work, we aimed to improve the BB emission estimates derived from PREP-CHEM-SRC 1.8.3 by updating the LULC information on the aforementioned tool. This update was based on the annual LULC maps from MapBiomas collection 6.0, which covers the entire time series analysed. We estimated the emissions for the 2002–2020 period and then analysed the difference in the annual total of fine particulate matter (PM2.5) emitted from BB, as well as the emissions per LULC class, in the Brazilian Amazon and Cerrado biomes.
Such an improvement is paramount because a great challenge for the development of national policies aimed at setting targets to reduce emissions from BB, essential to fight climate change impacts and improving human well-being and health by decreasing air pollution, lies on the reliability of these estimates [36,37,38].

2. Materials and Methods

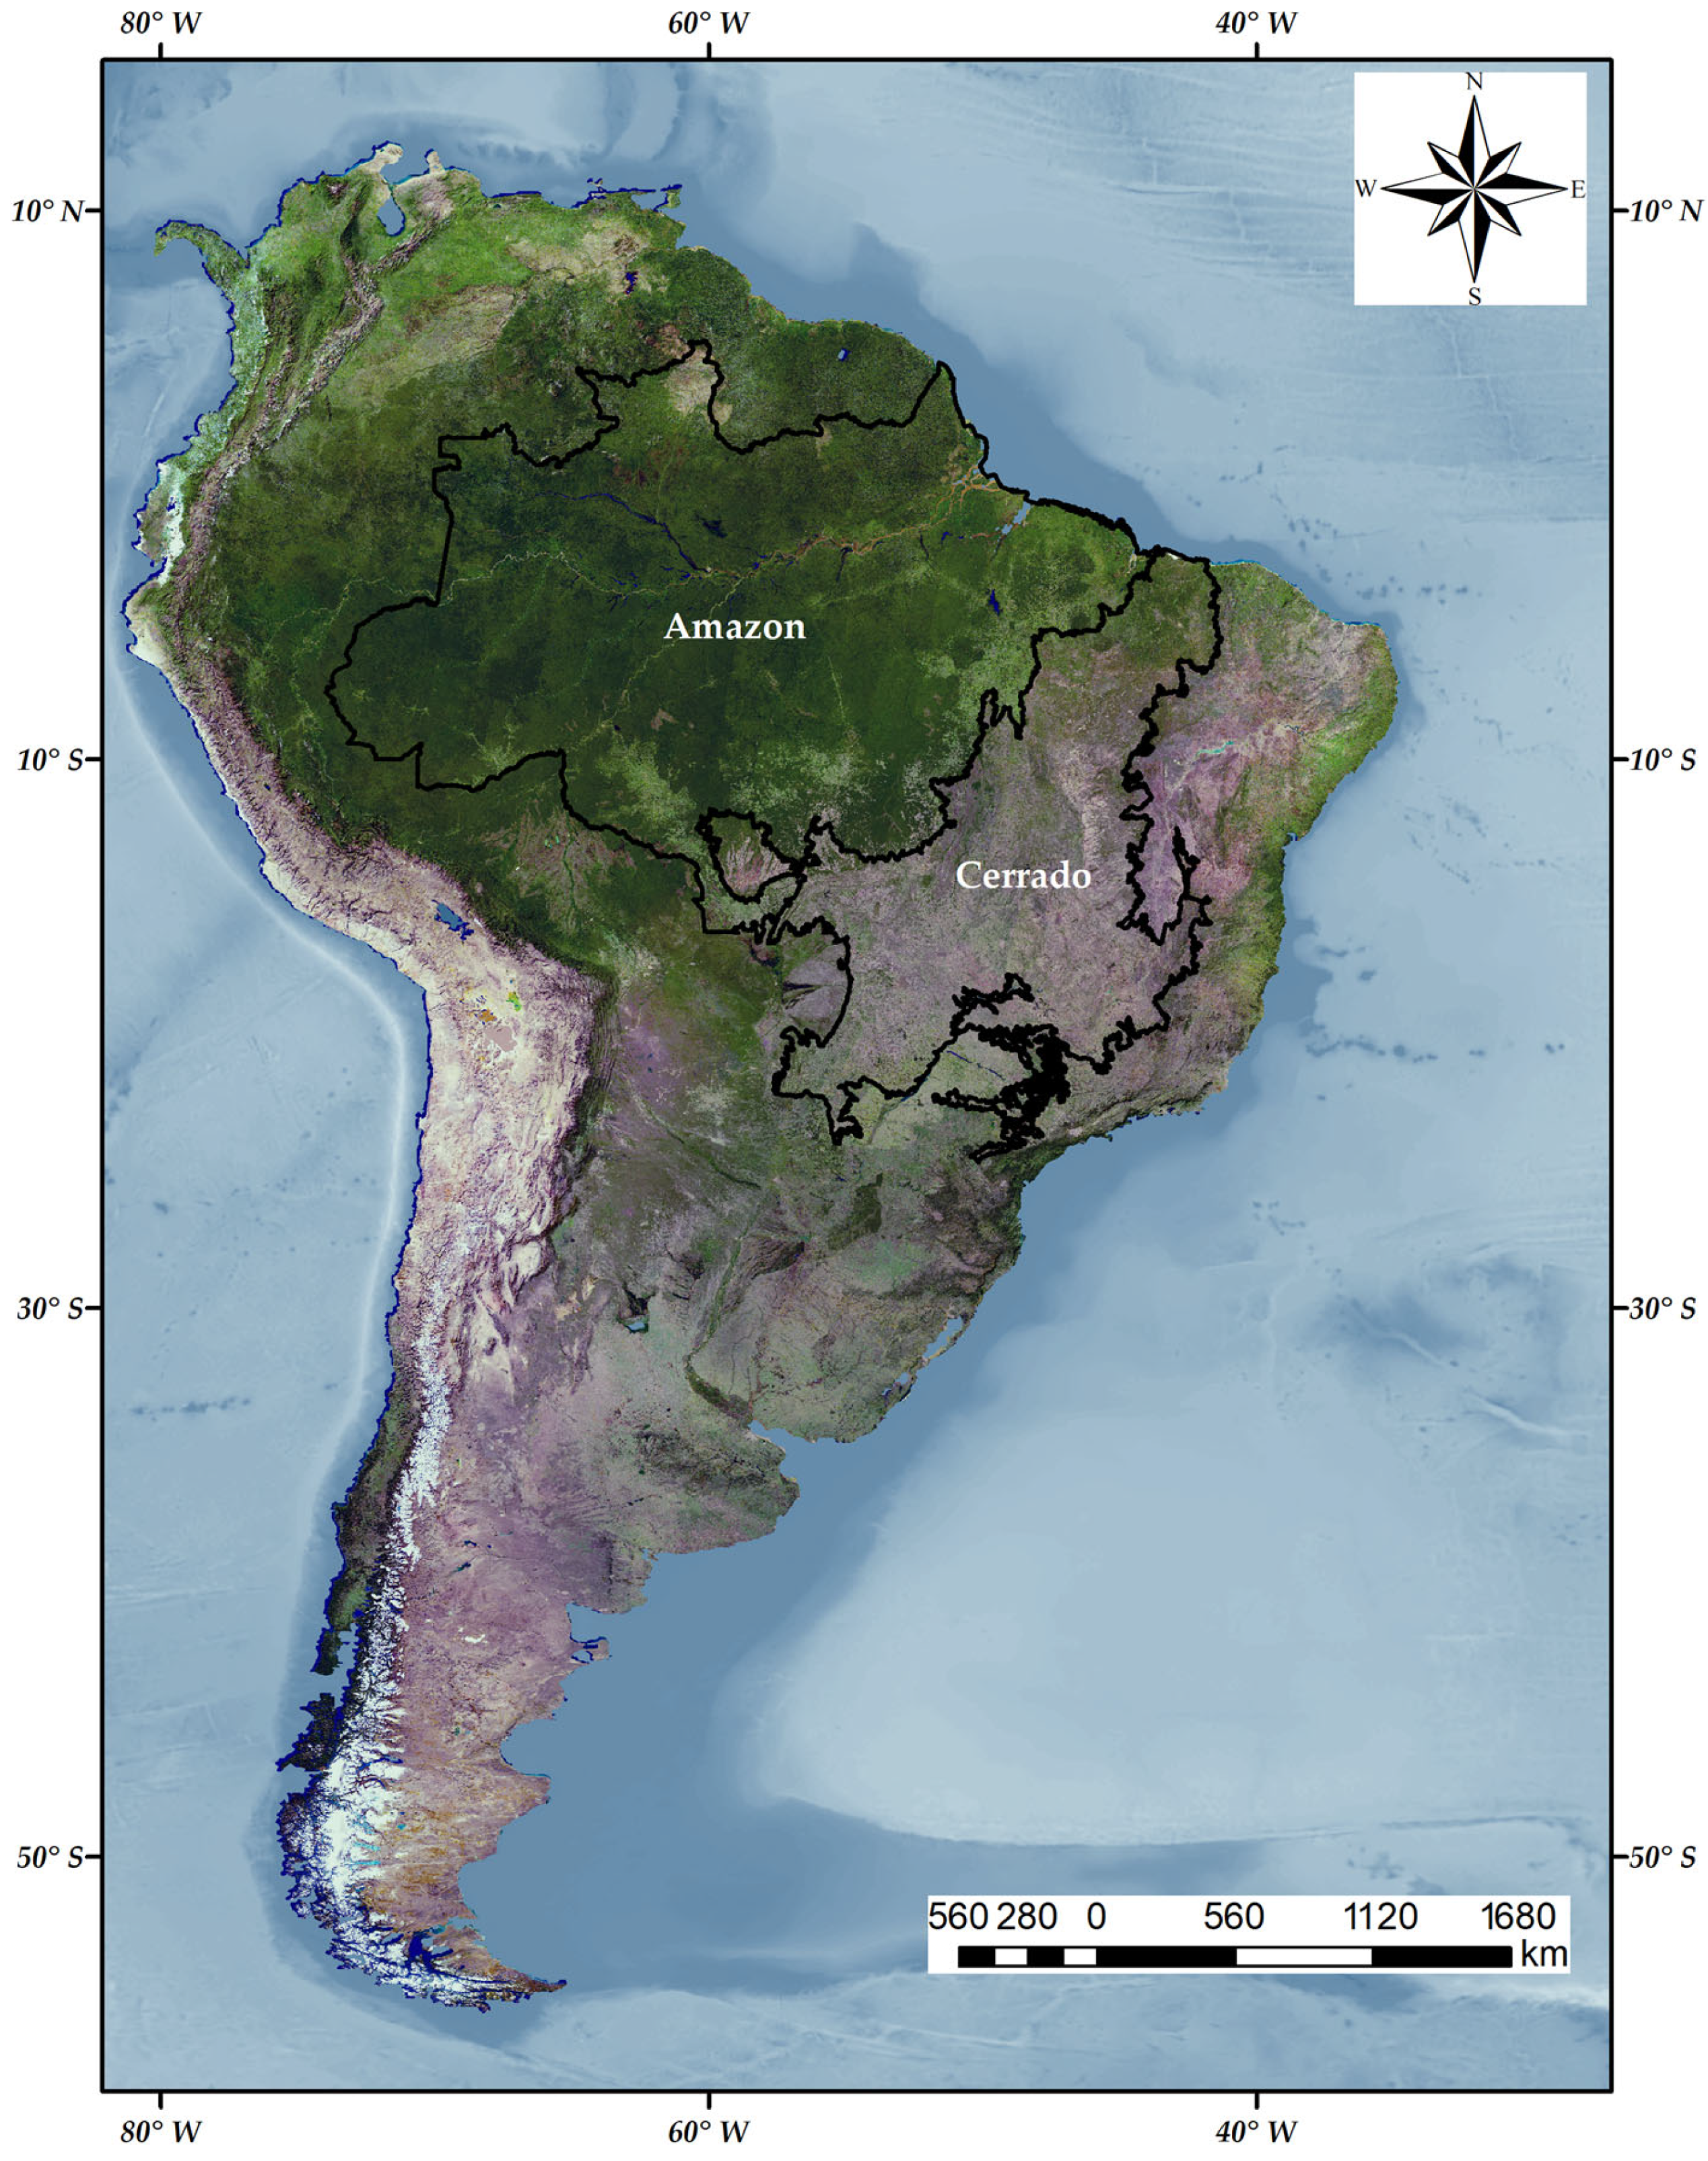
2.1. Biomass Burning in the Amazon and Cerrado Biomes

The assessment of updating LULC in PREP-CHEM-SRC 1.8.3 over the emissions associated with BB was performed in the Brazilian Amazon and Cerrado biomes (Figure 1). Combined, these two biomes account for 74% of the Brazilian territory and for 52% of the PM2.5 annually emitted from BB in South America [33].
Fire is a major disturbance mechanism in both biomes, but while the Amazon is a fire-sensitive biome, the Cerrado is a fire-prone one [39,40]. In the Amazon biome, emissions associated with BB are often linked to deforestation, which arose sharply after 2019 [41], but the influence of extreme climate events in the emissions is increasing as this region is becoming drier and hotter [42]. On the other hand, BB emissions in the Cerrado biome are linked to several synergic drivers including meteorological conditions, deforestation, land management, and the implementation of fire management techniques in Protected Areas [40], making that deforestation solely is unable to explain BB emissions in the Cerrado [43].
In addition to this, land use and land cover changes (LULCC) occurred frequently in the Amazon and Cerrado biomes over the 2002–2020 period. Areas under land use accounted for 10.4% of the Amazon biome in 2002 and reached 14.5% in 2020, while in the Cerrado biome they increased from 40.7% in 2002 to 45.7% in 2020 [44]. Considering the distinct fire regimes and the continuous LULCC process in these biomes, they are suitable to assess the impacts of updating LULC in PREP-CHEM-SRC 1.8.3 over the emissions associated with BB.

2.2. Land Use and Land Cover Information

LULC mapping has been improving in recent years, especially with the possibility of harmonizing medium-resolution image (10 m to 30 m) time series [45] and of using artificial intelligence [46] to define the LULC classes. Therefore, recent and more accurate LULC maps can reduce the very high uncertainties related to the estimate of BB emissions. The official version of PREP-CHEM-SRC 1.8.3, freely available at http://brams.cptec.inpe.br/downloads/ (accessed on 24 October 2023), uses the MODIS-derived MCD12Q1 product collection 5.1 [34] as LULC information. This is a global annual product at the spatial resolution of 500 m, covering the 2001–2013 period and following the International Geosphere-Biosphere Programme (IGBP)’s global vegetation classification scheme. This product has an overall accuracy of 75%, but the range in class-specific accuracies is large [34]. For example, producer’s accuracy and user’s accuracy for the evergreen broadleaf forest LULC is, respectively, 67.3% (±10.9%) and 90.4% (±4.6%), while for the savanna LULC class, these metrics are, respectively, 22.6% (±4.4%) and 39.0% (±6.0%) [34]. These two LULC classes are the predominant ones in the Amazon and Cerrado biomes. Moreover, MCD12Q1 collection 5.1 estimated that 65% of the Cerrado was covered by savannas in 2013, while a reference map of the same year, classified based on visual interpretation of 30 m spatial resolution images, estimated that 55% of the biome was composed of natural areas (including all savanna and forest formations) [33].
The freely available LULC dataset MapBiomas [35] collection 6.0 provides annual maps covering the 2002–2020 period, and has been considered a reference in recent studies conducted in the Brazilian territory, including the Amazon [47,48,49] and Cerrado [50,51,52] biomes. Following novel approaches, MapBiomas provides the annual LULC maps at the spatial resolution of 30 m where the automatic and pixel-by-pixel classifications of Landsat images are based on the machine learning algorithm Random Forest [53] implemented on Google Earth Engine [35]. At the most detailed level of classification (level 3), collection 6.0 defined 25 LULC classes. This dataset has, respectively, an overall accuracy of 96.6% and 74.9% in the Amazon and Cerrado biomes for collection 6.0 at level 3 of the classification [54]. Therefore, MapBiomas annual maps are suitable to update the LULC information used by PREP-CHEM-SRC 1.8.3 to estimate the BB emissions.

2.3. PREP-CHEM-SRC Emission Estimator Tool

Emission fields from distinct sources, e.g., BB and volcanoes, can be estimated using the emission estimator tool PREP-CHEM-SRC with flexible spatial resolutions and projections [31]. The estimate of BB emissions in PREP-CHEM-SRC is possibly performed based on the burned area approach (3BEM model) or the FRP approach (3BEM_FRP model). Here, we have chosen the FRP-based method to estimate the BB emissions, as this approach requires fewer inputs in the estimates [22] and, therefore, the impact of LULC over the emissions would be more evident. Emission sources other than BB were not considered in this study. The domain adopted was a regular grid spatially distributed over South America at the spatial resolution of 0.1° (~11 km). The 3BEM_FRP inputs consisted of the MODIS active fire products (MOD14 and MYD14) collection 6.0 [55], which provide a FRP estimate associated with the active fires detected. MODIS active fire products were proven effective in estimating the FRP diurnal cycle and associated emissions [27]. The PREP-CHEM-SRC outputs consist of the mass of several species of trace gases and aerosols emitted daily, including the PM2.5, by BB in South America at the spatial resolution of 0.1°. Since we only used MODIS active fires as inputs, we multiplied the daily emissions by 1.04 in order to simulate the estimates obtained when combining active fires derived from sensors onboard polar-orbiting and geostationary satellites, as proposed by Pereira et al. [27]. Then, the daily values related to PM2.5 were summed to achieve annual estimates, and clipped to the limits of the Amazon and Cerrado biomes defined by the Brazilian Institute for Geography and Statistics to achieve the previously described aims of the study. More details on the method applied are described in de Oliveira et al. [56], while 3BEM_FRP and PREP-CHEM-SRC are fully detailed in Freitas et al. [31], Pereira et al. [32], Santos et al. [57], and Pereira et al. [27]. The latter work also validated the estimates and compared with global BB emission inventories.

2.4. PREP-CHEM-SRC Runs and Updating Land Use and Land Cover Information

We ran PREP-CHEM-SRC 1.8.3 under two conditions: (i) considering the LULC information available in PREP-CHEM-SRC based on the MCD12Q1 product collection 5.1, and (ii) altering the LULC information in the tool based on MapBiomas annual maps collection 6.0 (years 2002 to 2020). In both cases, all input data and parameters were the same except for the LULC information.
Before running PREP-CHEM-SRC under the second condition, the new LULC information was pre-processed. This pre-processing consisted of the following: (i) Obtaining the annual LULC maps defined by MapBiomas collection 6.0 for the 2002–2020 period from GEE. (ii) Resampling the original spatial resolution of the annual maps (30 m) to 500 m, since this is the one read in PREP-CHEM-SRC. This step followed the majority of the LULC at the 500 m spatial resolution. (iii) Reclassifying the LULC categories defined by MapBiomas to match the IGBP classification scheme (Table 1), since this is the classification scheme adopted by PREP-CHEM-SRC. (iv) Converting the processed maps to the format read in PREP-CHEM-SRC.
The results derived from each condition were compared in terms of (i) area of each LULC class; (ii) spatial distribution of the two LULC types of information; (iii) total PM2.5 annually emitted by BB; and (iv) spatial distribution of the PM2.5 annually emitted by BB in the Amazon and Cerrado biomes during the 2002–2020 period.

3. Results

3.1. Land Use and Land Cover Information

Figure 2 compares the old (MCD12Q1 collection 5.1) and new (MapBiomas collection 6.0) LULC information, for the year 2013, used by PREP-CHEM-SRC to estimate the BB emissions in the Amazon and Cerrado biomes. The year 2013 is the most recent LULC map available in MCD12Q1 collection 5.1. This figure shows that the new LULC information better captures the deforestation in the Amazon biome. For example, there are larger areas classified as grasslands and croplands in the eastern flank of the biome, which are consistent with the most anthropized portion of the Amazon [58]. In 2013, the total area of forest-related LULCs in the Amazon biome considering the new LULC information decreased by 2.55% when compared with the old LULC information (from 3,577,651 km2 to 3,486,351 km2), while the total area of the savanna-related and grassland LULCs increased by 34.96% (from 515,096 km2 to 695,173 km2), and the cropland LULC total area increased by 75.49% (from 22,358 km2 to 39,236 km2). The cropland/natural vegetation mosaic LULC area decreased by 11,926 km2, when comparing the old and the new LULC information for the year 2013.
In the Cerrado biome, distinct patterns were identified. Forest-related LULCs increased with new data, especially in the northern portion of the Cerrado. In 2013, the old LULC information identified 90,335 km2 of forest-related LULCs, while considering the new LULC information, 314,123 km2 were identified (an increase of 247.73%). The cropland LULC also increased, especially in the MATOPIBA agricultural frontier located in Central Cerrado, from 114,475 km2 to 191,036 km2 (66.88%). A similar pattern was identified in the cropland/natural vegetation mosaic LULC, which increased from 81,883 km2 to 101,211 km2 (23.60%). On the other hand, the savanna-related and grassland LULCs decreased by 19.51% (from 1,627,663 km2 to 1,310,119 km2).
These differences were even higher in 2020, when the old LULC information was more outdated (Figure S1). This is because the official version of PREP-CHEM-SRC uses the MCD12Q1 collection 5.1 map for the year 2013 as LULC information to estimate the BB emissions from 2013 until the current period. The total area of forest-related LULCs in the Amazon biome, considering the new LULC information, decreased by 4.20% when compared with the old LULC information (from 3,577,651 km2 to 3,427,193 km2); savanna-related and grassland LULCs increased from 515,096 km2 to 731,288 km2 (41.97%); the cropland LULC total area increased from 22,358 km2 to 60,668 km2 (171%); and the cropland/natural vegetation mosaic LULC area decreased 119,256 km2. In the Cerrado biome, in 2020, the old LULC information identified 90,335 km2 of forest-related LULCs, and the new LULC information 322,513 km2 (an increase of 257.01%); the cropland LULC increased from 114,475 km2 to 235,623 km2 (105.83%); the cropland/natural vegetation mosaic LULC increased from 81,883 km2 to 119,379 km2 (45.29%); and the savanna-related and grassland LULCs decreased by 23.85% (from 1,627,663 km2 to 1,239,407 km2).
We observe that, when comparing the annual old and new LULC information used to estimate the emissions using PREP-CHEM-SRC 1.8.3 during 2002–2020, several grid cells showed a different LULC in all 19 years compared (Figure 3). This is more frequent in the southern portion of the Cerrado and in the Eastern Amazon. While in 59% of the study area, the distinct LULC information matched during all years analysed, in 22% of the study area, the LULC was different during the entire period analysed. The LULC differed from 1 to 9 years in 9% of the combined footprint of the Amazon and Cerrado biomes, while the LULC differed from 10 to 18 years in 10% of the area.

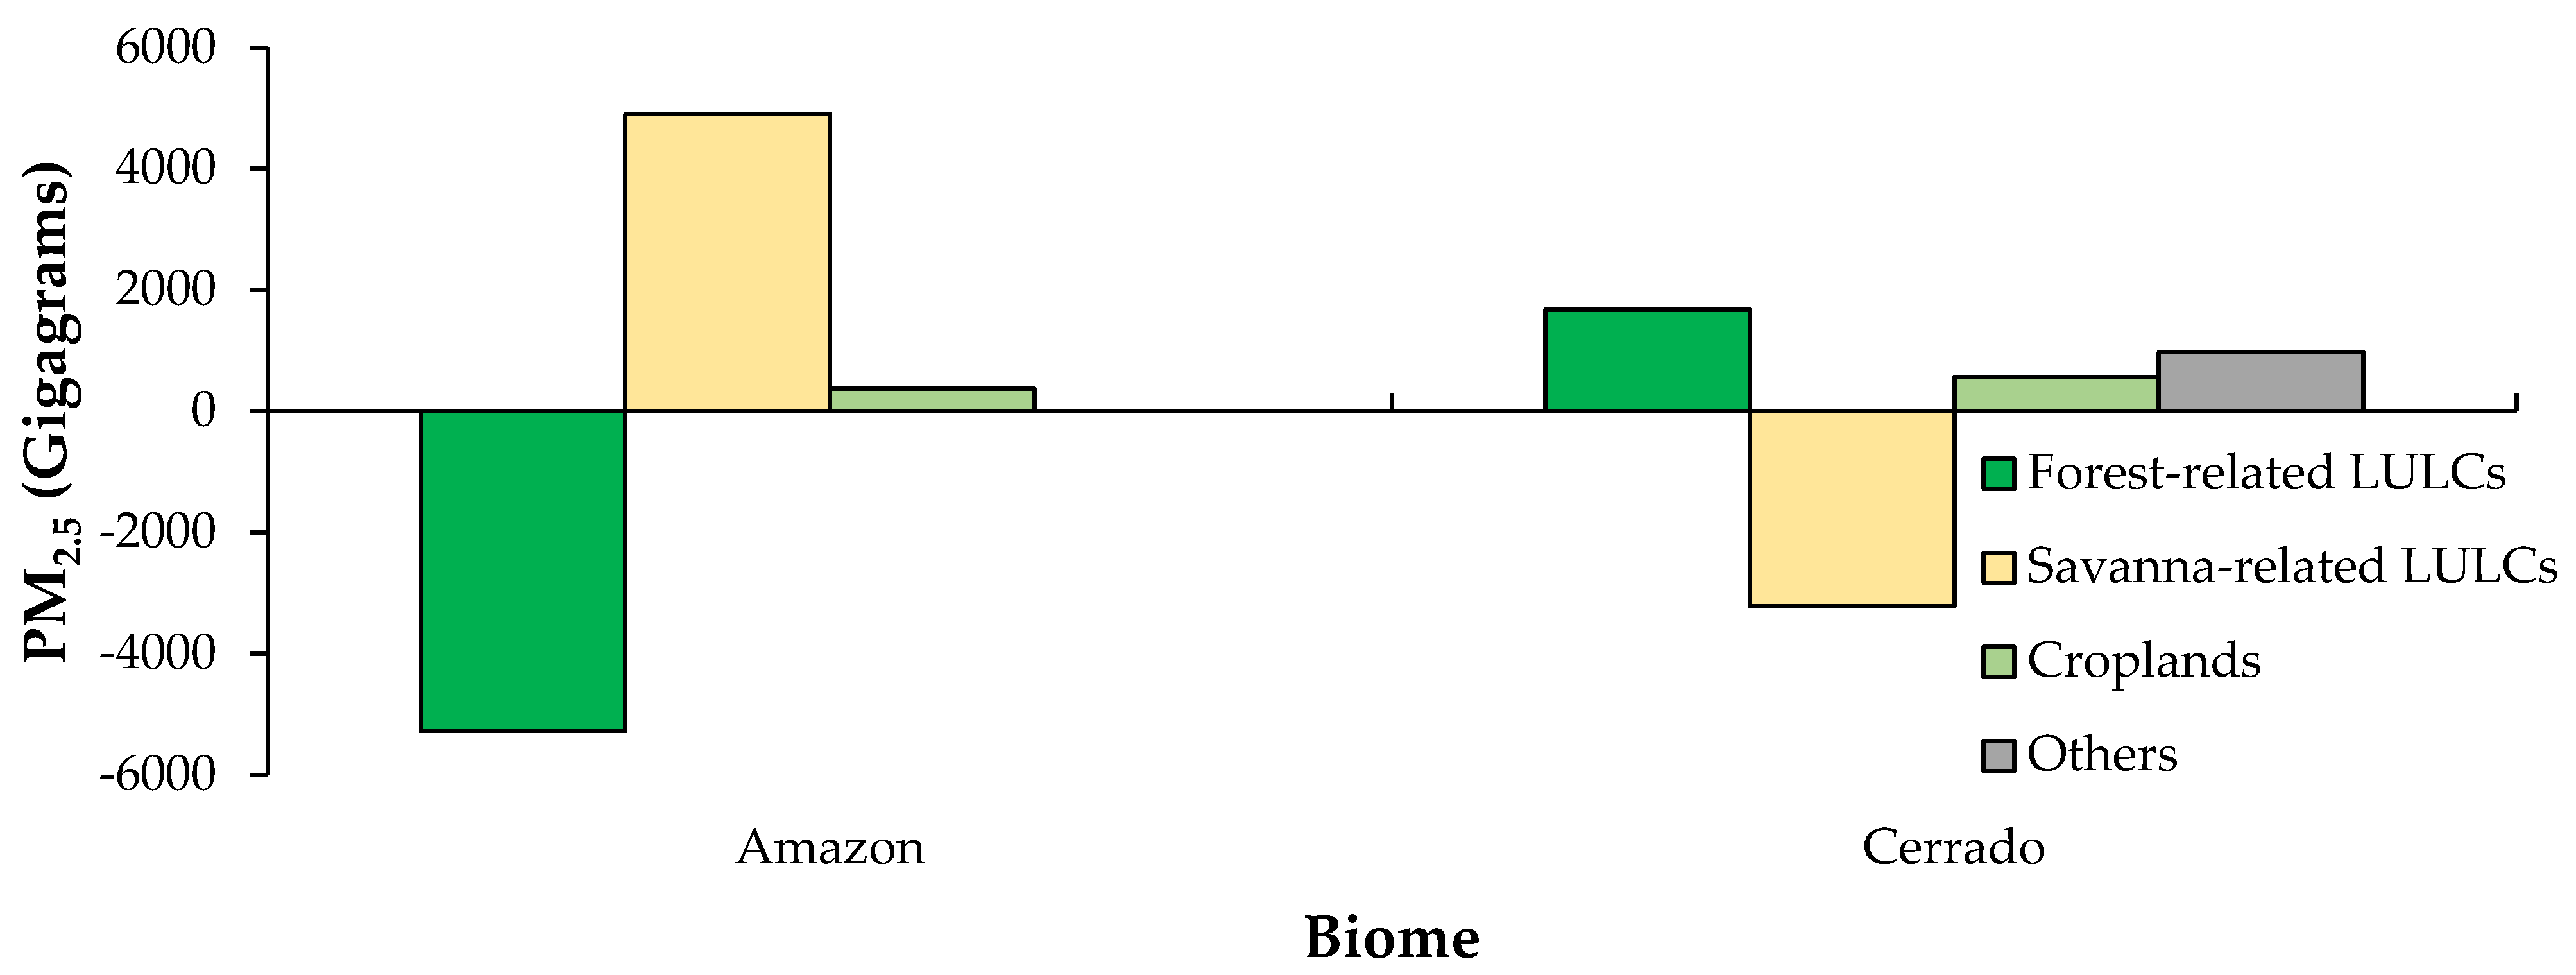
3.2. Estimates of Biomass Burning Emissions

Figure 4 compares the annual emissions of PM2.5 associated with BB in the Amazon and Cerrado biomes during the 2002–2020 time series, considering the new LULC information implemented on PREP-CHEM-SRC 1.8.3, as well as the difference in the annual emissions when comparing the estimates obtained with the new and old LULC information, respectively. In the Amazon biome, annual values considering the new LULC information decreased in all years analysed. Considering the entire time series, emissions decreased by 787.77 Gg with the new LULC information, an average decrease of 1.91% or 41.46 Gg year−1. In 2020, when the LULC information was more critically outdated, the decrease with the new LULC information was 3.20% (56.12 Gg). On the contrary, annual emissions in the Cerrado biome increased in all years analysed with the LULC information. The increase considering the entire time series was 371.15 Gg, representing an average of 2.44% or 19.58 Gg year−1. In the more recent year analysed, the increase was 2.55% (20.90 Gg).
We also observe the interannual patterns of the PM2.5 emitted from BB in the Amazon and Cerrado biomes during the 2002–2020 period from Figure 4. When considering the estimates obtained using the new LULC information, the year 2004 had the highest emission in the Amazon during the time series analysed (4228 Gg). On the contrary, the year 2013 had the lowest estimate (596 Gg). In the Cerrado biome, the annual emission of PM2.5 associated with BB, considering the new LULC information, peaked in 2007 and 2010 (1665 Gg and 2008 Gg, respectively), two dry years in the biome. The lowest estimate was found in the year 2009 (224 Gg).
When analysing the emissions per LULC class, the impact of the updated LULC over the emissions is clearer (Figure 5). In the Amazon biome, the total PM2.5 emitted by forest-related LULCs during the 2002–2020 time series decreased by 5276 Gg when comparing the estimates obtained with the new and old LULC information (Table S1), while emissions in savanna-related LULCs and croplands increased by 4903 Gg and 372 Gg, respectively. In the Cerrado biome, emissions in savanna-related LULCs decreased by 3216 Gg, while emissions in forest-related LULCs, croplands, and other LULCs increased by 1676 Gg, 559 Gg, and 981 Gg, respectively (Table S2).
The spatial distribution of the average PM2.5 emitted annually from BB in the Amazon and Cerrado during the 2002–2020 period, considering the estimates obtained using the new LULC information, is shown in Figure 6. We observed that the gridded estimates are higher in the Amazon biome, reaching up to 0.018 kg m−2 year−1. In this biome, emissions associated with BB are concentrated in the eastern flank, such as in the region known as “Arc of Deforestation”. Several grid cells, concentrated in central and western Amazon, showed no emission associated with BB during the period analysed. By contrast, in the Cerrado we have found non-zero emission grid cells in most of the biome, but values are lower than in the Amazon biome, reaching up to 0.014 kg m−2 year−1. The Cerrado highest estimates are located in transitional areas with the Amazon biome, such as in the northern flank, where there is a higher incidence of forest formations that have now increased emissions with the new LULC information implemented on PREP-CHEM-SRC 1.8.3.
From Figure 7, we observe that, in 34% of the study area, the estimated emissions changed with the updated LULC information implemented on PREP-CHEM-SRC. In 22% of the study area, the emissions were unmatched from 1 to 9 years, while in 12% of the Amazon-Cerrado area, the emissions were unmatched from 10 to 19 years. We also observe that, in both the Amazon and Cerrado biomes, the major differences were in areas of forest formation classified as savannas/croplands, or vice versa, because we have different EF values between these LULC classes (see Table 1). Therefore, if the LULC changed but the EF value of the new LULC is the same, emissions will not change.

4. Discussion

LULC is a critical parameter to estimate the emissions associated with BB. When we consider the FRP approach, or the burned area approach, the EF values depend on the LULC where the BB event occurred. For example, in PREP-CHEM-SRC 1.8.3, the PM2.5 EF for a BB event occurring in an evergreen broadleaf forest area is 9.4 g kg−1, while if the same BB event was identified in a savanna area, this parameter would be 4.0 g kg−1 (Table 1). Therefore, in this example, the PM2.5 emission associated with a BB event can be much more than halved if an evergreen broadleaf forest area is incorrectly classified as a savanna. This emphasizes the need for accurate and updated LULC information to estimate the BB emissions.
This explains the decrease in the annual emissions associated with BB during the period 2002–2020 identified in the Amazon biome when we consider the new LULC information (see Figure 4), because we have fewer forest areas (Figure 2 and Figure 5, Table S1) that have a higher emission factor than savannas or croplands (Table 1). The opposite process was identified in the Cerrado biome, since there are more forest formations (higher EF) with the new LULC information (Figure 2 and Figure 5, Table S2). Forest fires are a major disturbance in the Northern Cerrado, burning on average 1680 km2 year−1 [59], where the area of this LULC has now increased.
The difference between the LULC maps shown in Figure 3 is explained not only by LULCC, but also by the reclassification process necessary for the MapBiomas classifications to match the IGBP classification scheme. For example, the LULC information derived from MCD12Q1 has several LULCC classes related to savannas (e.g., savannas, woody savannas, and open shrublands), while the MapBiomas-derived LULC information has only one class related to this LULC (savannas). This helps to explain the major differences identified in southern Cerrado (Figure 3). Moreover, the pasture LULC defined by MapBiomas was reclassified to the grassland LULC, which is often misclassified as savanna by the MCD12Q1 product collection 5.1 [34]. Finally, the higher presence of permanent wetlands in the Cerrado with MapBiomas (especially in the border with the Amazon biome—Figure 2) is also explained by the reclassification process, when the MapBiomas other non-forest formation LULC class (flooded fields and swampy areas) better matched the IGBP permanent wetland LULC class (lands with a mixture of water and herbaceous or woody vegetation). This has also impacted on the results shown in Figure 5 and Table S2. Nevertheless, the differences derived from the reclassification process pointed out here do not directly affect the estimate of total emissions, since all these LULC classes have the same emission factor (see Table 1).
Following what has been discussed so far, we also highlight that other important improvements must be added to PREP-CHEM-SRC. For example, the tool considers the same EF for the savanna and cropland LULC classes (4.0 g of PM2.5 emitted per kg of dry matter burned—see Table 1), in contrast to global BB emission inventories [11,12]. If these values were distinct, we would expect a difference between the two scenarios much higher than the 34% shown in Figure 7. An alternative to overcome this limitation is to implement the EF values proposed by Andreae [28] in PREP-CHEM-SRC, who integrated values from more than 370 published papers to identify LULC-based average EF values. For example, instead of 4.0 g kg−1 for both LULCs, the EF value for the species PM2.5 during a burning event in a savanna area would be 6.7 g kg−1 and 8.1 g kg−1 in a cropland area [28].
Finally, we highlight that improving the estimation of BB emissions is paramount in formulating effective policies to combat climate change on local to global scales, as policymakers need reliable information to understand the extent and impact of these emissions. Therefore, the scientific knowledge translated into improved estimates described here not only helps tracking patterns and trends but also provides a basis for setting emission reduction targets and assessing the effectiveness of mitigation strategies.

5. Conclusions

In this work, we explored the influence of LULC on the emissions associated with BB. To this end, we have run the PREP-CHEM-SRC tool version 1.8.3 under two conditions, considering the old (MCD12Q1 collection 5.1) and the new (MapBiomas collection 6.0) LULC information, and then compared the results (PM2.5 emitted from BB) in the Amazon (decreased emissions) and Cerrado (increased emissions) biomes. The differences identified were mostly associated with the better capture of the deforestation process in the Amazon and forest formations in Northern Cerrado with the new LULC information.
The updated LULC information is an important improvement on PREP-CHEM-SRC, which could be considered South America’s leading BB emission estimator tool. Yet, future studies could test, for example, the variability in the estimated emissions across different versions of MapBiomas (currently on version 8.0, which includes annual maps from 1985 to 2022), and quantify the variability across those, although we have high overall accuracies of MapBiomas collection 6.0 in the Amazon and Cerrado biomes (96.6% and 74.9%, respectively). We also highlight that MapBiomas collection 6.0 covers the entire time series analysed (2002 to 2020).
Finally, more efforts should be made to improve the accuracy of the emissions derived from this tool. The proposed update of the EF values is promising, especially because they better represent the savanna and cropland LULCs than the values currently adopted in PREP-CHEM-SRC [28]. Overall, we expect increased BB emissions in South America with these EF values. In addition to this, we could test the uncertainties involved in the EF parameter to estimate BB emissions by running PREP-CHEM-SRC using the average, minimum, and maximum EF values for each LULC class defined by Andreae [28].

Supplementary Materials

The following supporting information can be downloaded at: https://www.mdpi.com/article/10.3390/fire6110426/s1, Figure S1: Land use and land cover (LULC) in the Amazon and Cerrado biomes for the year 2020 considering the old ((a)—MCD12Q1 collection 5.1, year 2013) and new ((b)—MapBiomas collection 6.0, year 2020) LULC information implemented on PREP-CHEM-SRC. The MapBiomas original LULC classes were reclassified to match the IGBP classification scheme; Table S1: Difference in the annual and total PM2.5 emitted from biomass burning (Gg) in the Amazon biome per LULC during the 2002–2020 time series when comparing the estimates obtained with the new (MapBiomas collection 6.0) and old (MCD12Q1 collection 5.1) LULC information. The forest-related class comprises the evergreen needleleaf forest, evergreen broadleaf forest, deciduous needleleaf forest, deciduous broadleaf forest, mixed forest, and the cropland/natural vegetation mosaic LULC classes. The savanna-related class comprises the closed shrubland, open shrubland, woody savanna, savanna, and grassland LULC classes. The croplands class is represented by the cropland LULC class. The other class comprises the permanent wetlands LULC class; Table S2: Difference in the annual and total PM2.5 emitted from biomass burning (Gg) in the Cerrado biome per LULC during the 2002–2020 time series when comparing the estimates obtained with the new (MapBiomas collection 6.0) and old (MCD12Q1 collection 5.1) LULC information. The forest-related class comprises the evergreen needleleaf forest, evergreen broadleaf forest, deciduous needleleaf forest, deciduous broadleaf forest, mixed forest, and the cropland/natural vegetation mosaic LULC classes. The savanna-related class comprises the closed shrubland, open shrubland, woody savanna, savanna, and grassland LULC classes. The croplands class is represented by the cropland LULC class. The other class comprises the permanent wetlands LULC class.

Author Contributions

Conceptualization, G.M., G.P. and L.E.O.C.A.; methodology, G.M. and G.P.; writing—original draft preparation, G.M. and G.P.; writing—review and editing, A.S., G.d.O., M.W.J., S.R.F. and L.E.O.C.A. All authors have read and agreed to the published version of the manuscript.

Funding

G.M. and L.E.O.C.A. thank the São Paulo Research Foundation (FAPESP—grants 2019/25701-8, 2016/02018-2, 2020/15230-5, 2023/03206-0) for funding. L.E.O.C.A. also thanks the National Council for Scientific and Technological Development (CNPq—grant 314416/2020-0) for funding.

Institutional Review Board Statement

Not applicable.

Informed Consent Statement

Not applicable.

Data Availability Statement

The daily estimates of PM2.5 associated with biomass burning in South America during the 2002–2020 period, obtained using the new land use and land cover information implemented on PREP-CHEM-SRC 1.8.3, are available in the Zenodo repository at the following link https:/zenodo.org/records/10037352.

Conflicts of Interest

The authors declare no conflict of interest.

References

  1. Schill, G.P.; Froyd, K.D.; Bian, H.; Kupc, A.; Williamson, C.; Brock, C.A.; Ray, E.; Hornbrook, R.S.; Hills, A.J.; Apel, E.C.; et al. Widespread biomass burning smoke throughout the remote troposphere. Nat. Geosci. 2020, 13, 422–427. [Google Scholar] [CrossRef]
  2. Brown, H.; Liu, X.; Pokhrel, R.; Murphy, S.; Lu, Z.; Saleh, R.; Mielonen, T.; Kokkola, H.; Bergman, T.; Myhre, G.; et al. Biomass burning aerosols in most climate models are too absorbing. Nat. Commun. 2021, 12, 277. [Google Scholar] [CrossRef] [PubMed]
  3. Calì Quaglia, F.; Meloni, D.; Muscari, G.; Di Iorio, T.; Ciardini, V.; Pace, G.; Becagli, S.; Di Bernardino, A.; Cacciani, M.; Hannigan, J.W.; et al. On the Radiative Impact of Biomass-Burning Aerosols in the Arctic: The August 2017 Case Study. Remote Sens. 2022, 14, 313. [Google Scholar] [CrossRef]
  4. Li, F.; Lawrence, D.M.; Jiang, Y.; Liu, X.; Lin, Z. Fire Aerosols Slow Down the Global Water Cycle. J. Clim. 2022, 35, 3619–3633. [Google Scholar] [CrossRef]
  5. Magalhaes, N.N.; Evangelista, H.; Condom, T.; Rabatel, A.; Ginot, P. Amazonian Biomass Burning Enhances Tropical Andean Glaciers Melting. Sci. Rep. 2019, 9, 16914. [Google Scholar] [CrossRef]
  6. Thornhill, G.D.; Ryder, C.L.; Highwood, E.J.; Shaffrey, L.C.; Johnson, B.T. The effect of South American biomass burning aerosol emissions on the regional climate. Atmos. Chem. Phys. 2018, 18, 5321–5342. [Google Scholar] [CrossRef]
  7. Karanasiou, A.; Alastuey, A.; Amato, F.; Renzi, M.; Stafoggia, M.; Tobias, A.; Reche, C.; Forastiere, F.; Gumy, S.; Mudu, P.; et al. Short-term health effects from outdoor exposure to biomass burning emissions: A review. Sci. Total Environ. 2021, 781, 146739. [Google Scholar] [CrossRef] [PubMed]
  8. Johnston, H.J.; Mueller, W.; Steinle, S.; Vardoulakis, S.; Tantrakarnapa, K.; Loh, M.; Cherrie, J.W. How Harmful Is Particulate Matter Emitted from Biomass Burning? A Thailand Perspective. Curr. Pollut. Rep. 2019, 5, 353–377. [Google Scholar] [CrossRef]
  9. Ballesteros-Gonzalez, K.; Sullivan, A.P.; Morales-Betancourt, R. Estimating the air quality and health impacts of biomass burning in northern South America using a chemical transport model. Sci. Total Environ. 2020, 739, 139755. [Google Scholar] [CrossRef]
  10. Campanharo, W.; Lopes, A.; Anderson, L.; da Silva, T.; Aragão, L. Translating Fire Impacts in Southwestern Amazonia into Economic Costs. Remote Sens. 2019, 11, 764. [Google Scholar] [CrossRef]
  11. Van der Werf, G.R.; Randerson, J.T.; Giglio, L.; van Leeuwen, T.T.; Chen, Y.; Rogers, B.M.; Mu, M.; van Marle, M.J.E.; Morton, D.C.; Collatz, G.J.; et al. Global fire emissions estimates during 1997–2016. Earth Syst. Sci. Data 2017, 9, 697–720. [Google Scholar] [CrossRef]
  12. Van Wees, D.; van der Werf, G.R.; Randerson, J.T.; Rogers, B.M.; Chen, Y.; Veraverbeke, S.; Giglio, L.; Morton, D.C. Global biomass burning fuel consumption and emissions at 500 m spatial resolution based on the Global Fire Emissions Database (GFED). Geosci. Model Dev. 2022, 15, 8411–8437. [Google Scholar] [CrossRef]
  13. Andela, N.; van der Werf, G.R.; Kaiser, J.W.; van Leeuwen, T.T.; Wooster, M.J.; Lehmann, C.E.R. Biomass burning fuel consumption dynamics in the tropics and subtropics assessed from satellite. Biogeosciences 2016, 13, 3717–3734. [Google Scholar] [CrossRef]
  14. Pan, X.; Ichoku, C.; Chin, M.; Bian, H.; Darmenov, A.; Colarco, P.; Ellison, L.; Kucsera, T.; da Silva, A.; Wang, J.; et al. Six global biomass burning emission datasets: Intercomparison and application in one global aerosol model. Atmos. Chem. Phys. 2020, 20, 969–994. [Google Scholar] [CrossRef]
  15. Zhong, Q.; Schutgens, N.; van der Werf, G.R.; van Noije, T.; Bauer, S.E.; Tsigaridis, K.; Mielonen, T.; Checa-Garcia, R.; Neubauer, D.; Kipling, Z.; et al. Using modelled relationships and satellite observations to attribute modelled aerosol biases over biomass burning regions. Nat. Commun. 2022, 13, 5914. [Google Scholar] [CrossRef] [PubMed]
  16. Seiler, W.; Crutzen, P.J. Estimates of gross and net fluxes of carbon between the biosphere and the atmosphere from biomass burning. Clim. Chang. 1980, 2, 207–247. [Google Scholar] [CrossRef]
  17. Pessôa, A.C.M.; Anderson, L.O.; Carvalho, N.S.; Campanharo, W.A.; Junior, C.H.L.S.; Rosan, T.M.; Reis, J.B.C.; Pereira, F.R.S.; Assis, M.; Jacon, A.D.; et al. Intercomparison of Burned Area Products and Its Implication for Carbon Emission Estimations in the Amazon. Remote Sens. 2020, 12, 3864. [Google Scholar] [CrossRef]
  18. Shimabukuro, Y.E.; Dutra, A.C.; Arai, E.; Duarte, V.; Cassol, H.L.G.; Pereira, G.; Cardozo, F.d.S. Mapping Burned Areas of Mato Grosso State Brazilian Amazon Using Multisensor Datasets. Remote Sens. 2020, 12, 3827. [Google Scholar] [CrossRef]
  19. Araza, A.; de Bruin, S.; Herold, M.; Quegan, S.; Labriere, N.; Rodriguez-Veiga, P.; Avitabile, V.; Santoro, M.; Mitchard, E.T.A.; Ryan, C.M.; et al. A comprehensive framework for assessing the accuracy and uncertainty of global above-ground biomass maps. Remote Sens. Environ. 2022, 272, 112917. [Google Scholar] [CrossRef]
  20. Shimabukuro, Y.E.; de Oliveira, G.; Pereira, G.; Arai, E.; Cardozo, F.; Dutra, A.C.; Mataveli, G. Assessment of Burned Areas during the Pantanal Fire Crisis in 2020 Using Sentinel-2 Images. Fire 2023, 6, 277. [Google Scholar] [CrossRef]
  21. Wooster, M.J. Small-scale experimental testing of fire radiative energy for quantifying mass combusted in natural vegetation fires. Geophys. Res. Lett. 2002, 29, 23-1–23-4. [Google Scholar] [CrossRef]
  22. Wooster, M.J.; Roberts, G.; Perry, G.L.W.; Kaufman, Y.J. Retrieval of biomass combustion rates and totals from fire radiative power observations: FRP derivation and calibration relationships between biomass consumption and fire radiative energy release. J. Geophys. Res. 2005, 110, 311. [Google Scholar] [CrossRef]
  23. Kaiser, J.W.; Heil, A.; Andreae, M.O.; Benedetti, A.; Chubarova, N.; Jones, L.; Morcrette, J.J.; Razinger, M.; Schultz, M.G.; Suttie, M.; et al. Biomass burning emissions estimated with a global fire assimilation system based on observed fire radiative power. Biogeosciences 2012, 9, 527–554. [Google Scholar] [CrossRef]
  24. Ichoku, C.; Ellison, L. Global top-down smoke-aerosol emissions estimation using satellite fire radiative power measurements. Atmos. Chem. Phys. 2014, 14, 6643–6667. [Google Scholar] [CrossRef]
  25. Ferrada, G.A.; Zhou, M.; Wang, J.; Lyapustin, A.; Wang, Y.; Freitas, S.R.; Carmichael, G.R. Introducing the VIIRS-based Fire Emission Inventory version 0 (VFEIv0). Geosci. Model Dev. 2022, 15, 8085–8109. [Google Scholar] [CrossRef]
  26. Li, F.; Zhang, X.; Kondragunta, S.; Lu, X.; Csiszar, I.; Schmidt, C.C. Hourly biomass burning emissions product from blended geostationary and polar-orbiting satellites for air quality forecasting applications. Remote Sens. Environ. 2022, 281, 113237. [Google Scholar] [CrossRef]
  27. Pereira, G.; Longo, K.M.; Freitas, S.R.; Mataveli, G.; Oliveira, V.J.; Santos, P.R.; Rodrigues, L.F.; Cardozo, F.S. Improving the south America wildfires smoke estimates: Integration of polar-orbiting and geostationary satellite fire products in the Brazilian biomass burning emission model (3BEM). Atmos. Environ. 2022, 273, 118954. [Google Scholar] [CrossRef]
  28. Andreae, M.O. Emission of trace gases and aerosols from biomass burning—An updated assessment. Atmos. Chem. Phys. 2019, 19, 8523–8546. [Google Scholar] [CrossRef]
  29. Saito, M.; Shiraishi, T.; Hirata, R.; Niwa, Y.; Saito, K.; Steinbacher, M.; Worthy, D.; Matsunaga, T. Sensitivity of biomass burning emissions estimates to land surface information. Biogeosciences 2022, 19, 2059–2078. [Google Scholar] [CrossRef]
  30. Akagi, S.K.; Yokelson, R.J.; Wiedinmyer, C.; Alvarado, M.J.; Reid, J.S.; Karl, T.; Crounse, J.D.; Wennberg, P.O. Emission factors for open and domestic biomass burning for use in atmospheric models. Atmos. Chem. Phys. 2011, 11, 4039–4072. [Google Scholar] [CrossRef]
  31. Freitas, S.R.; Longo, K.M.; Alonso, M.F.; Pirre, M.; Marecal, V.; Grell, G.; Stockler, R.; Mello, R.F.; Sánchez Gácita, M. PREP-CHEM-SRC—1.0: A preprocessor of trace gas and aerosol emission fields for regional and global atmospheric chemistry models. Geosci. Model Dev. 2011, 4, 419–433. [Google Scholar] [CrossRef]
  32. Pereira, G.; Siqueira, R.; Rosário, N.E.; Longo, K.L.; Freitas, S.R.; Cardozo, F.S.; Kaiser, J.W.; Wooster, M.J. Assessment of fire emission inventories during the South American Biomass Burning Analysis (SAMBBA) experiment. Atmos. Chem. Phys. 2016, 16, 6961–6975. [Google Scholar] [CrossRef]
  33. Mataveli, G.A.V.; Silva, M.E.S.; França, D.d.A.; Brunsell, N.A.; de Oliveira, G.; Cardozo, F.d.S.; Bertani, G.; Pereira, G. Characterization and Trends of Fine Particulate Matter (PM2.5) Fire Emissions in the Brazilian Cerrado during 2002–2017. Remote Sens. 2019, 11, 2254. [Google Scholar] [CrossRef]
  34. Friedl, M.A.; Sulla-Menashe, D.; Tan, B.; Schneider, A.; Ramankutty, N.; Sibley, A.; Huang, X. MODIS Collection 5 global land cover: Algorithm refinements and characterization of new datasets. Remote Sens. Environ. 2010, 114, 168–182. [Google Scholar] [CrossRef]
  35. Souza, C.M.; Shimbo, J.Z.; Rosa, M.R.; Parente, L.L.; Alencar, A.A.; Rudorff, B.F.; Hasenack, H.; Matsumoto, M.; Ferreira, L.G.; Souza-Filho, P.W.; et al. Reconstructing Three Decades of Land Use and Land Cover Changes in Brazilian Biomes with Landsat Archive and Earth Engine. Remote Sens. 2020, 12, 2735. [Google Scholar] [CrossRef]
  36. Keywood, M.; Kanakidou, M.; Stohl, A.; Dentener, F.; Grassi, G.; Meyer, C.P.; Torseth, K.; Edwards, D.; Thompson, A.M.; Lohmann, U.; et al. Fire in the Air: Biomass Burning Impacts in a Changing Climate. Crit. Rev. Environ. Sci. Technol. 2011, 43, 40–83. [Google Scholar] [CrossRef]
  37. Prosperi, P.; Bloise, M.; Tubiello, F.N.; Conchedda, G.; Rossi, S.; Boschetti, L.; Salvatore, M.; Bernoux, M. New estimates of greenhouse gas emissions from biomass burning and peat fires using MODIS Collection 6 burned areas. Clim. Chang. 2020, 161, 415–432. [Google Scholar] [CrossRef]
  38. Yadav, I.C.; Linthoingambi Devi, N.; Li, J.; Syed, J.H.; Zhang, G.; Watanabe, H. Biomass burning in Indo-China peninsula and its impacts on regional air quality and global climate change-a review. Environ. Pollut. 2017, 227, 414–427. [Google Scholar] [CrossRef]
  39. Pivello, V.R. The Use of Fire in the Cerrado and Amazonian Rainforests of Brazil: Past and Present. Fire Ecol. 2011, 7, 24–39. [Google Scholar] [CrossRef]
  40. Schmidt, I.B.; Eloy, L. Fire regime in the Brazilian Savanna: Recent changes, policy and management. Flora 2020, 268, 151613. [Google Scholar] [CrossRef]
  41. National Institute for Space Research (INPE). Monitoring of the Brazilian Amazon Deforestation by Satellite. Available online: http://terrabrasilis.dpi.inpe.br/app/dashboard/deforestation/biomes/legal_amazon/rates (accessed on 27 February 2023).
  42. Mataveli, G.A.V.; de Oliveira, G.; Seixas, H.T.; Pereira, G.; Stark, S.C.; Gatti, L.V.; Basso, L.S.; Tejada, G.; Cassol, H.L.G.; Anderson, L.O.; et al. Relationship between Biomass Burning Emissions and Deforestation in Amazonia over the Last Two Decades. Forests 2021, 12, 1217. [Google Scholar] [CrossRef]
  43. Mataveli, G.A.V.; Pereira, G.; Chaves, M.E.D.; Cardozo, F.d.S.; Stark, S.C.; Shimabukuro, Y.E.; Aragão, L.E.O.C.; de Oliveira, G.; Chen, J.M. Deforestation and land use and land cover changes in protected areas of the Brazilian Cerrado: Impacts on the fire-driven emissions of fine particulate aerosols pollutants. Remote Sens. Lett. 2021, 12, 79–92. [Google Scholar] [CrossRef]
  44. MapBiomas Project. Collection 7.0 of the Annual Series of Land Use and Land Cover Maps of Brazil. Available online: http://brasil.mapbiomas.org/en/estatisticas?cama_set_language=en (accessed on 27 February 2023).
  45. Chaves, M.E.; Picoli, M.C.; Sanches, I.D. Recent Applications of Landsat 8/OLI and Sentinel-2/MSI for Land Use and Land Cover Mapping: A Systematic Review. Remote Sens. 2020, 12, 3062. [Google Scholar] [CrossRef]
  46. Talukdar, S.; Singha, P.; Mahato, S.; Shahfahad; Pal, S.; Liou, Y.-A.; Rahman, A. Land-Use Land-Cover Classification by Machine Learning Classifiers for Satellite Observations—A Review. Remote Sens. 2020, 12, 1135. [Google Scholar] [CrossRef]
  47. Guerrero, J.V.R.; Escobar-Silva, E.V.; Chaves, M.E.D.; Mataveli, G.A.V.; Bourscheidt, V.; de Oliveira, G.; Picoli, M.C.A.; Shimabukuro, Y.E.; Moschini, L.E. Assessing Land Use and Land Cover Changes in the Direct Influence Zone of the Braço Norte Hydropower Complex, Brazilian Amazonia. Forests 2020, 11, 988. [Google Scholar] [CrossRef]
  48. Silveira, M.V.F.; Silva-Junior, C.H.L.; Anderson, L.O.; Aragão, L.E.O.C. Amazon fires in the 21st century: The year of 2020 in evidence. Glob. Ecol. Biogeogr. 2022, 31, 2026–2040. [Google Scholar] [CrossRef]
  49. Fawcett, D.; Sitch, S.; Ciais, P.; Wigneron, J.P.; Silva-Junior, C.H.L.; Heinrich, V.; Vancutsem, C.; Achard, F.; Bastos, A.; Yang, H.; et al. Declining Amazon biomass due to deforestation and subsequent degradation losses exceeding gains. Glob. Chang. Biol. 2023, 29, 1106–1118. [Google Scholar] [CrossRef] [PubMed]
  50. Rodrigues, A.A.; Macedo, M.N.; Silverio, D.V.; Maracahipes, L.; Coe, M.T.; Brando, P.M.; Shimbo, J.Z.; Rajao, R.; Soares-Filho, B.; Bustamante, M.M.C. Cerrado deforestation threatens regional climate and water availability for agriculture and ecosystems. Glob. Chang. Biol. 2022, 28, 6807–6822. [Google Scholar] [CrossRef] [PubMed]
  51. Schüler, J.; Bustamante, M.M.C. Spatial planning for restoration in Cerrado: Balancing the trade-offs between conservation and agriculture. J. Appl. Ecol. 2022, 59, 2616–2626. [Google Scholar] [CrossRef]
  52. Silva, T.R.; Rodrigues, S.B.; Bringel, J.B.A.; Sampaio, A.B.; Sano, E.E.; Vieira, D.L.M. Factors affecting savanna and forest regeneration in pastures across the cerrado. J. Environ. Manag. 2023, 330, 117185. [Google Scholar] [CrossRef]
  53. Breiman, L. Random Forests. Mach. Learn. 2001, 45, 5–32. [Google Scholar] [CrossRef]
  54. MapBiomas Project. MapBiomas-Accuracy Assessment of Collection 6.0 Cover & Use Maps. Available online: http://mapbiomas.org/en/accuracy-statistics?cama_set_language=en (accessed on 3 March 2023).
  55. Giglio, L.; Schroeder, W.; Justice, C.O. The collection 6 MODIS active fire detection algorithm and fire products. Remote Sens. Environ. 2016, 178, 31–41. [Google Scholar] [CrossRef]
  56. De Oliveira, G.; Chen, J.M.; Mataveli, G.A.V.; Chaves, M.E.D.; Seixas, H.T.; Cardozo, F.d.S.; Shimabukuro, Y.E.; He, L.; Stark, S.C.; dos Santos, C.A.C. Rapid Recent Deforestation Incursion in a Vulnerable Indigenous Land in the Brazilian Amazon and Fire-Driven Emissions of Fine Particulate Aerosol Pollutants. Forests 2020, 11, 829. [Google Scholar] [CrossRef]
  57. Santos, P.R.; Pereira, G.; Cardozo, F.d.S.; Mataveli, G.A.V.; Moraes, E.C. Desenvolvimento e implementação do ciclo diurno da queima de biomassa no PREP-CHEM-SRC. Rev. Dep. Geogr. 2021, 41, e174236. [Google Scholar] [CrossRef]
  58. Hänggli, A.; Levy, S.A.; Armenteras, D.; Bovolo, C.I.; Brandão, J.; Rueda, X.; Garrett, R.D. A systematic comparison of deforestation drivers and policy effectiveness across the Amazon biome. Environ. Res. Lett. 2023, 18, 073001. [Google Scholar] [CrossRef]
  59. Silva-Junior, C.H.L.; Buna, A.T.M.; Bezerra, D.S.; Costa, O.S.; Santos, A.L.; Basson, L.O.D.; Santos, A.L.S.; Alvarado, S.T.; Almeida, C.T.; Freire, A.T.G.; et al. Forest Fragmentation and Fires in the Eastern Brazilian Amazon–Maranhão State, Brazil. Fire 2022, 5, 77. [Google Scholar] [CrossRef]
Figure 1. Location of the Amazon and Cerrado biomes in South America. The base map is a MODIS sensor product MOD09A1 colour composite R6G2B1 for the year 2019.
Fire 06 00426 g001
Figure 2. Land use and land cover (LULC) in the Amazon and Cerrado biomes for the year 2013 considering the old ((a)—MCD12Q1 collection 5.1) and new ((b)—MapBiomas collection 6.0) LULC information implemented on PREP-CHEM-SRC. The MapBiomas original LULC classes were reclassified to match the IGBP classification scheme.
Fire 06 00426 g002
Figure 3. Number of years when the land use and land cover (LULC), defined, in the Amazon and Cerrado biomes, by the old (MCD12Q1 collection 5.1) and new (MapBiomas collection 6.0) LULC information implemented on PREP-CHEM-SRC, was unmatched during the 2002–2020 period.
Fire 06 00426 g003
Figure 4. Annually emitted PM2.5 associated with biomass burning in the Amazon and Cerrado biomes between 2002 and 2020 considering the new (MapBiomas collection 6.0) LULC information implemented on PREP-CHEM-SRC 1.8.3 (a), and difference in the annual emissions when comparing the estimates obtained with the new and old (MCD12Q1 collection 5.1) LULC information (b).
Fire 06 00426 g004
Figure 5. Difference in the total PM2.5 emitted from biomass burning (Gg) in the Amazon and Cerrado biomes during the 2002–2020 time series when comparing the estimates obtained with the new (MapBiomas collection 6.0) and old (MCD12Q1 collection 5.1) LULC information. The forest-related class comprises the evergreen needleleaf forest, evergreen broadleaf forest, deciduous needleleaf forest, deciduous broadleaf forest, mixed forest, and the cropland/natural vegetation mosaic LULC classes. The savanna-related class comprises the closed shrubland, open shrubland, woody savanna, savanna, and grassland LULC classes. The croplands class is represented by the cropland LULC class. The other class comprises the permanent wetlands LULC class.
Fire 06 00426 g005
Figure 6. Annual average of PM2.5 (kg m−2 year−1) emitted from biomass burning in the Amazon and Cerrado biomes during 2002–2020; estimates were obtained using the new land use and land cover information implemented on PREP-CHEM-SRC 1.8.3. Emissions were estimated at the spatial resolution of 0.1°.
Fire 06 00426 g006
Figure 7. Number of years when the estimate of PM2.5 associated with biomass burning, in the Amazon and Cerrado biomes, based on old (MCD12Q1 collection 5.1) and new (MapBiomas collection 6.0) land use and land cover information implemented on PREP-CHEM-SRC, was unmatched during the 2002–2020 period.
Fire 06 00426 g007
Table 1. Reclassification of the original LULC classes from MapBiomas collection 6.0 level 3 to the International Geosphere-Biosphere Programme (IGBP) classification scheme, and fine particulate matter (PM2.5) emission factors associated with each LULC.
MapBiomas LULCIGBP LULC ClassPM2.5 Emission Factor
(g kg−1)
Forest FormationEvergreen Broadleaf Forests9.4
Savanna FormationSavannas4.0
MangrovePermanent Wetlands4.0
Forest PlantationMixed Forests15.7
WetlandPermanent Wetlands4.0
Grassland Grasslands4.0
Other Non-Forest FormationsPermanent Wetlands4.0
PastureGrasslands4.0
SugarcaneCroplands4.0
Mosaic of Agriculture and PastureCropland/Natural Vegetation Mosaics4.0
Beach, Dune and Sand SpotBarren-
Urban AreaUrban and Built-up Lands-
Other Non-Vegetated AreasBarren-
Rocky OutcropBarren-
MiningBarren-
AquacultureWater Bodies-
Salt FlatBarren-
River, Lake, and OceanWater Bodies-
SoybeanCroplands4.0
RiceCroplands4.0
Other Temporary CropsCroplands4.0
CoffeeCroplands4.0
CitrusCroplands4.0
Other Perennial CropsCroplands4.0
Wooded RestingaClosed Shrublands4.0
Disclaimer/Publisher’s Note: The statements, opinions and data contained in all publications are solely those of the individual author(s) and contributor(s) and not of MDPI and/or the editor(s). MDPI and/or the editor(s) disclaim responsibility for any injury to people or property resulting from any ideas, methods, instructions or products referred to in the content.

