1. Introduction
Hydrogen fuel cell vehicle (HFCV) technology may provide an excellent decarbonisation solution for the transport sector, particularly heavy-duty vehicles. The growth of hydrogens’ popularity and support is now evident through the emergence of the global hydrogen community [
1], and the demand for effective safety analysis and risk assessment of HFCVs is ever-growing and essential for appropriate public integration.
Analysis of accidental scenarios involving hydrogen is essential since hydrogen’s characteristics and properties vary from traditional fuels [
2]. Primarily, the buoyancy of hydrogen is a point of interest for the safety of the fuel, having a low density of 0.0838 kg/m
3 at normal temperature and pressure (NTP), approximately 14 times lighter than air density at 1.205 kg/m
3 presents both safety benefits and dangers related to the fuel. High buoyancy within open systems accommodates rapid dispersion and diffusion of hydrogen, in turn reducing concentrations to a safe level below the lower flammability limit (LFL) effectively [
1,
2,
3,
4,
5]. However, within confined and semi-confined spaces such as tunnels, it poses a hazard of accumulation and/or ignition of such entrapped gas, which may present severe consequences such as flash fire or explosion. Additionally, hydrogen is highly flammable, with a wide flammability limit in air of 4 to 75% and low ignition energy of 0.02 mJ [
2,
6,
7], presenting a requirement of building upon a database for the risk assessment of HFCV accidents, especially within tunnels when the buoyancy effect is not favourable. Hydrogen has no threshold limit value (TLV) and is not carcinogenic. However, being odourless, colourless, and tasteless, its detection through human sensory methods is extremely difficult and, in turn, raises issues when leakage occurs in confined spaces where high concentrations may accumulate undetected [
5,
7]. Hydrogen also burns with a colourless flame [
2].
Gas release from either the pressure relief device or a small pinhole rupture may result in a highly transient jet fire if ignited, which is the focus of this study. These jet flames generated from the HFCV have the potential to be very long in flame length and have very high flame temperatures [
5,
8]. In terms of compressed gas vehicles, jet fires are presented as the most common fire risk, either from tank rupture or thermal pressure relief device (TPRD) ignition. Within a confined space such as a tunnel, a hydrogen jet fire poses added risk to assets and personnel involved through exposure to high-temperature flame. Hydrogen combustion also consumes a large amount of oxygen which also presents the risk of oxygen deficiency. In addition, hydrogen jet fires have a higher potential to cause burns to the human body, which is a serious determinant of the safety aspect of HFCV application [
3,
6,
9,
10].
Many studies have used computational fluid dynamics (CFD) simulations to understand the impact of hydrogen jet flame hazards within tunnels for different scenarios [
6,
11,
12,
13]. Gu et al. [
6] adopted a large-scale CFD model to explore the effects of possible varied tunnel/situational characteristics of the location and the rate of the leakage, tunnel cross-sectional area, and longitudinal and transverse ventilation on both diffusion of the leaked hydrogen and the temperature distribution of the jet fire incident. Seike et al. [
14] focused on the impact of tunnel slope on the propagation of heat and gases and found that hydrogen propagated much faster than traditional gasoline fires with a slope having a direct effect on distribution. A further study was recommended for the variation of ventilations to slope to determine a critical relationship between slope and ventilation magnitude and direction. Shibani et al. [
15] captured the effects of multiple hydrogen fires within a large-scale tunnel where the effects of position and longitudinal ventilation were placed under scope, finding that increased slope raised the severity of temperature zones at the tunnel exits.
Concerning structural damages, Sandia [
16] performed a risk analysis to determine what scenarios were likely to occur in the event of an accident involving HFCVs, providing a comprehensive analysis of the jet fires and possible hazards to the infrastructure and materials of the tunnel in which it was determined with ventilation, localised concrete spalling is unlikely. The temperature distribution of hydrogen jet fire was determined using CFD with results detailing effects on the structural integrity of the tunnel and/or the structural epoxy even when ventilation was deactivated [
16]. Damages are likely to be caused by overpressure in explosion scenarios [
5,
16,
17,
18], whereas jet fires present less of a significant risk compared to an explosion.
Combined CFD with probabilistic methods have been adopted in previous studies to develop a quantitative risk analysis (QRA) for traditional buoyant systems and infrastructure [
19] and can be used as a guide in developing hydrogen safety guidelines. A key challenge to conducting a reliable QRA for hydrogen is the lack of data behind gaseous hydrogen incidents. Moradi et al. [
9] outlined a generalised summary of data needed to perform a QRA on hydrogen systems effectively. Notably, jet flame risk assessment and data are mentioned affirming the need for the development of large-scale experimental data for the advancement and validation of such models [
9]. Additionally, the gaseous hydrogen effects of jet fires on humans are emphasised with thermal effects, oxygen deficit, and overpressure. Upon a review of studies of hydrogen accidents’ impact on human life, it is evident that research behind this field is limited.
Building upon this, studies were conducted on hydrogen properties and hydrogen comparative risk to traditional fuels such as methane and LPG [
2,
3,
7,
20]. Some studies focused on the safety distance of hydrogen fire within tunnels which have been evident in terms of diffusion and temperature distribution [
6,
13,
14,
15]. However, the effects and risk analysis of such fires on personnel within the scenario are limited. It is concluded that hydrogen as a fuel poses a greater risk, primarily due to the increased probability of fire and explosion based on its characteristics of a wide flammability range and low ignition energy. The general requirement for risk associated with HFCV implementation should be equal to, or less than the risk of conventional fuelled [
1]. Considering the risk of hydrogen application to transport at present, it is understandable that this requirement has not yet been achieved as identified knowledge gaps are yet to be filled [
9,
21].
Despite previous studies, there is a lack of risk analysis for important tunnel characteristics of slope and ventilation in both transverse and longitudinal directions, with detailed study of this likely “real world” scenario of a combination of these parameters being minimal. Whilst correlation may be based upon buoyant conventional fuel scenarios [
22,
23], it is evident that hydrogen as fuel needs examination in these scenarios not only due to its characteristics and properties but also in determining hydrogen diffusion, temperature distribution, and oxygen consumption of the possible outcomes of hydrogen jet fire and their effects on human life which can help to develop a comprehensive risk assessment. Hence, this study aims to analyse a relationship between tunnel ventilation techniques and the tunnel slope and further enhance the understanding of the risk associated with hydrogen jet fire in confined and semi-confined environments. For this purpose, a combined CFD-probabilistic method is adopted. Results obtained in this paper are extendable and can be used in correlation to further studies, such as overpressure, to capture more details of the risk behind HFCVs. The outcome of this study would be beneficial for the development of safety guidelines for HFCV in tunnels.
2. Problem Statement
Figure 1 shows a 3D tunnel dimensioned 5 m × 5 m × 102 m considered in this study. A 0.5 m × 0.5 m × 5 m solid inert rectangular object is centred in the middle of the tunnel cross-section with the 0.25 m
2 burner surface on the end, facing downstream towards the tunnel exit, positioned at 40 m, similar to Gu et al. [
6].
The effects of tunnel slope, fire position, and ventilation (both longitudinal and transverse) are deemed critical parameters to develop a comprehensive understanding of the dangers presented by an HFCV, gaseous hydrogen jet fire, in an accidental scenario. A summary of all parameters for different scenarios is given in
Table 1. For simplicity in the discussion, reference codes are assigned to each simulation with letters indicating testing parameters followed by the respective magnitude as follows: PO (Position), L (Longitudinal ventilation), T (Transverse ventilation), and S (Slope).
The 40 MW power is assumed to capture a severe scenario of a jet fire, which is consistent with the magnitude of HFCV fires in which an HRR is produced somewhere around 4 MW to 43 MW, depending on the mass flow rate, storage capacity and environmental conditions [
5,
23,
24]. The mass flow rate registered for the 40 MW hydrogen fires is 0.282 kg/s [
15]. Burner positioning of 25 m and 15 m from the tunnel entrance are deemed suitable in comparison to the 40 m as altered air supply/cooling by position would be expected to affect the results. Ventilation values were chosen to provide enough variation for confirmation of the existence of a critical velocity and the effects of variation in longitudinal and transverse ventilation on the severity of the scenario. All transverse ventilation studies are in conjunction with longitudinal ventilation to represent realistic scenarios. Referenced literature review values of slope in correlation to tunnel slope regulations are used to predict the suitable chosen values [
23,
25].
The simulations are run for a total time of 45 s, and results were recorded accordingly. It was found the results reach a quasi steady-state at about 15–20 s, and it remains in that state for the rest of the simulation (
t = 45 s), which is consistent with the studies conducted previously [
13,
14,
15]. Hence, the results over the quasi steady-state period are employed for the risk analysis where the expected temperature field of the entire tunnel was achieved, imposing the possible highest risk in the domain.
4. Results and Discussion
First, a parametric study is comprehensively conducted to identify the impacts of significant parameters in the tunnel, analysed by computational results, including the tunnel temperature and velocity contours at 45 s. Then, the probabilistic study provides a direct indication of personnel safety within the accidental scenario in which an understanding of HFCV tunnel fire severity is gathered.
4.1. LES Results
The ability of the tunnel system under test to eject accumulated heat can be seen by the effects of back-layering within the scenario and fluctuation of heat height along the tunnel [
15]. Back-layering provides a good indication of entrapped heat within the system, and therefore less back-layering shows evidence of an effective means of ejecting heat. Less fluctuation of heat height is essential as it ensures less heat enters the height/domain where personnel reside. Hence, the back-layering effects are discussed in detail using the LES results to shed some light on the phenomena as the influencing parameters vary.
4.1.1. Effects of Tunnel Slope
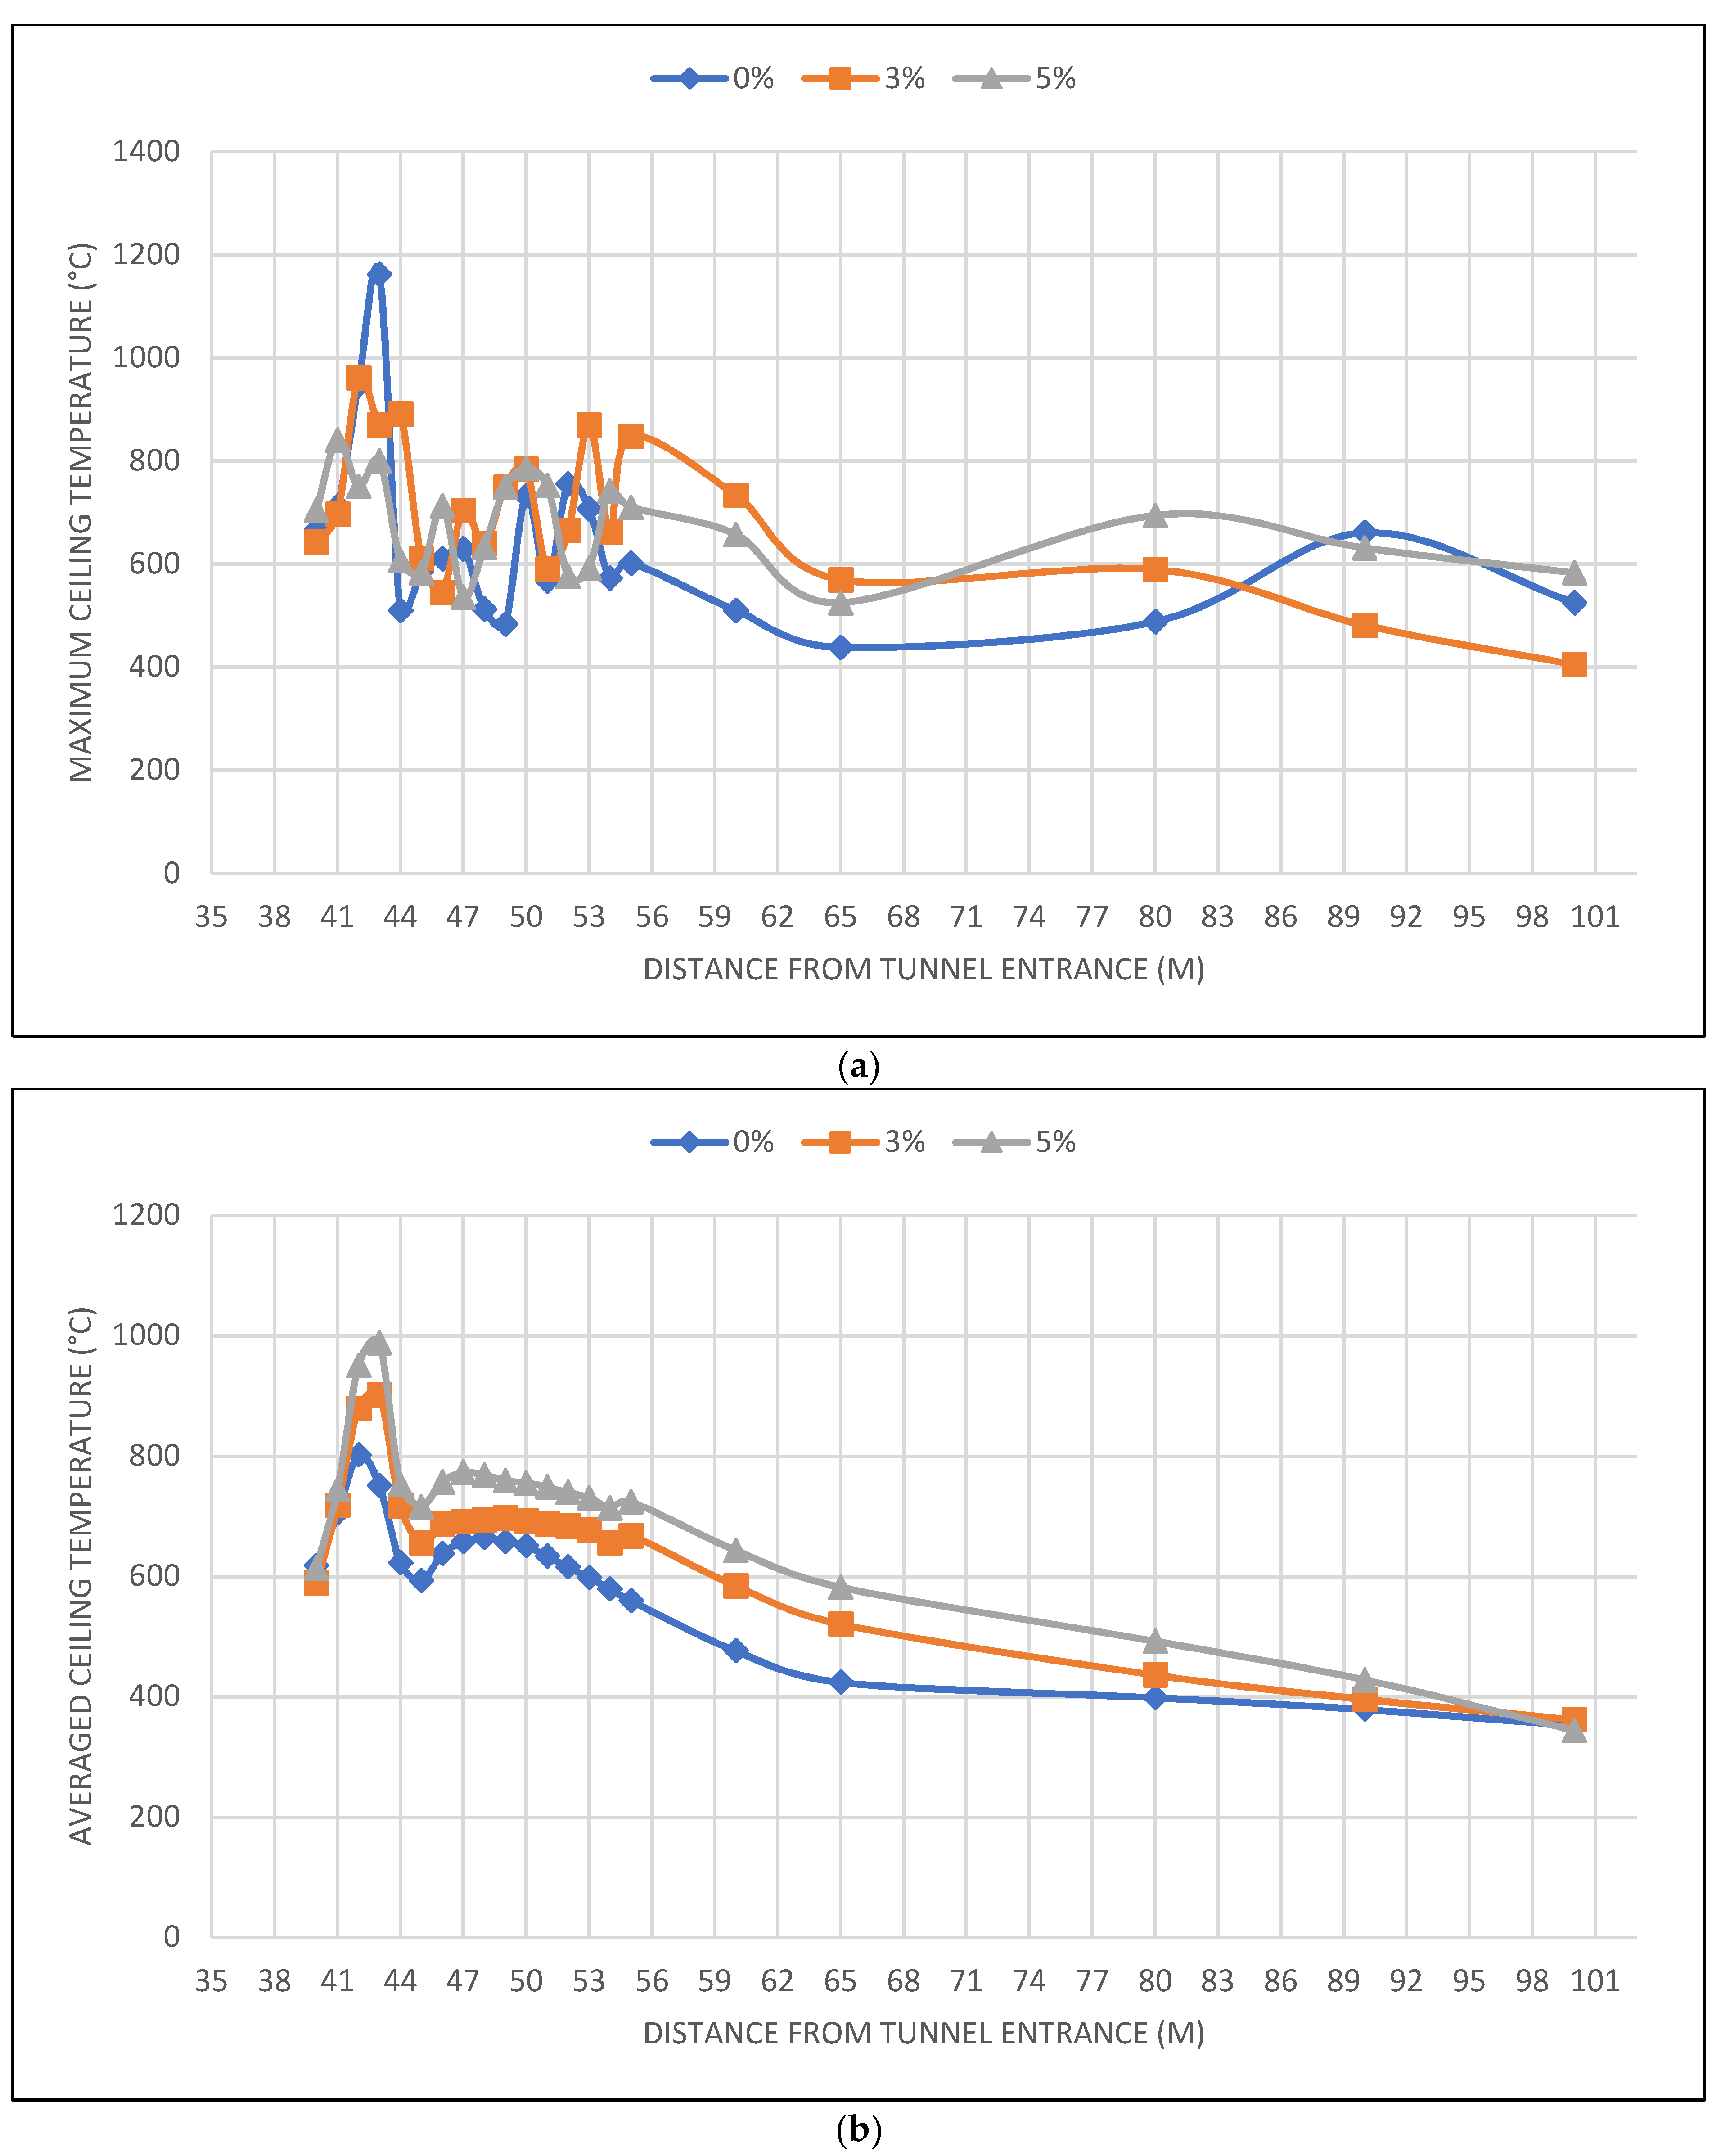
The evolutionary trend of the maximum temperature over the duration of 45 s is taken along the ceiling of the tunnel. As seen in
Figure 6a, an increase in slope results in a decrease in the maximum ceiling temperature. Since the heated gas travels a further distance before the incident with the ceiling, a greater amount of cooling time and distance can be seen in agreement with similar studies of LPG [
23]. With considerable differences of 100–200 °C per slope variation, it is a significant characteristic when reviewing tunnel fire safety as temperatures can reach well above damaging and danger thresholds for assets (structural and vehicular) and personnel. Li et al. [
25] showed that the tunnel slope should not exceed 5% in the traffic when the design vehicle speed is over 50 km/h since the flame tilt angle varies with the tunnel slope affecting the maximum ceiling temperature and steady-state gas temperature [
23]. Shibani et al. [
15] found that an increase in the tunnel slope intensifies the fire severity in high-temperature zones.
The effect of the tunnel slope on back-layering is further discussed by the average temperatures. The back-layering causes heat entrapment and an increase in average temperatures within a specific ceiling location. An average of ceiling temperatures over 45 s effectively captures the accumulations of heat and back-layering and slope effectiveness at mitigating heat shown in
Figure 6b. The average temperatures over the simulation time demonstrate an increase in temperature just behind the nozzle. This is understandable as the slope prevents back-layering from occurring and in turn an accumulation of higher heat just before the nozzle.
Figure 7 shows the temperature and velocity fields at 45 s in the tunnels. The tunnel ceiling is maintained at a lower temperature as the cooler gases are constantly replaced with the heated gases. Interestingly, higher temperatures can be seen downstream of the fire, which may attribute due to the higher velocity and less cooling time of heated gases caused by the slope. When the velocity of ventilation is low, it allows hot gas generated by fire to move back upstream in the opposite of the ventilation direction, known as back-layering [
32]. Back-layering demonstrates inefficiencies in the removal of heat from a tunnel and, in turn, may lead to a greater risk of property damage or personnel injury. The temperature fields show that higher temperatures can be seen downstream of the fire as the slope increases, which may attribute due to the higher velocity and less cooling time of heated gases caused by the slope. A closer look indicates that the tunnel slope has a direct effect on the temperature distribution and ejection of heat within a gaseous hydrogen tunnel jet fire scenario. Increasing the tunnel slope from 1 to 3% results in a reduction of 7.4 m in back-layering, while further increase reduces it to 8.2 m (marked by solid vertical lines in
Figure 7). In addition, an increase in the tunnel slope mitigates the effect of the circulation of heated air/gas upstream of the flow.
4.1.2. Effects of Fire Source Location
The critical velocity is termed by the minimum longitudinal ventilation required to overcome back-layering and remove hot gases from the opposite of the ventilation direction [
33].
Figure 8 presents the effects of the fire position from the entrance on the heated gas accumulation in a tunnel for three cases, 15 m, 25 m, and 40 m, in which an increase in back-layering occurs when the fire location is closer to the entrance. As can be seen in the velocity and temperature contours, the longitudinal ventilation at the inlet is higher than the critical flow of the back-layering gases resulting in a thicker accumulation of heat. Additional testing of this parameter is suggested as domain sensitivity may also have a role to play with the interesting result of back-layering for fire positions 15 m and 25 m ending at approximately the same point.
4.1.3. Effects of Longitudinal and Transverse Ventilation
In addition to the ventilation essential for normal operation in tunnels, emergency ventilation is critical to reducing the risk of heat and smoke in the case of a fire [
14,
22]. We first study the impact of longitudinal ventilation velocity. While the longitudinal ventilation velocity varies, the transverse ventilation velocity is zero (Cases 2, 5 and 6 in
Table 1).
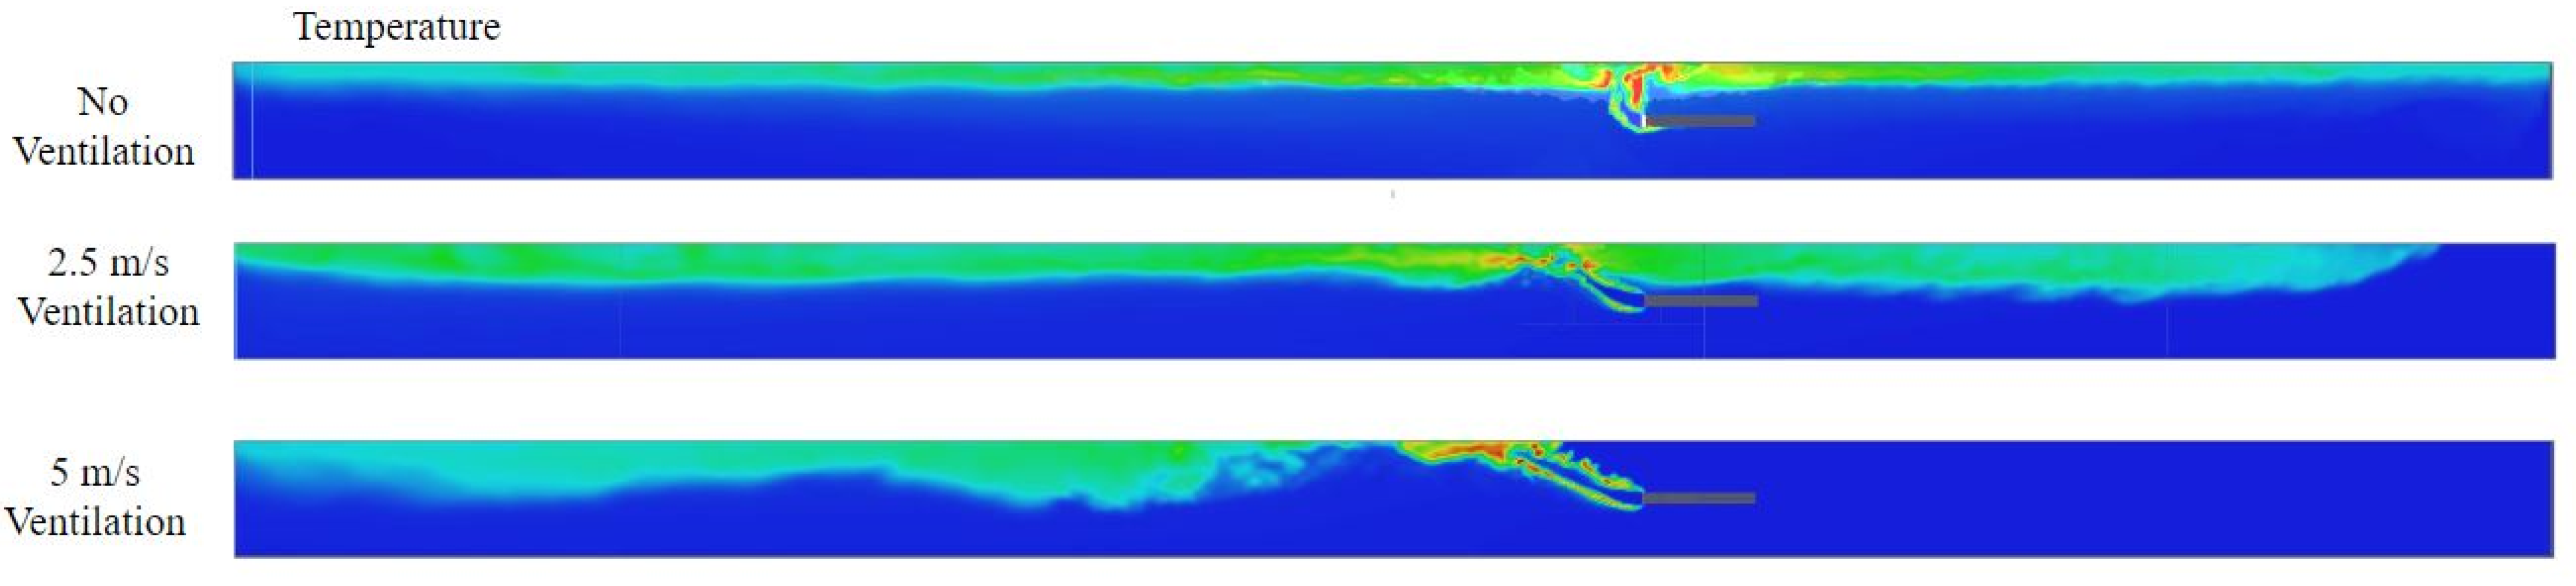
Figure 9 shows that an increase in longitudinal ventilation results in a larger flow of cool air into the system, displacing heated gas/air. A longitudinal airflow of 5 m/s is well above the critical velocity and, as a result, minimises the back-layering effect to nil. Notably, a comparison of no ventilation to 2.5 m/s longitudinal ventilation indicates a thicker back-layer which may result in more danger upstream of the fire. With an overall fluctuation downstream being increased with the larger longitudinal flows, results suggest longitudinal ventilation alone may increase possible danger downstream of the flow which is further analysed in the probabilistic study.
Further analysis is conducted on the effect of tunnel transverse ventilation (Cases 2, 10, and 11 in
Table 1).
Figure 10 shows that the effect of transverse ventilation has a significant impact on the back-layering of the heated gas/air with all cases longitudinal ventilation at 2.5 m/s. In addition, combined longitudinal and transverse ventilation increases the stability of heat flow in both upstream and downstream directions within the tunnel. A possible reason for this result is that the ventilation provides enough upwards pressure to minimise the downward fluctuation of the turbulent heat flows. However, it is evident that the resulting back-layering due to rising transverse ventilation from zero to 2.5 m/s is much thicker and, as a result, resides lower, encapsulating a higher heat concentration with the addition of transverse ventilation, which may contribute to a higher risk behind the burner.
We also analysed the impact of combining the transverse ventilation and the tunnel slope at the constant longitudinal ventilation of 2.5 m/s on the back-layering. In
Figure 11, the resultant temperature contours suggest an effective combination of tunnel characteristic variables to mitigate the back-layering effect and heat of a gaseous hydrogen fire within the tunnel. It can be also noted that the heat profile is maintained at a closer range to the roof which results in a lower risk of burns further down the tunnel. This is an important consideration as it can minimise the exposure to radiation and thermal energy for personnel escaping the incident. Therefore, a combination of longitudinal and transverse ventilation with an increased slope poses a very effective way to mitigate the heat produced by the fire in the tunnel at a fast but also stable rate, resulting in possibly the safest solution when dealing with HFCV tunnel fire scenarios.
It can be seen that this combination is effective at minimising the thickness of the back-layering whilst also ensuring safe flows downstream. Comparing flows with the presented back-layering determines with a slope of greater than 3% a back-layering reduction can be achieved in a safer manner than that of flows with higher transverse ventilation alone. Further, it supports that slope is one of the primary design parameters essential when tunnel design and ventilation techniques are placed under consideration.
4.2. Burn Probability Analysis
The probabilistic calculation is then performed. The stability of these Probit functions requires to be analysed with a discovery of a distance from the burner surface of 50–60 m testing being a limit through gathered results which may be attributed to the open outlet boundary causing such instabilities combined with the equations limits. Using an average of trends of the simulation data, the required input values are determined for each measurement, and a formulation of incidental probabilities of 1st, 2nd, and 3rd-degree burns are then developed.
Following probability calculation, it is found that the 40 MW fire chosen presented a very high risk with a probability of 1st-degree burn being at 100% over the duration of tunnel distance. In turn, for simplicity of the result digestibility, the probabilities of second-degree and third-degree scenarios are represented as P2 and P3. It is worth noting that these are the probabilities of injury within the event and not the combined total probabilities considered later. These probabilities are considered as they provide a good representation of the effects of the tunnel and environment variables on the severity of the outcome of an HFCV tunnel fire scenario.
As shown in
Figure 12, the slope has a significant effect on the probability of a severe outcome which is in agreement with the temperature contours shown in
Figure 7. It is concluded that the slope significantly mitigates the probabilistic injury risk through heated gas cooling travelling greater distances from the incident. It can also reduce the overall radiation experience by personnel from the heated gasses travelling along the roof. Moreover, these heated gases move with a higher velocity along the ceiling being less impeded resulting in less ambient heating and promoting more airflow (of cooler air). These results are in agreement with expectations and therefore provide conclusive evidence that slope affects the tunnel safety of an accidental HFCV jet fire scenario. For the purpose of more meaningful graphical measurement and representation, all figures in this section are shown from 50 m as all recorded data points are relatively the same between zero and 55 m.
Figure 13 compares three fire positions of 15, 25, and 40 m with the probabilities of second-degree and third-degree scenarios. Close distances to the entrance (airflow inlet) may promote safer conditions as shown by comparing the probability of the second and third burn for Case 3 (P2—15m and P3—15m) to their relative probabilities at different burner positions. It can be seen that a very close distance to the tunnel entrance reduces the probability of the third burn degree by the comparison of 25 m and 40 m cases (P3—25 m and P3—40 m), in which the probability of injury is relatively unchanged understandably as the cooling effects on inlet flows are reduced and affected by back-layering.
The LES results showed that longitudinal ventilation less than the critical velocity has negative effects on the safety scenario due to the back-layering and the accumulation of heat within the system [
13,
32]. Despite this,
Figure 14a shows that high flow velocities may result in increasing the risk of burn injury downstream, by contributing to unsteady flow and causing heat to enter lower parts of the domain where personnel reside. High levels of longitudinal ventilation also promote greater mixing, assisting with combustion and as a result increasing danger. As shown in
Figure 14b, transverse ventilation has a critical velocity that needs to be considered in relation to longitudinal ventilation values to quite understand fire safety in combined longitudinal and transverse ventilated tunnel systems. Additionally, fluctuations downstream at 80 m suggest that transverse ventilation can affect stable heat emission from the tunnel.
Further analysis is conducted for the combined effects as the LES results confirmed the dependency of tunnel parameters on the probability of burns. At the slope of 0 and 3%, the effect of combined ventilation is minimal with the maximum differences in the probability of approximately 1% when compared to the slope alone as seen in
Figure 14b (T1) and
Figure 15a. However,
Figure 15b shows that the slope of 5% with combined ventilation may have a negative impact increasing dangers by up to approximately 15%. For all cases, the longitudinal ventilation is set to 2.5 m/s.
Combining the effects of the slope with both ventilation techniques of longitudinal and transverse ventilation shows promising in terms of the removal of heat. However, an effective solution to tunnel fire safety and removing heat in a safe manner must be ensured. Further research is recommended as results present a strong suggestion that critical combinations of these variables in magnitude and direction may present a further enhancement of tunnel fire safety.
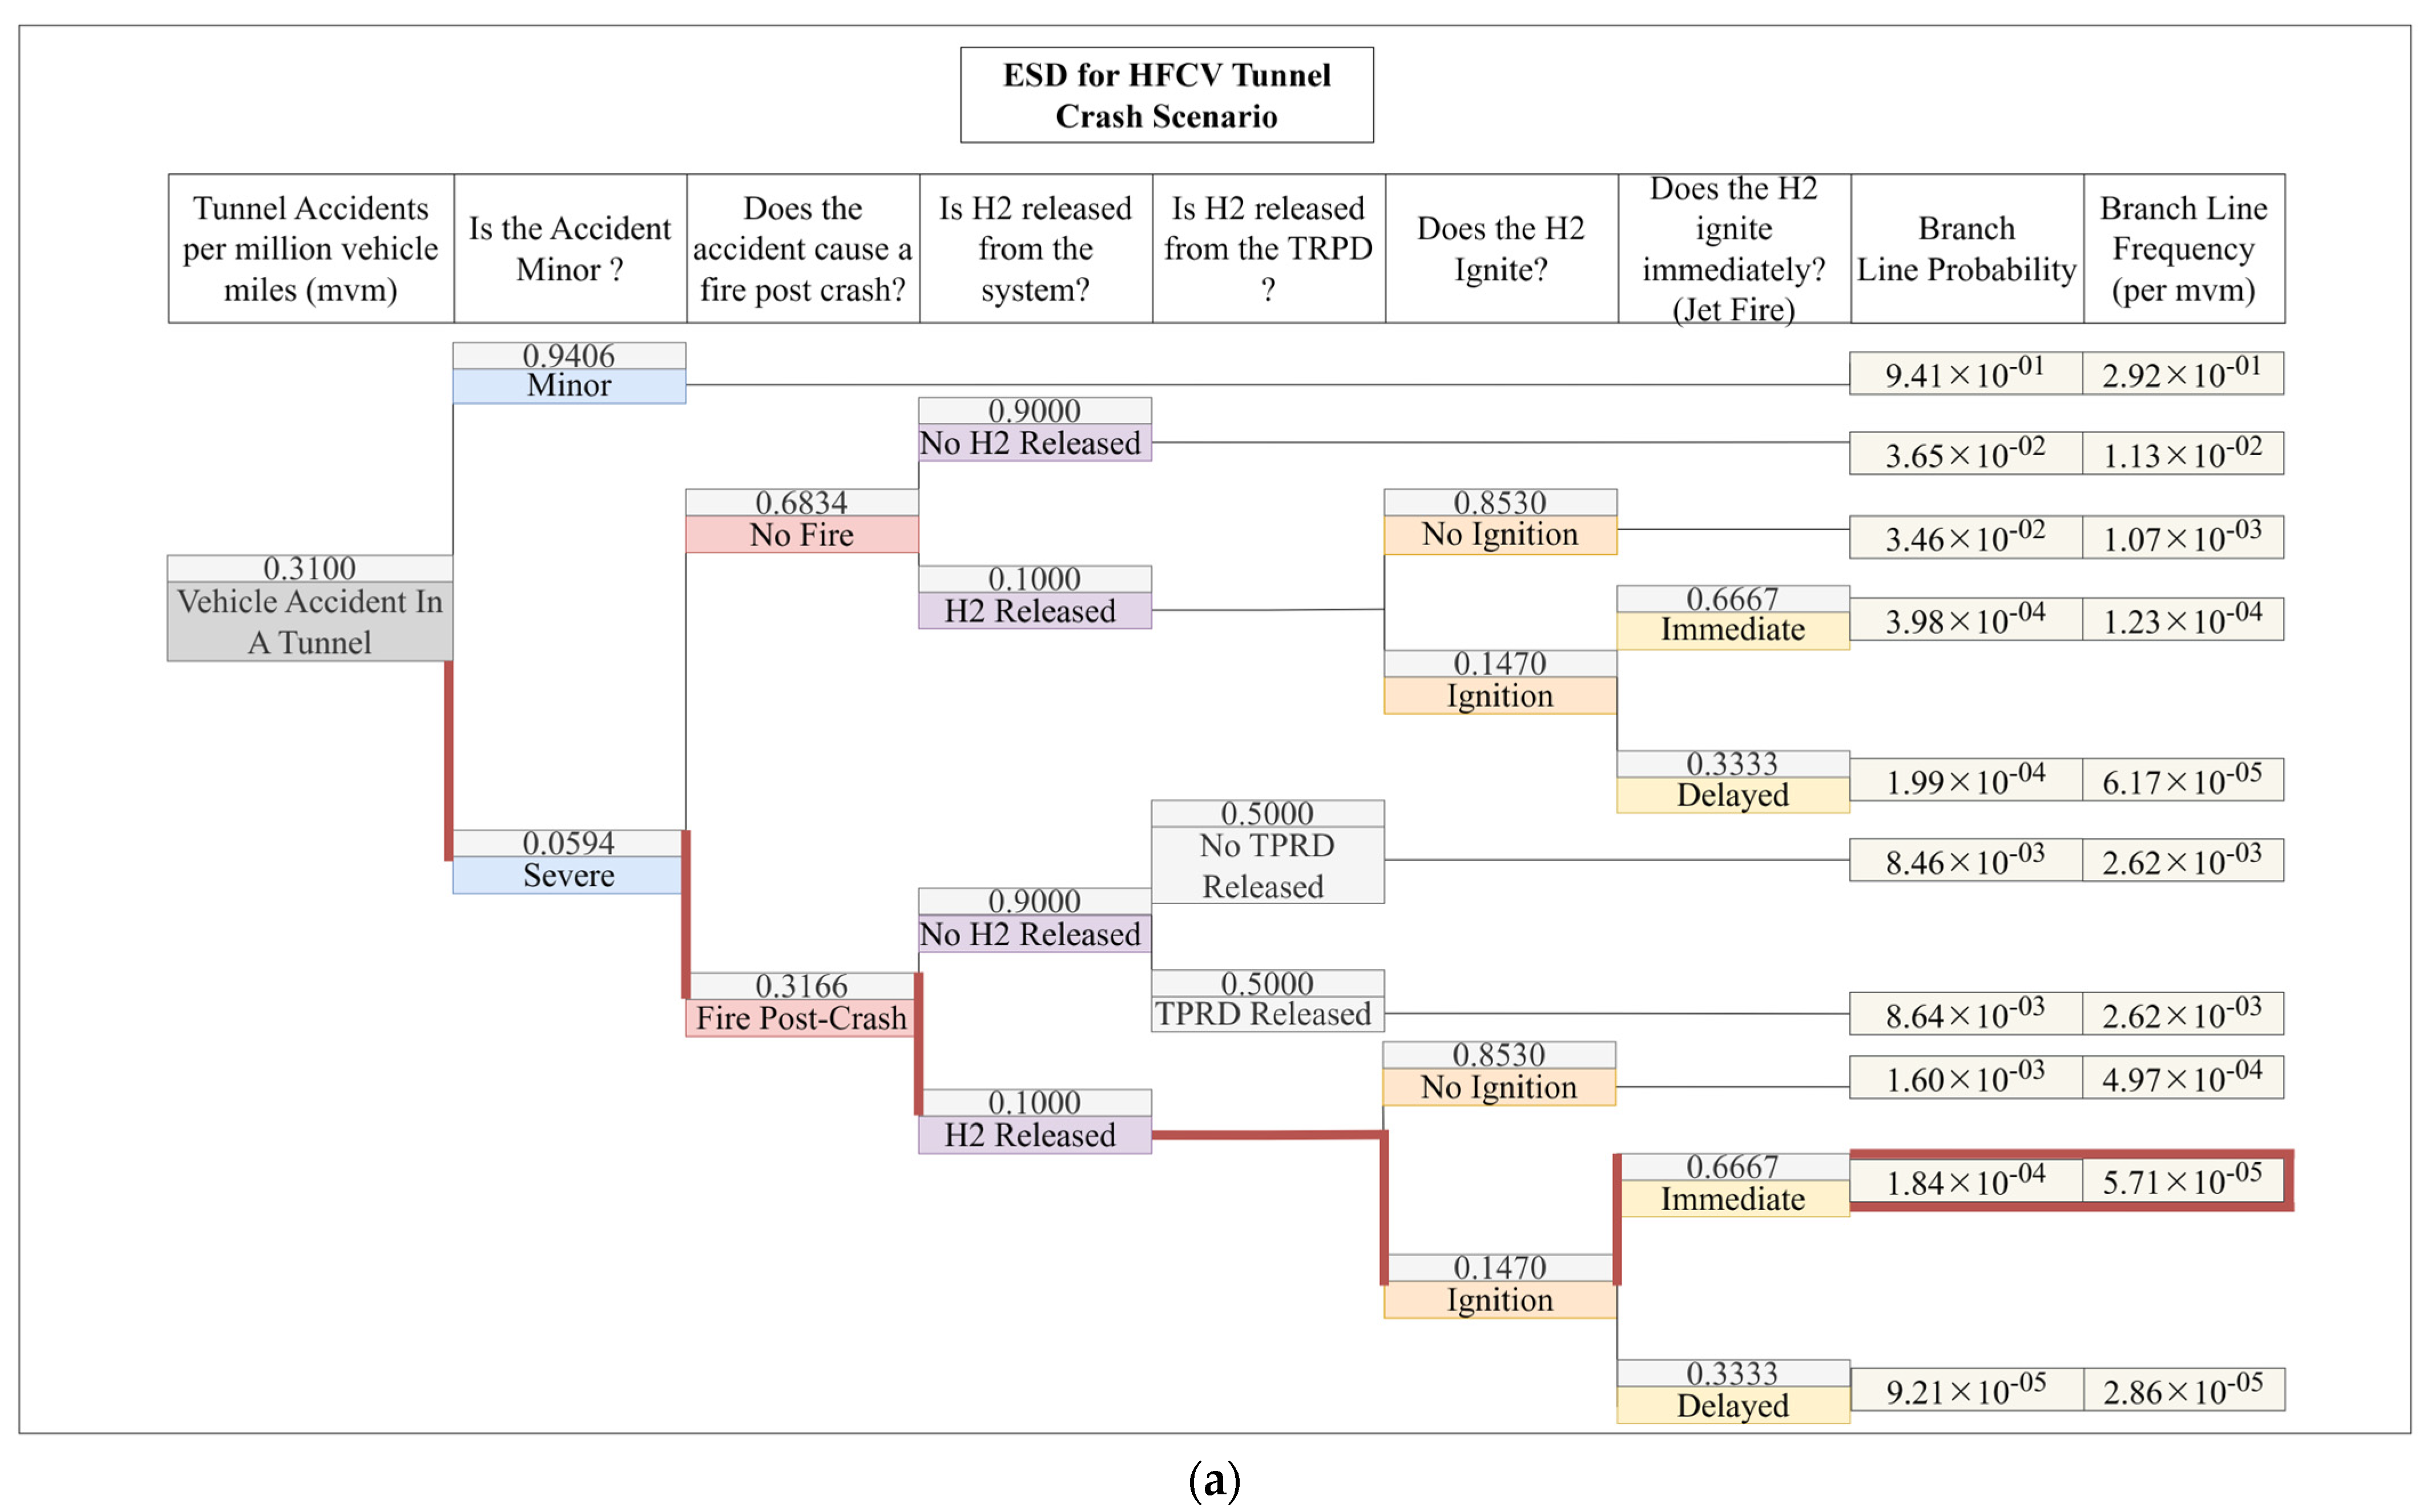
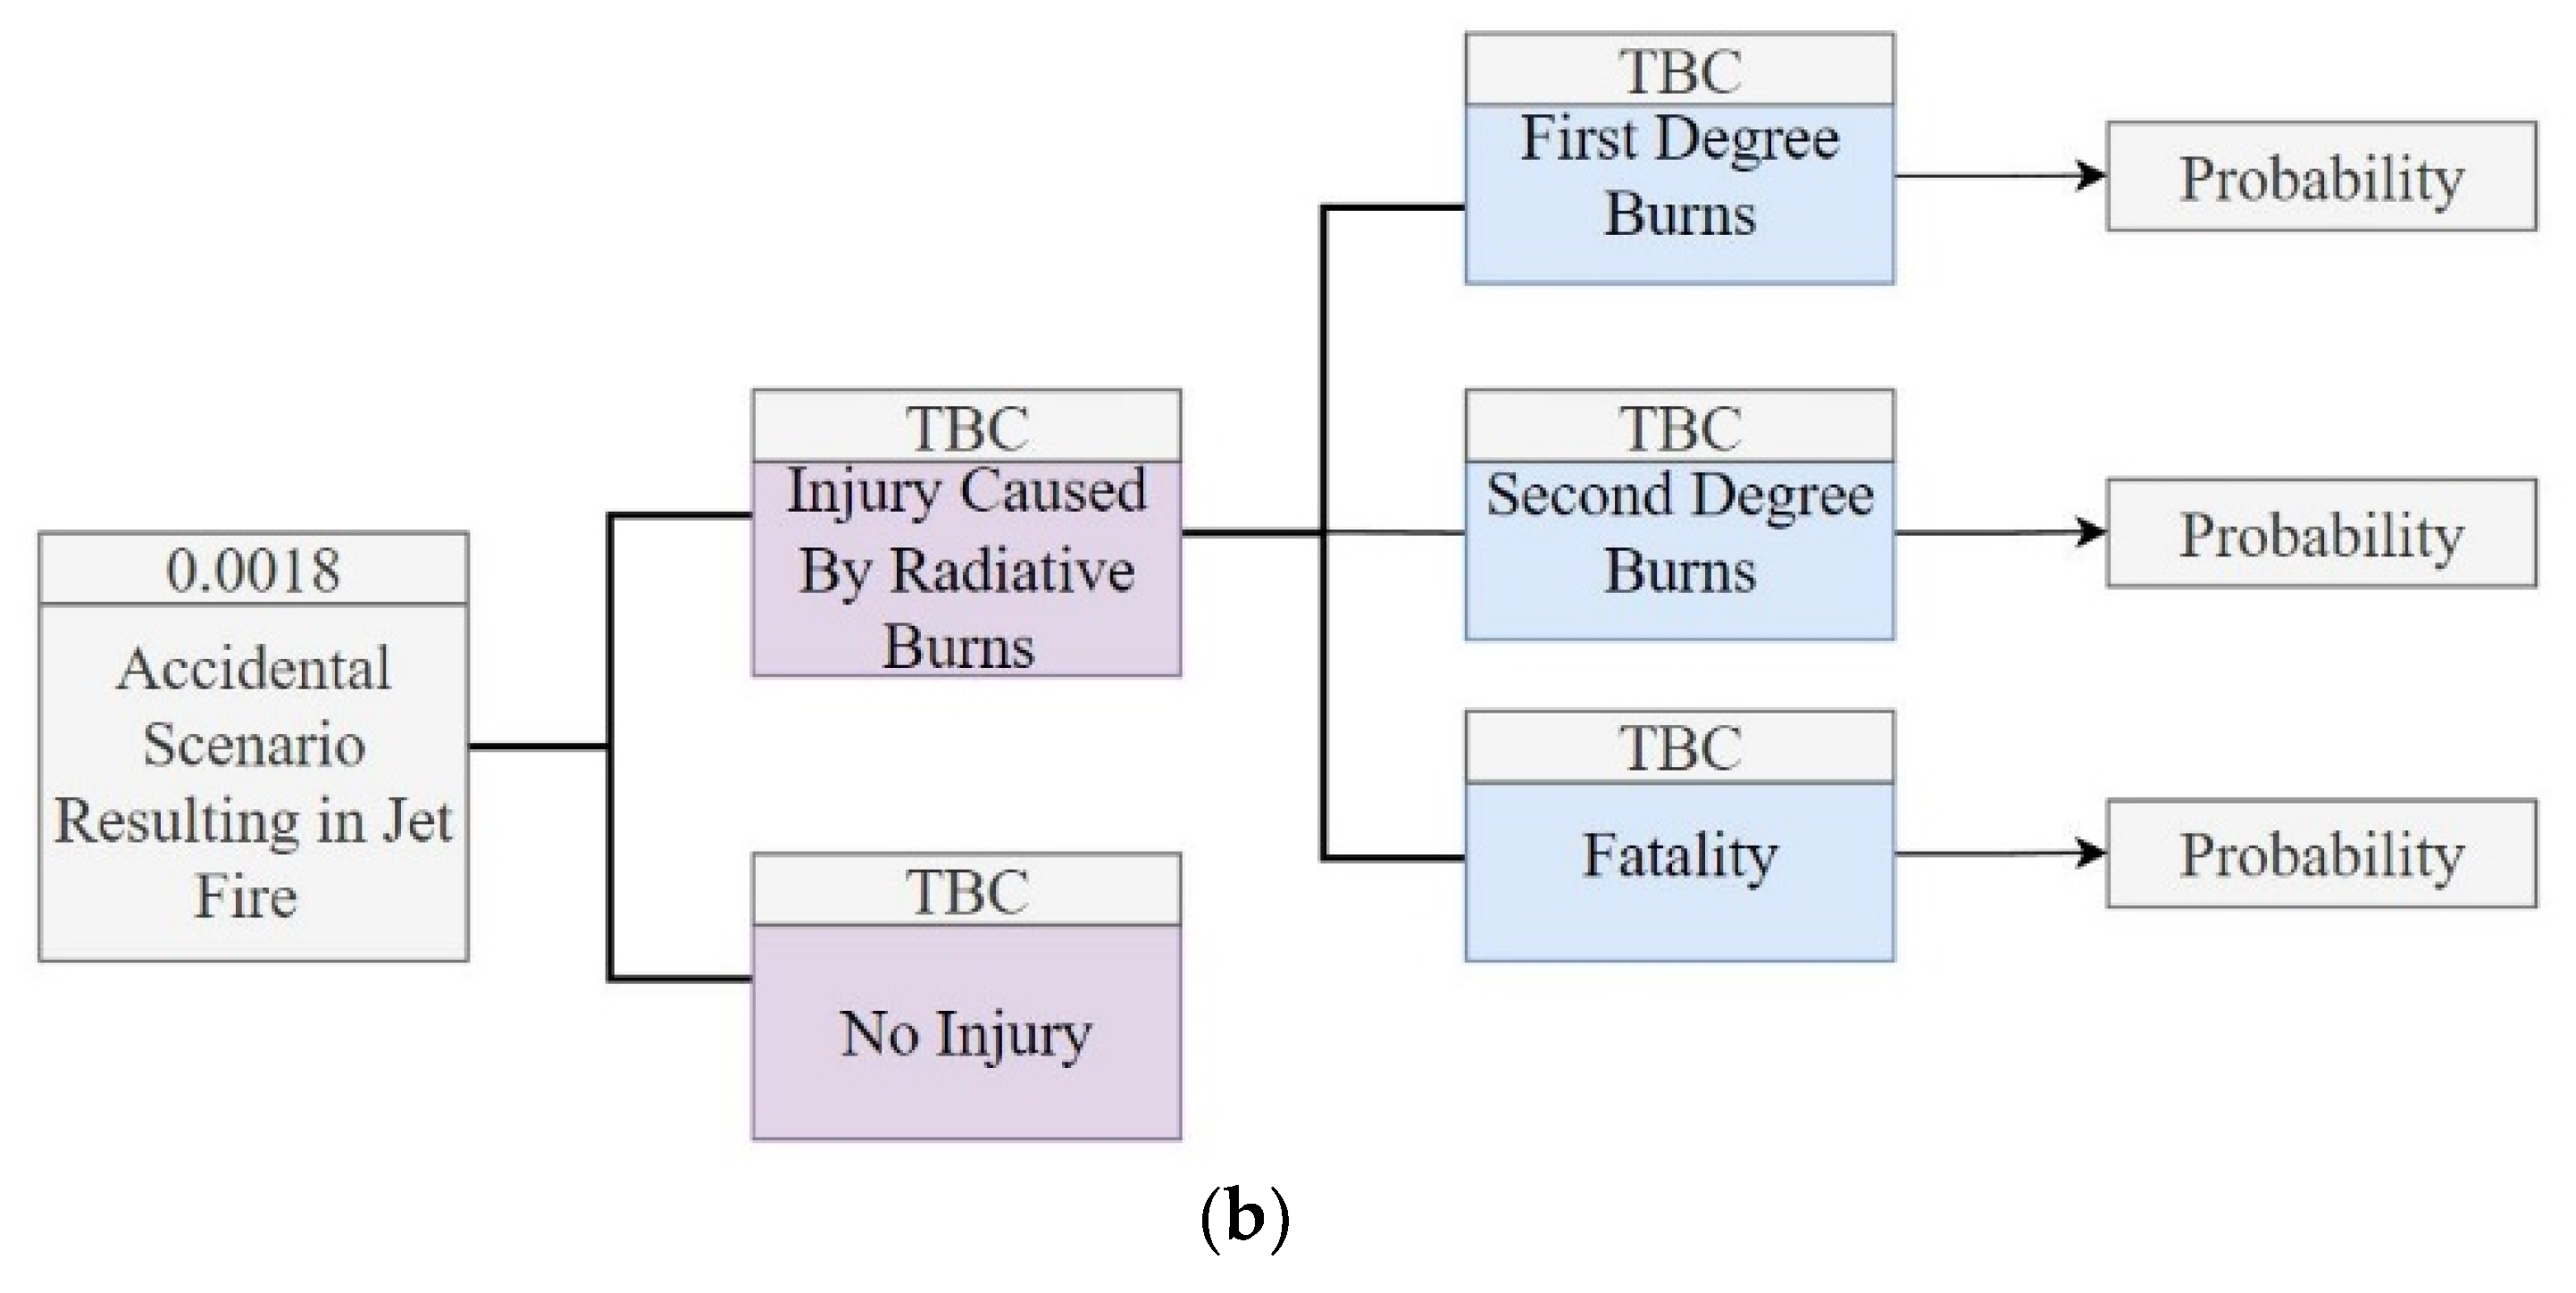
In summary, understandably the total probability represents the same graphical trends presented in the above probabilistic figures. With the application of Equations (10) and (11), we found that a relative risk score of 10 in the first 25 m is presented for this extreme case with the calculated probabilities of third-degree burns being in the high 90 s to 100 percentiles. Applying Sandia’s derived values for burns resulting from fire per mvm, we are presented with a common case of 0.00018 due to the calculated It is suggested that further studies at lower HRR can be conducted using this method to continue the development of the HFCV QRA database.
5. Conclusions
A new computational framework based on the large eddy simulation (LES) and probabilistic analysis was developed to analyse the risk of hydrogen fire accidents in semi-confined spaces. A parametric study was first conducted to analyse the impact of tunnel slope, fire position, and longitudinal and transverse ventilation. Then, LES data was incorporated to conduct the probabilistic calculation to determine the associated thermal risk of a hydrogen jet fire in a tunnel and its dependency influencing parameters.
As the slope of the tunnel increased, the back-layering effect was reduced in the scenario of ventilation being directed “uphill” of the tunnel slope. The tunnel slope also reduces incident temperature with the ceiling, while important considerations of entrapped heat circulation were identified by an increase in slope. In addition, the variation of the fire position in the tunnel was found with no notable benefits to probabilistic safety downstream from the fire. Positioning closer to the entrance resulted in thicker back-layering which may contribute to higher dangers upstream of the fire. In terms of ventilation, combined transverse and longitudinal ventilation considerably reduced the back-layering effect. However, probabilistic studies confirmed that it had minimal effect on dangers downstream with higher concentrations of heat. Combined transverse and longitudinal ventilation with tunnel slope described promising results of removing heat in a relatively stable manner and reducing the dangers of the scenario downstream.
It was shown that, at such a large power output of 40 MW, a hydrogen jet fire presented significant risks. It was also determined that prior to the large-scale implementation of this technology, further review and research are required to build upon the QRA to minimise potential consequences related to this technology. This is essential to minimise the severity of accidental scenarios and enable safe practices for first responders with HFCVs in emergency scenarios.
Future works may include the analysis of scenarios where multiple HFCVs and flame obstructions are presented. It is also important to conduct comparative studies focusing on both conventional vehicles and HFCVs to further develop comprehensive datasets for accurate QRA, assisting with the development of emergency procedures. Understanding that this study has made the assumption of a continuous flow of fuel with no study on fuel consumption within the tank, it is also important to further an understanding of scenarios that consider a limited fuel supply with a varying mass flow rate due to pressure changes.


