Article

Experimental and Theoretical Analysis of the Smoke Layer Height in the Engine Room under the Forced Air Condition

1
State Key Laboratory of Fire Science, University of Science and Technology of China, Hefei 230026, China
2
Naval Research Institute, Beijing 100161, China
*
Authors to whom correspondence should be addressed.
Submission received: 4 November 2022 / Revised: 27 December 2022 / Accepted: 30 December 2022 / Published: 4 January 2023
(This article belongs to the Special Issue Fire-Induced Smoke Movement and Control)

Abstract

:
The smoke layer height in the ship engine room under forced ventilation has been experimental and theoretical investigated in this work. A series of test were carried out in a scaled engine cabin experimental platform to obtain the influence of air supply volume and air inlet height on the burning parameters, including the mass loss rate, smoke temperature, etc. The research results show that under the experimental conditions, the fire source mass loss rate increases exponentially, and smoke layer height also increases gradually with the increase in the air supply volume. The empirical formula of smoke layer height under different air supply conditions was given. Then, a prediction model of smoke layer height under different forced ventilation conditions was constructed through theoretical analysis based on conservation equations. Within the range of experimental air volume and air inlet height, the relative error between theoretical prediction results and experimental results was less than 11%, which could effectively predict the smoke layer height in the ship cabin fire.

1. Introduction

Ship fire accidents often cause serious damage to personnel and other important equipment on board, making ship fires a major threat to ship safety. Among all kinds of ship fire accidents, engine room fire is the main research object at present because of the characteristics of high fire frequency, large fire load, and high difficulty in fire detection and rescue.
In recent years, the problem of smoke control in ship fires has attracted much attention [1,2,3,4]. The smoke control of the engine room mainly relies on the mechanical smoke exhaust system and the mechanical air supply system. When fire occurs, the smoke control system is activated, and the original smoke flow of the engine room will change. Therefore, the law of cabin smoke filling under forced ventilation conditions is of great significance for the study of the fire hazard of the engine room.
Previous studies have attracted more attention to the effects of forced ventilation on the development of cabin fires and the law of smoke filling in closed cabins. Many scholars have carried out closed space fires under different forced ventilation conditions, and have studied the effect of forced ventilation on fire parameters such as fire source burning rate [5,6,7,8], temperature distribution [9,10,11,12], and cabin pressure [13,14,15]. Alvares [5] found similar fire parameters for two different tested liquid fuels under the same fire intensity and ventilation. Chow and Chan [6] provided more information on the effect of fuel type and found that fire parameters for wood were sensitive to changes in ventilation volume, whereas fire parameters for liquid fuels and polymer materials were less sensitive to changes in ventilation volume. Peatross and Beyler [7] believed that the burning rate was determined by the fuel type and ventilation rate, and the forced ventilation test results showed that the burning rate increased with the increase in ventilation rate. Le [8] analyzed that, in a mechanically ventilated compartment, the mass loss rate of ignition source depends on two factors: the oxygen concentration and the blowing effect on the oil pool. In addition, different ventilation configurations, such as ventilation volume, and vent height, can have an impact on combustion characteristics in the cabin. Backovsky [16] studied the effect of ventilation volume and ventilation configuration on the chamber temperature, and the results showed that under the condition of low air inlet position, the ventilation rate was 2–3 times greater than the stoichiometric air volume required for fires (here called well-ventilated fires) produce a two-layer temperature distribution, whereas under-ventilated fires produce a single-layer distribution with a temperature gradient, with poorly ventilated fires having higher temperatures than well-ventilated fires. The high-inlet location perturbs the two-layer temperature distribution of a well-ventilated fire. Zhang [4] found that increasing the height of the air inlet or reducing the height of the air inlet can destroy the formation of the smoke layer. Based on the conservation equation of oxygen concentration, Hayashi [17] considered the oxygen volume exchange between the upper and lower layers due to convection and turbulent diffusion, revealed the conditions for the formation of the smoke layer under forced ventilation, and studied the formation and destruction of smoke layer by CFD. In previous studies on the effect of forced ventilation on cabin fires, there are relatively few studies on the height of the smoke layer under forced ventilation conditions.
Smoke layer height is one of the important parameters in compartment fire research. Existing calculation methods for fire smoke layer height include the classical N-percentage, integral ratio, intra-variance methods and so on. These methods are mostly suitable for the processing of temperature data. Predecessors have carried out a lot of research on the change in smoke layer height in compartment fire [18,19,20]. Most of these studies are experimental and simulation studies based on the corresponding structures of buildings. For the study of the height of the smoke layer, some common models have been formed, such as the NFPA 92B model [21], the Milke Mowrer model and the Tanaka [22] model. It has been more than 20 years since Zukoski [23] first proposed a simple analytical model of enclosed smoke filling based on energy and mass balance. The Zukoski formula remains the theoretical basis for other enclosed space smoke filling models, including the ASET model developed by Cooper. Li [24] obtained a formula for predicting the smoke layer based on the regional model (there is an obvious layering between the upper hot smoke and the lower cold air) and according to the conservation of energy. Li [25] carried out the natural gas filling experiment and the smoke control experiment in the experimental cabin, and based on the plume theory and the conservation equation, he developed the smoke settlement formula for the filled cabin, and considered the plume rising time. Wang [26] established an explicit smoke-filling model of an enclosed ship engine room through the back analysis of the experimental data in the literature.
It can be seen that there is a lack of theoretical and experimental research on the height of the smoke layer of closed cabin fires under forced ventilation in the current research on engine room fires. Therefore, this paper studies the development of the cabin room fire and the process of smoke settlement under the conditions of different air supply volume and air supply inlet heights through the small-scale engine room fire experiment. the theoretical analysis was carried out to predict the height of the cabin fire smoke layer un-der different air supply conditions based on the zone model, and the prediction results of the model are compared with the experimental results to verify the validity of the theoretical model. The model proposed in this paper can provide a theoretical analysis and prediction method for ship fire risk research.

2. Experimental Setup

These experiments were carried out in the scaled engine cabin test platform (Figure 1). The top and bottom plates of cabin were 8.5 m (L) × 7.5 m (W) and 8.5 m (L) × 6 m (W). The height of cabin was 1.9 m. Inside the cabin there were two gas turbine models with a height of 1.25 m. The experimental bench smoke exhaust system was based on the original ventilation system, based on the principle of smoke control, and improved by adding pipelines and valves. There were four air supply inlets and two smoke exhaust outlets in the engine room. The schematic diagram of the air supply inlet was shown in Figure 1, its size could be adjusted, and the opening of the air inlet was controlled by the valve (0.2 m × 0.2 m, 0.15 m × 0.15 m, 0.1 m × 0.1 m). The air inlet could be set to three different heights—0.1 m, 0.4 m, 0.7 m—from the bottom plate. The smoke exhaust outlet was located at the top of the cabin, and its size was 0.4 m × 0.4 m.
To compare the effect of smoke control in the cabin under different forced air conditions, the experiment considered four different air supply configurations of 2.646 m³/s, 2.352 m³/s, 2.058 m³/s and 1.764 m³/s, and three different air inlet heights of 0.1 m, 0.4 m and 0.7 m. The smoke exhaust volume was based on the existing ventilation system design and is fixed at 0.9 times the air supply volume.
When comparing the cabin smoke control effects under different forced air volumes, the first principle should be to ensure the consistency of the fire source in each test. Therefore, the heptane oil pool fire with good repeatability was used as the experimental fire source. The diameter of the oil pan is D = 40 cm, and the amount of heptane in a single experiment is 3.5 L. The thermophysical properties of heptane are shown in Table 1.
During the experiment, the Deant ES60K electronic balance was used to measure the mass loss of the pool fire fuel with a range of 60 kg and an accuracy of 0.5 g. Thermocouples were used as temperature sensors in the experiment, and K-type armored thermocouples with a diameter of one millimeter were used for the thermocouples. A total of five thermocouple trees are arranged. The thermocouples are arranged vertically, one at a distance of 0.2 m downward from the height of 1.8 m at the top of the cabin. The specific layout is shown in Figure 2. Thermocouple tree 1, 2 and 3 are placed at the quarter positions on the longitudinal axis of the cabin to monitor the temperature at the fire source in the cabin and on both sides of the fire source. Thermocouple tree 4 is placed at the position of the manhole to monitor the temperature distribution at the manhole as the only escape route after a fire occurs in the cabin. Thermocouple tree 5 is used to monitor the temperature distribution at the left and right ladder openings after a fire occurs in the cabin. Since the left and right are basically symmetrically distributed, only one bunch of thermocouple trees is provided.

3. Results and Discussion

3.1. Mass Loss Rate

The mass loss rate is a parameter describing the mass loss of fuel during combustion. it can be obtained by differentiating the mass change curve measured by the electronic balance. Through the change in mass loss rate, we can intuitively see the development process of the fire and the influence of boundary conditions on the compartment fire. Figure 3 shows the development law of the mass loss rate of pool fire under the condition of forced air supply and the effect of different air supply air volumes on the mass loss rate. Under the condition of forced ventilation, as the combustion progresses, the temperature of the gas in the cabin rose, and the heat radiation received by the oil pool gradually increased, which accelerated the evaporation process of the fuel and increased the mass loss rate. After burning for a certain time, the pool fire entered the boiling burning stage, and the mass loss rate increased suddenly, and then gradually decreased with the consumption of fuel. With the increase in the air supply volume, the development of pool fire was obviously accelerated, and the burning time was shortened. Figure 4 shows the change in the mass loss rate under the condition of different air supply port heights. With the change in air supply inlet height, mass loss rate change process was basically the same.
The mass loss rate is time-averaged, and the forced air volume and mass loss rate are dimensionless based on the experimental results in Figure 3 and the experimental results of predecessors [7]. The dimensionless mass loss rate m ˙ *   can be defined as m ˙ * = m ˙ / m ˙ t h , where m ˙   is experimental mass loss rate,   m ˙ t h   is the mass loss rate of the oil pool of diameter D in the free atmosphere,   m ˙ t h = m ˙ 1 e k β D A f . The number of air changes N can be defined as N = 3600 V s / V c , where V s is the supply air volume, V c is the cabin volume. By introducing a dimensionless length f D , V c = D · V c 1 / 3 , the relationship between the dimensionless mass loss rate and the number of air changes in this experiment and previous research results can be drawn on a graph, as shown in Figure 5. It can be seen from the figure, under the conditions of the experimental cabin and ventilation configuration, that the fire source mass loss rate and the supplementary air volume have the following relationship:
m ˙ * f D , V c = 0.21 e x p N 36 × 3.25 + 0.24

3.2. Temperature Distribution

The heat transfer of the flame to the space gas in the cabin has three ways: conduction, convection and radiation. Among them, the convective heat transfer is the most important, and the convection heat transfer depends on the movement of the smoke and the entrainment formed by the combustion of flame. In the region, the temperature increase is mainly because of smoke. Therefore, analyzing the distribution law of space gas temperature in the combustion process can reflect the distribution characteristics of smoke to a certain extent. Taking the air supply volume of 2.058 m3/s as an example, Figure 6 shows the temperature changes at different heights in position 1 in the cabin. It can be seen from the figure that the temperature changes at different heights were basically the same. The temperature difference between the measurement points below the height of about 1.2 m in the cabin was not large. Above approximately 1.2 m, the temperature difference between the measurement points increased rapidly. This is because the smoke layer accumulates near the fire source, resulting in a higher temperature in the upper part of the cabin, whereas the temperature of the lower cold air layer does not change much. The cold air layer has a relatively obvious interface.
Figure 7 shows the variation in vertical temperature with time. At the initial moment, the vertical temperature in the cabin was basically the same. After ignition, with the filling of smoke, the temperature of the upper layer gradually increased, whereas the temperature of the lower layer did not change much. The temperature distribution from top to bottom in the cabin could be regarded as a “double-zone distribution”. The temperature inflection points of the upper and lower layers decreased gradually with the settlement of the smoke layer. Because of forced air supply and exhaust, the smoke did not settle to the bottom of the cabin, and the vertical temperature maintained a consistent “double-zone distribution”. Afterwards, with the consumption of fuel, the power of the ignition source decreased, the height of the smoke layer gradually increased, and the height of the temperature inflection point of the upper and lower layers gradually increased.
Figure 8 shows the variation in the vertical average temperature at different positions in the cabin. The average temperature here is the average temperature of all thermocouples vertically at this position. It can be seen from the figure that the temperature in the middle part of the cabin was obviously higher than the temperature at the position of the manhole and the entrance of the ladder. Figure 9 shows the variation law of the vertical average temperature at position 1 under different supply air volume conditions. With the increase in air supply air volume, the average temperature in the cabin shown a gradually decreasing trend.

3.3. Smoke Height

In fire research, the common methods for solving smoke layer height mainly include: the extinction method, N percentage method, minimum integral ratio method and piecewise linear method. Among them, the minimum integral ratio method and the piecewise linear method are used to process the temperature data. In this study, the minimum integral ratio method is used to solve the height of the smoke layer. The method has a relatively clear definition of the neutral plane and a more rigorous calculation and derivation process, and the calculation results are more convincing. It defines the height of the smoke layer as the position where the sum of the minimum integral ratios of the upper and lower layers takes the minimum value. In the calculation, the integral ratios of the upper hot smoke layer and the lower air layer at time t are, respectively:
r u = 1 H z 2 · z H T z d z · z H 1 T z d z
r l = 1 z 2 · 0 z T z d z · 0 z 1 T z d z
Then, the height z of the smoke layer at time t should satisfy:
r t = min r u + r l
Based on the above method and the temperature data of the 1# thermocouple tree, MATLAB is used to solve the height of the smoke layer, and finally the height of the smoke layer under different air supply configurations is given as shown in Figure 10. It can be seen from the figure that within the range of air volume and air supply port height in this experiment, with the gradual increase in the forced air supply volume, the height of the smoke layer also gradually increases; with the increase in the air supply inlet height, the height of the smoke layer gradually decreases.
Based on the above data, let the dimensionless smoke layer height H * = H / H 0 , the dimensionless air inlet height h * = h / H 0 , and introduce the dimensionless parameters P and Q to make the data dimensionless. The curves of P and Q after processing are shown in Figure 11. It can be seen that P and Q are approximately linearly related: P = 1.72 × Q + 50.79 .
P = F H * , N , h * = H * / h * × N × 1.9 h * + 0.7
Q = G N , h * = 3.7 / h * × e x p 0.028 N
Based on the above results, the empirical formula for the calculation of the dimensionless smoke layer height under the experimental conditions can be given:
H * = 6.37 × e x p 0.028 N + 50.79 h * 1.9 h * + 0.7 × N

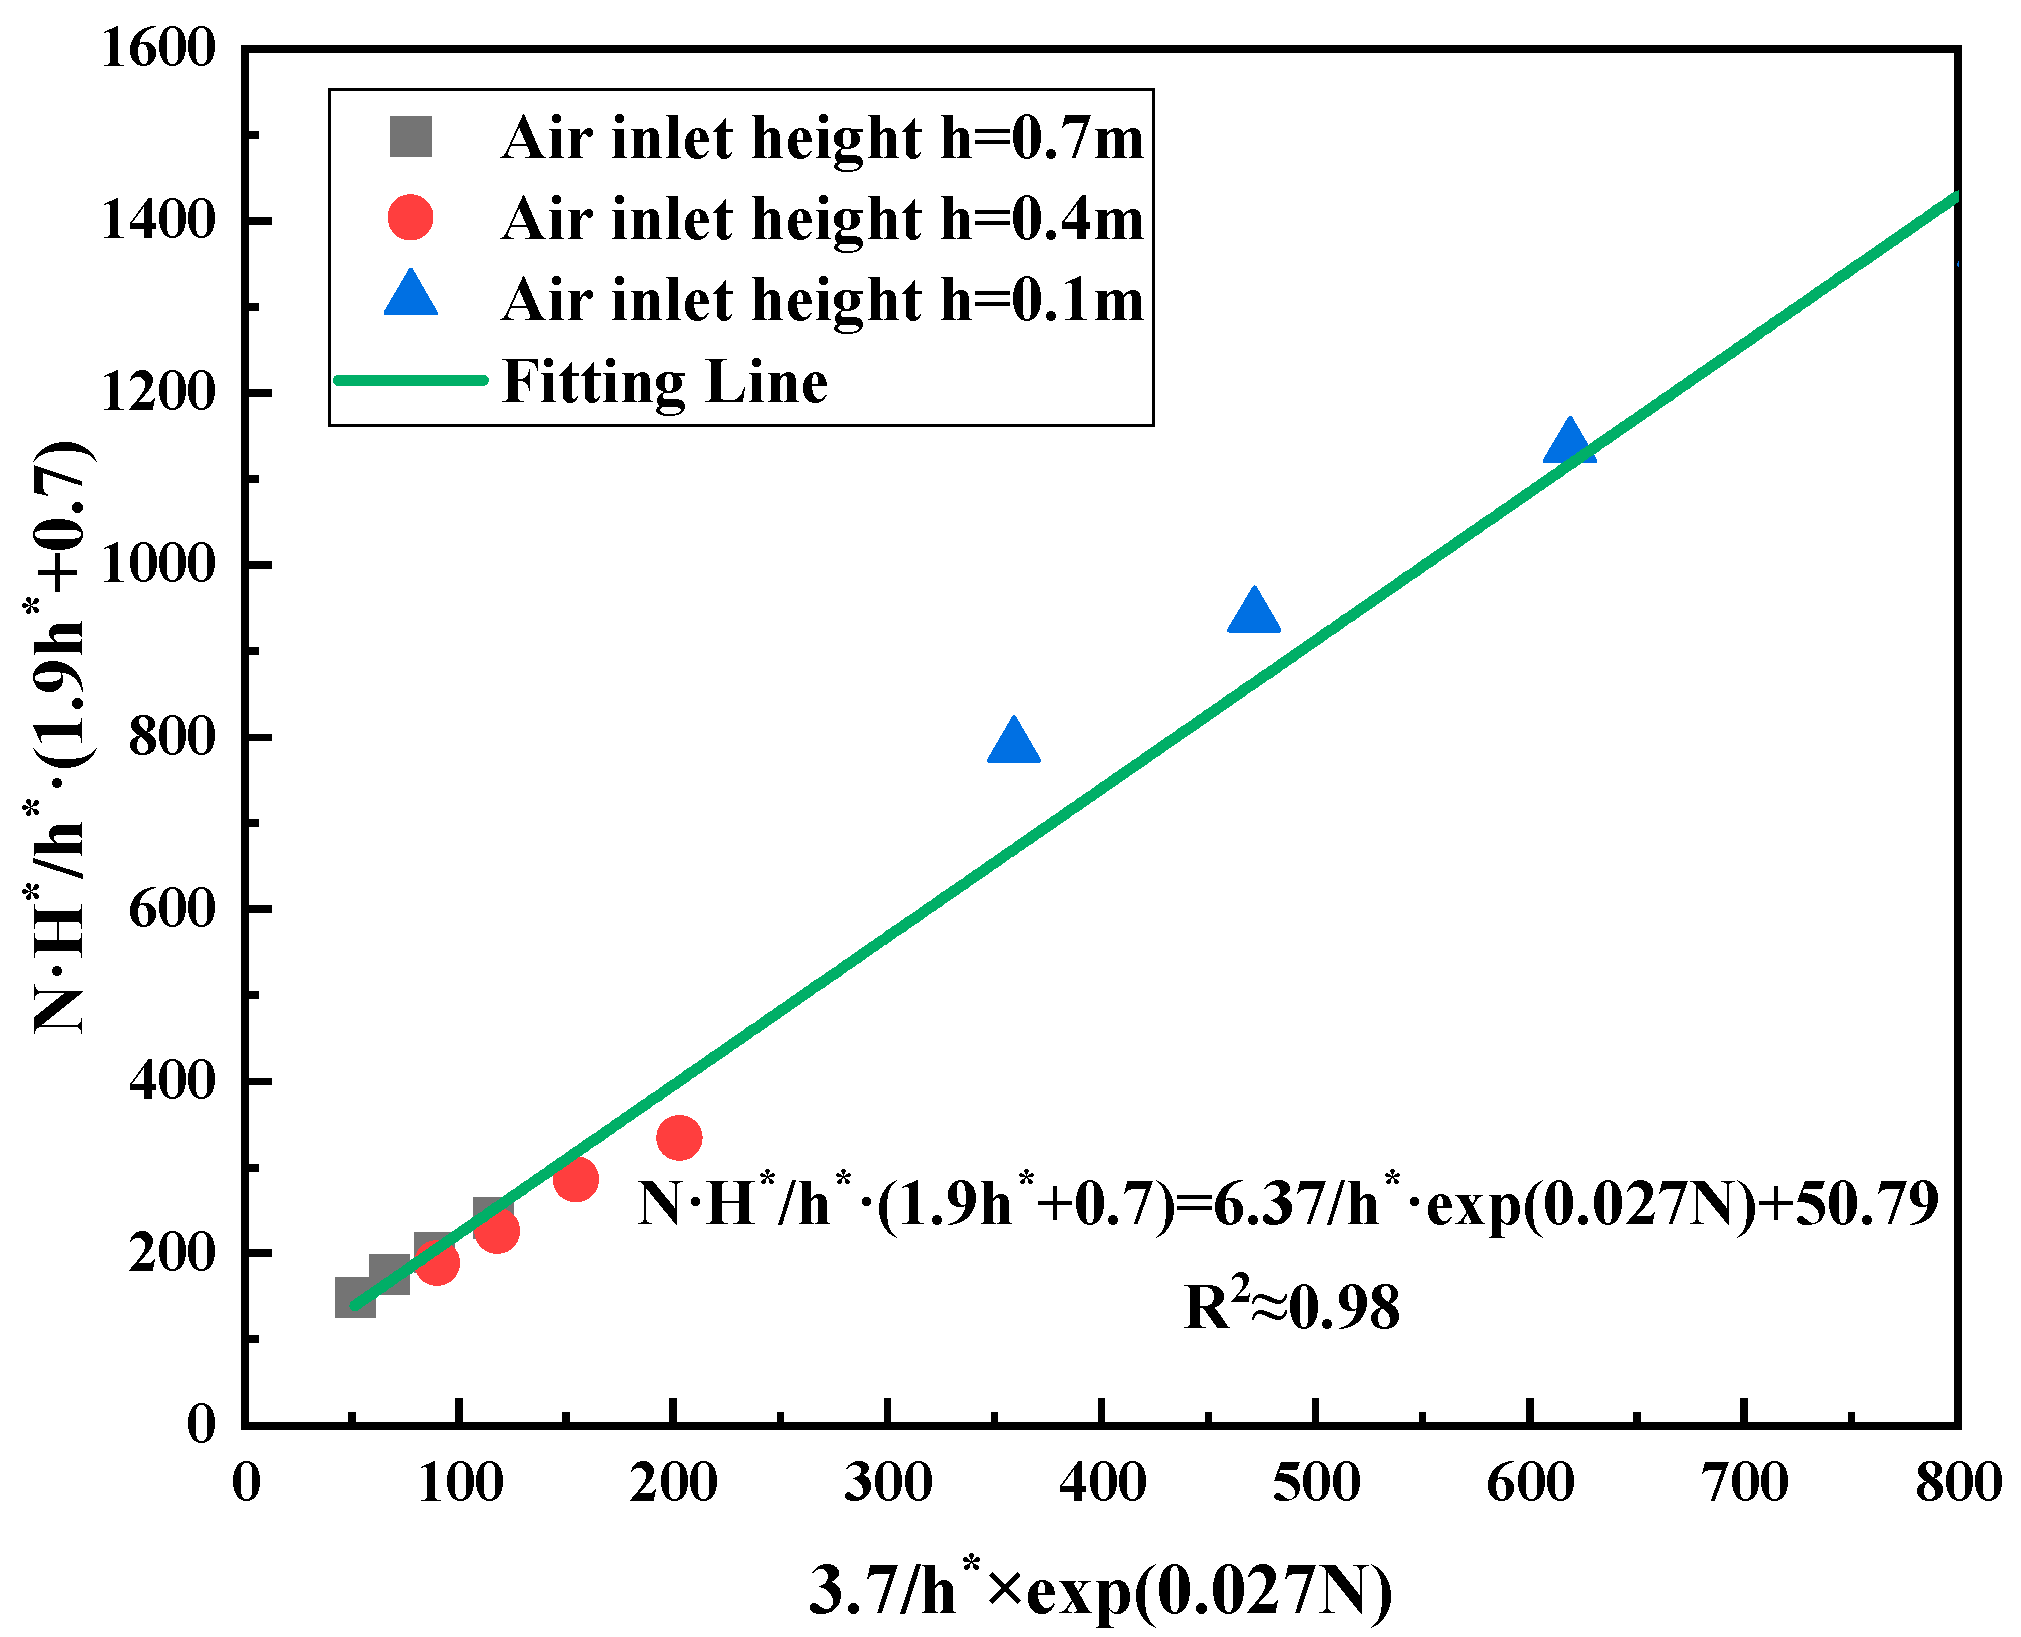
3.4. Prediction of Smoke Layer Height in the Engine Room

In the study of enclosed compartment smoke filling, predecessors usually regarded the ignition source as a point source heat source. Since the object we study is the development of the smoke plume outside the combustion area, we do not consider the combustion process during the fire and the changes in the smoke composition caused by chemical reactions. In actual engine room fire, there is no clear boundary between the smoke layer and the air layer. In the theoretical analysis, the transition layer in the smoke filling process is usually ignored, and only the upper smoke layer and the lower air layer are considered. In addition, this paper assumes that the effect of mechanical air supply on smoke deposition is mainly reflected in the following two aspects: the promotion of mechanical air supply to the fire source; the mechanical air supply promotes the mass mixing of the smoke layer and the lower air layer.
Based on the above assumptions, we choose a physical model with the same size and structure as the experimental cabin. It is assumed that the communication between the interior of the cabin model and the outside world is only through the air supply vents and exhaust vents, and there are no other openings. If the smoke is used as the control body, as shown in Figure 12, the control body always obeys the mass conservation equation during the smoke settling process. There are three main aspects in the process of quality change in the control body: (1) The smoke generated at the fire source enters the control body to increase the quality of the smoke in the control body; (2) the fresh gas provided by the mechanical air supply enters the smoke layer; (3) the upper mechanical exhaust port removes part of the smoke. The main energy transfer process in the cabin can be assumed to be that the heat generated by the fire source in the cabin is divided into three parts: a part of the heat is used to heat the gas in the cabin; a part of the heat is dissipated outward through the wall; a part of the heat is dissipated outward through the smoke outlet.
Therefore, its conservation equation can be expressed as:
m ˙ p + m ˙ b m ˙ e = d ρ s V u d t
where:
  • m ˙ p : the mass flow rate of the smoke entering the upper control body from the fire source area;
  • m ˙ b : the mass flow rate of the air entering the smoke layer from other areas;
  • m ˙ e : the mass flow rate of the smoke discharged by the mechanical exhaust;
  • ρ s : the smoke density, which is assumed to be constant and has the same value with air;
  • V u : the volume of the smoke layer.
The volume change rate d V u of the control body is the volume of the micro-element above the control body. Since the thickness d z of the micro-element is infinitely small, the volume of the entire micro-element can be calculated according to the volume of the cube, that is, d V u = A z d Z u , where Z u is the smoke layer thickness, A z is the cross-sectional area of the cabin at the lower boundary of the smoke layer.
The Formula (9) can be rewritten as:
d Z u d t = m ˙ p + m ˙ b m ˙ e A z ρ s
During the combustion process, the hot smoke entrains the surrounding air during the upward movement to form a plume. In the plume theory, there is a law of conservation of mass between the amount of smoke and the entrained air, so the amount of smoke generated depends on the amount of entrained air. In this model, Zukoski’s axisymmetric plume model is mainly used, as shown in the following formula.
m ˙ p = 0.21 ρ 0 g C P T 0 1 / 3 Q ˙ C 1 / 3 Z 5 / 3 = C Q ˙ C 1 / 3 Z 5 / 3
where:
  • ρ 0 : air density;
  • g : gravitational acceleration;
  • C P : specific heat capacity at constant pressure;
  • T 0 : the environment temperature;
  • Q ˙ c : the convective part of ignition power;
  • Z : The height of the plume away from the fire surface.
Based on previous studies, mechanical ventilation has a promoting effect on the power of the fire source. Therefore, combined with Equation (1), we can assume that the mass loss rate m ˙ of the fire source can be written as:
m ˙ = f V s
Therefore, the convection part Q ˙ c of the fire power can be written as:
Q ˙ c 0.7 Q ˙ = 0.7 χ · f V s · Δ H c
where:
  • Q ˙ : total heat release rate of the fire source;
  • χ : combustion efficiency;
  • Δ H c : heat of combustion.
In addition, the fresh gas provided by the mechanical ventilation is not only entrained by the fire source, but the gas in other areas will be mixed with the upper layer smoke due to the gas flow. It is assumed that the proportion of the gas mixed with the upper layer smoke in the mechanical supply air volume is ψ. For different air supply heights, ψ is different; thus, it can be assumed that ψ = g(h), then:
m ˙ b = ψ m ˙ s = g h m ˙ s = g h ρ s V s
During the process of smoke filling, the actual cross-sectional area of the cabin is constantly changing. To give a suitable engineering calculation model, it is assumed that the cross-sectional area of the cabin decreases linearly from top to bottom, as shown in the above figure, so the cross-sectional area of the cabin can be written as:
A z = k z + b
The values of k and b in the formula are determined by the size of the cabin. By substituting Equations (11), (13)–(15) into Equation (10), and introduce the height Z t of the smoke layer, we have:
d Z t d t = d Z u d t = C 0.7 χ · f V s · Δ H c 1 / 3 Z t 5 / 3 + g h ρ s V s m ˙ e k Z t + b ρ s
Therefore, for the prediction of the height of the smoke layer at different air supply air volumes and air supply port heights, there are:
d Z t d t = d Z u d t = C 0.7 χ · f V s · Δ H c 1 / 3 Z t 5 / 3 + g h ρ s V s m ˙ e k Z t + b ρ s w h e n   t = 0   ,   Z t = H
Based on the results of the experiment and the above theoretical analysis, the results of the smoke layer height prediction are given below. Based on the results obtained from the dimensionless mass loss rate, namely, Equations (1) and (2), the fire source power can be written as:
Q ˙ c 0.7 χ · m ˙ · Δ H c = 0.7 χ · 204.54 · e V s / 0.37 + 7.11 · Δ H c
The above formula can be applied to the fire source power under different air volume conditions to determine the height of the smoke layer. Formula (17) can be written as:
d Z t d t = C 0.7 χ · 204.54 · e V s 0.37 + 7.11 · Δ H c 1 / 3 z 5 3 + ψ V s ρ a V e ρ s k z + b ρ s w h e n   t = 0   , Z t = 1.9
where:
  • C: according to Zukoski’s model can be calculated, C = 0.076432;
  • k: k depends on the compartment structure, k = 6.7;
  • b: b depends on the compartment structure, b = 51;
  • ψ: the mixing rate, a function of the air supply port height h,   g h = 0.25 e h 0.64 + 0.76 .
Put different air volume and air inlet height into the above formula, and iteratively solve based on the second-order Runge–Kutta method. The comparison results between the experimental value and the theoretical value are shown in Figure 13. Compared with the experimental results, it is found that within the range of the experimental air volume, the theoretical prediction results of smoke layer height are consistent with the experimental results, and the relative error is less than 11%. It can be considered that the theoretical prediction model given in this paper has a good prediction effect.

4. Conclusions

In this paper, experimental and theoretical research were carried out on the height of smoke layers from engine room fires under the condition of forced ventilation. The development of the cabin room fire and the process of smoke settlement under the conditions of different air supply volume and air supply inlet heights were studied by experiment method. The theoretical analysis was carried out to predict the height of the cabin fire smoke layer under different air supply conditions and verified the validity of the model.
The main conclusions are as follows:
(1) The fire experiment was carried out in the small-scale engine room. Experimental results show that the mass loss rate of the fire source increased approximately exponentially with the increase in the supply air volume. Combined with the experimental data and previous data, the empirical formulas of mass loss rate and air supply volume are given, and they are applied to the smoke layer height prediction model proposed in this study.
(2) The smoke layer height variation curve under different air supply conditions was given based on the minimum integral ratio method. Under the experimental conditions, the height of the smoke layer gradually increases with the increase in air supply volume and the height of the smoke layer gradually decreases with the increase in the height of the air supply inlet.
(3) A prediction model of smoke layer height under different forced ventilation conditions was constructed through theoretical analysis based on the conservation equations. Within the range of the experimental air supply volume and the height of the air inlet, the relative error between theoretical prediction results and experimental results was less than 11%, which could effectively predict the smoke layer height in the in-ship cabin fire. The research is of great significance to the research on the fire risk of the engine room, and provides a theoretical basis for the prediction of the fire risk of the engine room.

Author Contributions

Methodology, X.W.; software, W.Y.; validation, Y.Z.; formal analysis, X.W.; investigation, J.J.; resources, X.W.; data curation, Y.Z.; writing—original draft preparation, X.W.; writing—review and editing, X.C. and S.L. All authors have read and agreed to the published version of the manuscript.

Funding

The National Natural Science Foundation of China (Grant No.51704268) and Fundamental Research Funds for the Central Universities (No. WK2320000048).

Institutional Review Board Statement

Not applicable.

Informed Consent Statement

Not applicable.

Data Availability Statement

Not applicable.

Acknowledgments

This work was supported by the National Natural Science Foundation of China (Grant No.51704268) and the Fundamental Research Funds for the Central Universities (No. WK2320000048).

Conflicts of Interest

The authors declare no conflict of interest.

References

  1. El-Helw, M.; Fayed, M.; El-Shobaky, A. Studying different scenarios of operating air conditioning system in smoke management using computational fluid dynamics in naval ships. Therm. Sci. 2018, 22, 2973–2986. [Google Scholar] [CrossRef] [Green Version]
  2. Zhang, J.; Zhang, B.; Ji, K.; Yan, B.; Fan, M.; Li, W.; Li, Q. Numerical Study on Fire characteristics in Force-Ventilated Compartment with different air inlet locations. In Proceedings of the Journal of Physics: Conference Series, Taiyuan, China, 21–22 October 2017; p. 012028. [Google Scholar] [CrossRef]
  3. Wu, Z.; Wang, L.; Su, S.; Liu, W. Experimental and simulation study of the interaction characteristics of nano-MgO and smoke in the fire of a ship engine room. Fire Mater. 2022, 46, 953–967. [Google Scholar] [CrossRef]
  4. Zhang, B.; Zhang, J.; Wang, X.; Lu, S.; Li, C.; Chen, R. Effects of air inlet configuration on forced-ventilation enclosure fires on a naval ship. Fire Technol. 2016, 52, 547–562. [Google Scholar] [CrossRef]
  5. Alvares, N.; Foote, K.; Pagni, P. Forced ventilated enclosure fires. Combust. Sci. Technol. 1984, 39, 55–81. [Google Scholar] [CrossRef]
  6. Chow, W.K.; Chan, W.L. Experimental studies on forced-ventilated fires. Fire Sci. Technol. 1993, 13, 71–87. [Google Scholar] [CrossRef] [Green Version]
  7. Peatross, M.J.; Beyler, C.L. Ventilation effects on compartment fire characterization. Fire Saf. Sci. 1997, 5, 403–414. [Google Scholar] [CrossRef] [Green Version]
  8. Le Saux, W.; Pretrel, H.; Lucchesi, C.; Guillou, P. Experimental study of the fire mass loss rate in confined and mechanically ventilated multi-room scenarios. Fire Saf. Sci. 2008, 9, 943–954. [Google Scholar] [CrossRef] [Green Version]
  9. Mitler, H.E. Zone Modelinq of Forced Ventilation Fires. Combust. Sci. Technol. 1984, 39, 83–106. [Google Scholar] [CrossRef]
  10. Foote, K.; Pagni, P.; Alvares, N. Temperature correlations for forced-ventilated compartment fires. Fire Saf. Sci. 1986, 1, 139–148. [Google Scholar] [CrossRef]
  11. Deal, S.; Beylert, C. Correlating preflashover room fire temperatures. J. Fire Prot. Eng. 1990, 2, 33–48. [Google Scholar] [CrossRef]
  12. Chow, W.K. Modelling of forced-ventilation fires. Math. Comput. Model. 1993, 18, 63–66. [Google Scholar] [CrossRef]
  13. Brohez, S.; Caravita, I. Fire induced pressure in airthigh houses: Experiments and FDS validation. Fire Saf. J. 2020, 114, 103008. [Google Scholar] [CrossRef]
  14. Li, J.; Beji, T.; Brohez, S.; Merci, B. CFD study of fire-induced pressure variation in a mechanically-ventilated air-tight compartment. Fire Saf. J. 2020, 115, 103012. [Google Scholar] [CrossRef]
  15. Li, J.; Prétrel, H.; Suard, S.; Beji, T.; Merci, B. Experimental study on the effect of mechanical ventilation conditions and fire dynamics on the pressure evolution in an air-tight compartment. Fire Saf. J. 2021, 125, 103426. [Google Scholar] [CrossRef]
  16. Backovsky, J.; Foote, K.L.; Alvares, N.J. Temperature Profiles in Forced-Ventilation Enclosure Fires; Lawrence Livermore National Laboratory: Livermore, CA, USA, 1988. [Google Scholar]
  17. Hayashi, Y.; Hasemi, Y.; Ptchelintsev, A. Smoke Layer Formation by Fires In Forced Ventilation Enclosure. Fire Saf. Sci. 2000, 6, 805–816. [Google Scholar] [CrossRef] [Green Version]
  18. Zukoski, E.E. Development of a stratified ceiling layer in the early stages of a closed-room fire. Fire Mater. 1978, 2, 54–62. [Google Scholar] [CrossRef]
  19. Haouari-Harrak, S.; Mehaddi, R.; Boulet, P.; Koutaiba, E. Evaluation of the room smoke filling time for fire plumes: Influence of the room geometry. Fire Mater. 2020, 44, 793–803. [Google Scholar] [CrossRef]
  20. Zhang, Y.; Liu, Z.; Lin, Y.; Fu, M.; Chen, Y. New approaches to determine the interface height of fire smoke based on a three-layer zone model and its verification in large confined space. Fire Mater. 2020, 44, 130–138. [Google Scholar] [CrossRef]
  21. National Fire Protection Association. NFPA 92B. Guide for Smoke Management Systems in Atria, Covered Malls, and Large Areas; National Fire Protection Association: Quincy, MA, USA, 2005. [Google Scholar]
  22. Tanaka, T.; Yamana, T. Smoke control in large scale spaces (Part 1: Analytic theories for simple smoke control problems). Fire Sci. Technol. 1985, 5, 31–40. [Google Scholar] [CrossRef]
  23. Zukoski, E.E.; Kubota, T.; Cetegen, B. Entrainment in fire plumes. Fire Saf. J. 1981, 3, 107–121. [Google Scholar] [CrossRef]
  24. Li, Y. Smoke Flow and control in Large Space Atrium Buildings. Ph.D. Thesis, University of Science and Technology of China, Hefei, China, 2001. [Google Scholar]
  25. Yuan-Zhou, L.I.; Liu, Y. Study on smoke filling process in shipengine room based on full-scale tests. J. Saf. Environ. 2018, 18, 542–547. [Google Scholar]
  26. Wang, J.; Zhang, R.; Wang, Y.; Shi, L.; Zhang, S.; Li, C.; Zhang, Y.; Zhang, Q. Smoke filling and entrainment behaviors of fire in a sealed ship engine room. Ocean Eng. 2022, 245, 110521. [Google Scholar] [CrossRef]
Figure 1. Front view (left) and top view (right) of the experimental cabin.
Fire 06 00016 g001
Figure 2. Schematic diagram of fire source and thermocouple layout.
Fire 06 00016 g002
Figure 3. Variation in mass loss rate with time under different air volume conditions.
Fire 06 00016 g003
Figure 4. Variation in mass loss rate with time under different air supply inlet heights.
Fire 06 00016 g004
Figure 5. Relationship between dimensionless mass loss rate and dimensionless air volume.
Fire 06 00016 g005
Figure 6. Temperature changes at different heights of the 1# thermocouple tree in the cabin ( V s = 2.058   m 3 / s ).
Fire 06 00016 g006
Figure 7. Vertical temperature change in 1# thermocouple tree ( V s = 2.058   m 3 / s ).
Fire 06 00016 g007
Figure 8. Temperature changes at different positions in the cabin ( V s = 2.058   m 3 / s ).
Fire 06 00016 g008
Figure 9. Temperature change at position 1 under different air supply volumes.
Fire 06 00016 g009
Figure 10. Comparison of cabin smoke layer heights under different supply air volume conditions.
Fire 06 00016 g010
Figure 11. The relationship between the dimensionless smoke layer height and the dimensionless air supply volume.
Fire 06 00016 g011
Figure 12. Schematic diagram of the smoke stratification in the engine cabin.
Fire 06 00016 g012
Figure 13. Comparison of predicted and experimental values of smoke layer height under different supply air volume conditions.
Fire 06 00016 g013
Table 1. Fuel properties.
NameHeptane
Molecular formulaC7H16
Density684 kg/m3
Flash point−4 °C
Boiling point98.5 °C
Heat of combustion44.6 MJ/kg
Progressive Mass Burn Rate   m ˙ 0.101 (±0.009)
Effective absorption coefficient   k β 1.1 (±0.3)
Disclaimer/Publisher’s Note: The statements, opinions and data contained in all publications are solely those of the individual author(s) and contributor(s) and not of MDPI and/or the editor(s). MDPI and/or the editor(s) disclaim responsibility for any injury to people or property resulting from any ideas, methods, instructions or products referred to in the content.

