1. Introduction
With the rapid development of the economy, the number of large-scale building sites is increasing, and the building structure is also developing to the upper space (high-rise) and the lower space (underground). These building sites are often densely populated and have complex human flow organization, so how to effectively manage the crowd and carry out efficient evacuation in the event of an emergency has attracted more and more attention from researchers [
1]. The research on pedestrian groups is mainly carried out through direct observation and evacuation experiments, but the time and resources spent on evacuation experiments and observation are relatively large, so it is difficult to extract relevant observation data, and there are certain limitations in repeatability and operability [
2,
3]. So in some cases, engineers use back-of-the-envelope calculations to assess life safety, and, in other cases, computerized evacuation models [
4]. These are various practical and effective methods used to establish a pedestrian evacuation dynamic model and carry out computer simulation [
5,
6]. The psychological tendency of pedestrians sliding downhill and practicing collision avoidance behavior is considered for simulation modeling. Numerous evacuation models established by previous scholars can be generally categorized into macro and micro models by the characteristics of involving evacuees [
7,
8].
The macro model regards evacuees as individuals with the same characteristics, considering the evacuation as a movement of uniform flow, and the density distribution of evacuated people is an important factor affecting evacuation. The macro model studies the evacuation system from the overall perspective and focuses on the relationship between the macro statistical parameters (speed, flow, density) of individuals’ flow. Fruin [
9] (1971) made a comprehensive statistical analysis of crowd movement in different scenes and put forward a model to describe the evacuation rule of evacuees by using aerodynamics. The model analogized the crowd as a fluid, applying the hydrodynamic equation to determine the change in crowd density and speed with time [
10,
11]. Henderson [
12] also believed that group motion was similar to gas and liquid motion with the property of moving fluid mechanics. On this basis, he proposed a fluid dynamics model. The principle of the model was similar to the Boltzmann equation, simulating the process of group evacuation. Lovas [
13], Thompson [
14], Watts [
15], and other researchers brought up a queuing network model [
16] as a tool to simulate the evacuation of building fire, mainly supporting the study of evacuation capacity in traffic places such as subway stations [
17]. The macro evacuation model is suitable for large-scale crowd simulation, but it neglects the interaction between evacuees and hardly describes the interaction phenomenon during the evacuation process, leading to the distortion of the evacuation process and results to some extent.
On the contrary, the micro model distinguishes the involving evacuees who have their own attributes, such as speed, direction, response time, etc., which shows the overall movement of the population through the interaction between individuals, as well as between individuals and obstacles, including the cellular automata model, the lattice gas model, the social force model, and the agent-based model.
The cellular automata model [
6,
18] and the lattice gas model [
19,
20,
21] can discretize the attributes of time, space, and pedestrian movement; synchronize the movement of many pedestrians in limited time and space; and simulate the whole evacuation process. However, the direction of pedestrian flow is constrained by spatial discretization. The main limitation of these micro models lies in their over-discretization in space and time.
Lewin [
22] came up with the theory that the change in pedestrian behavior was caused by social forces, which means that it was feasible that the pedestrian behavior rules could be transformed into motion equations; based on this, Helbing [
23,
24] put forward the initial idea of micro modeling after studying the multitudes of pedestrian behavior models and enlightening different vehicle traffic micro methods via the social force model [
25]. The model divided the forces of a pedestrian during the process of evacuation into three parts: the original driving force, the forces between pedestrians, and the forces between pedestrians and obstacles. The social force model was used to simulate many observed phenomena. Evacuees rely on the force they receive to maintain their progress and their moving direction. In various practical scenes, during the process of evacuation, there might be a situation where the path driven by forces is not consistent with the optimal path, and evacuees will be led to a longer path, or where the forces are balanced so that the pedestrian will stay still. This mechanical model makes it difficult to explain the behaviors of following, waiting, or surpassing.
The agent-based model is able to adjust its state continuously to make decisions according to the goal set by itself or the system. It was first used in artificial intelligence and its related fields [
26]. With the gradual maturity of the agent theory and the cultivation of science and technology, the application has been expanded to the simulation of crowd evacuation in various circumstances. The virtual agent is implied to simulate the movement of individuals in the actual scene to obtain relevant feedback information to formulate the corresponding measures according to the specified code of conduct [
27]. The agent-based model has a high fidelity of similarity with the actual characteristics of the pedestrian’s motion [
28]. T Korhonen proposes an evacuation simulation method in which each agent has its own individual attributes and embeds the method in a CFD-based fire modeling program [
29], and C. Natalie van der Wal created an agent-based model of an evacuating crowd. Socio-cultural factors that were modeled are familiarity with the environment, response time, and the social contagion of fear and beliefs about the situation [
30].
To realize the intellectualization of pedestrian evacuation behavior, this research establishes an agent-based evacuation model combining the mechanical model and the decision-making model. Different from the single-based mechanical social force model, the AEM constructs a real virtual entity object in behavior, integrating the individual micro behavior with the overall attribute. In this research, the AEM is applied to describe the individual behavior of the crowd, including the behaviors of following, detour, obstacle avoidance, etc., which can clearly illustrate the characteristics of crowd evacuation.
2. Theoretical Framework
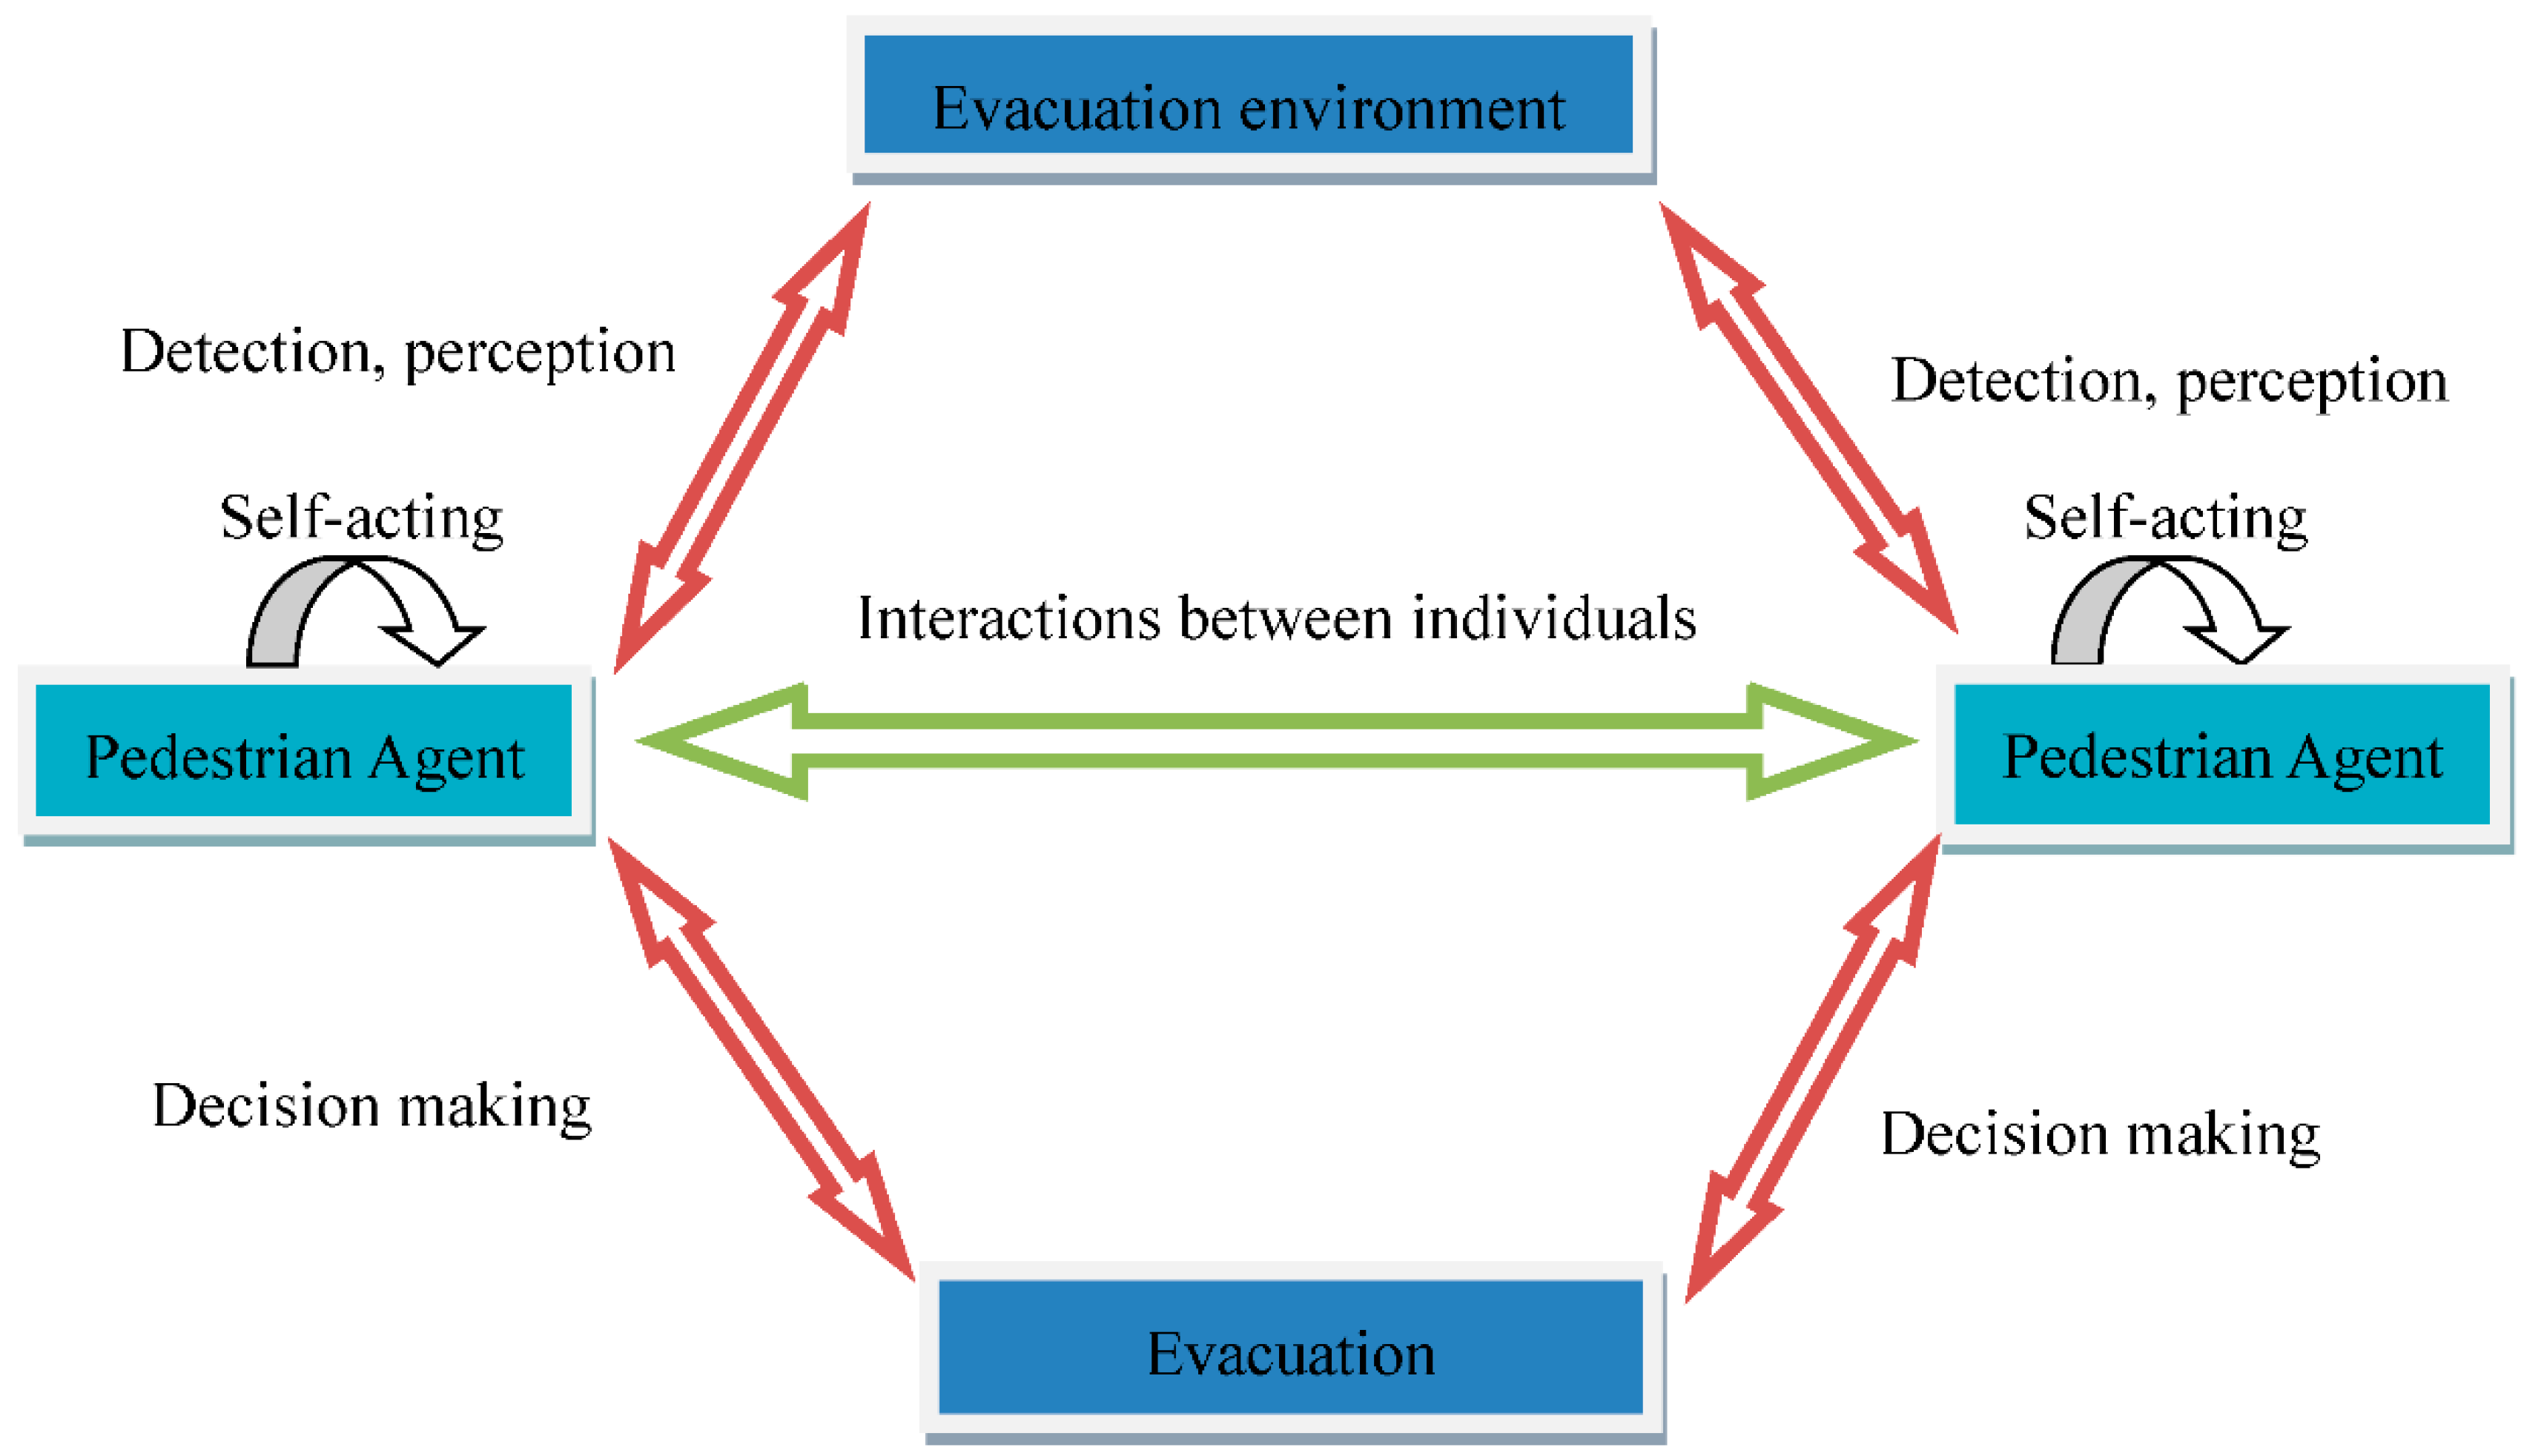
The agent was originally derived from the research on distributed artificial intelligence launched by the Massachusetts Institute of Technology in the 1970s. It was an individual with intelligence and independent behavior, which can coordinate with each other according to the state reflected by other individuals and the system in order to determine its behavior and state [
31]. Drawing on this idea, the model in this research defines pedestrians as individuals with decision-making abilities and unique attributes who can make real-time decisions according to dynamic and static information in the evacuation environment in order to determine their own evacuation behavior. See
Figure 1.
The AEM in this paper has three characteristics: autonomy, reactivity, and sociality. Autonomy is the essential characteristic of an agent which can perceive the state of its environment and its position, and its behavior is driven by the goal of safe evacuation. The AEM can control its internal state and behavior without external intervention, including the maximum walking speed, the minimum reaction time, behavioral decision-making characteristics, and preferences.
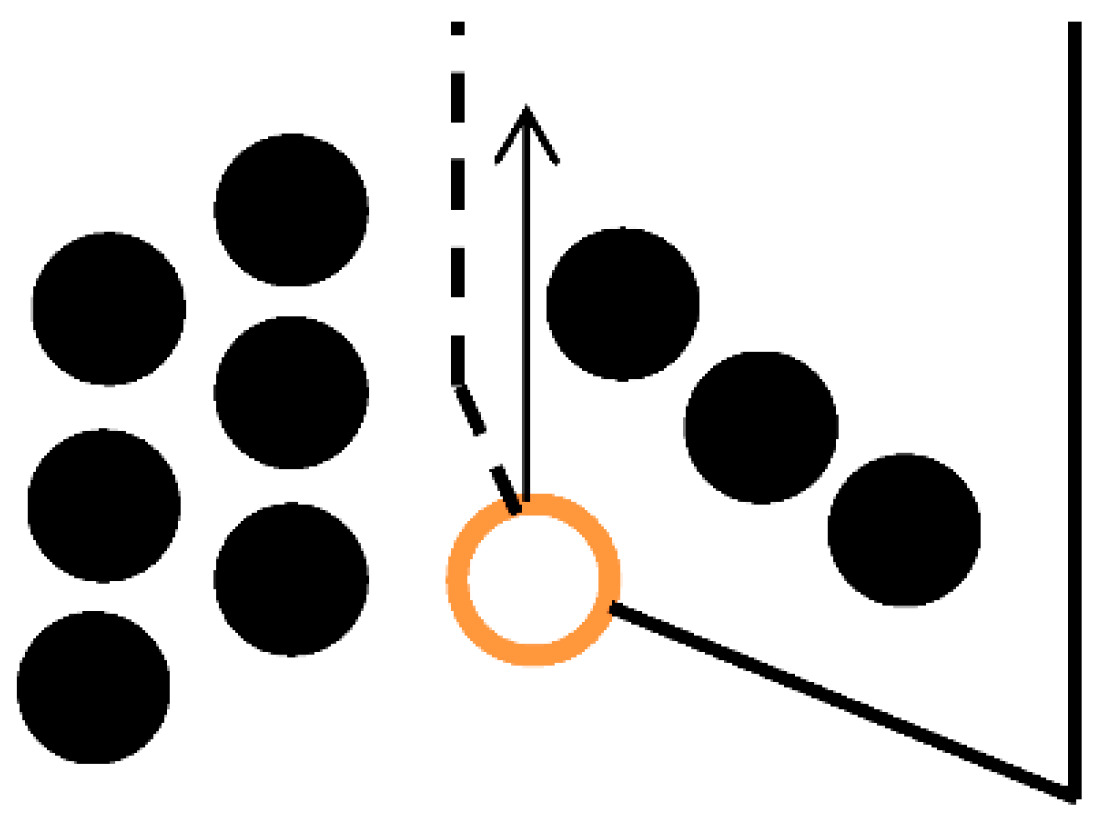
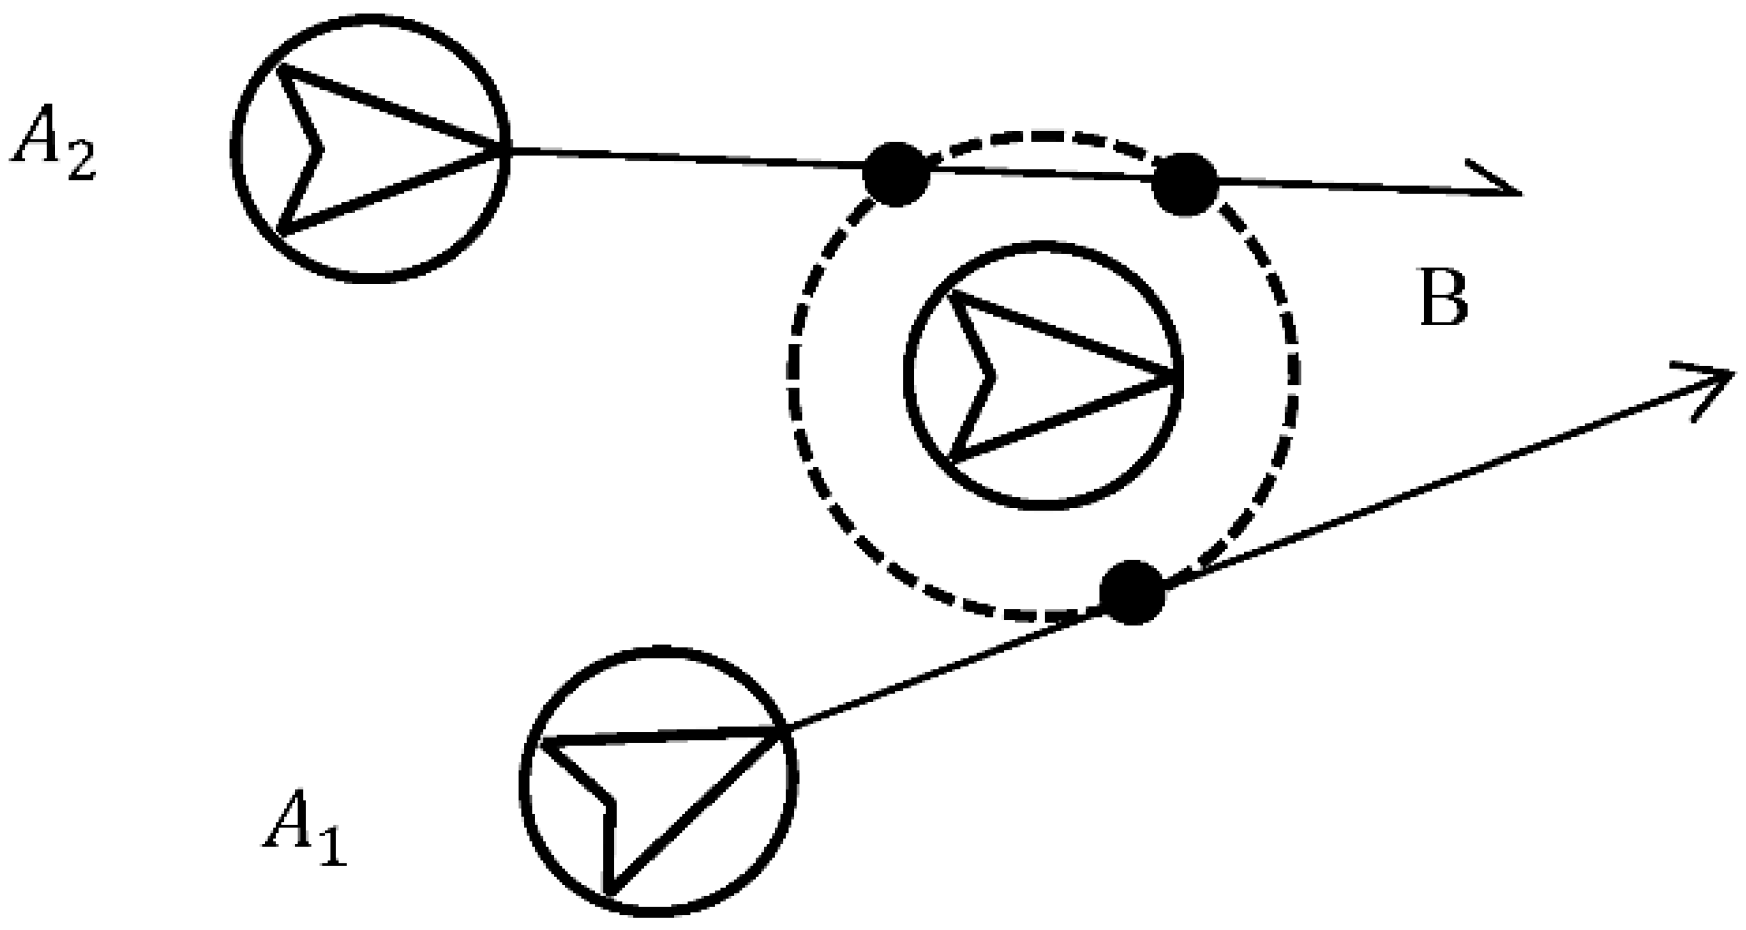
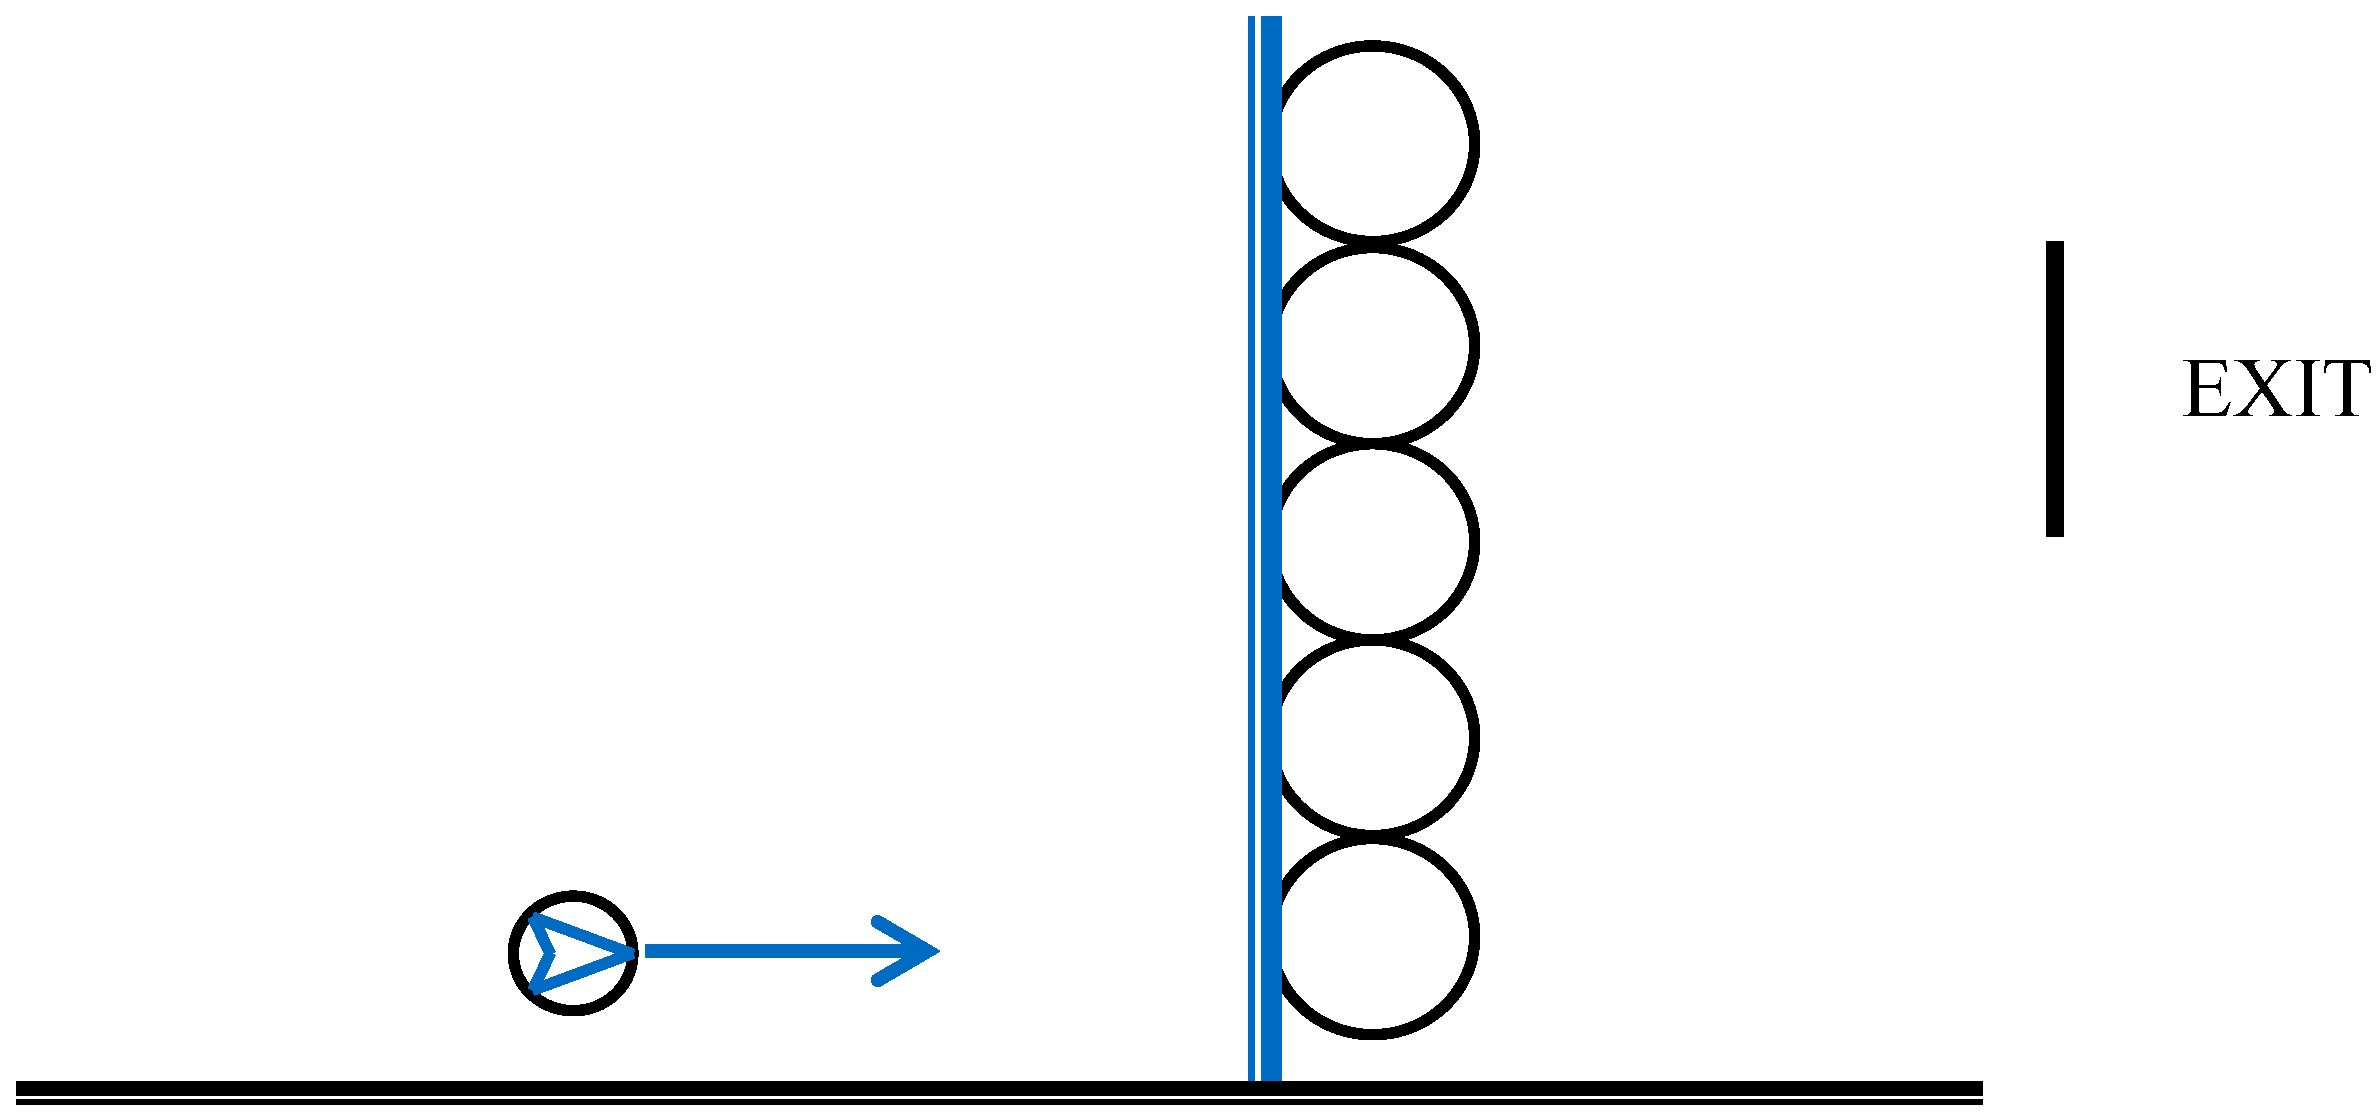
Reactivity refers to the ability that an agent determines its impact on evacuation, and responds promptly to adapt to changes in the evacuation environment by sensing the environment. The AEM sets up a detection system for the evacuation agent, through which the system senses whether there are other pedestrians or obstacles within a certain range; it then makes behavioral decisions based on different detection results, eventually taking responses to follow or avoid pedestrians or obstacles. Through this mechanism, the mechanical limitations of the social force model can be avoided to some extent. As shown in
Figure 2, the hollow circle represents the moving individually, the arrow represents the direction of its movement, and the black solid circle represents other persons or obstacles. According to the social force model, the repulsive force generated by the left side of the travel direction is greater than the repulsive force generated by the right side, so the individual needs to make a detour to the right side, as shown in the solid line on the right side. However, in reality, most people follow the shortest path and choose the path shown on the dotted line. To avoid unnecessary behavior, the AEM makes optimal decisions and takes appropriate actions by sensing the environment so that most pedestrians can follow the optimal path in the process of evacuation.
Sociality means that the evacuees do not exist independently, and they exchange information and coordinate actions with other agents at the evacuation scene. Multiple agents can also form an evacuation group.
According to the above characteristics of the agent, this paper establishes an agent-based evacuation model based on the kinematics model, the core component of which is a detection algorithm and behavioral decision making used to imitate pedestrians’ walking decision-making and motion patterns.
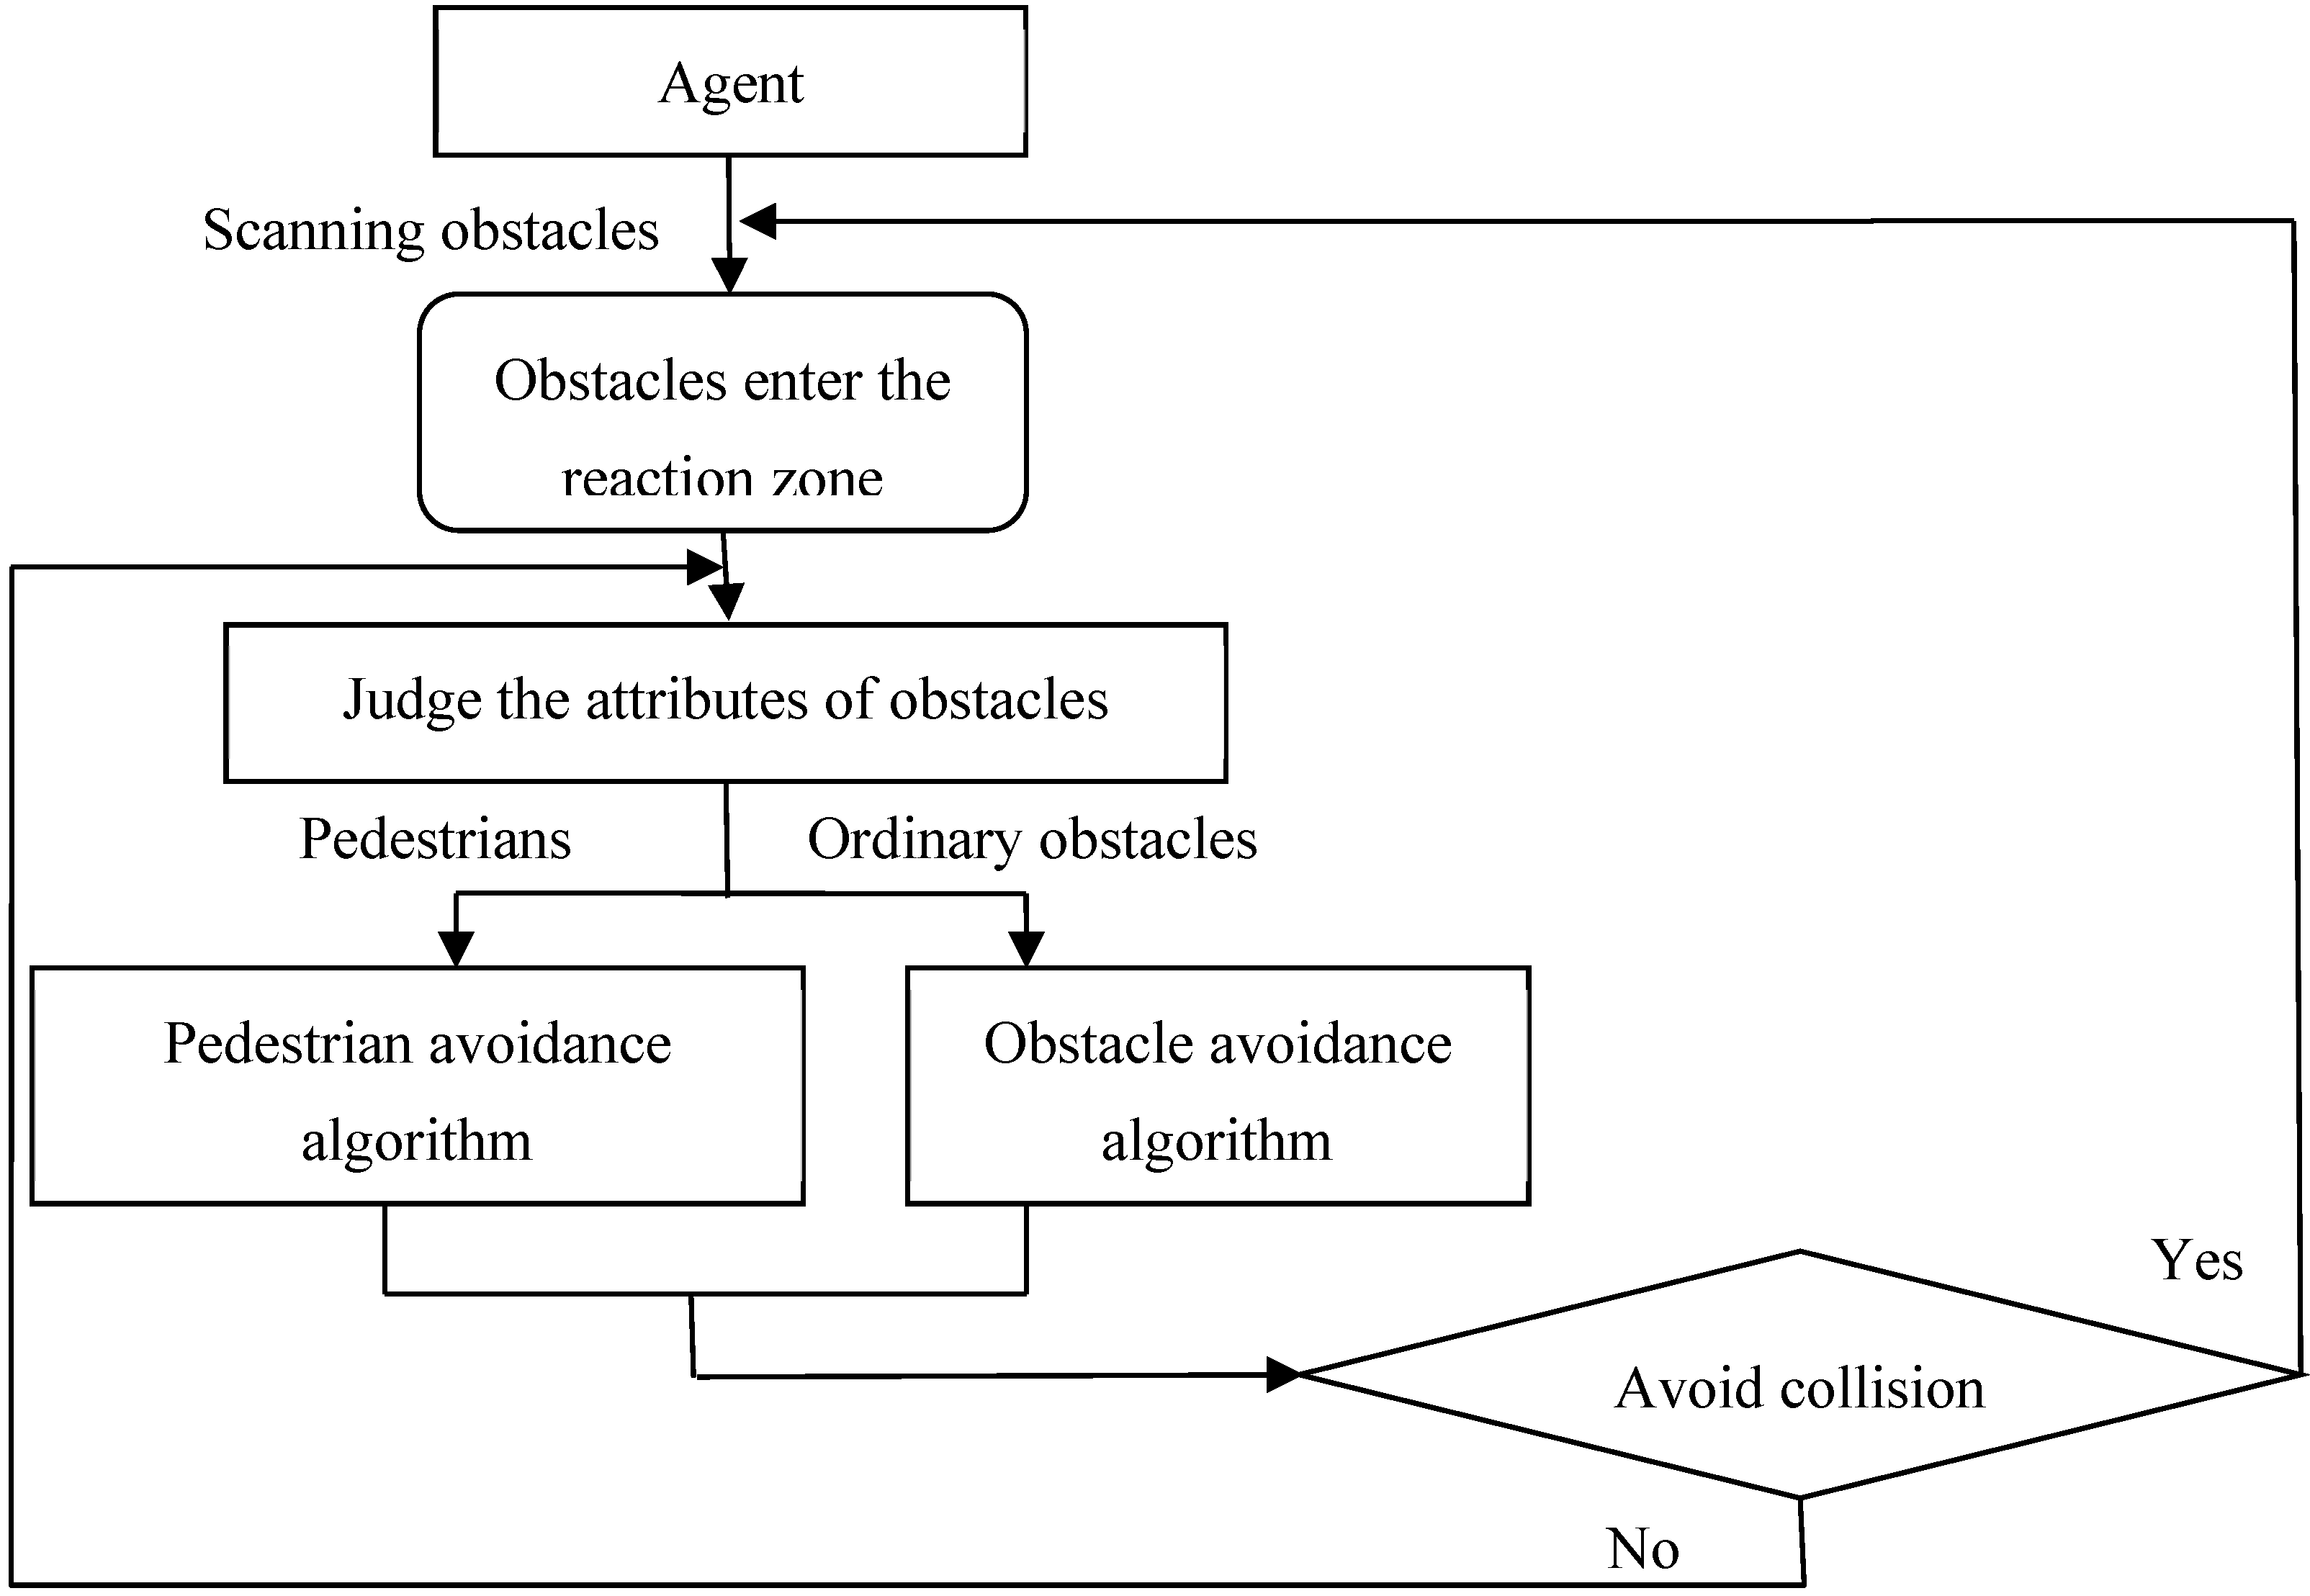
3. Basic Algorithm of the AEM
The general behavior process of pedestrians in the evacuation process can be concluded as follows: first, determining the general direction of evacuation and perceiving the surrounding environment visually or in other ways when walking. When other pedestrians or obstacles are found, predictions are made based on whether there will be a collision according to their speed; the countermeasures are decided, such as detouring and following; and then the first step of the general direction decision is returned to. Therefore, the AEM is also carried out according to the above process in the evacuation process: (1) firstly, a certain detection range is divided according to its motion characteristics and the surrounding environment is detected; (2) the agent detects the obstacle and judges the attributes of the obstacle. After it enters the reaction zone set up to avoid the collision, the agent makes a behavioral decision and invokes the corresponding algorithm to behave as detouring or following. If the agent successfully avoids obstacles, it will return to the first step and move forward. If obstacle avoidance is not successful, the model continues to call the relevant algorithm to avoid obstacles. The basic operation process is shown in
Figure 3.
3.1. Kinematics Model
The agent follows Newton’s second law while walking, so the basic dynamics equation is:
where
is the mass of the pedestrian
;
is the resultant force of the pedestrian
; and
is the vector formula of the moving direction.
It can be assumed that the current coordinate position of the pedestrian is (
) and the desired target position is (
). Then,
can be described as Equation (2):
where
is the driving force that pedestrians are subjected to,
is the repulsive force on the pedestrian
, and
is the steering force that the pedestrian α receives.
is a function of selecting the obstacle
, which is the obstacle requiring priority processing in its detection range.
is the direction of steering,
B is the set of all obstacles within the detection radius, and
represents the positional relationship of other obstacles in
with
. Equations (4)–(6) below provide further descriptions of the parameter variables of Equation (3).
The driving force is determined as Equation (4):
where
is the maximum speed;
is the desired direction;
represents the actual speed;
is the desired speed; and
represents the response time.
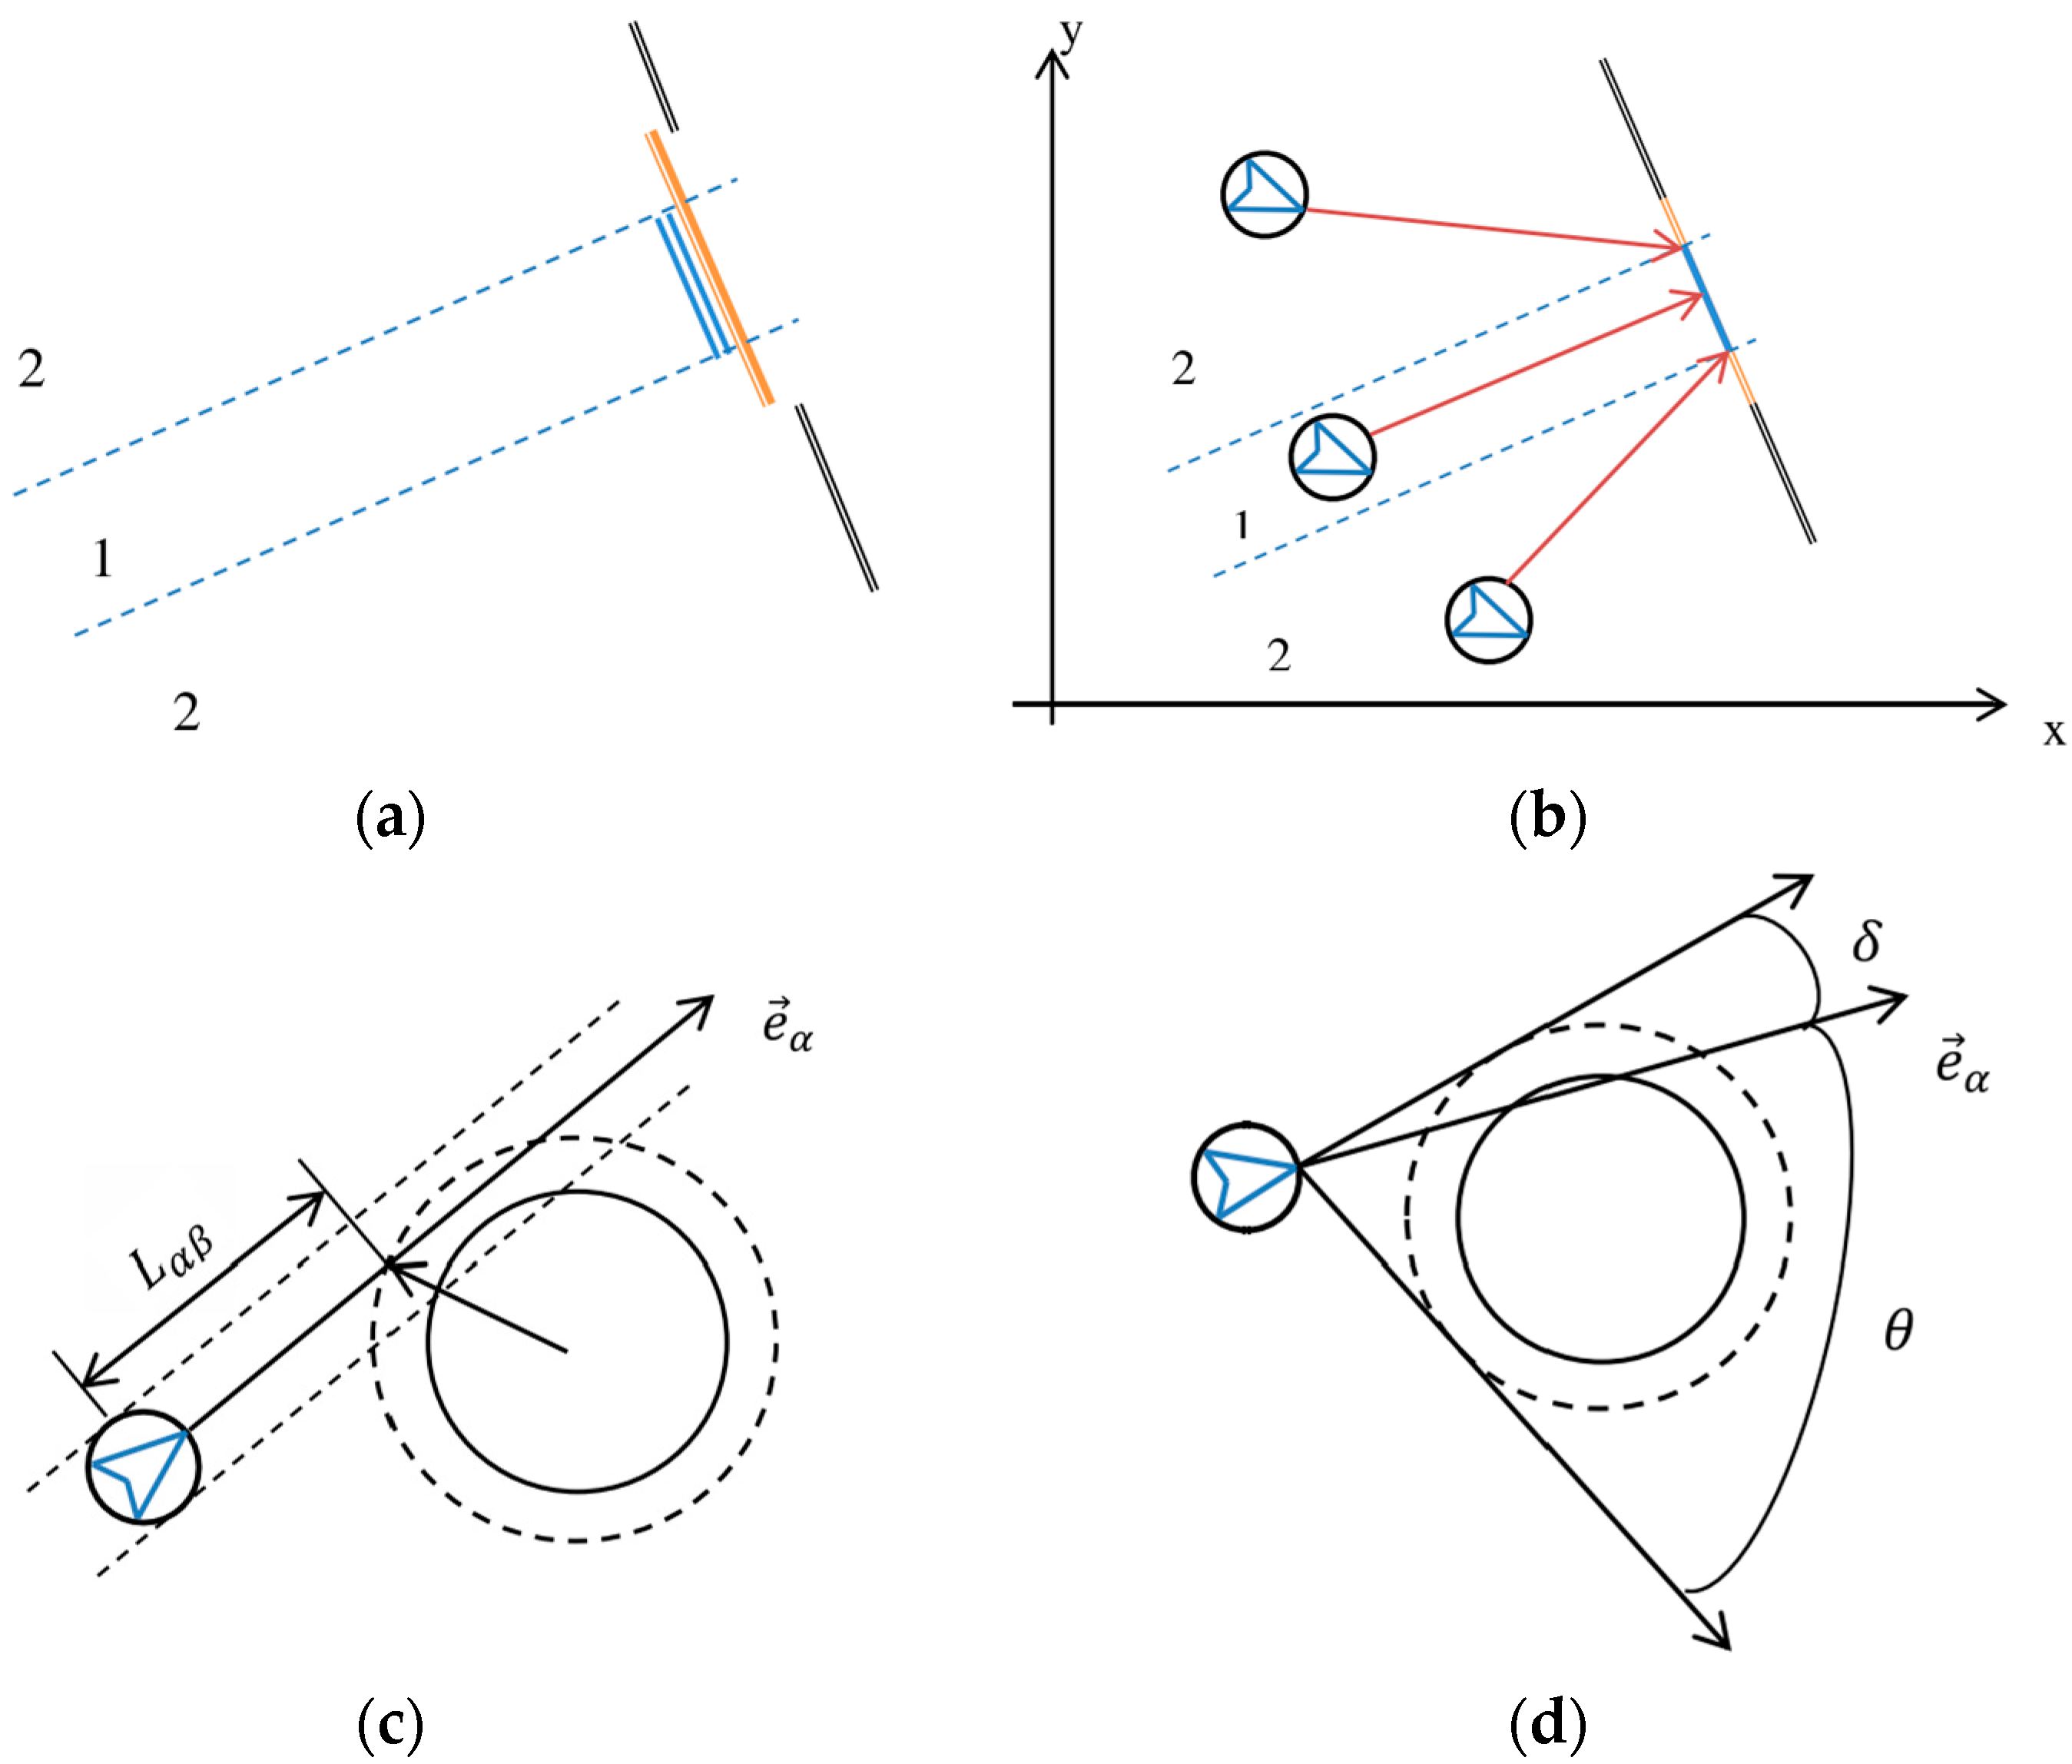
Personnel in the process of constantly walking by the exit of the attraction drive to ensure that they do not deviate from the correct direction of travel. At the same time, different positions of personnel to exert the attraction of the point location are also different. As shown in
Figure 4a, the area is divided into two parts, and the coordinates of the points corresponding to the attraction forces are determined differently in different parts. For the person in area 1, the location of the attraction applied by the exit is the forward projection point on the exit, and for the person in area 2, it is the attraction point on his or her side. The endpoints of the attractive force range on the side where they are located, as shown in
Figure 4b.
The endpoints of the attractive force range on the side where they are located, as shown in
Figure 4b. The repulsive force is applied to prevent collisions, and the magnitude of the applied force is related to the position of the pedestrian
α with respect to the blocking object β relative to their position. As shown in
Figure 4c, the radius of the circular obstacle plus the concentric dashed circle of the radius of the personnel The direction of travel of the personnel is
; moreover, in order to avoid collision with the obstacle without turning to avoid the premise, it is necessary to decelerate to zero within a distance
. The repulsive force can be described as Equation (5).
where
represents the current speed.
represents the minimum distance in which a pedestrian is an agent to an obstacle element in the direction of moving.
represents the reaction time of the pedestrian.
is the component of
in the
direction, and subtracting this can prevent the repulsive force from being offset by the component of the driving force in that direction. The steering force is shown in Equation (6):
is the force applied in the direction of moving to avoid the obstacle, which can be guaranteed to accelerate to the maximum speed during the response time. A is a two-dimensional matrix, representing a rotation of
counterclockwise by a δ angle. As shown in
Figure 4d for the pedestrian
α, there are two directions to avoid the obstacle by steering choose, and the specific one can be determined by the function
, and choosing different directions corresponds to different deflection angles and different deflection forces. The rotation matrix is shown in Equation (7):
The steering force does not always exist when the agent walks, and it will be active according to the behavior of the detection result of the surrounding environment. When an agent detects an obstacle or other agent, it will make a behavior decision to bypass, wait, or follow. These behaviors have a lot to do with the personality characteristics of pedestrians. The model assigns the agent-to-personality features through a random number generation function (Equation (8)), and the generation of random numbers conforms to the standard normal distribution. When the character of the evacuation person is initialized, the individual will be set to a mild or aggressive attribute according to the numerical value of the random number.
3.2. Detection Algorithm
In the AEM, a whole circle is used to represent an evacuated individual, in which the diameter of the circle is determined by the length of the shoulder width of the individual. Using 40 cm as the default diameter for pedestrians in this model, the individual diameter values are not fixed and can be adjusted according to needs.
Under normal circumstances, pedestrians perceive the surrounding environment through vision. Safety ergonomics state [
32] that when a human being is stationary, the binocular viewing area will be approximately 60° or so. Pedestrians can expand their viewing angles by slightly deflecting their heads during walking. Therefore, it is possible to set the agent-based to obtain a field of view of 90° on the left and right sides only when the body is not rotated; with this in mind, in the model, the scanning detection angle of the agent in the forward direction is set to 180°.
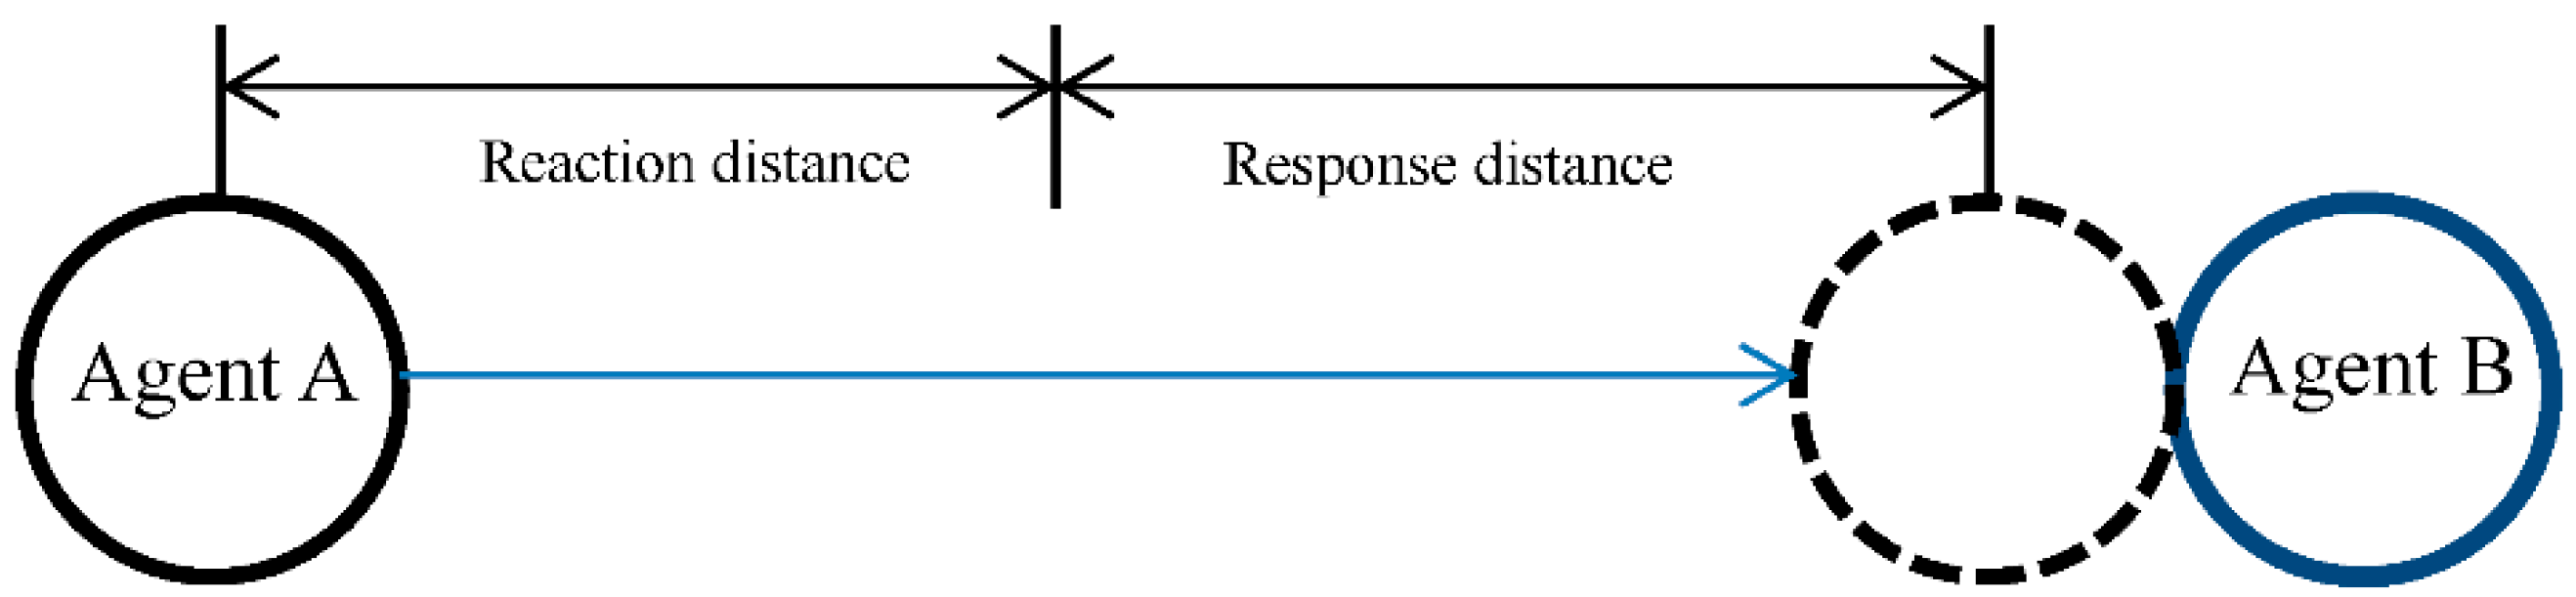
The setting of the detection range of the agent-based is mainly considered from the viewpoint of avoiding a collision. Under normal circumstances, people need to consider the safety distance with other people and obstacles while walking, especially when the speed is faster and the safety distance is shorter, but the collision will occur because there is no time to slow down or turn. The pedestrian’s safety distance is determined by its speed and reaction time. In traffic engineering, it is described that the driver needs a minimum of 0.4 s of sensation–reaction time before starting the braking. The braking effect is 0.3 s and the total braking process is 0.7 s. In this paper, some parameters in Pathfinder are used to calculate the safe distance. Pathfinder’s technical documentation gives
; in other words, it takes 0.5 s to slow down from the maximum speed to zero, so the total reaction time plus the response time is about 0.9 s. The reaction distance and response distance corresponding to the reaction time and the response time are both shown in
Figure 5.
3.2.1. Detection Range
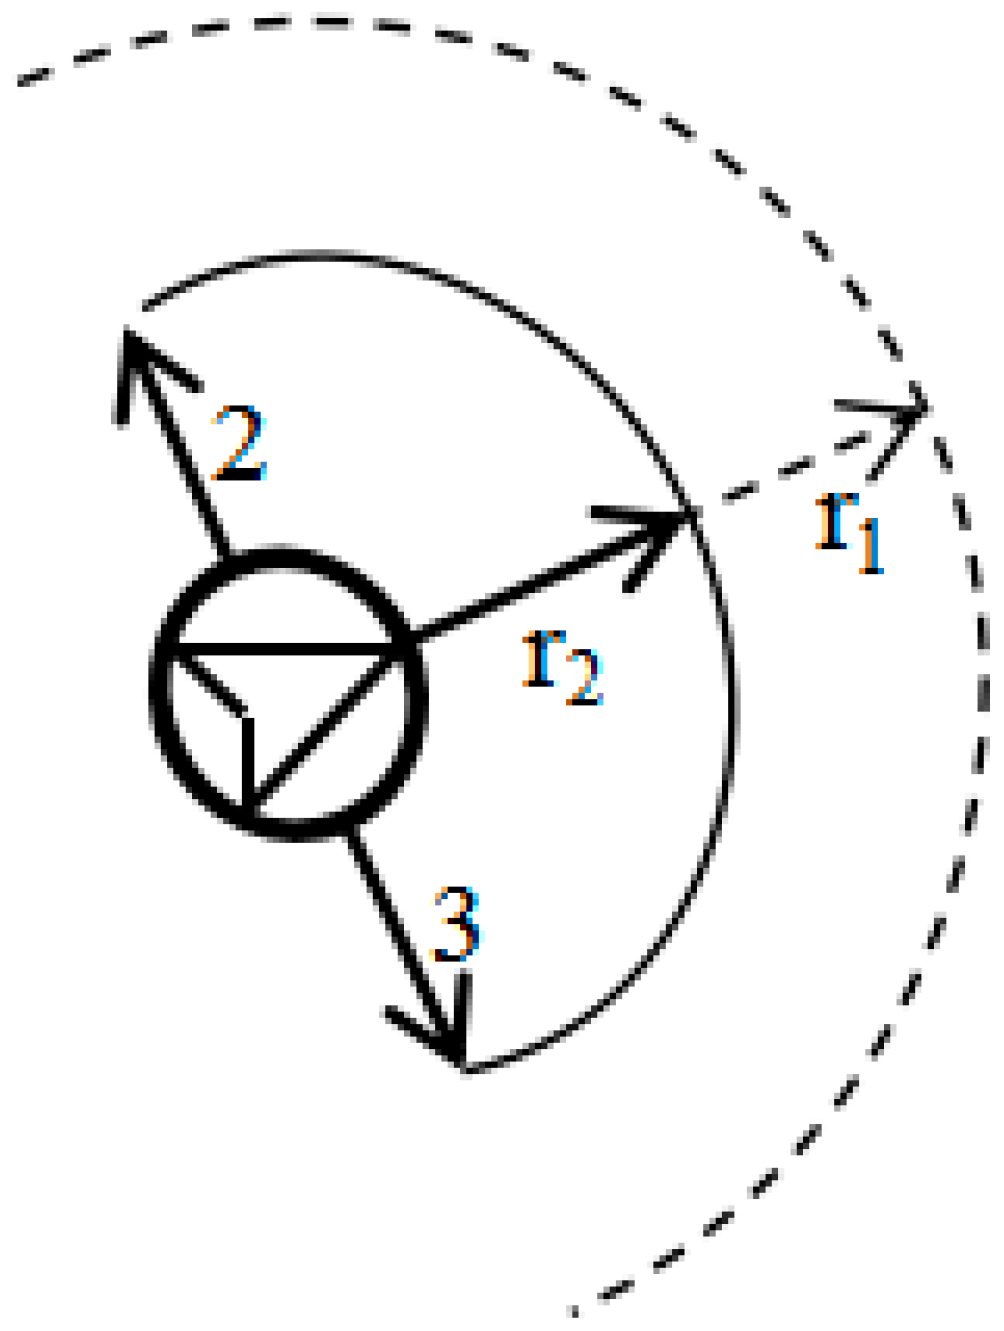
Based on the above ideas, a detection model of the AEM is established (see
Figure 6). The circle in the figure represents the agent, and the internal arrow is its current direction of motion. Arrows r
1 and r
2 represent the detection distance along the current direction of motion, the length of which varies with speed. Arrows 2 and 3 mainly detect lateral obstacles, and the length can be set to a fixed value.
At each time step of the program running, the agent determines whether there is an obstacle in the way by sensing the surroundings within the detection range and then formulating the subsequent measures. The detection range of the evacuation agent is the semi-circular arc whose radius is the radius of the detection center, as mentioned before, while the horizontal field of view is about 180° when the person is moving forward without rotating the body and only slightly deflecting the head; simultaneously, it also simplifies the calculation.
As shown in
Figure 6, the actual detection radius depends on two factors. One is the dynamic detection radius
determined by its oelocity, which varies with the change in velocity; the other is the fixed ength detection radiu
, which is related to visibility.
3.2.2. Obstacle Detection
The purpose of obstacle detection is to determine the obstacles that the agent needs to prioritize. Secondly, through the detection process, the distribution of obstacles in the direction of advancement is summarized and used as the basis for making decisions based on subsequent walking behavior.
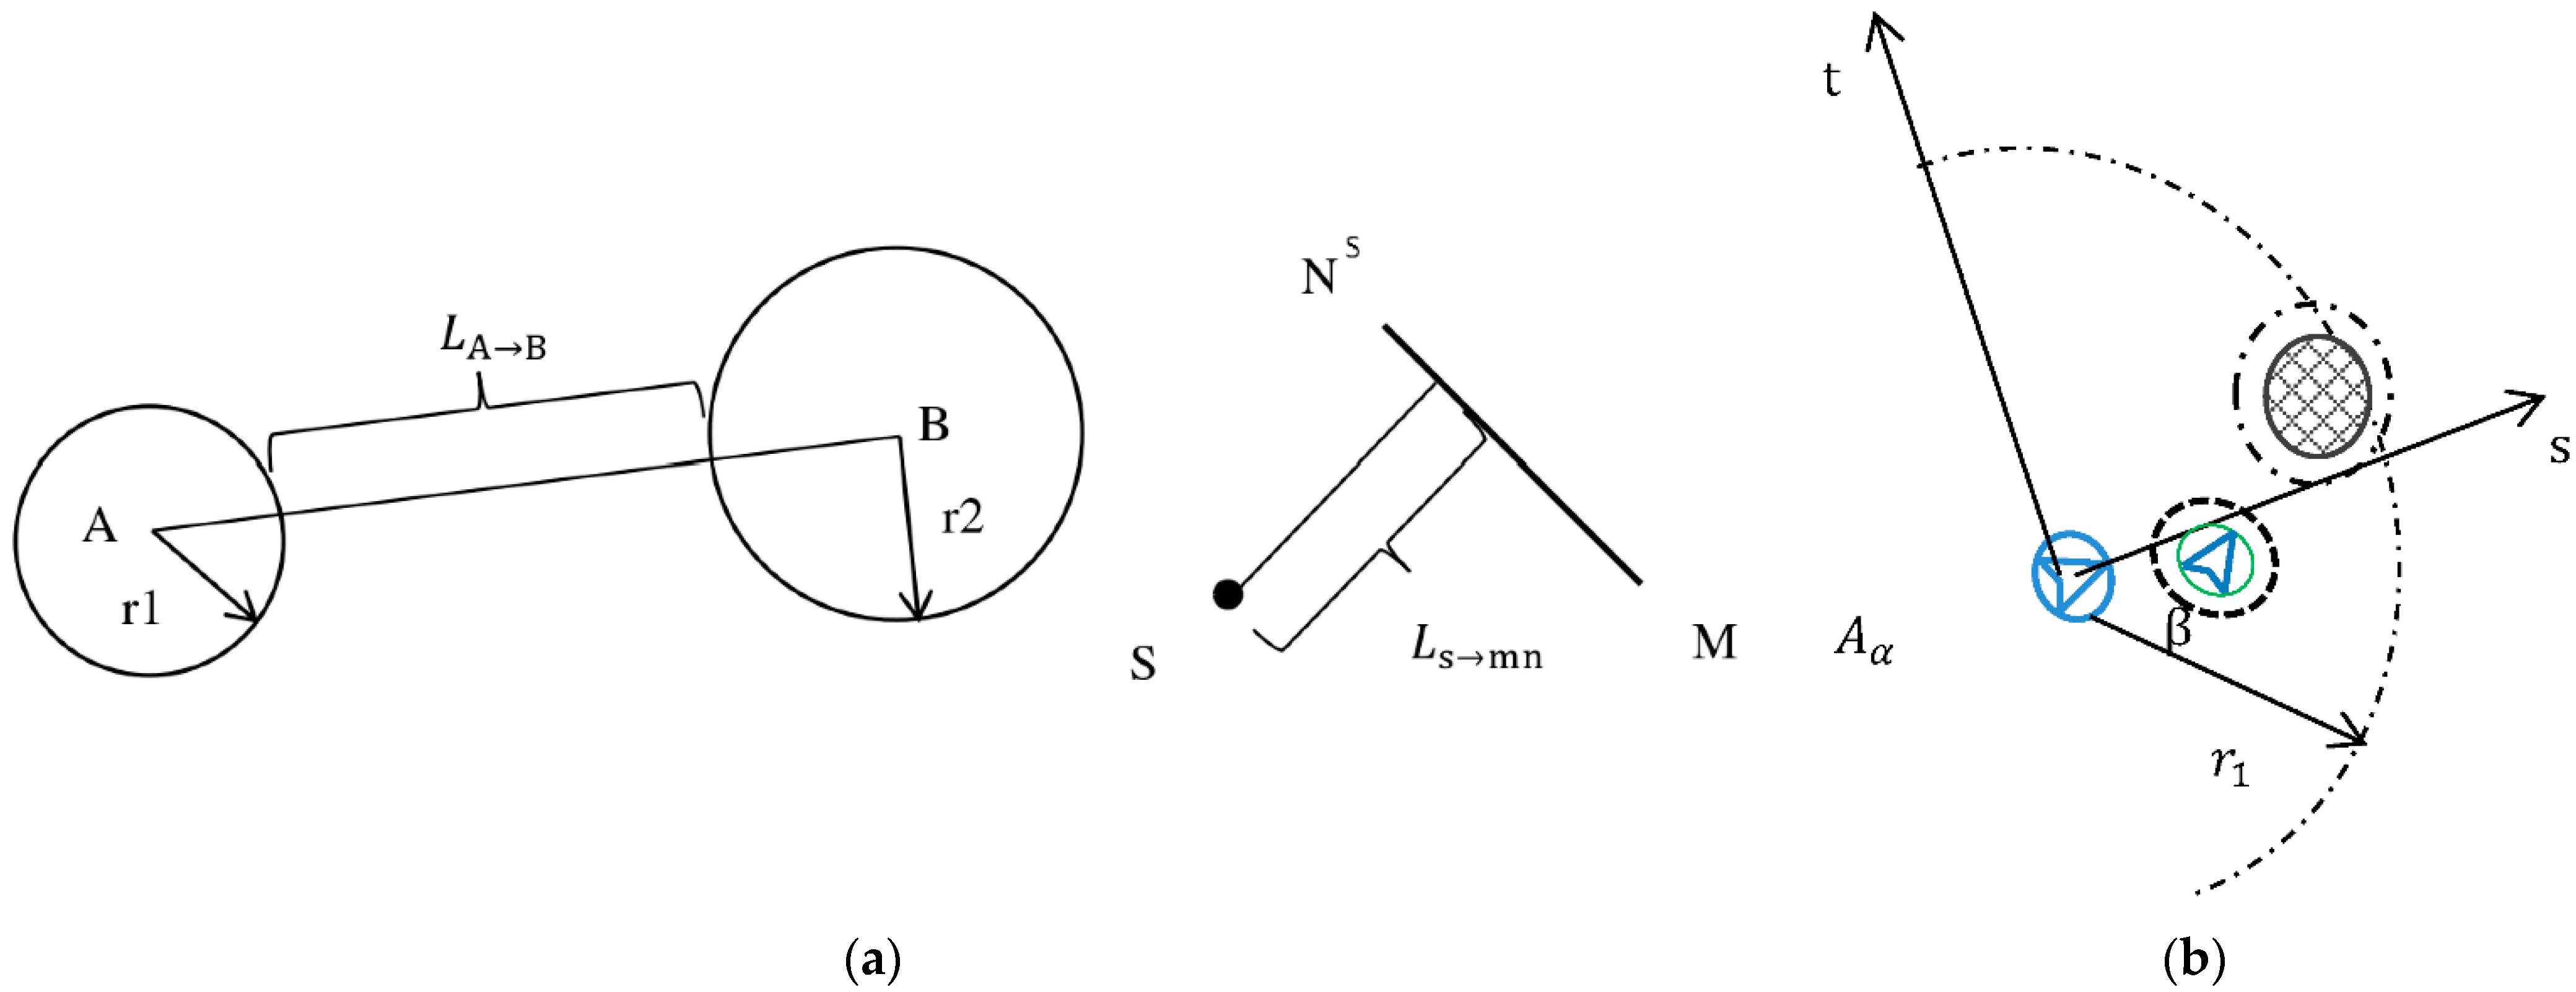
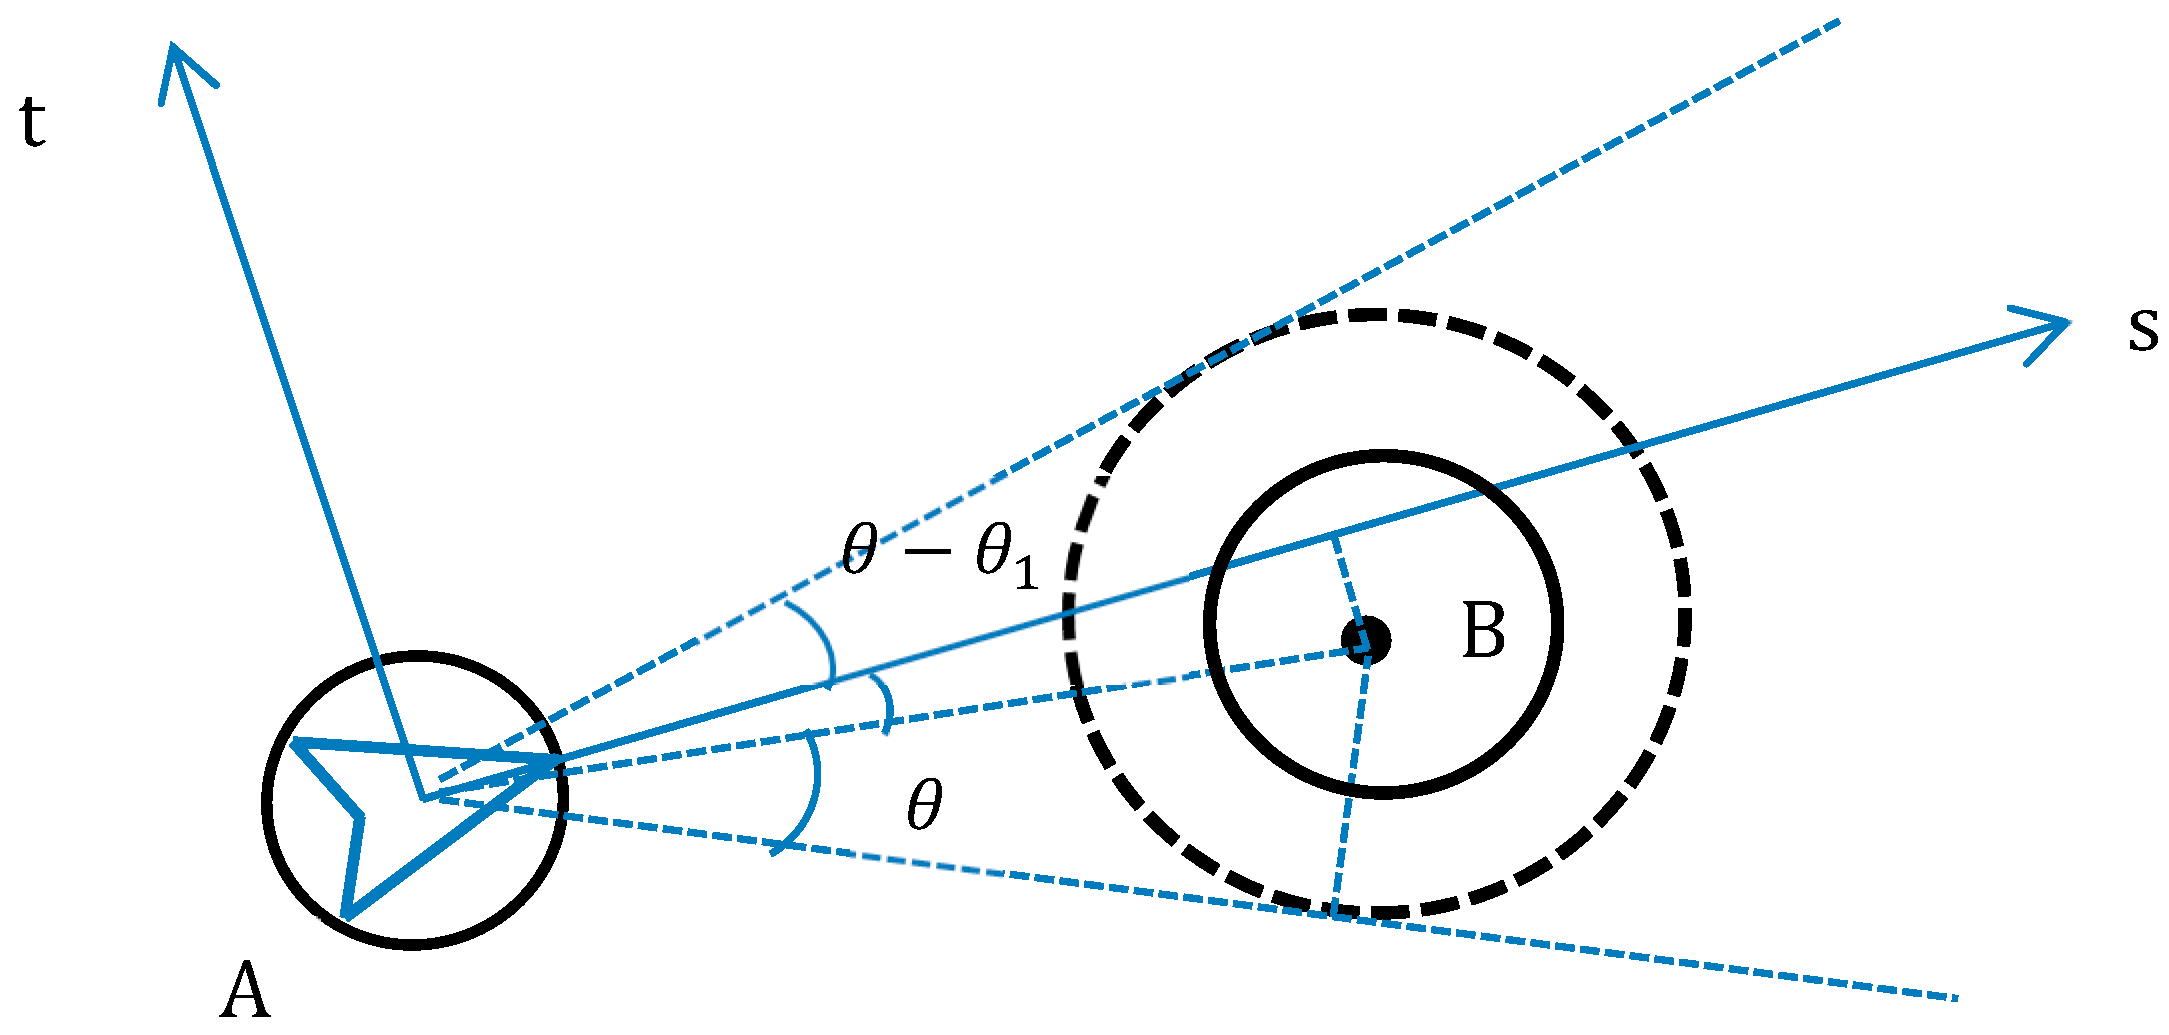
In order to determine whether there are obstacles in the detection area, two sets of coordinate systems are established (one is the global coordinate system XY and the other is the local coordinate system st). The XY global coordinate system is transformed into the st local coordinate system by rotating angle θ, where the s axis is the forward direction of the agent. The point P (x, y) in the original coordinate system is transformed into (s, t) in the new coordinate system after the transformation.
When detecting obstacles, this research simplifies all obstacles (except walls) into circles to reduce computational difficulties. Therefore, the question of whether other pedestrians or objects are within the detection radius is linked to figuring out the distance between pedestrians or pedestrian and objects, i.e., the distance between the circles or the circle and the line segment.
It can be assumed that the center coordinates of two circles are
and
with radii
and
, respectively. The distance
between the two circles is as follows:
If the center point of an agent is
, the starting point of the line segment of the wall is
and the end point is
. Then, the vertical distance from point S to the wall is:
The distance between two circles and the distance from the point to the line are shown in
Figure 7a, The individual
is stored in the set
by the detection radius of
r1, and the contents that meet the conditions are stored in the set
.
i represents the number of elements in the set, and the elements in the set need to be conditionally filtered, and the walls are not included in the set. The satisfied conditions contain the following.
1. The obstacles and pedestrians detected by the individual are stored in the set , where I represents the number of obstacles and pedestrians in the set;
2. If the obstacle element satisfies the s-axis coordinate greater than 0 in the st local coordinate system, it is stored in the set , where j represents the number of elements in the set j ≤ i;
3. The obstacles that have a direct influence on the direction of travel of in the set are filtered out, i.e., the absolute value of the t-axis coordinates of the element in the local coordinate system is smaller than the radius of its own plus the radius of , and is stored in the set , k ≤ j;
4. According to the above algorithm, the obstacle element closest to
in the set
is determined and labeled as β.
Figure 7b shows the calculation schematic diagram, and the individual in the green border is the nearest individual to
.
3.3. Behavioral Decision Making
In the model, the moving direction is decided by the environment and the evacuees’ characteristics instead of being driven by force. For example, if a person moves in the same direction in front of the pedestrian, the social force model will generally exert a force on the pedestrian to avoid the person in front, which makes it difficult to flexibly simulate the following, waiting, or surpassing behaviors. However, in reality, pedestrians will make different decisions according to the characteristics of the evacuation environment and their conditions after encountering obstacles. Some prefer to follow or wait, some prefer to go beyond, and some choose the direction with a lower personnel density. Therefore, the AEM presented in this research is a combination of the social force model and the decision-making model to simulate evacuation behavior more realistically.
In the AEM, after the agent detects the nearest obstacle element, it will adopt the strategy of following, circumventing, or transcending. As for the direction of circumventing or transcending, it will take the density of personnel within a certain range as the decision basis. The agent will decide the direction of the next step according to the density distribution of obstacles in the front and the weight of the position, reflecting more intelligent pedestrian decision making. The calculation of the obstacles’ density aims to calculate the distance between the obstacles in the set
and the agent
except for the nearest pedestrian
, as well as determine whether it is located above or below the x-axis in the local coordinate system. The qualified obstacles can be seen in
Table 1.
In
Table 1,
, and
are integers that represent the number of people, and the sum value of them should be less than or equal to
i − 1. D
1 is the distance between the agent
and another obstacle, and D
2 is the sum of the radii of the two agents + the diameter of
.
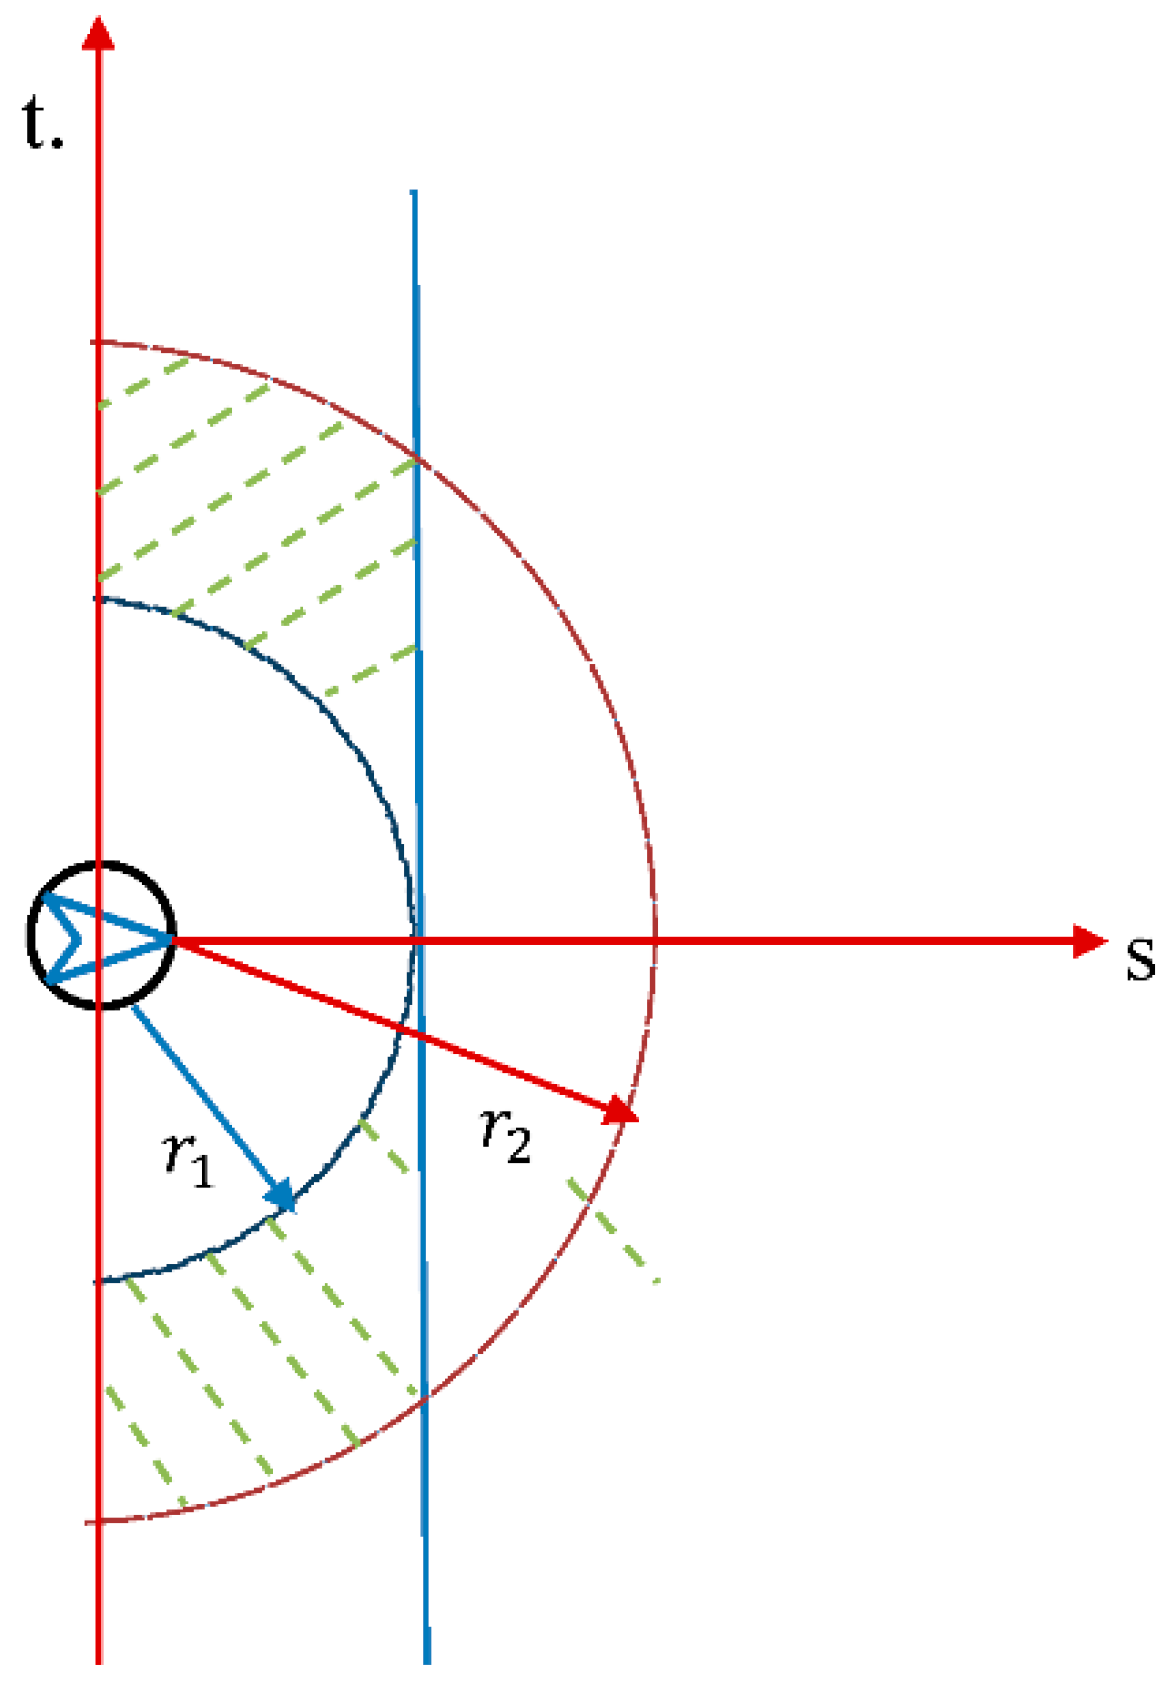
In addition to reacting to obstacles in the range of
r1, the agent
may also choose the direction of detour according to the distribution density of obstacles in the field of vision. Therefore, besides counting the number of people in the detection range of radius
r1, it is necessary to detect the range between
r1 and visibility
r2. However, since only the direction of the detour is judged, it is not necessary to detect the front side. Therefore, it is only necessary to perform the detection and statistics on the shaded portion in
Figure 8, and the result is shown in
Table 2.
The statistical information can be summarized and different weights can be assigned to the number of different locations, as shown below:
and
are the different weight values, respectively, where
and
.
By comparing the values of Sup and Sdown, the density of people around the agent can be judged. If the values of Sup and Sdown are both large, it can be shown that the pedestrian density in the direction of the agent moving forward will be relatively large, and there will be little space to bypass within the visible range, so the agent will choose to follow the forward agent to move on.
When the values of Sup and Sdown are both small, which means that there is a small density of people around the agent , there will be enough space to bypass or surpass, but the choice to bypass, surpass, or keep following depends on the personality attribute of the agent. In this case, the probability is introduced to assist evacuation decision making. When initializing evacuation attributes, agents are set to mild or radical attributes according to the values of random numbers.
3.3.1. Algorithm for Avoiding Pedestrians
After the agent detects the pedestrian in front, it will adopt a strategy of following or bypassing. This section discusses the algorithms of these two behaviors in detail.
Algorithm for Following
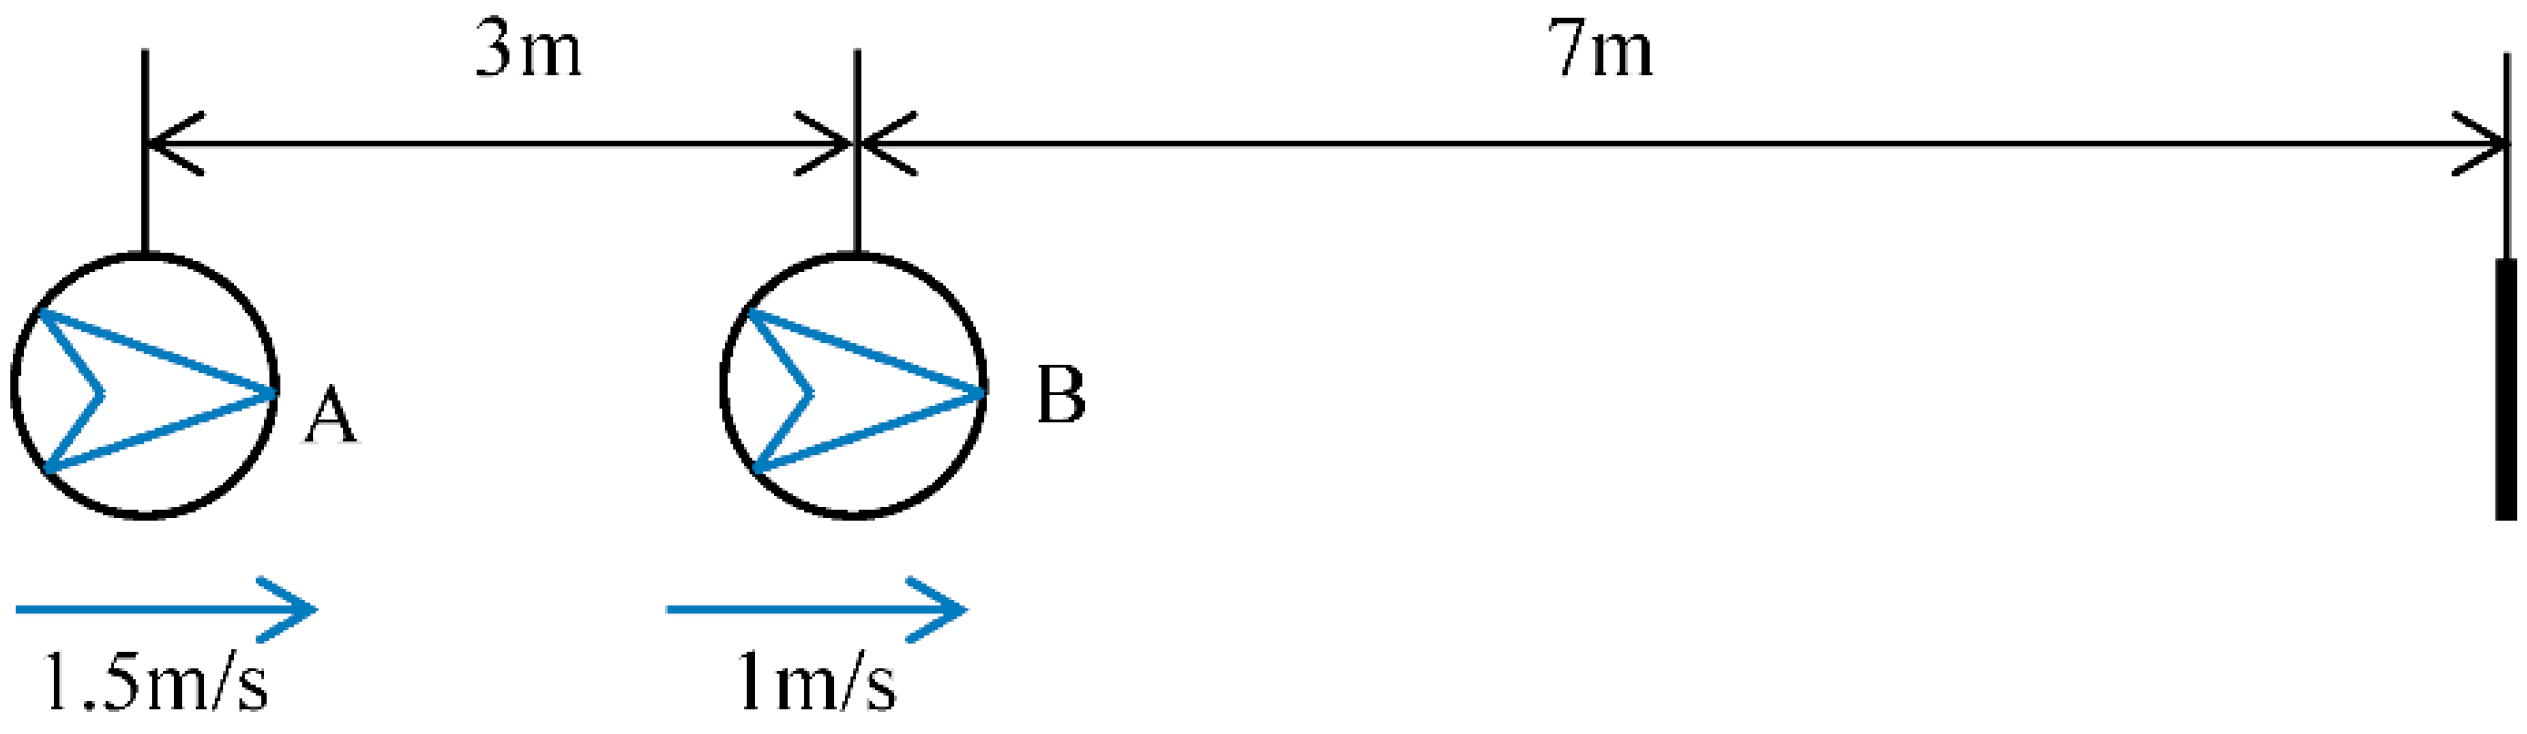
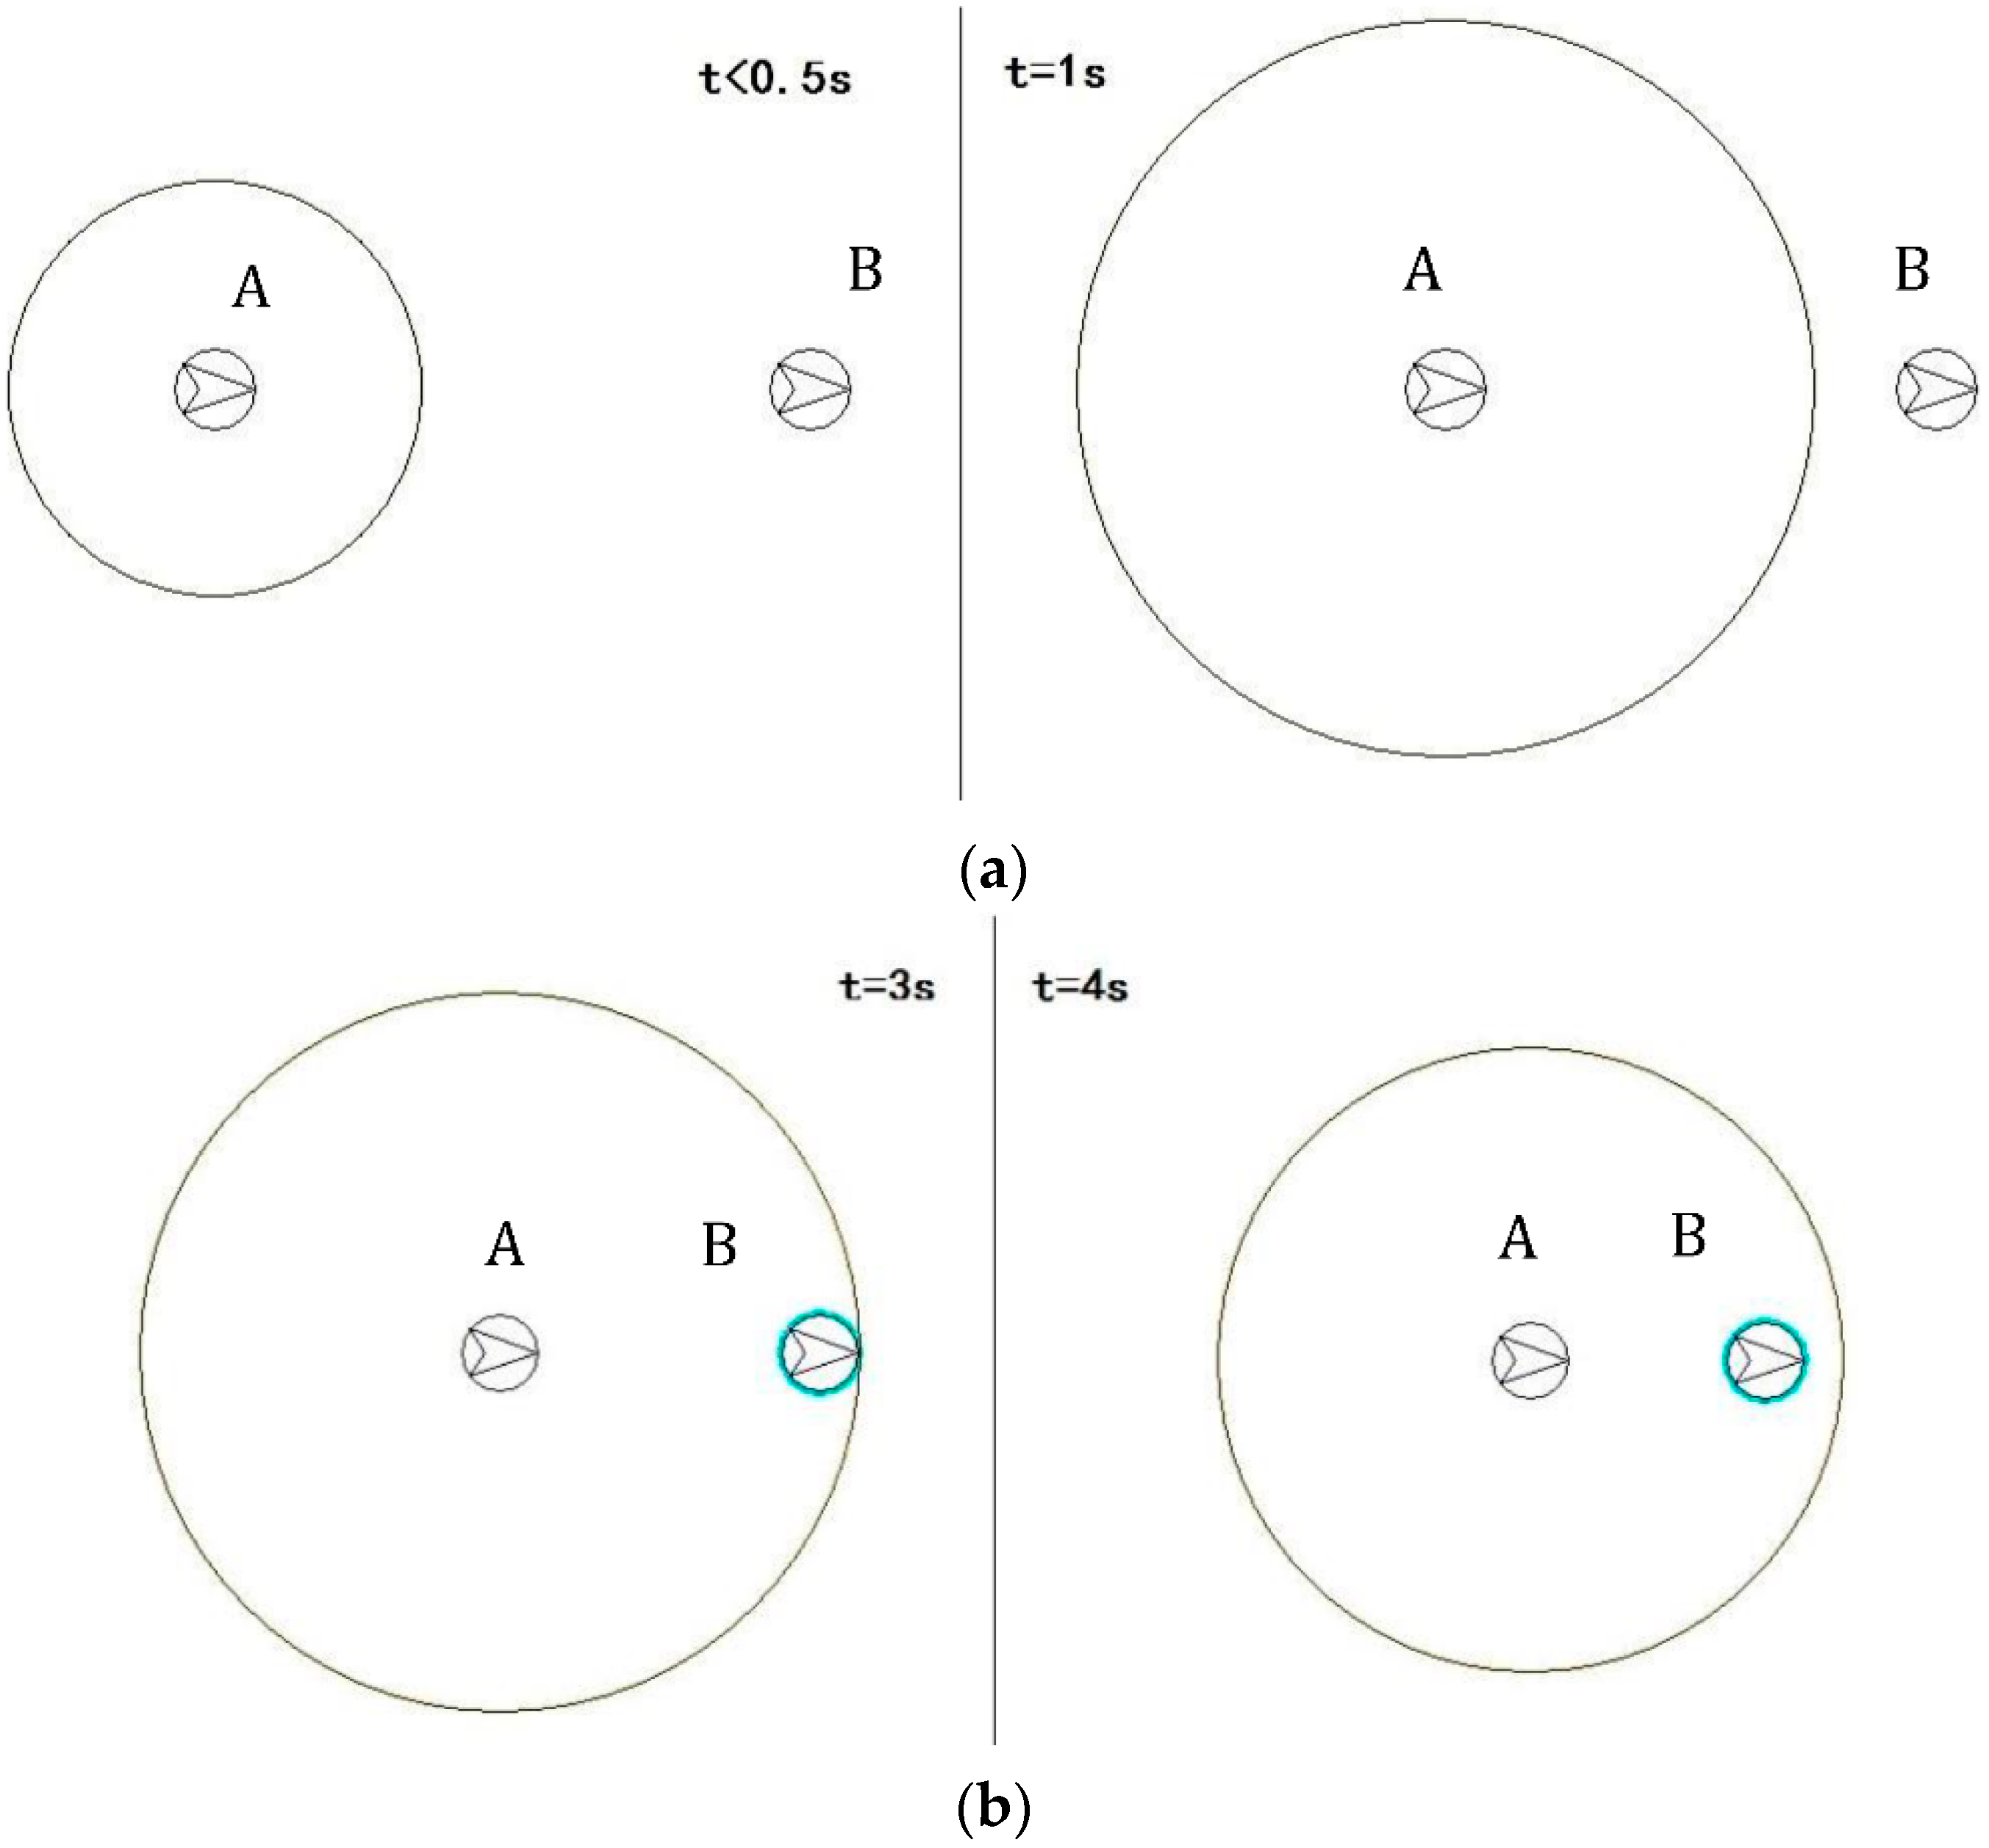
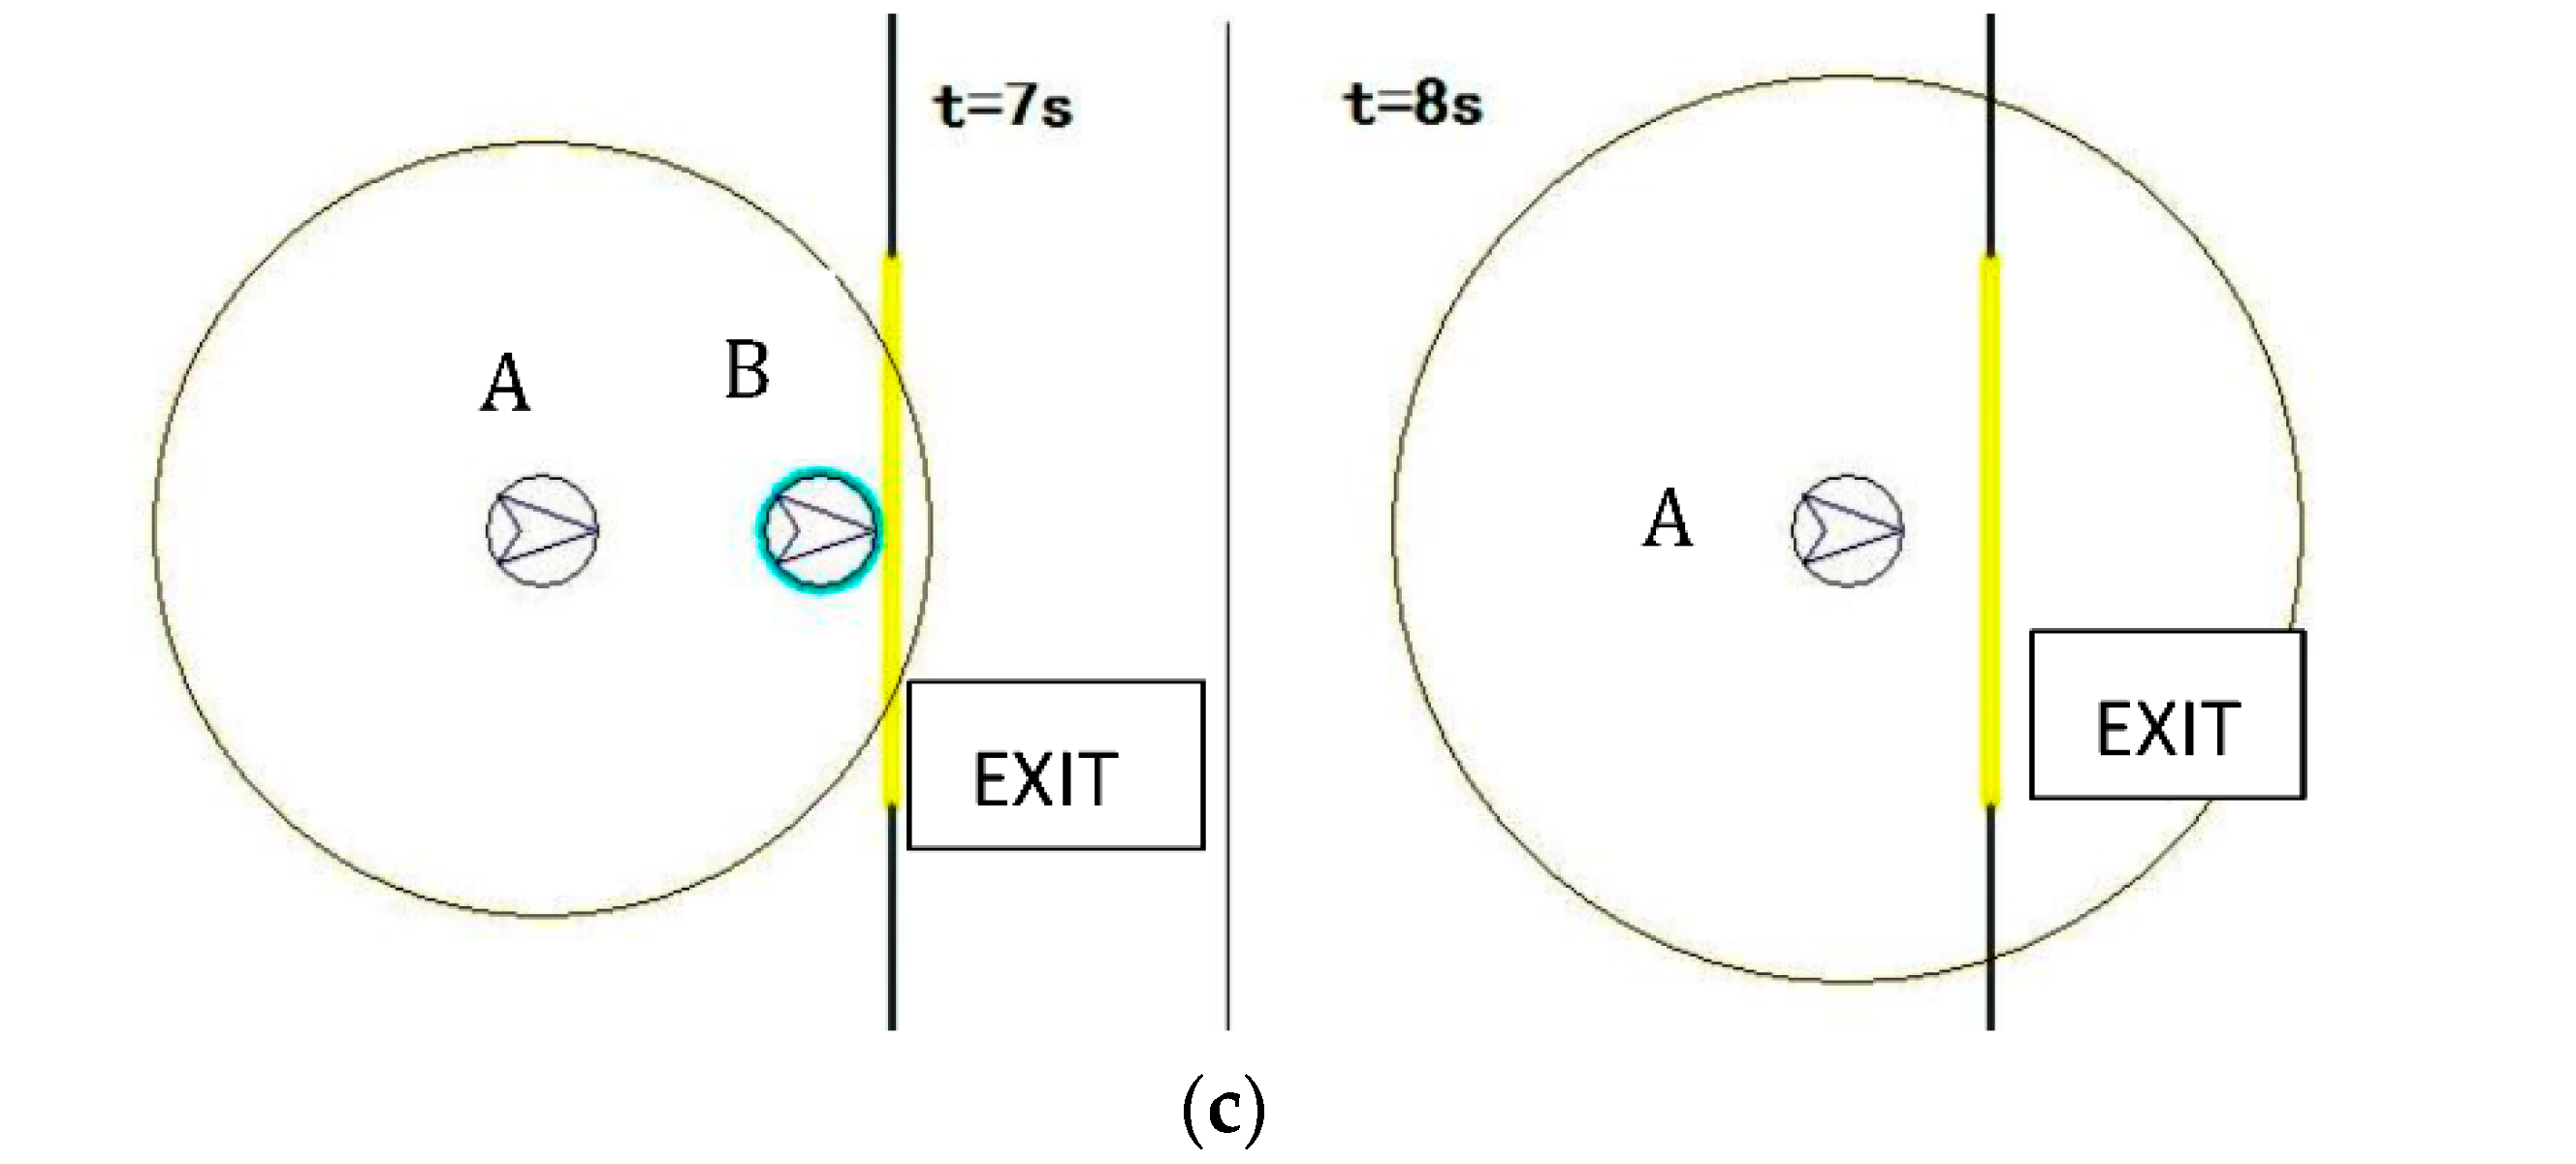
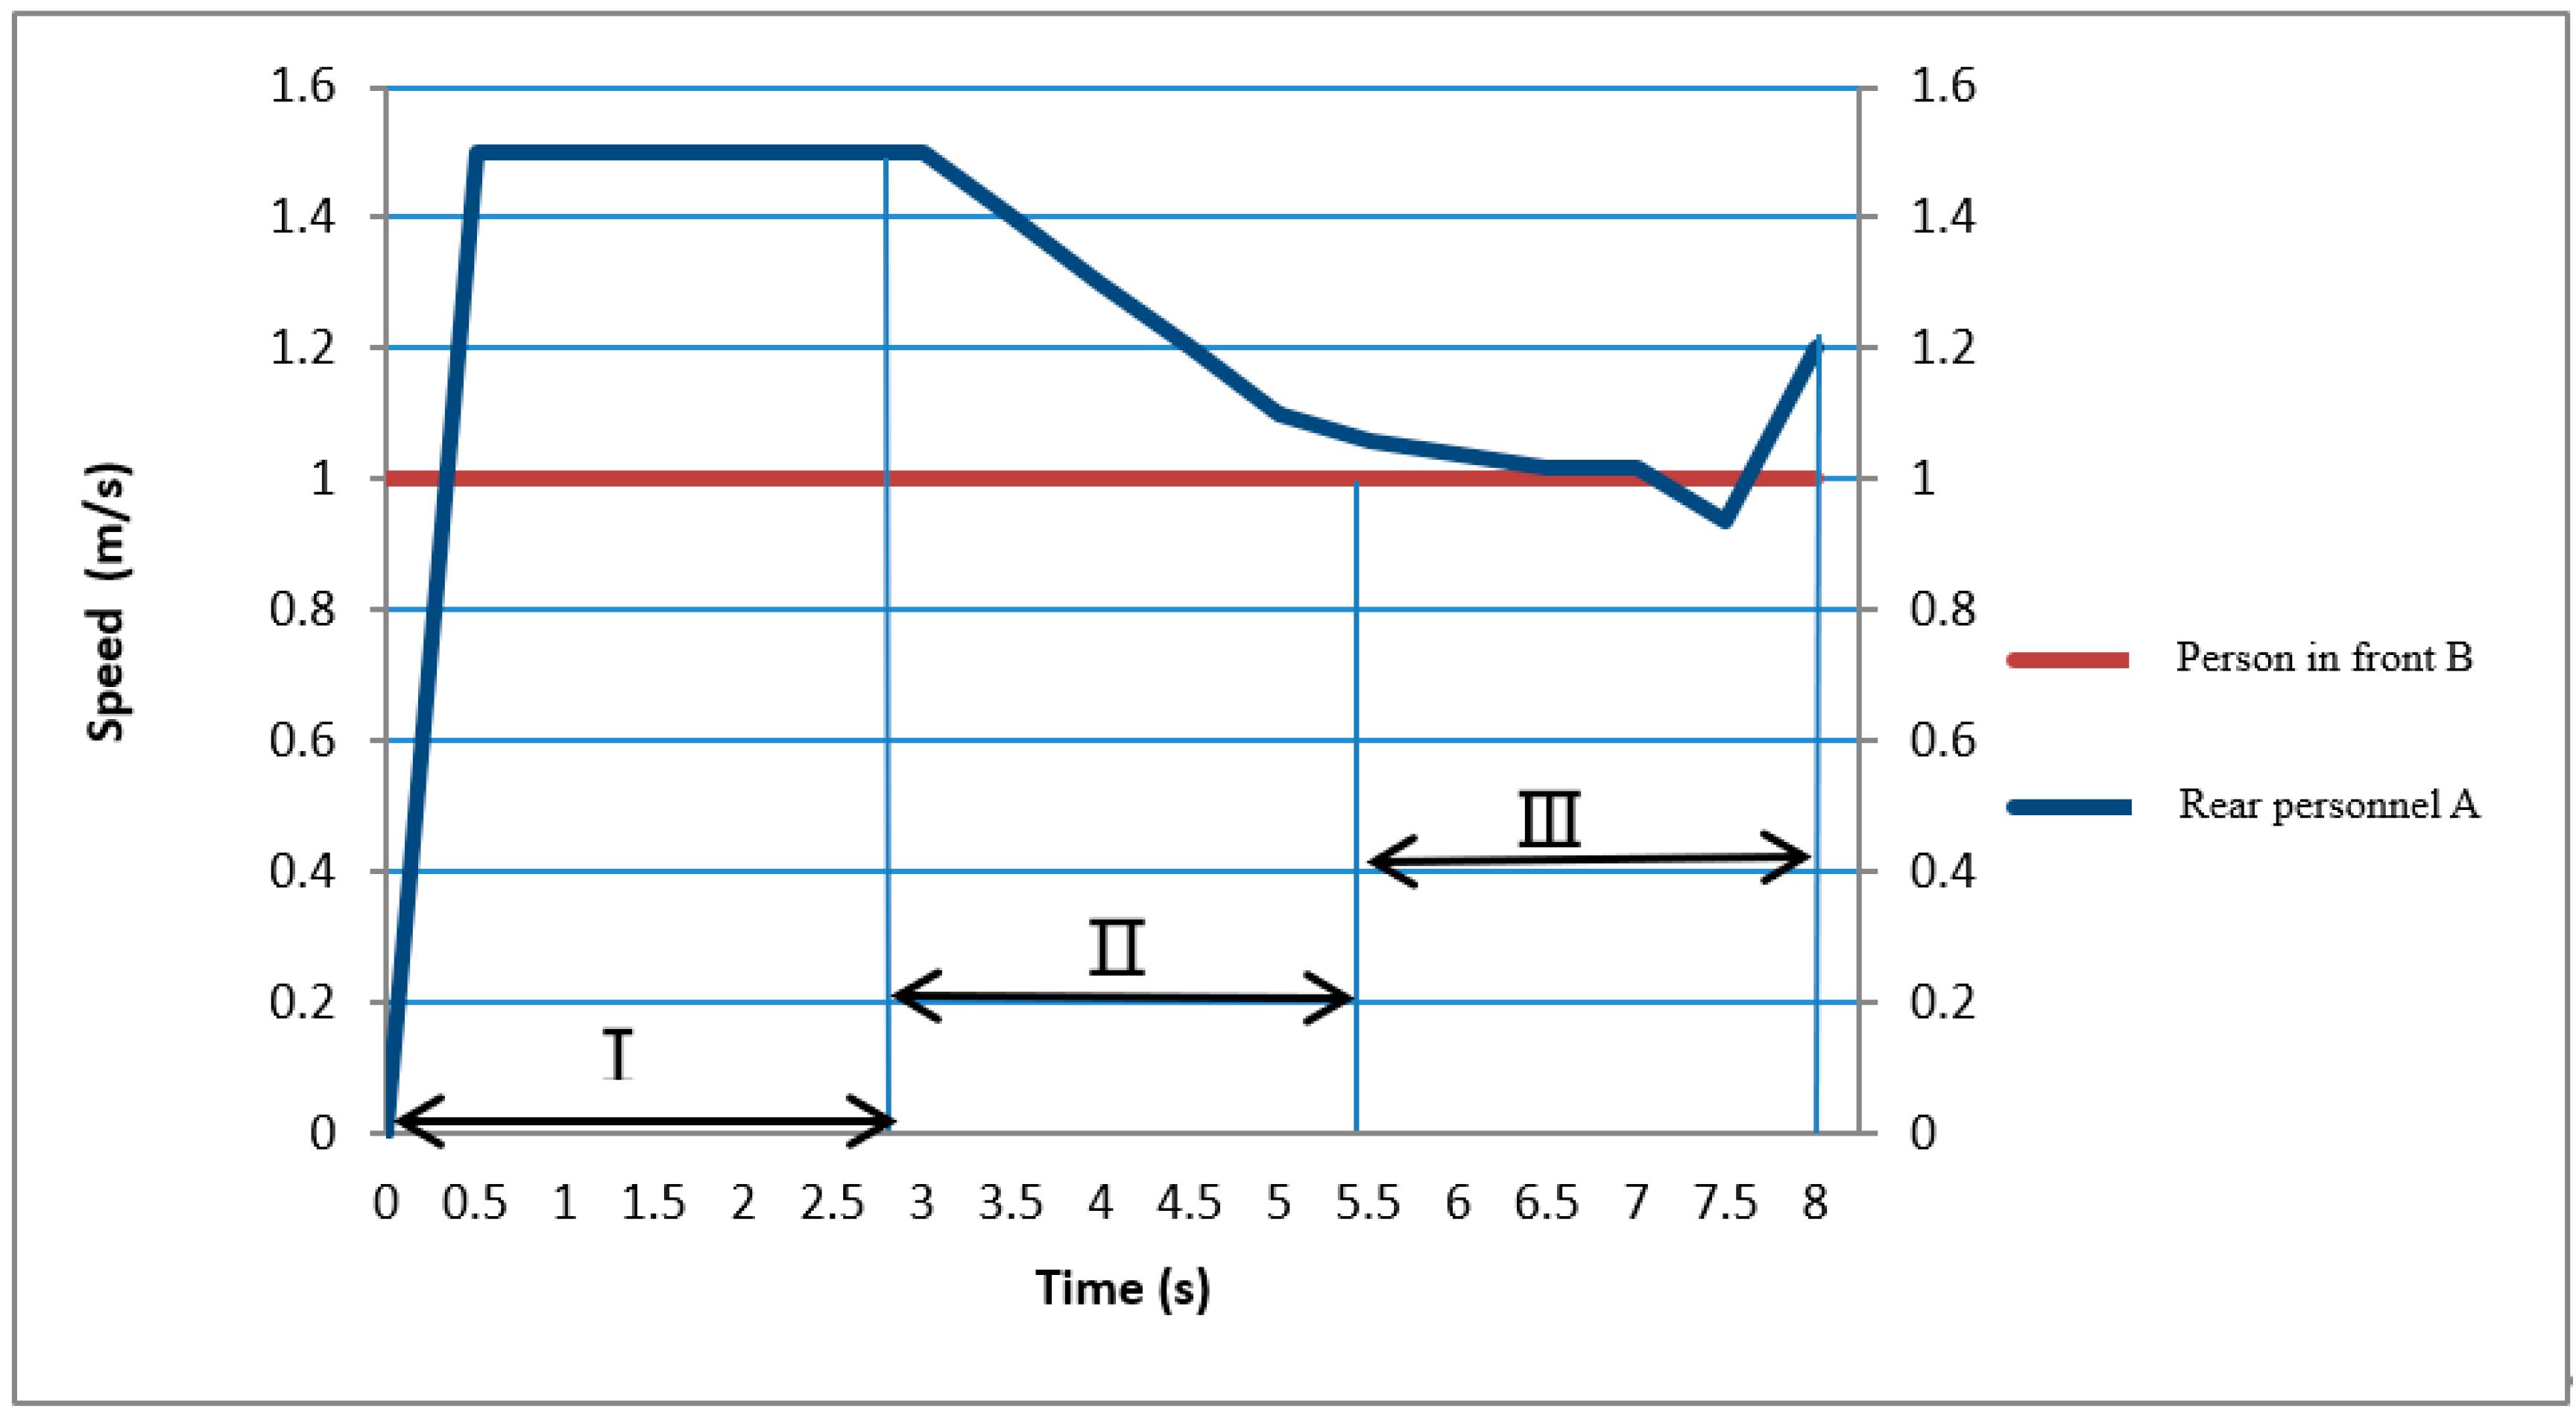
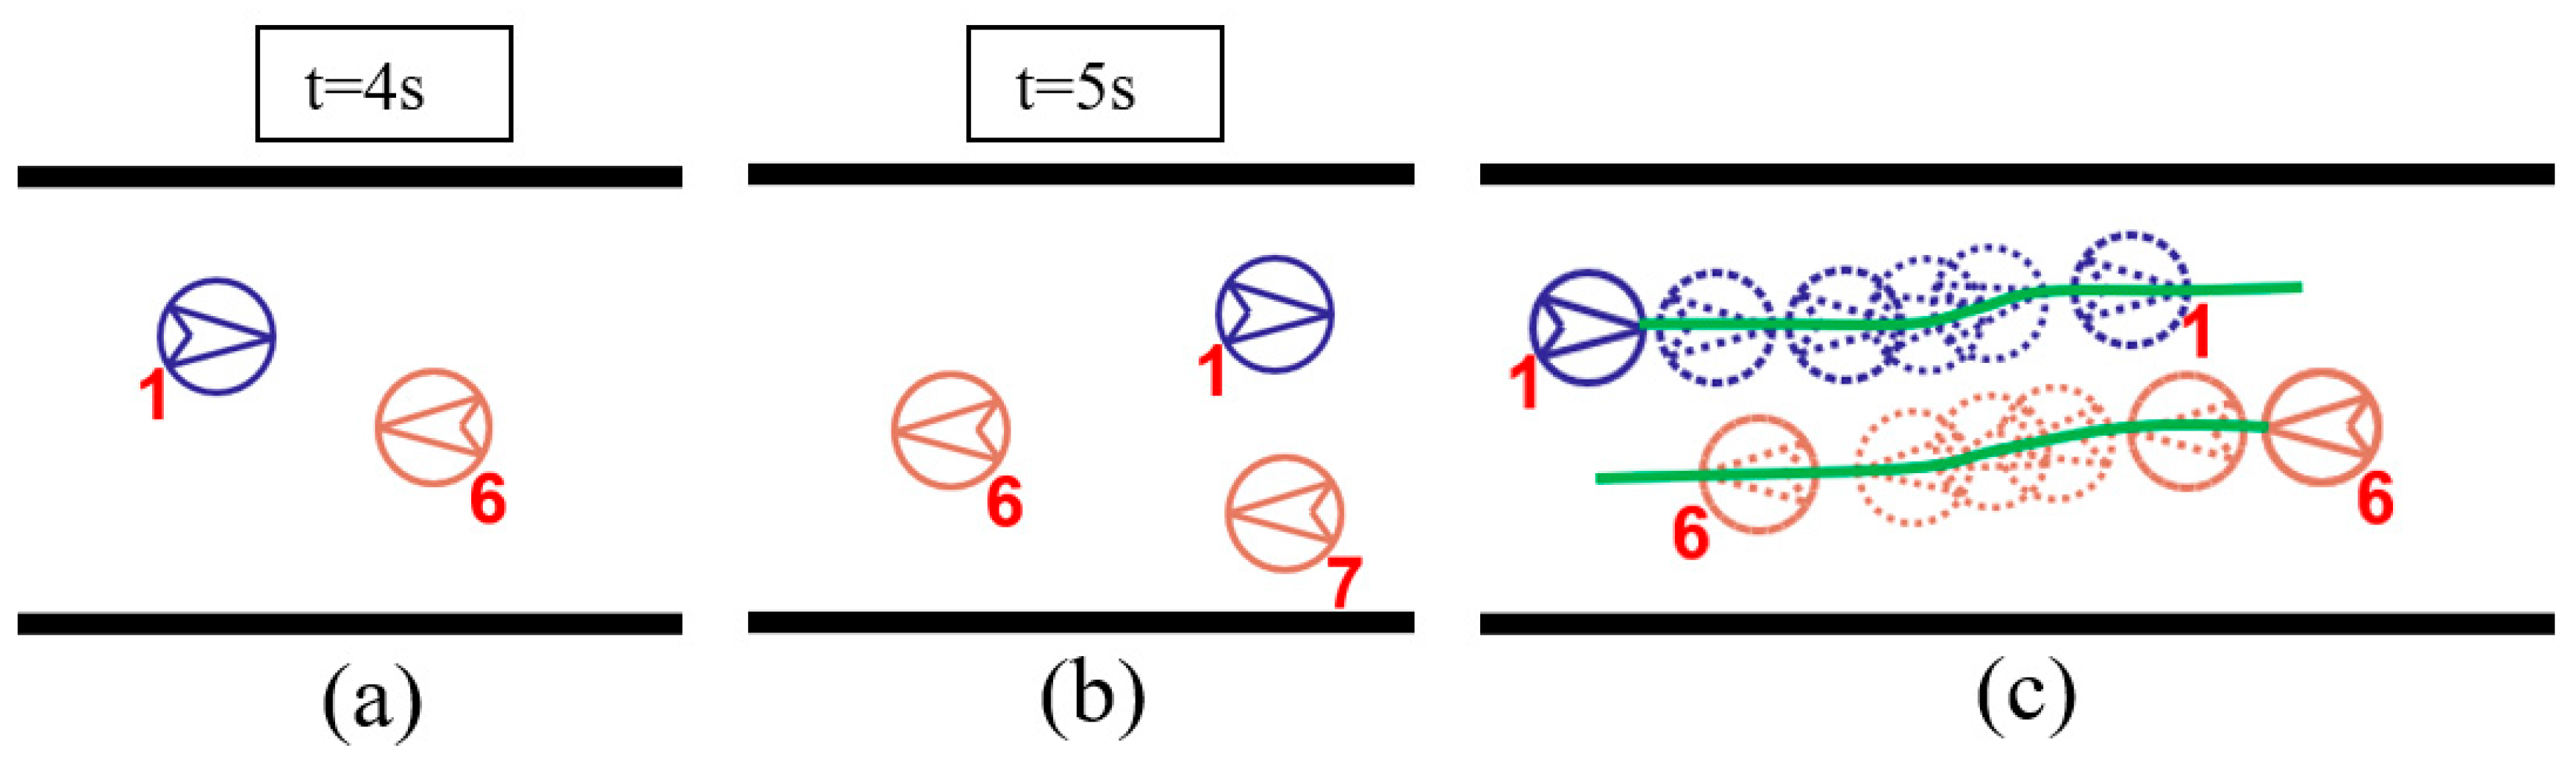
When agent A needs to follow agent B in front, he is required to slow down and maintain a safe distance from agent B, and it is necessary to apply a repulsive force to agent A. In the model, the magnitude of the force is related to the speed and the distance between the two, similar to the elastic force of the spring.
Under the action of this repulsive force, the speed of agent A decreases to the same as that of agent B in front, and agent A maintains this speed and keeps a safe distance from agent B. When agent B no longer blocks agent A, agent A returns to its original speed immediately. The application of this repulsive force is described in more detail in
Section 3.1.
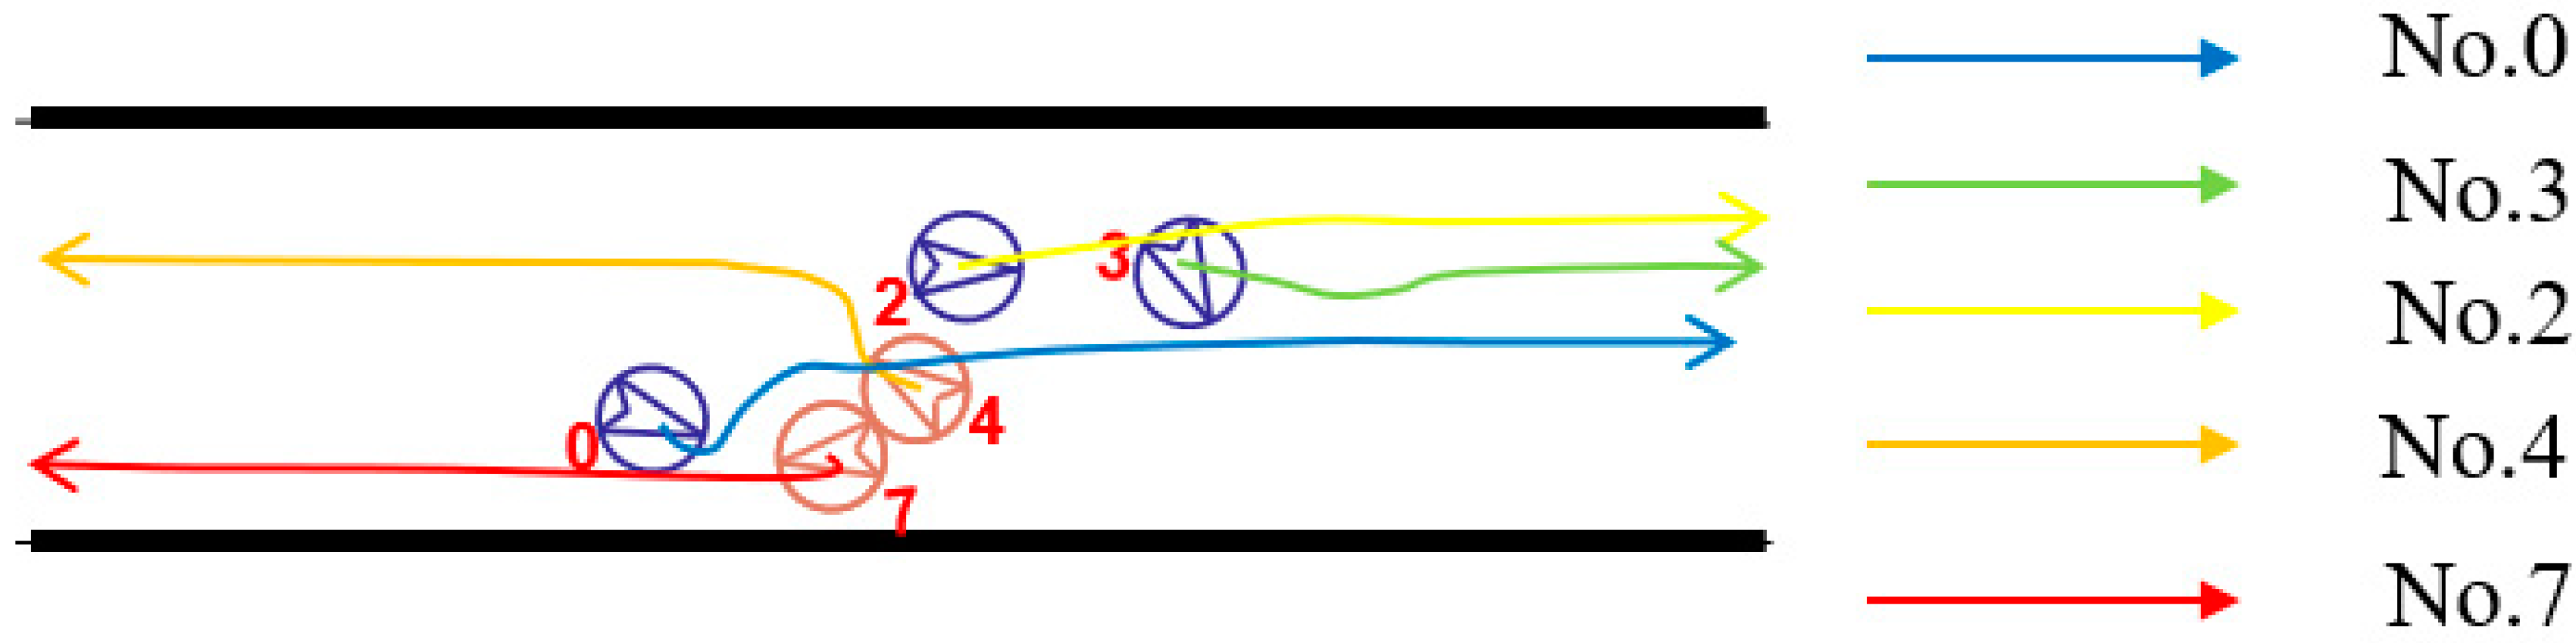
Algorithm for Bypassing
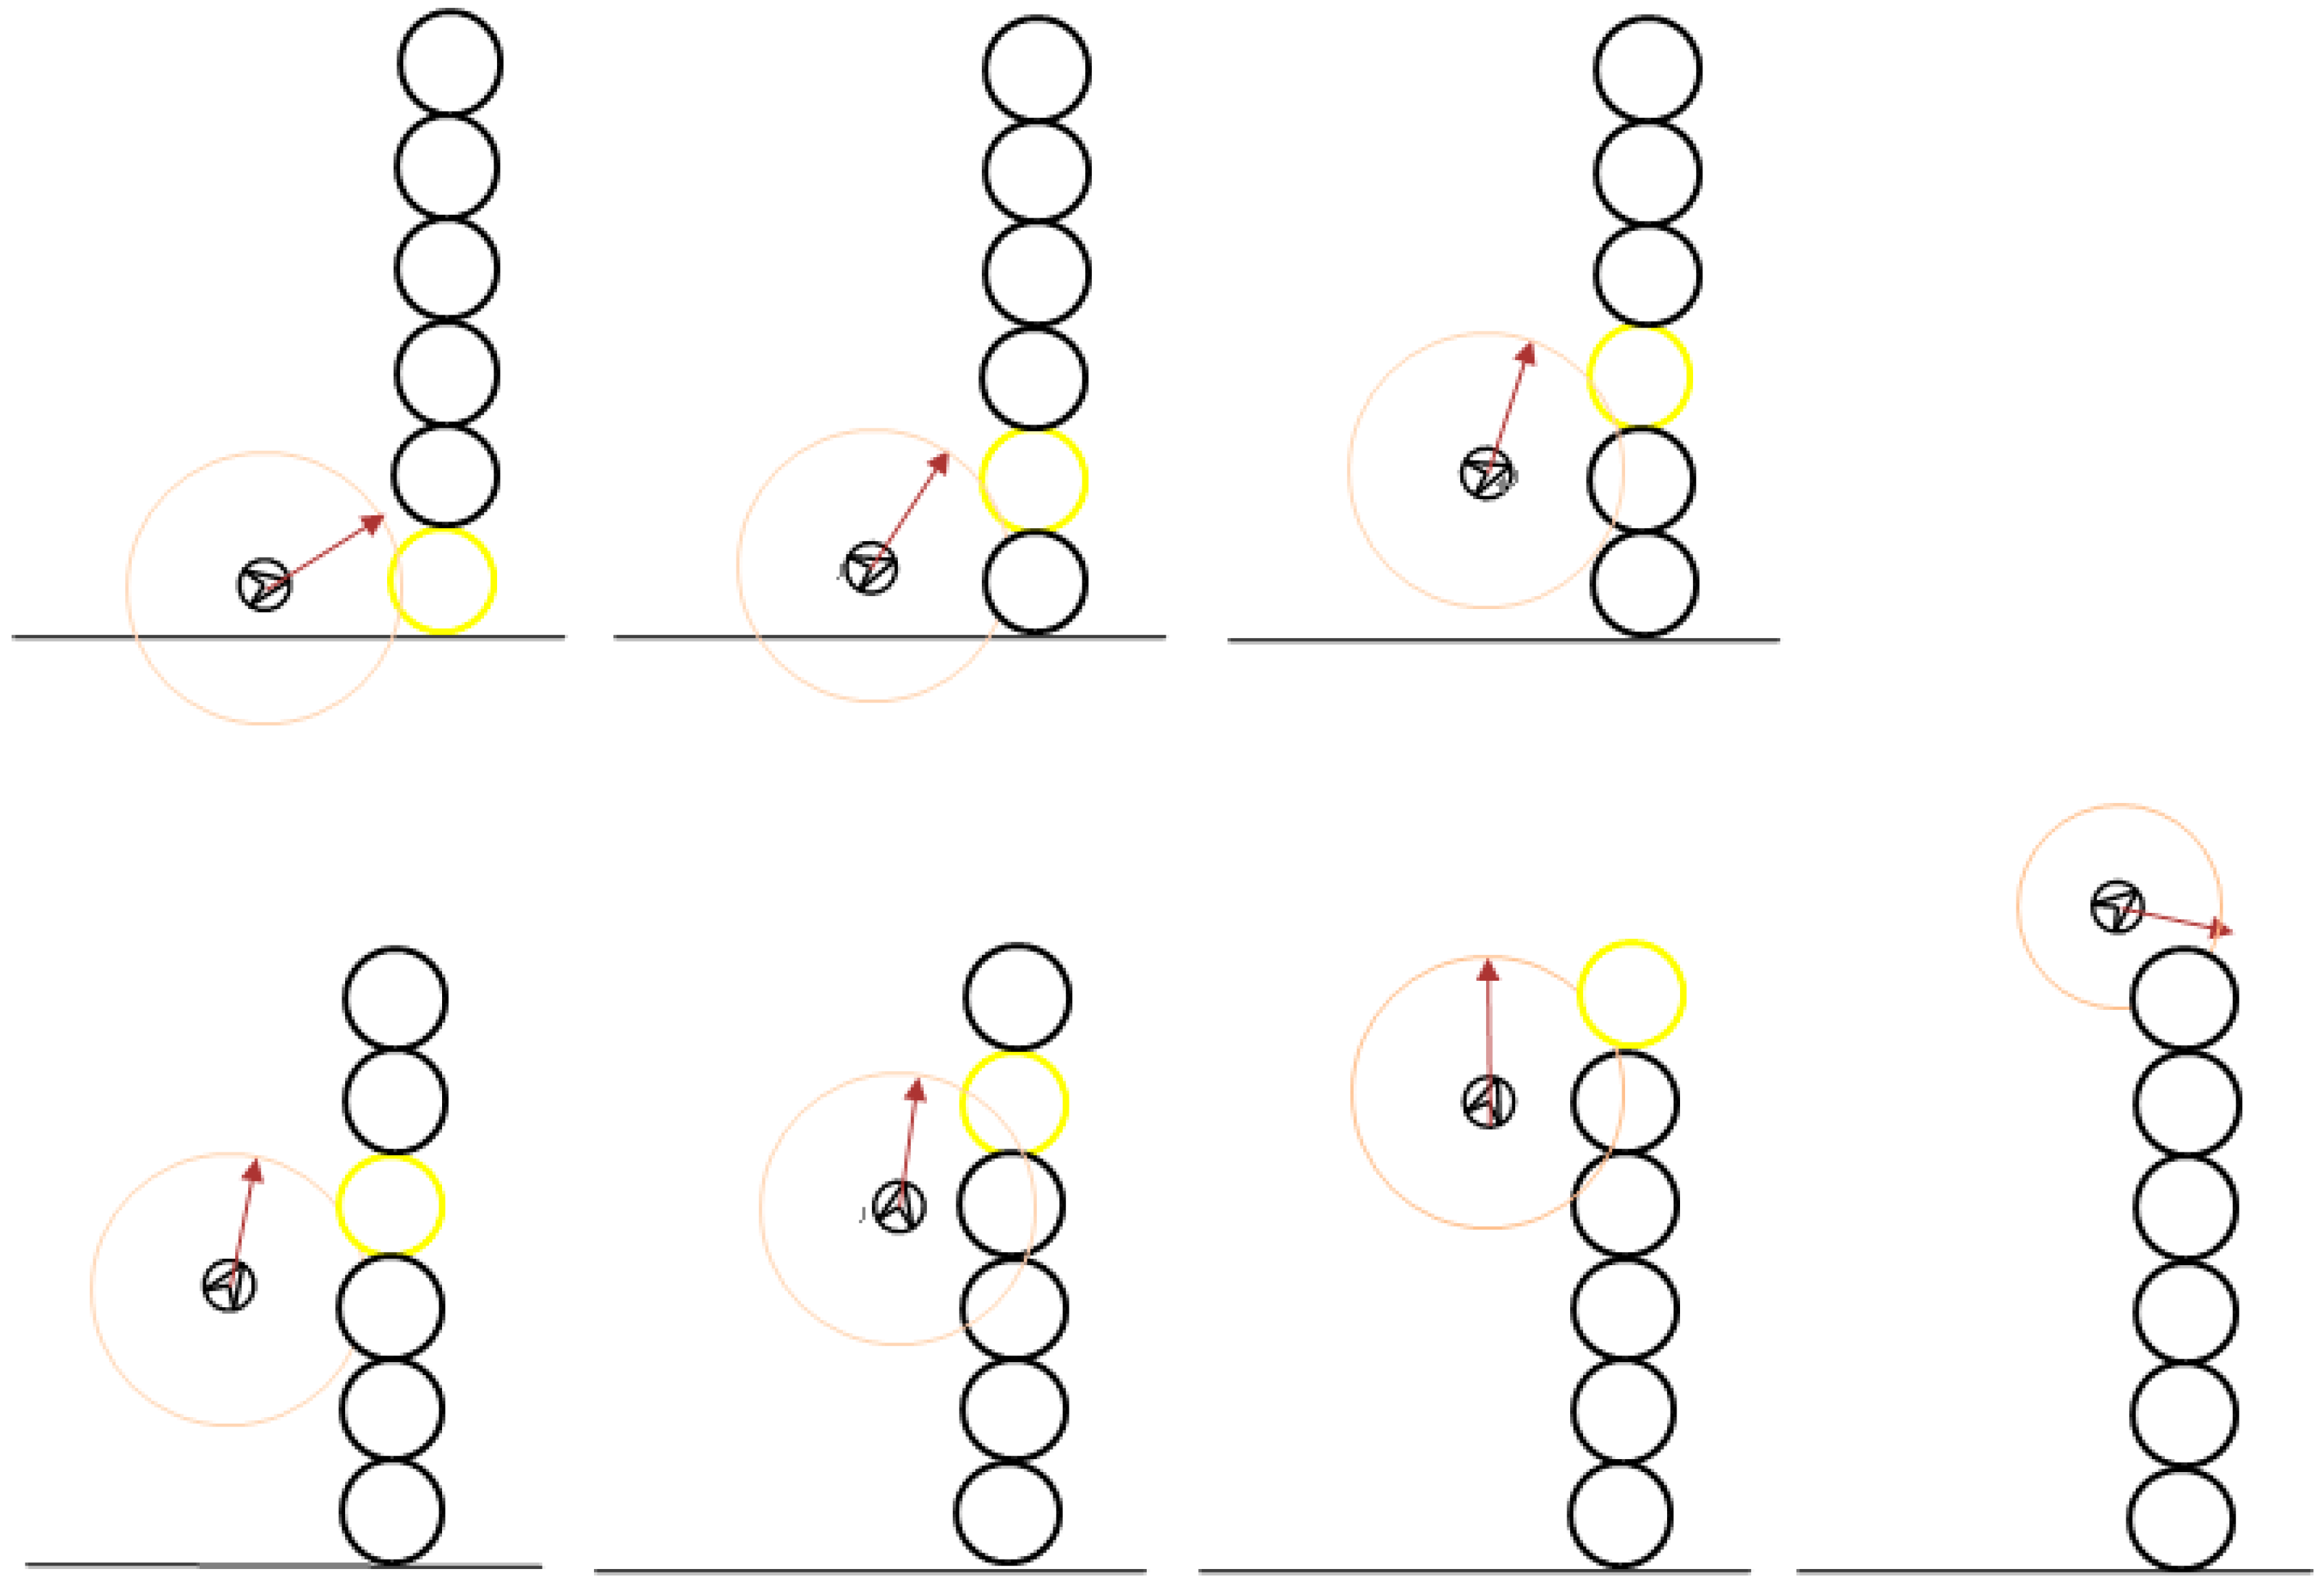
The first step in the detour algorithm is to perform collision detection on the front pedestrian. At this time, the center of agent B can be seen as the center and the radius is the sum of the radii of A and B which are used to draw a concentric circle of B to help determine whether the two will collide. When the ray along the direction of agent A has no intersection with the concentric circle of B, it means that A will not have any contact with B if it walks in the current direction. When the direction ray of A and the concentric circle of B only have one intersection point, it means that they will be tangent if they continue to move in the current direction. When the direction ray of A has two intersection points with the concentric circle of B, A will collide with B when walking in the current direction, and the location of the collision point will be closest to the current position of A among the two intersection points, as shown in
Figure 9. When the latter two situations occur, agent A needs to detour.
Next, when agent A decides to bypass B, it is necessary to determine the angle of deflection. The coordinates of A set in the local coordinate system are (
), the coordinates of B in the local coordinate system are (
), and the distance between A and B is
:
As shown in
Figure 10, assuming that the radius of B and A are
and
,
θ and
can be determined as:
When A decides to deflect in the positive direction of the t-axis, the angle of deflection is , and when deflect in the negative direction of the t-axis, the angle of deflection is .
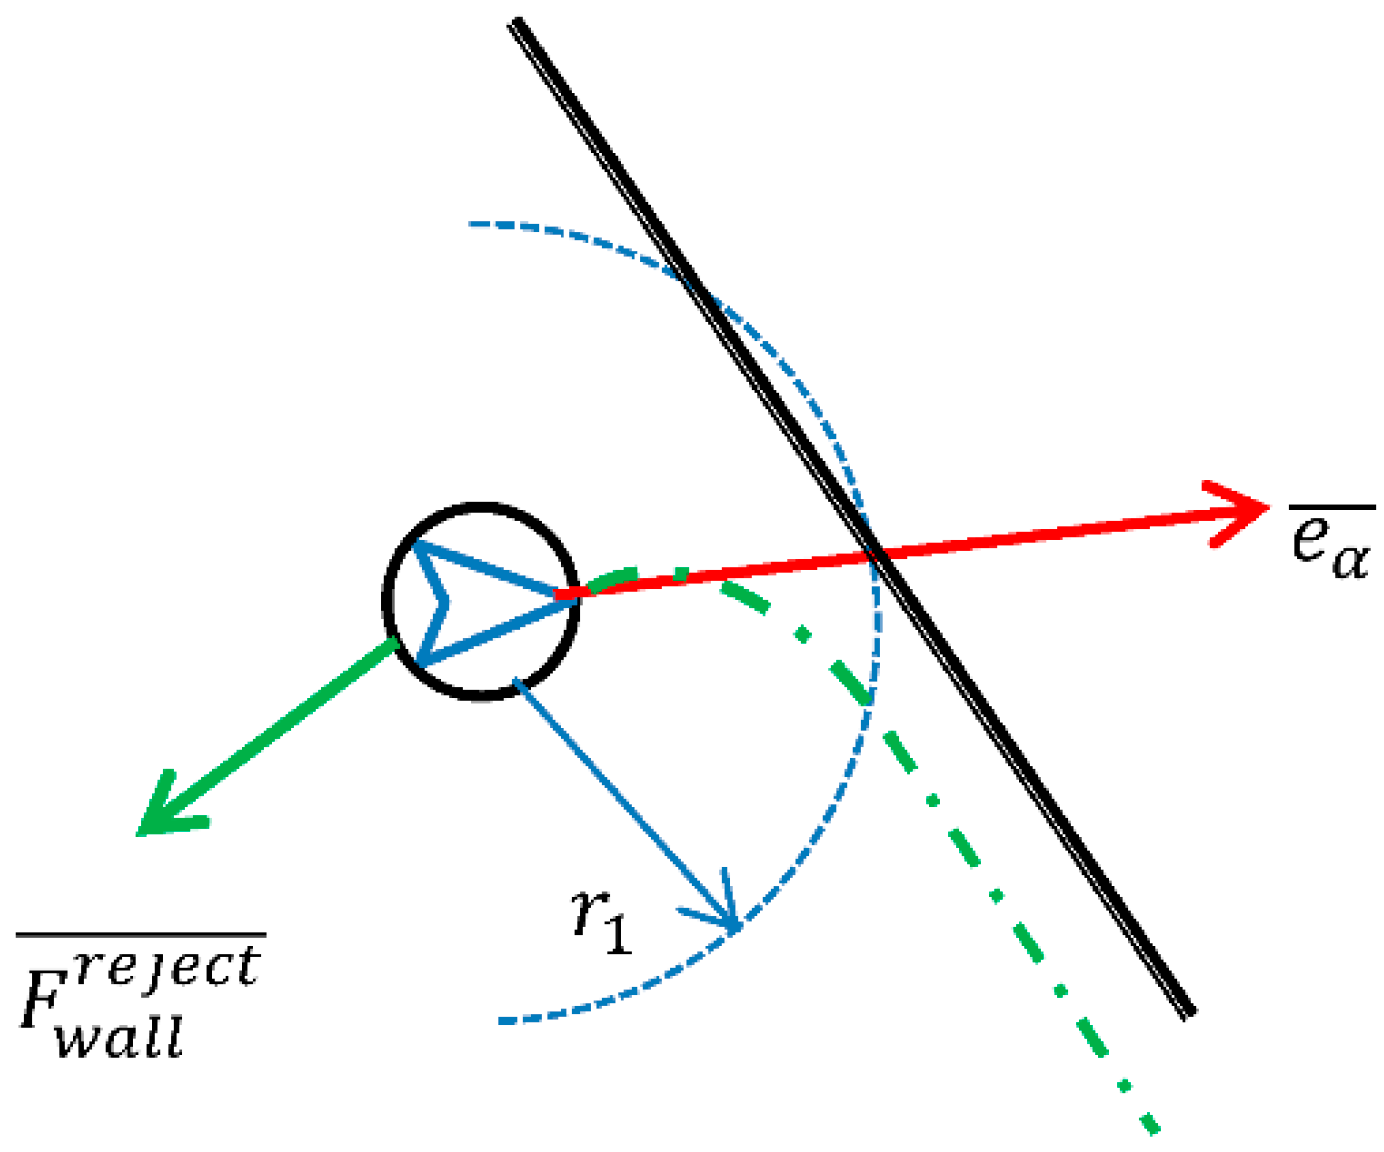
3.3.2. Algorithm for Obstacle Avoidance
Except for other pedestrians, when the agent detects obstacles or walls, it will also be repulsive. Taking the wall as an example, the direction of force is along the normal direction of the wall, and the size is the same as the repulsive force in the dynamic model. The force is used to balance the force exerted by the outlet in the normal direction of the wall. The trajectory of the final movement is shown by the dotted line in
Figure 11.
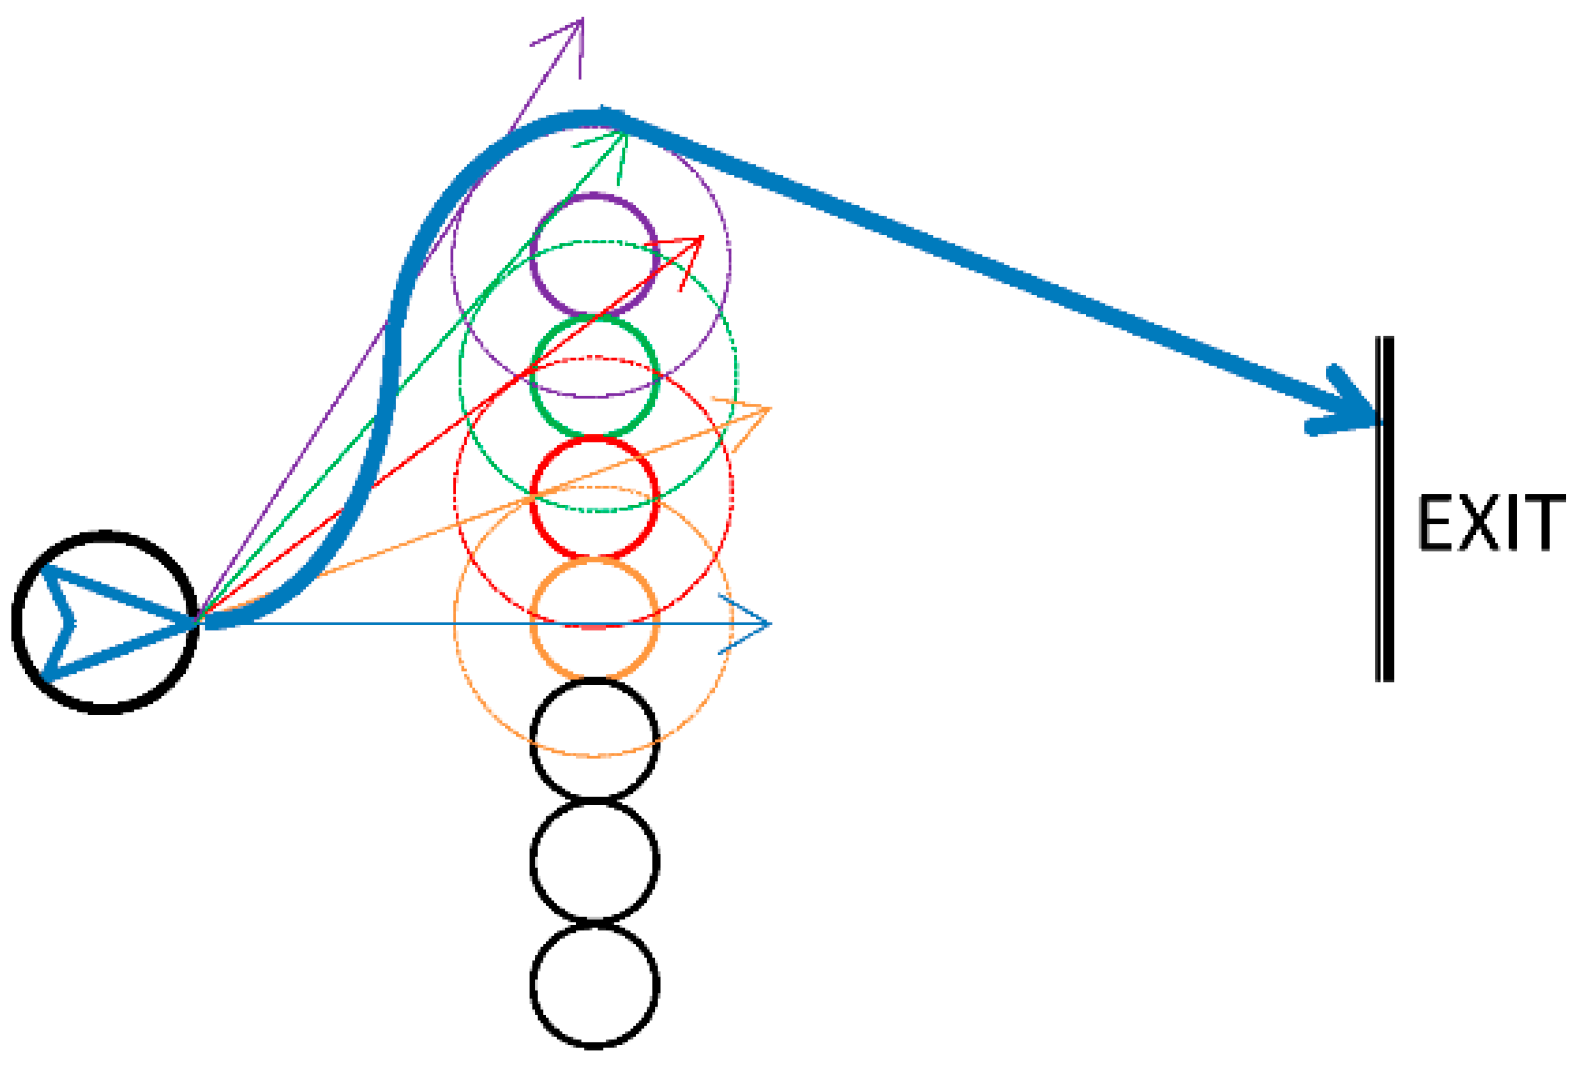
In the algorithm, the boundary of the obstacles perpendicular to the direction of the travel of personnel is replaced by some small circle to simplify the geometric calculation. When the agent detects an obstacle, it will perform obstacle avoidance calculations for different small round obstacles. The required deflection direction of each small circle is represented by arrows of different colors (see
Figure 11). The agent is deflected in order from these angles until the obstacle is bypassed. The theoretically derived trajectory is shown by the thick blue line in
Figure 12.
In this section, the intelligent decision model theory based on Newton’s second law of motion is established, and the part of applied force includes the driving force, the repulsive force, and the steering force, and the decision model and the probability model are introduced into the mechanics model compared with the traditional social force model, resulting in a new evacuation model. Intelligent behavior is mainly reflected in two aspects: speed control and direction selection. The speed control of an individual is mainly influenced by the density of people around itself, and the truncated operation of the maximum speed of an individual is implemented based on the experimental results and data from other research scholars. The choice of direction includes obstacle avoidance and the choice of optimal exit. Obstacle avoidance includes avoiding obstacles, other people, and walls, and the choice of optimal exit is determined by two factors: the distance from the individual to the exit and the number of people to be evacuated from that exit. The decision model is mainly embodied in the steering force; it needs to first determine the detection range of the first impact on its own direction of travel of the individual, and then determine the detection range of other individuals, obstacles, and the individual’s location information, so as to determine the direction of avoidance. Regarding the probability model embodied in the evacuation of individuals in the direction of travel when they encounter another movement of people, or when choose to follow or go around, the probability value used is the standard normal distribution that generates random values of the standard normal-terms distribution, and determines the behavioral attributes of different individuals based on the random numbers.
5. Conclusions
This paper constructs an agent-based evacuation model with the basic idea of “detection-decision-action”. The dynamic equation of the model is based on Newton’s second law of motion, with the implication of the decision-making model and the probability model to simulate the typical behaviors of avoiding pedestrians and obstacles in an evacuation, which mainly focuses on the walking force, as a combination action of the driving force, the repulsion force, and the steering force. Different from the social force model, the steering force mainly depends on the detection results while walking, and the steering angle is determined by the obstacle avoidance; once decided, it will be applied actively. The decision-making model is introduced to determine the walking strategy when encountering obstacles and other pedestrians. Thanks to the introduction of the algorithm of steering force application and the decision-making model, the AEM proposed in this paper is more intelligent than the previously implemented models.
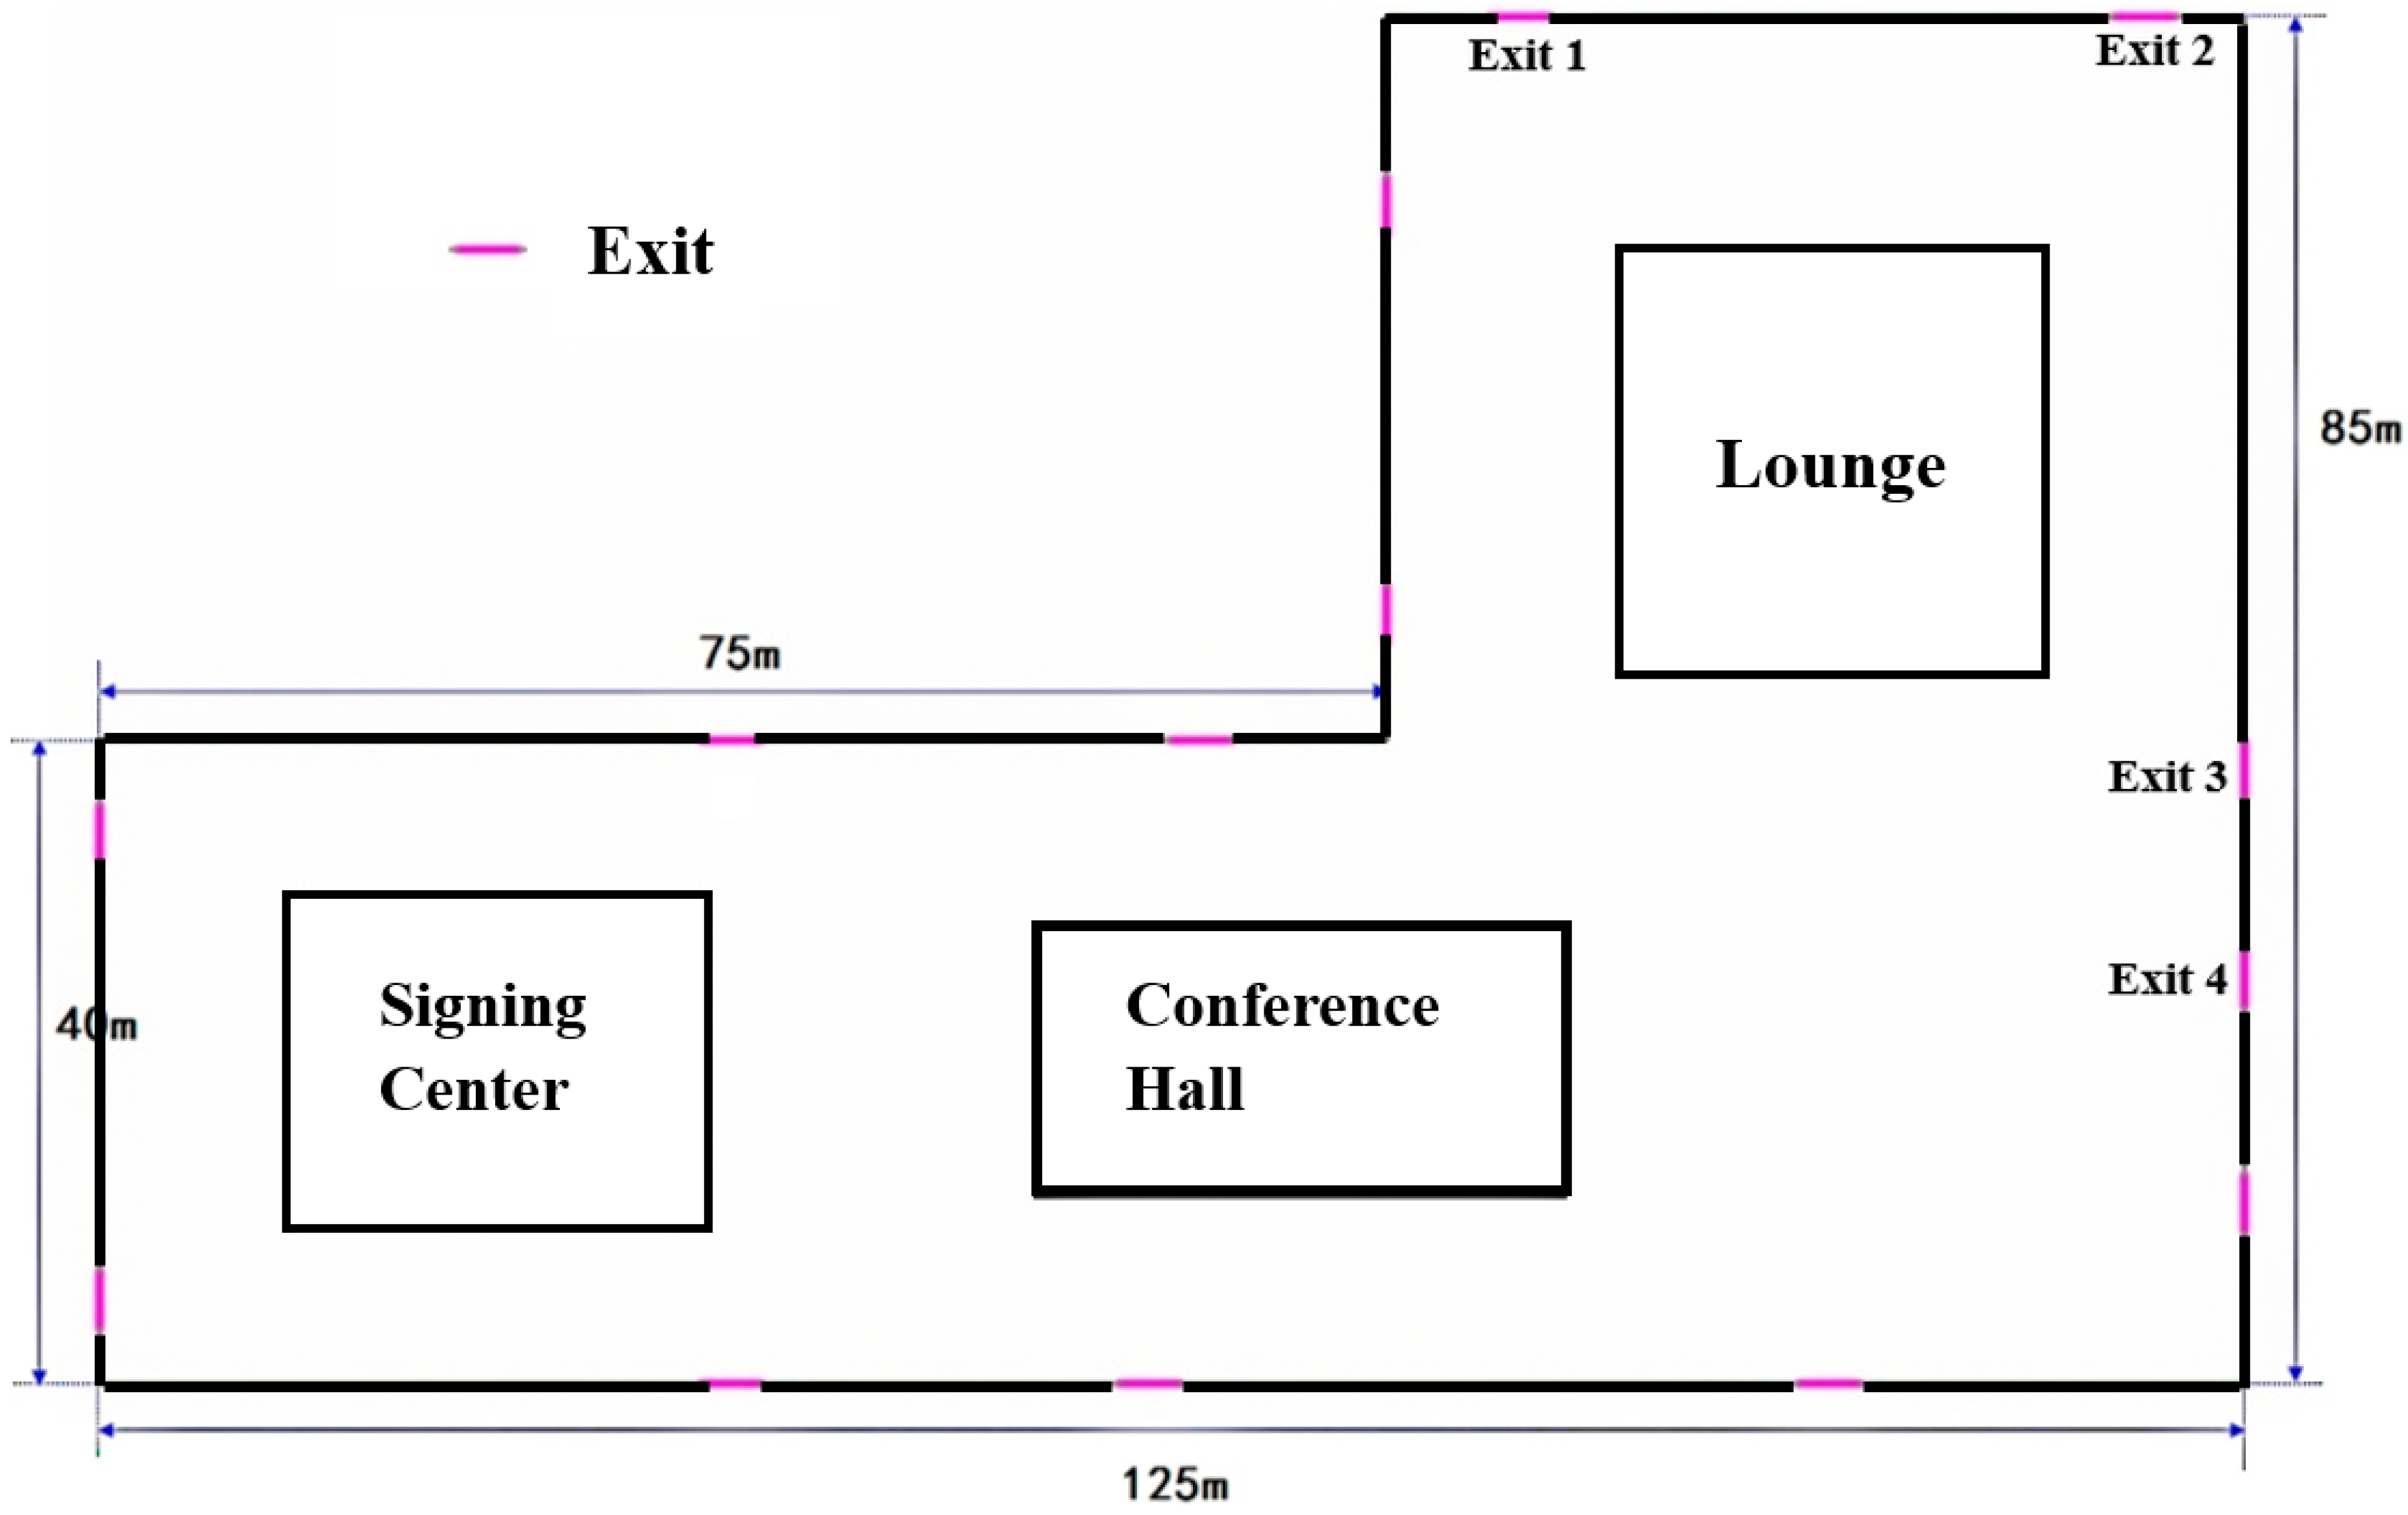
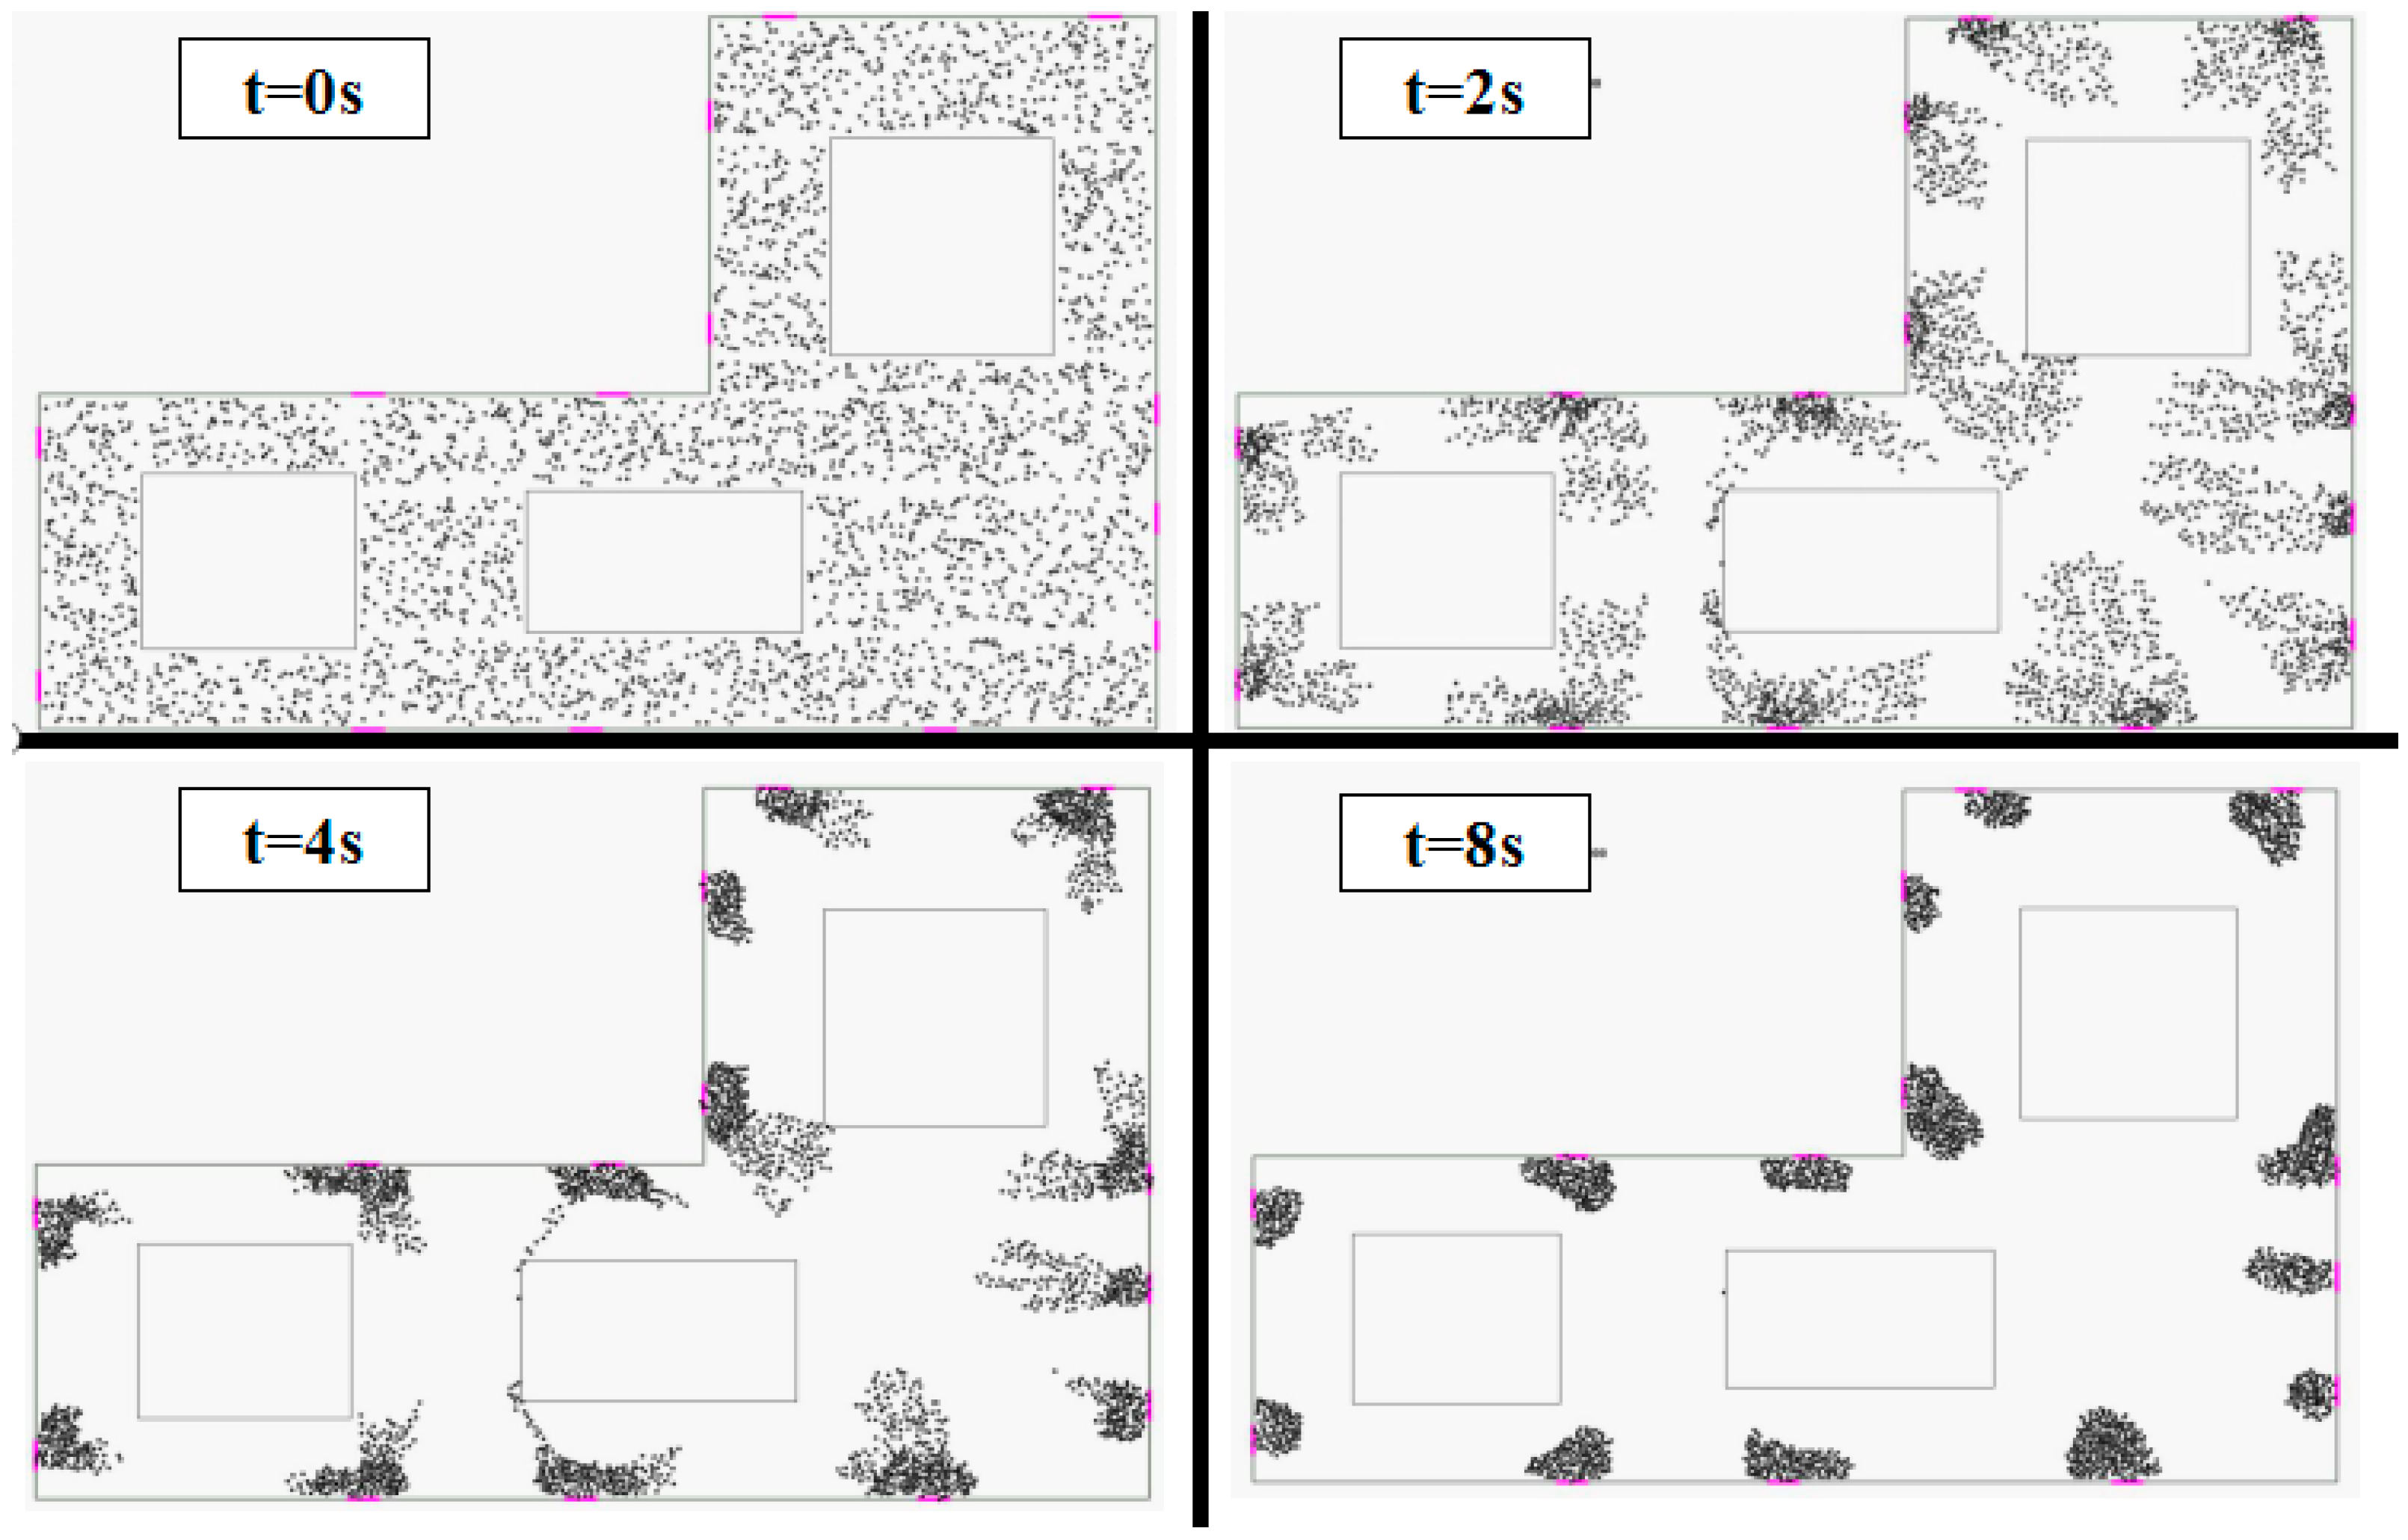
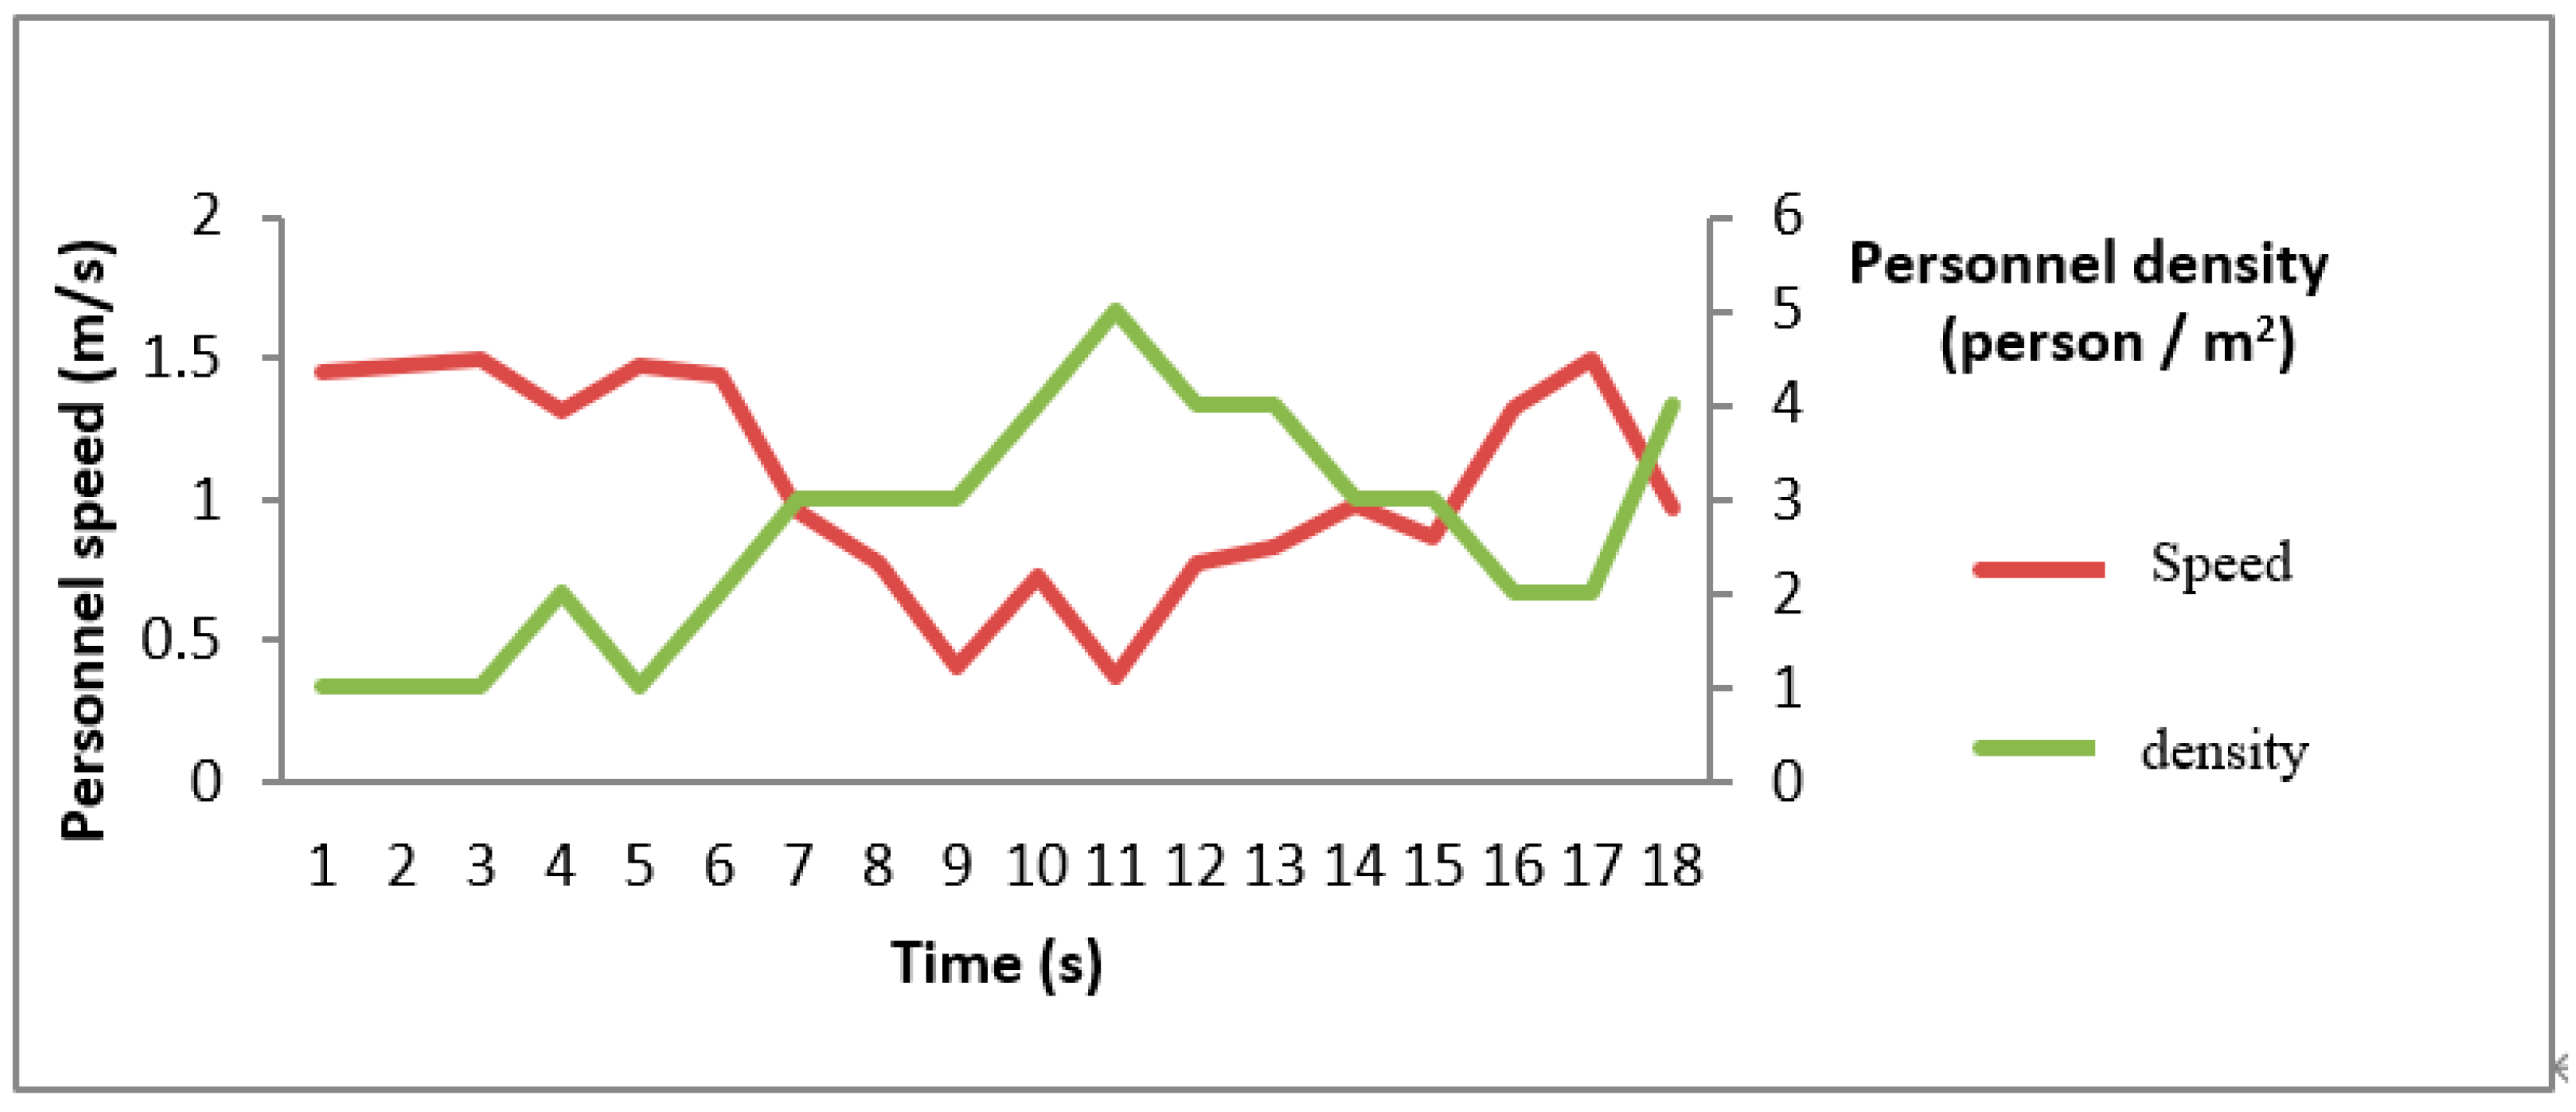
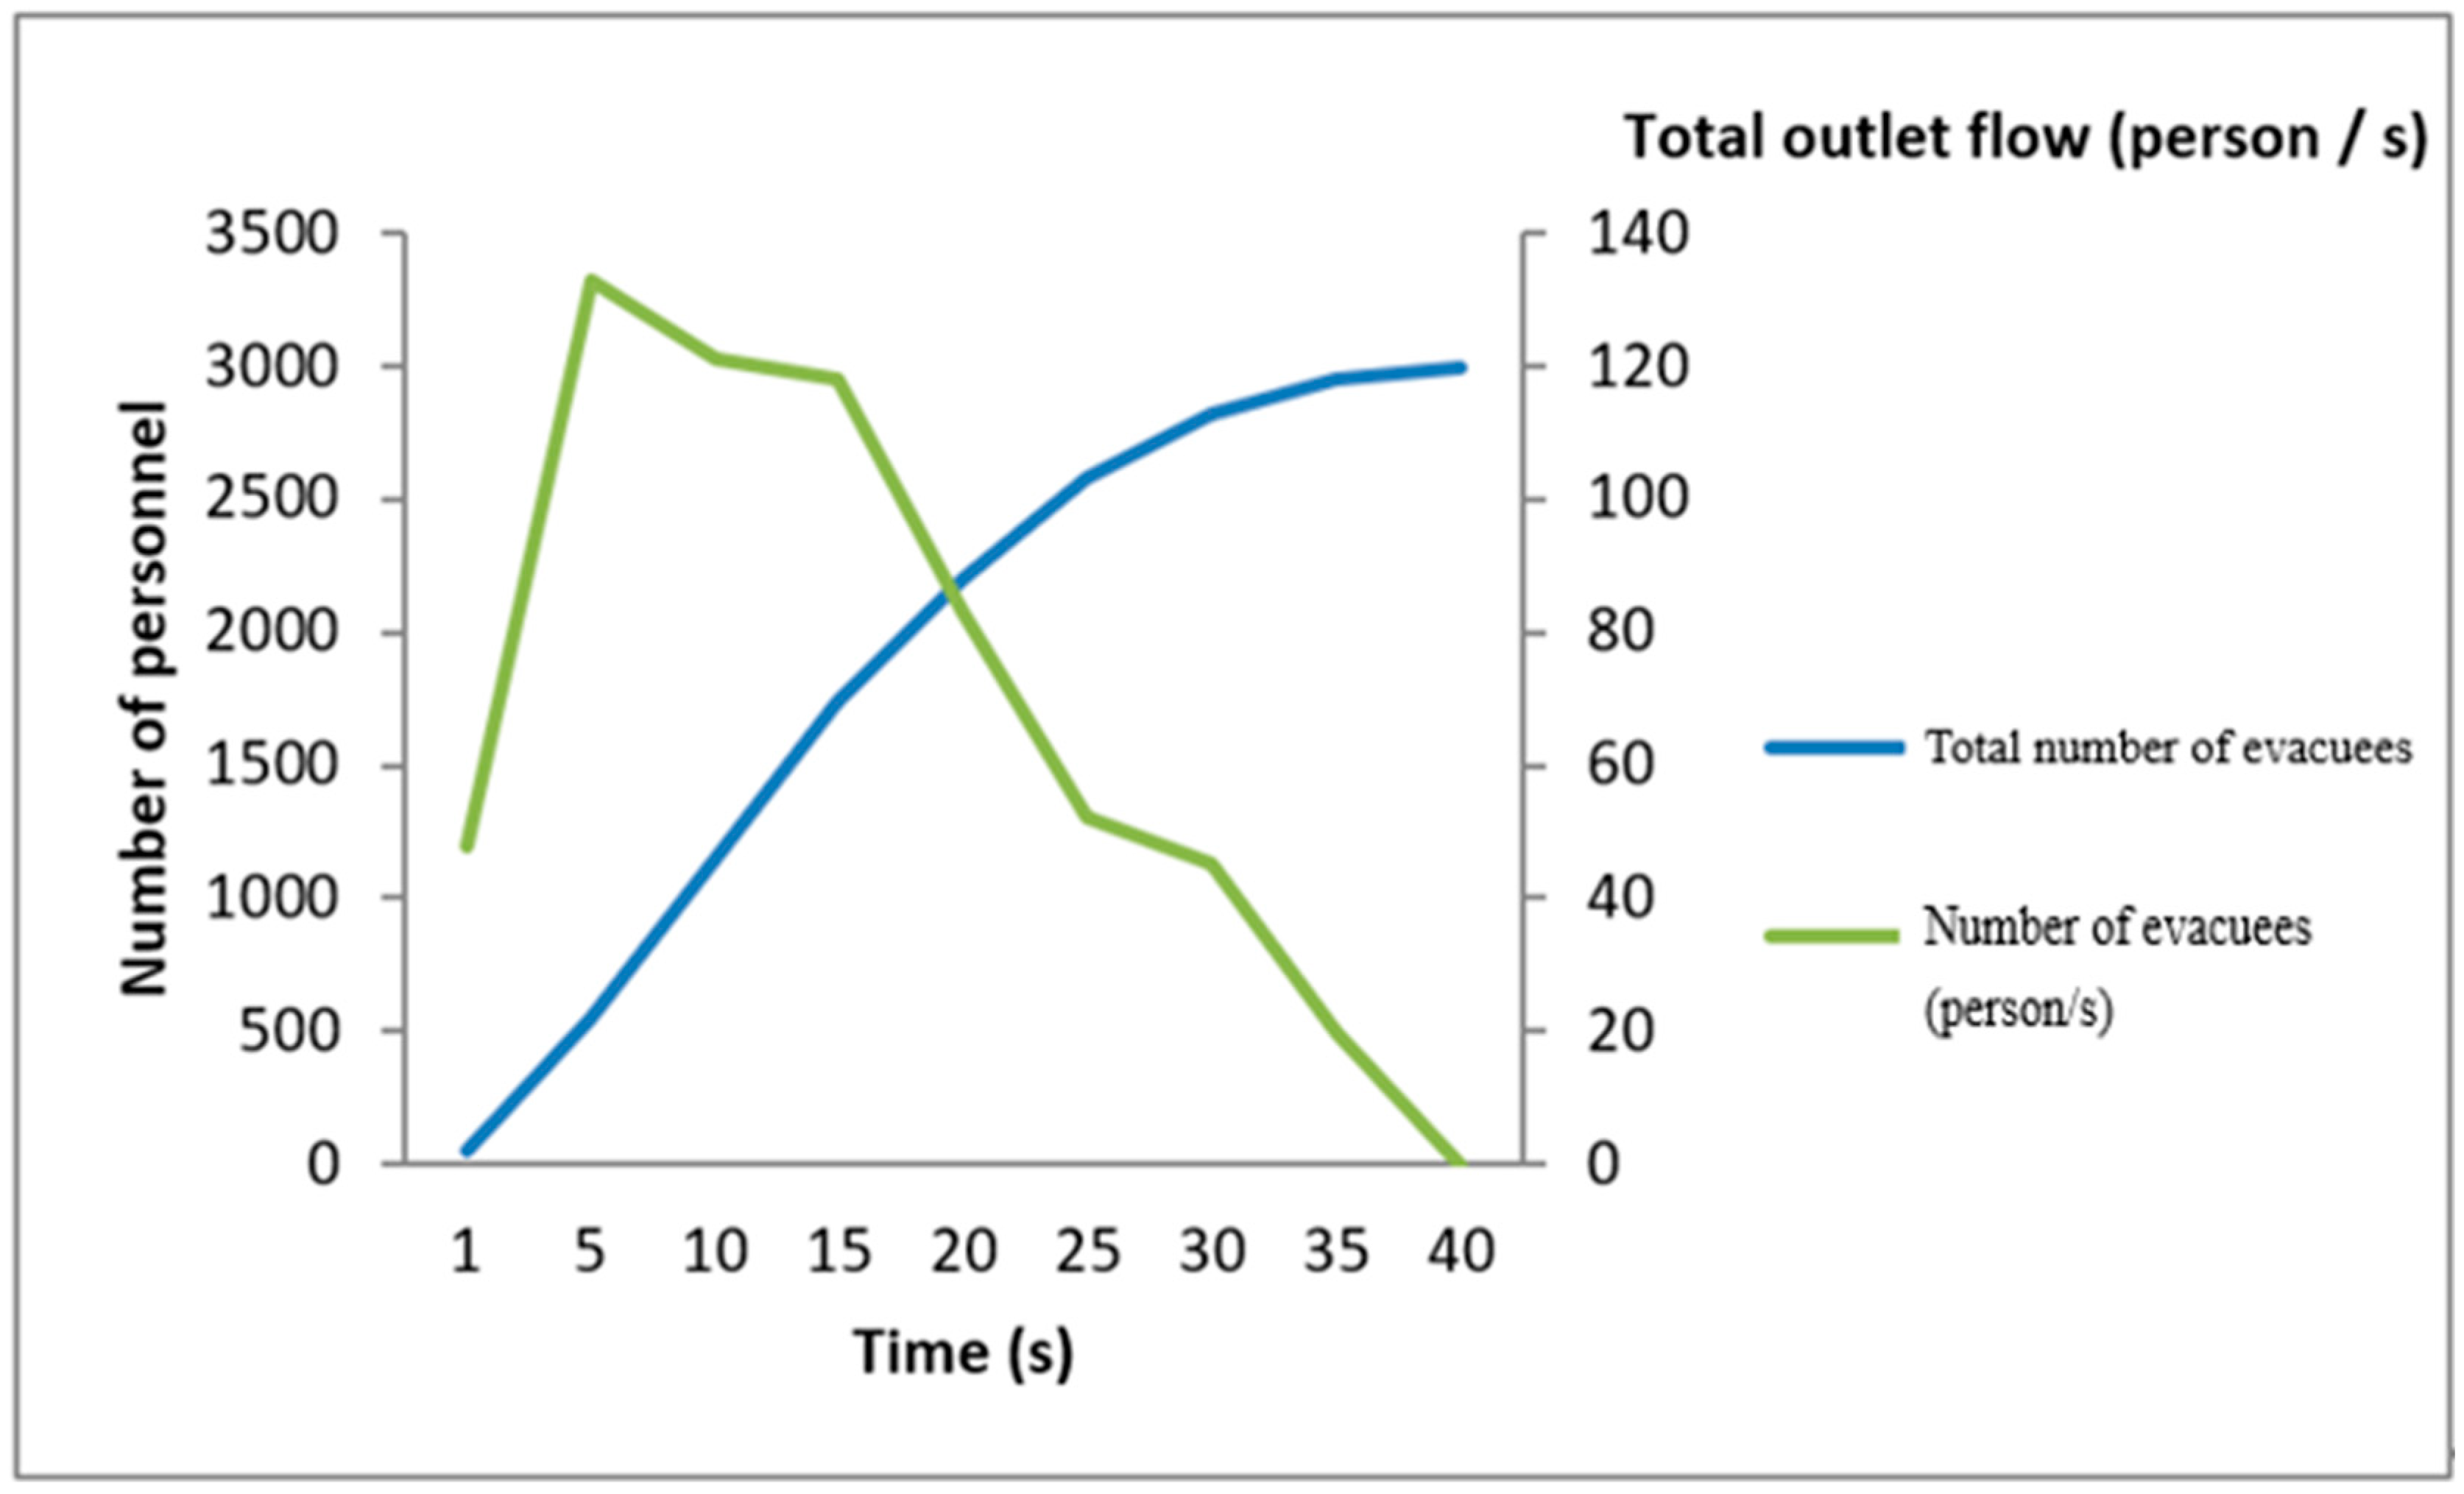
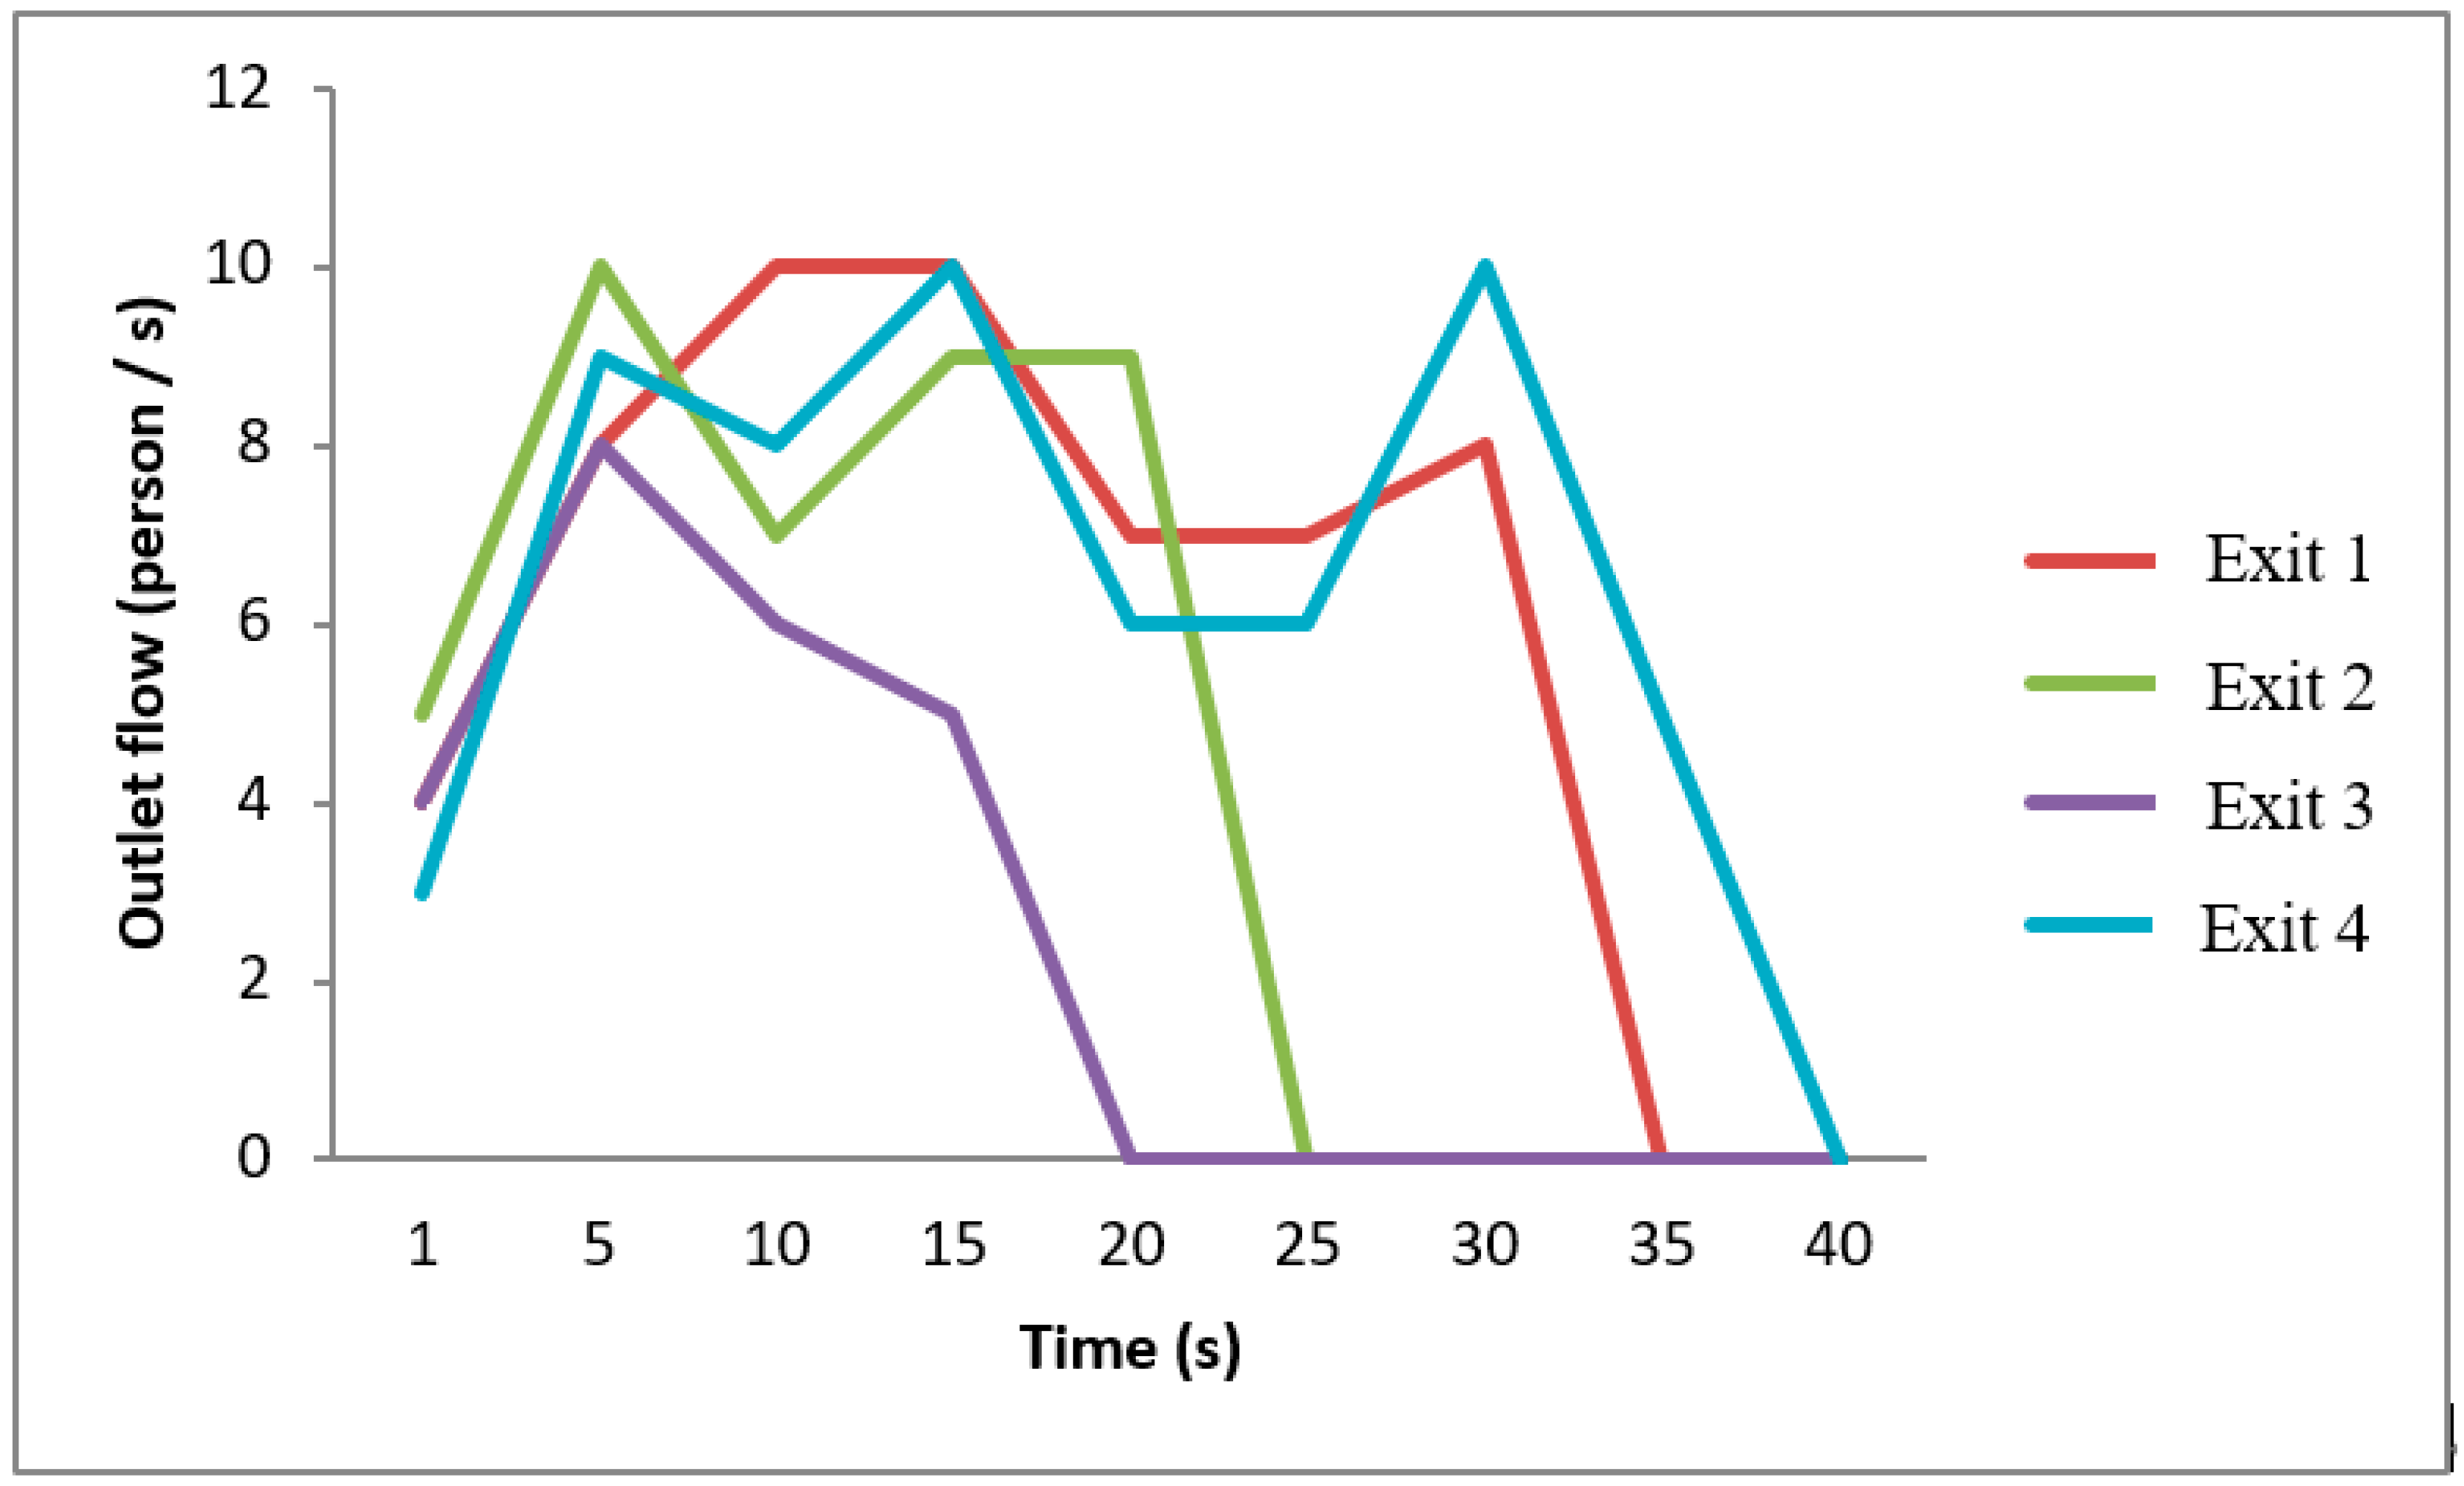
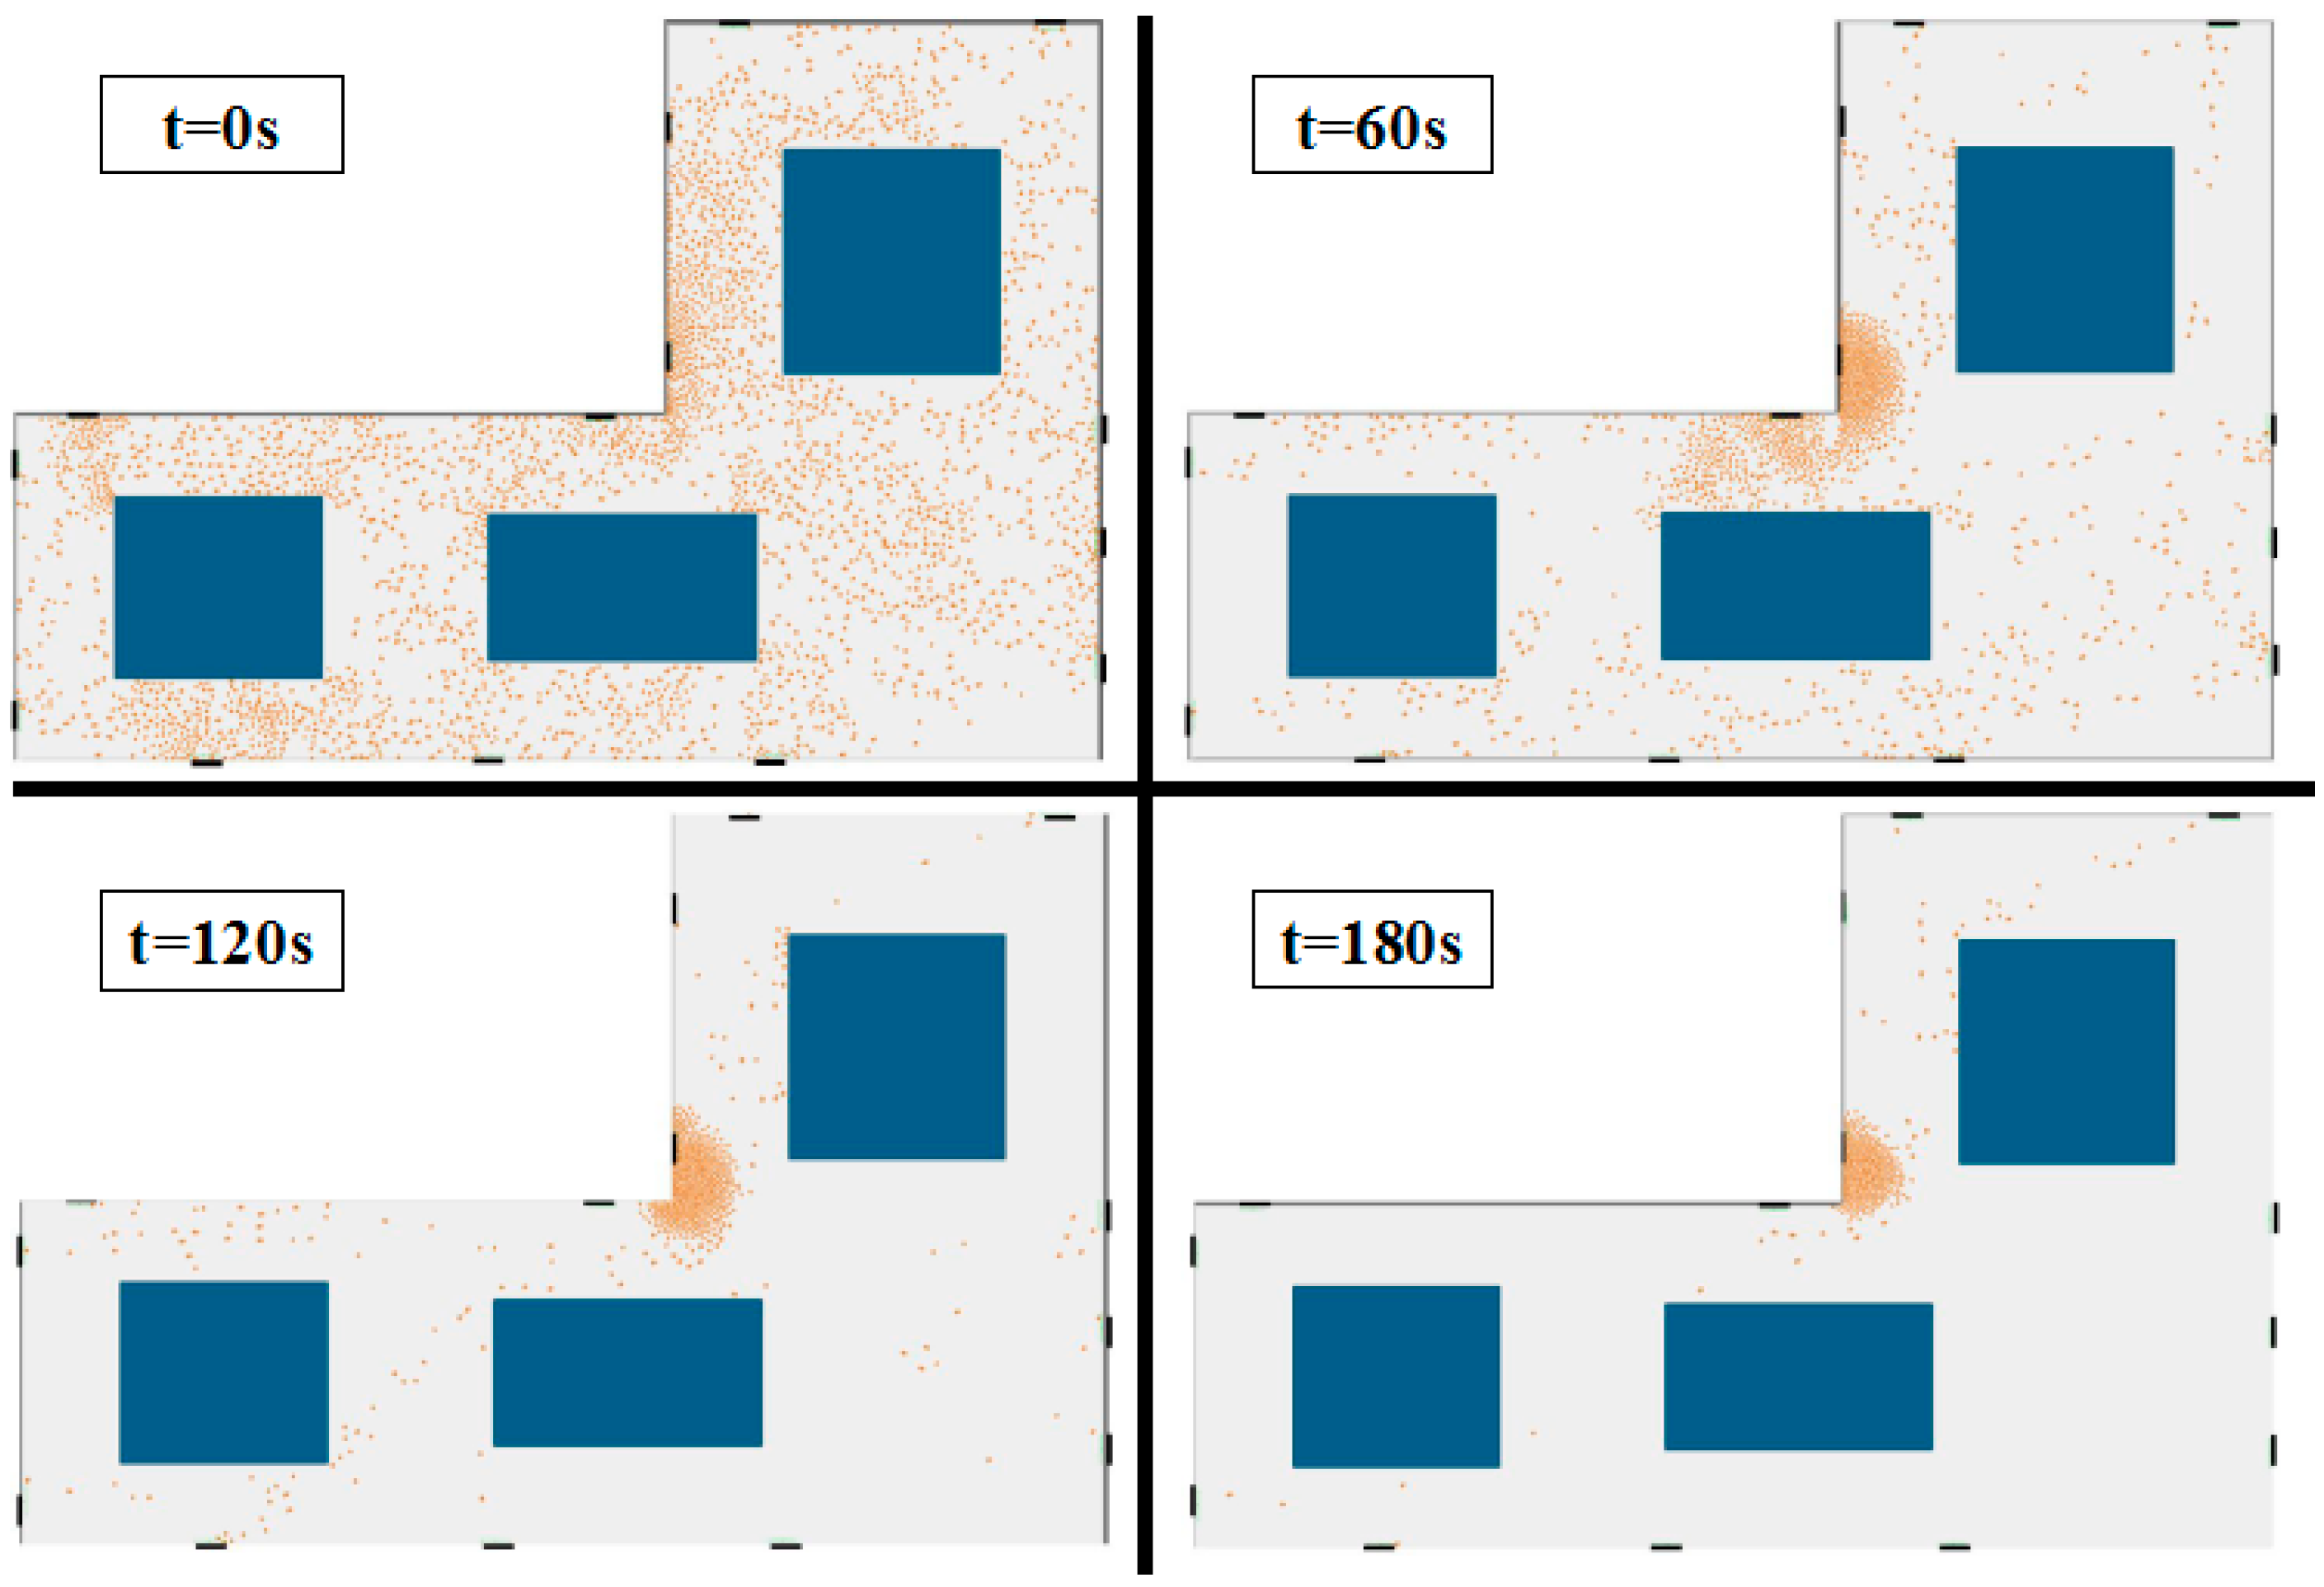
The research theorizes the intelligence algorithms of detection and obstacle avoidance which express evacuees’ behaviors such as following or surpassing other evacuees and avoiding obstacles in the evacuation process, which can also be applied into the scene of traffic evacuation to demonstrate the distribution of evacuees and the surpassing behavior while walking, thus smoothening the whole evacuation process even in complicated structured areas with narrow passageways. Furthermore, this research simulates an evacuation in a complex place, taking an exhibition center as the example.
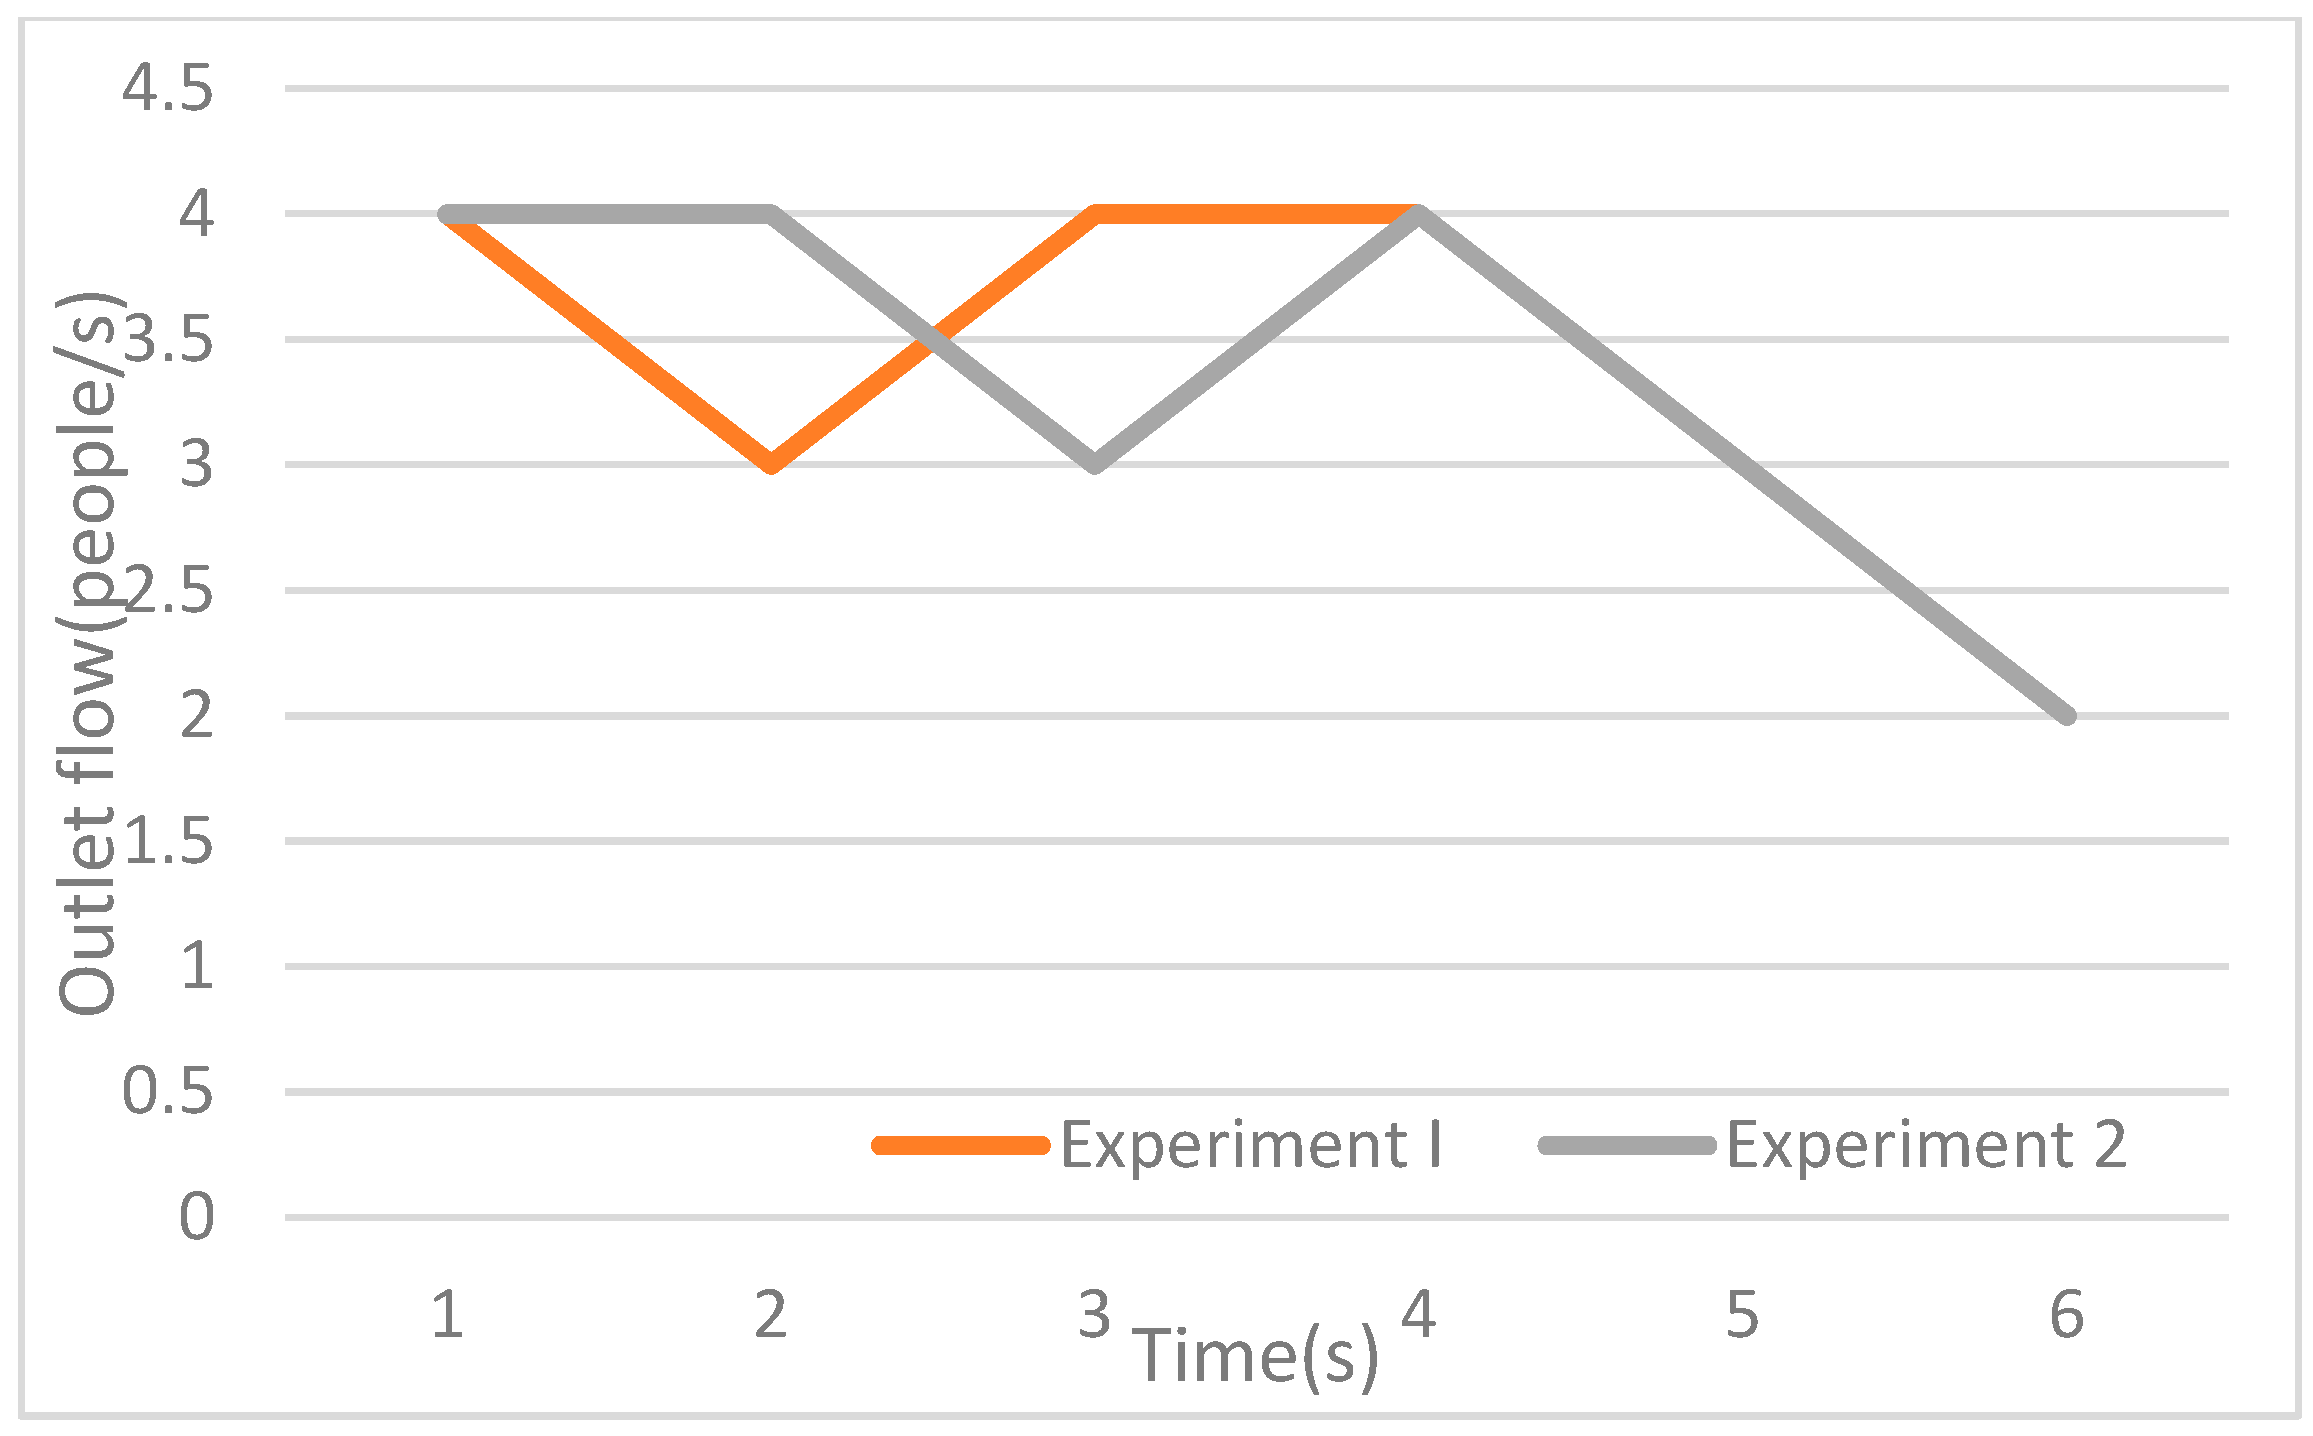
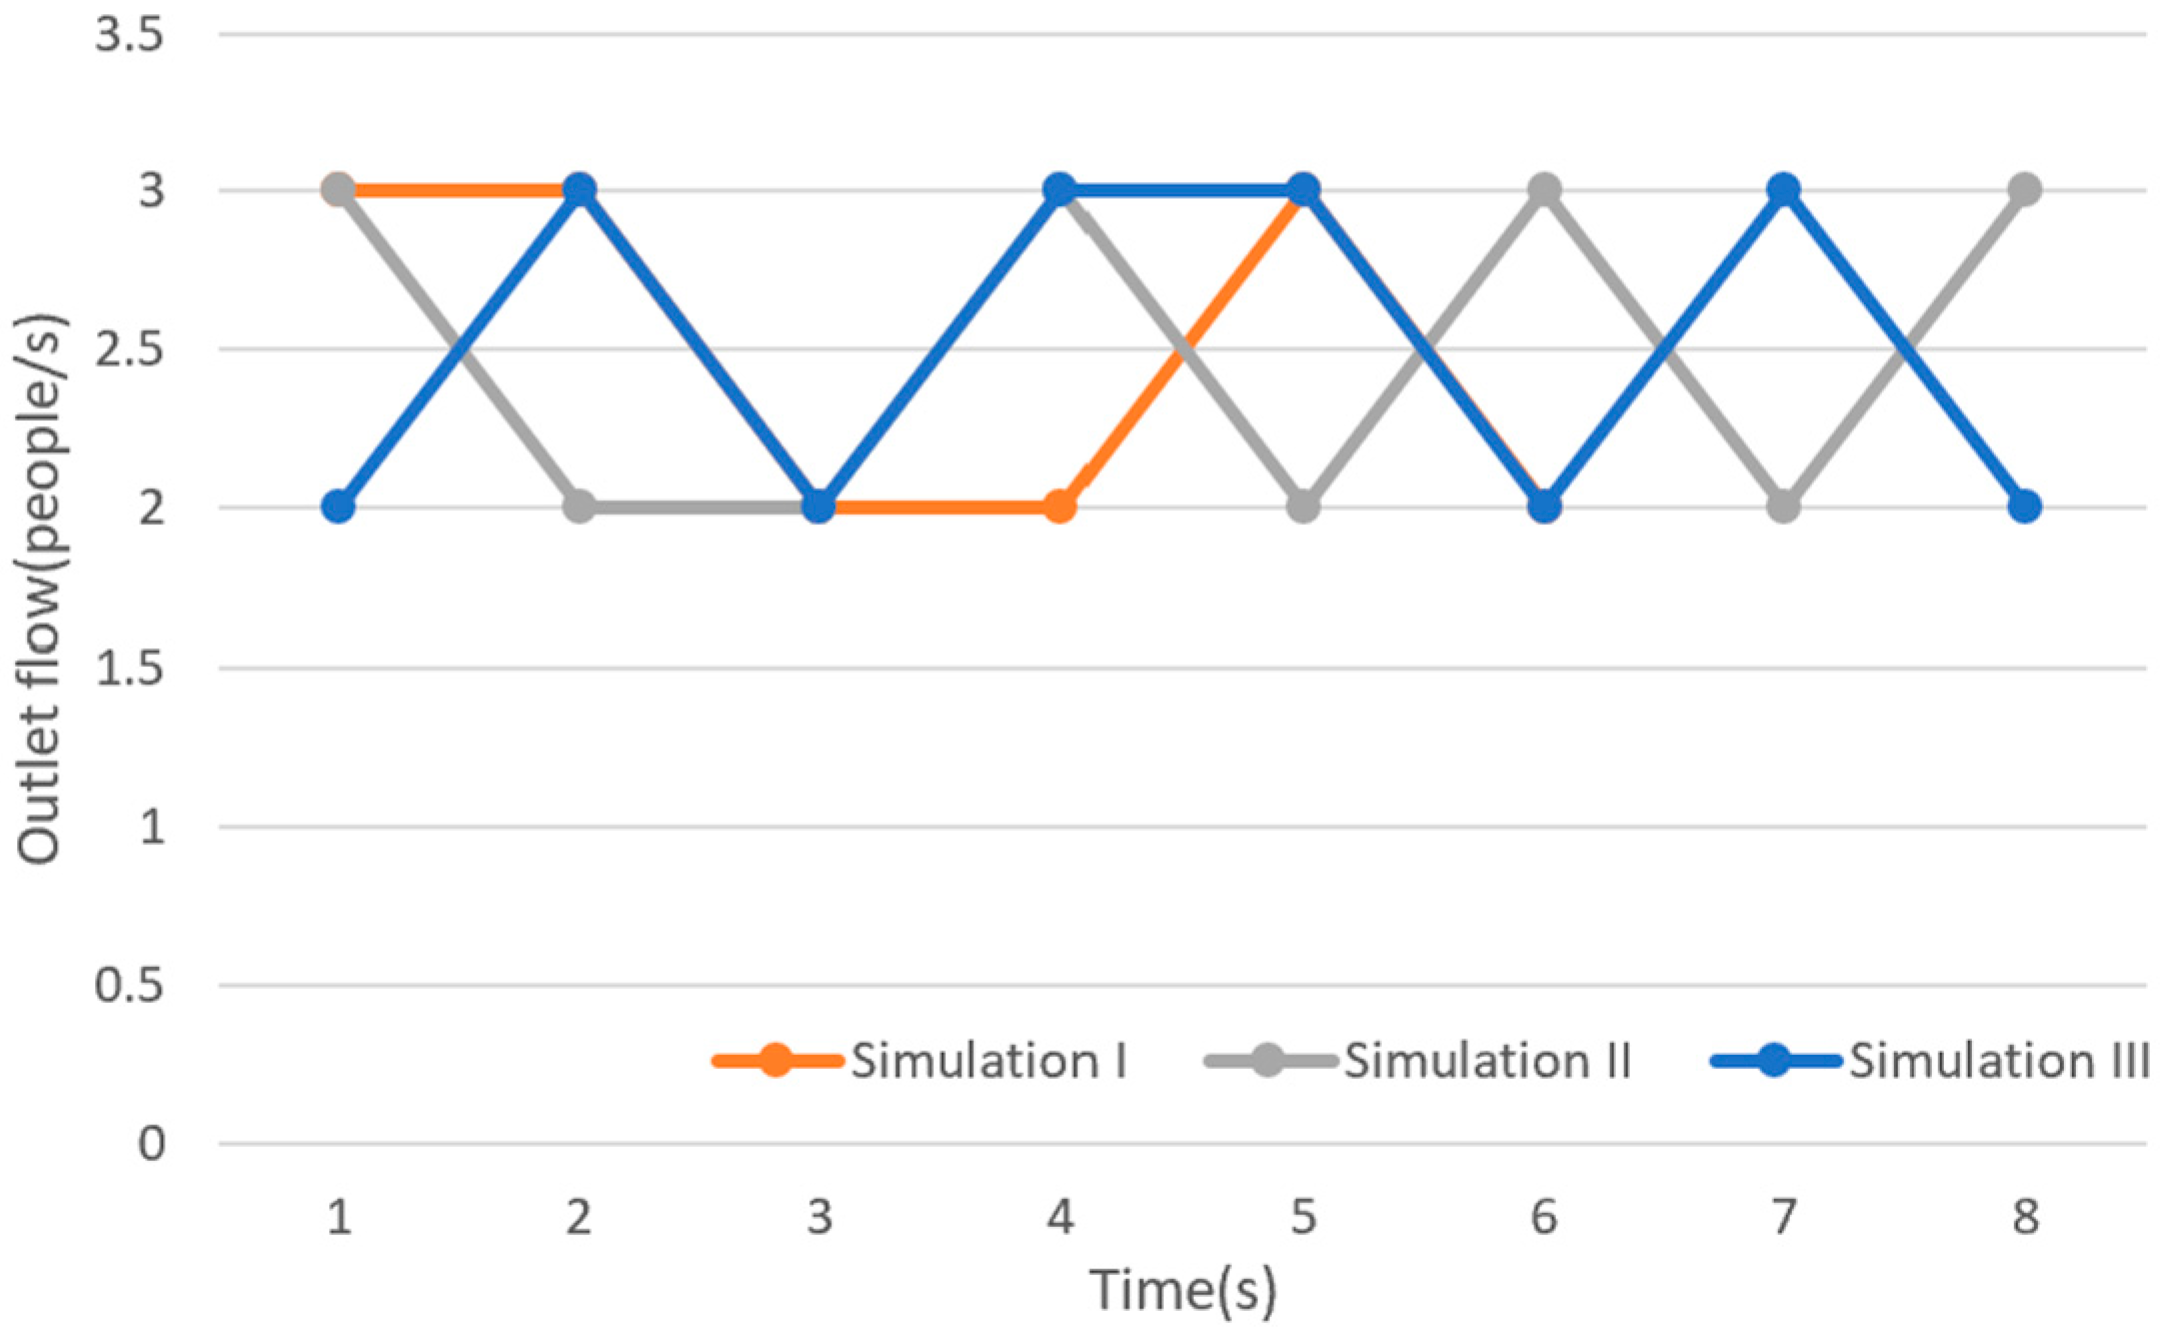
The experimental results show that, compared with the previous grid model and the social force model, the AEM solves the problem of pedestrian evacuation behavior distortion to a certain extent, which also can deal with dense obstacle scenes, making pedestrians more flexible in evacuation path selection.


