

Collective Effects of Fire Intensity and Sloped Terrain on Wind-Driven Surface Fire and Its Impact on a Cubic Structure


Abstract
:1. Introduction
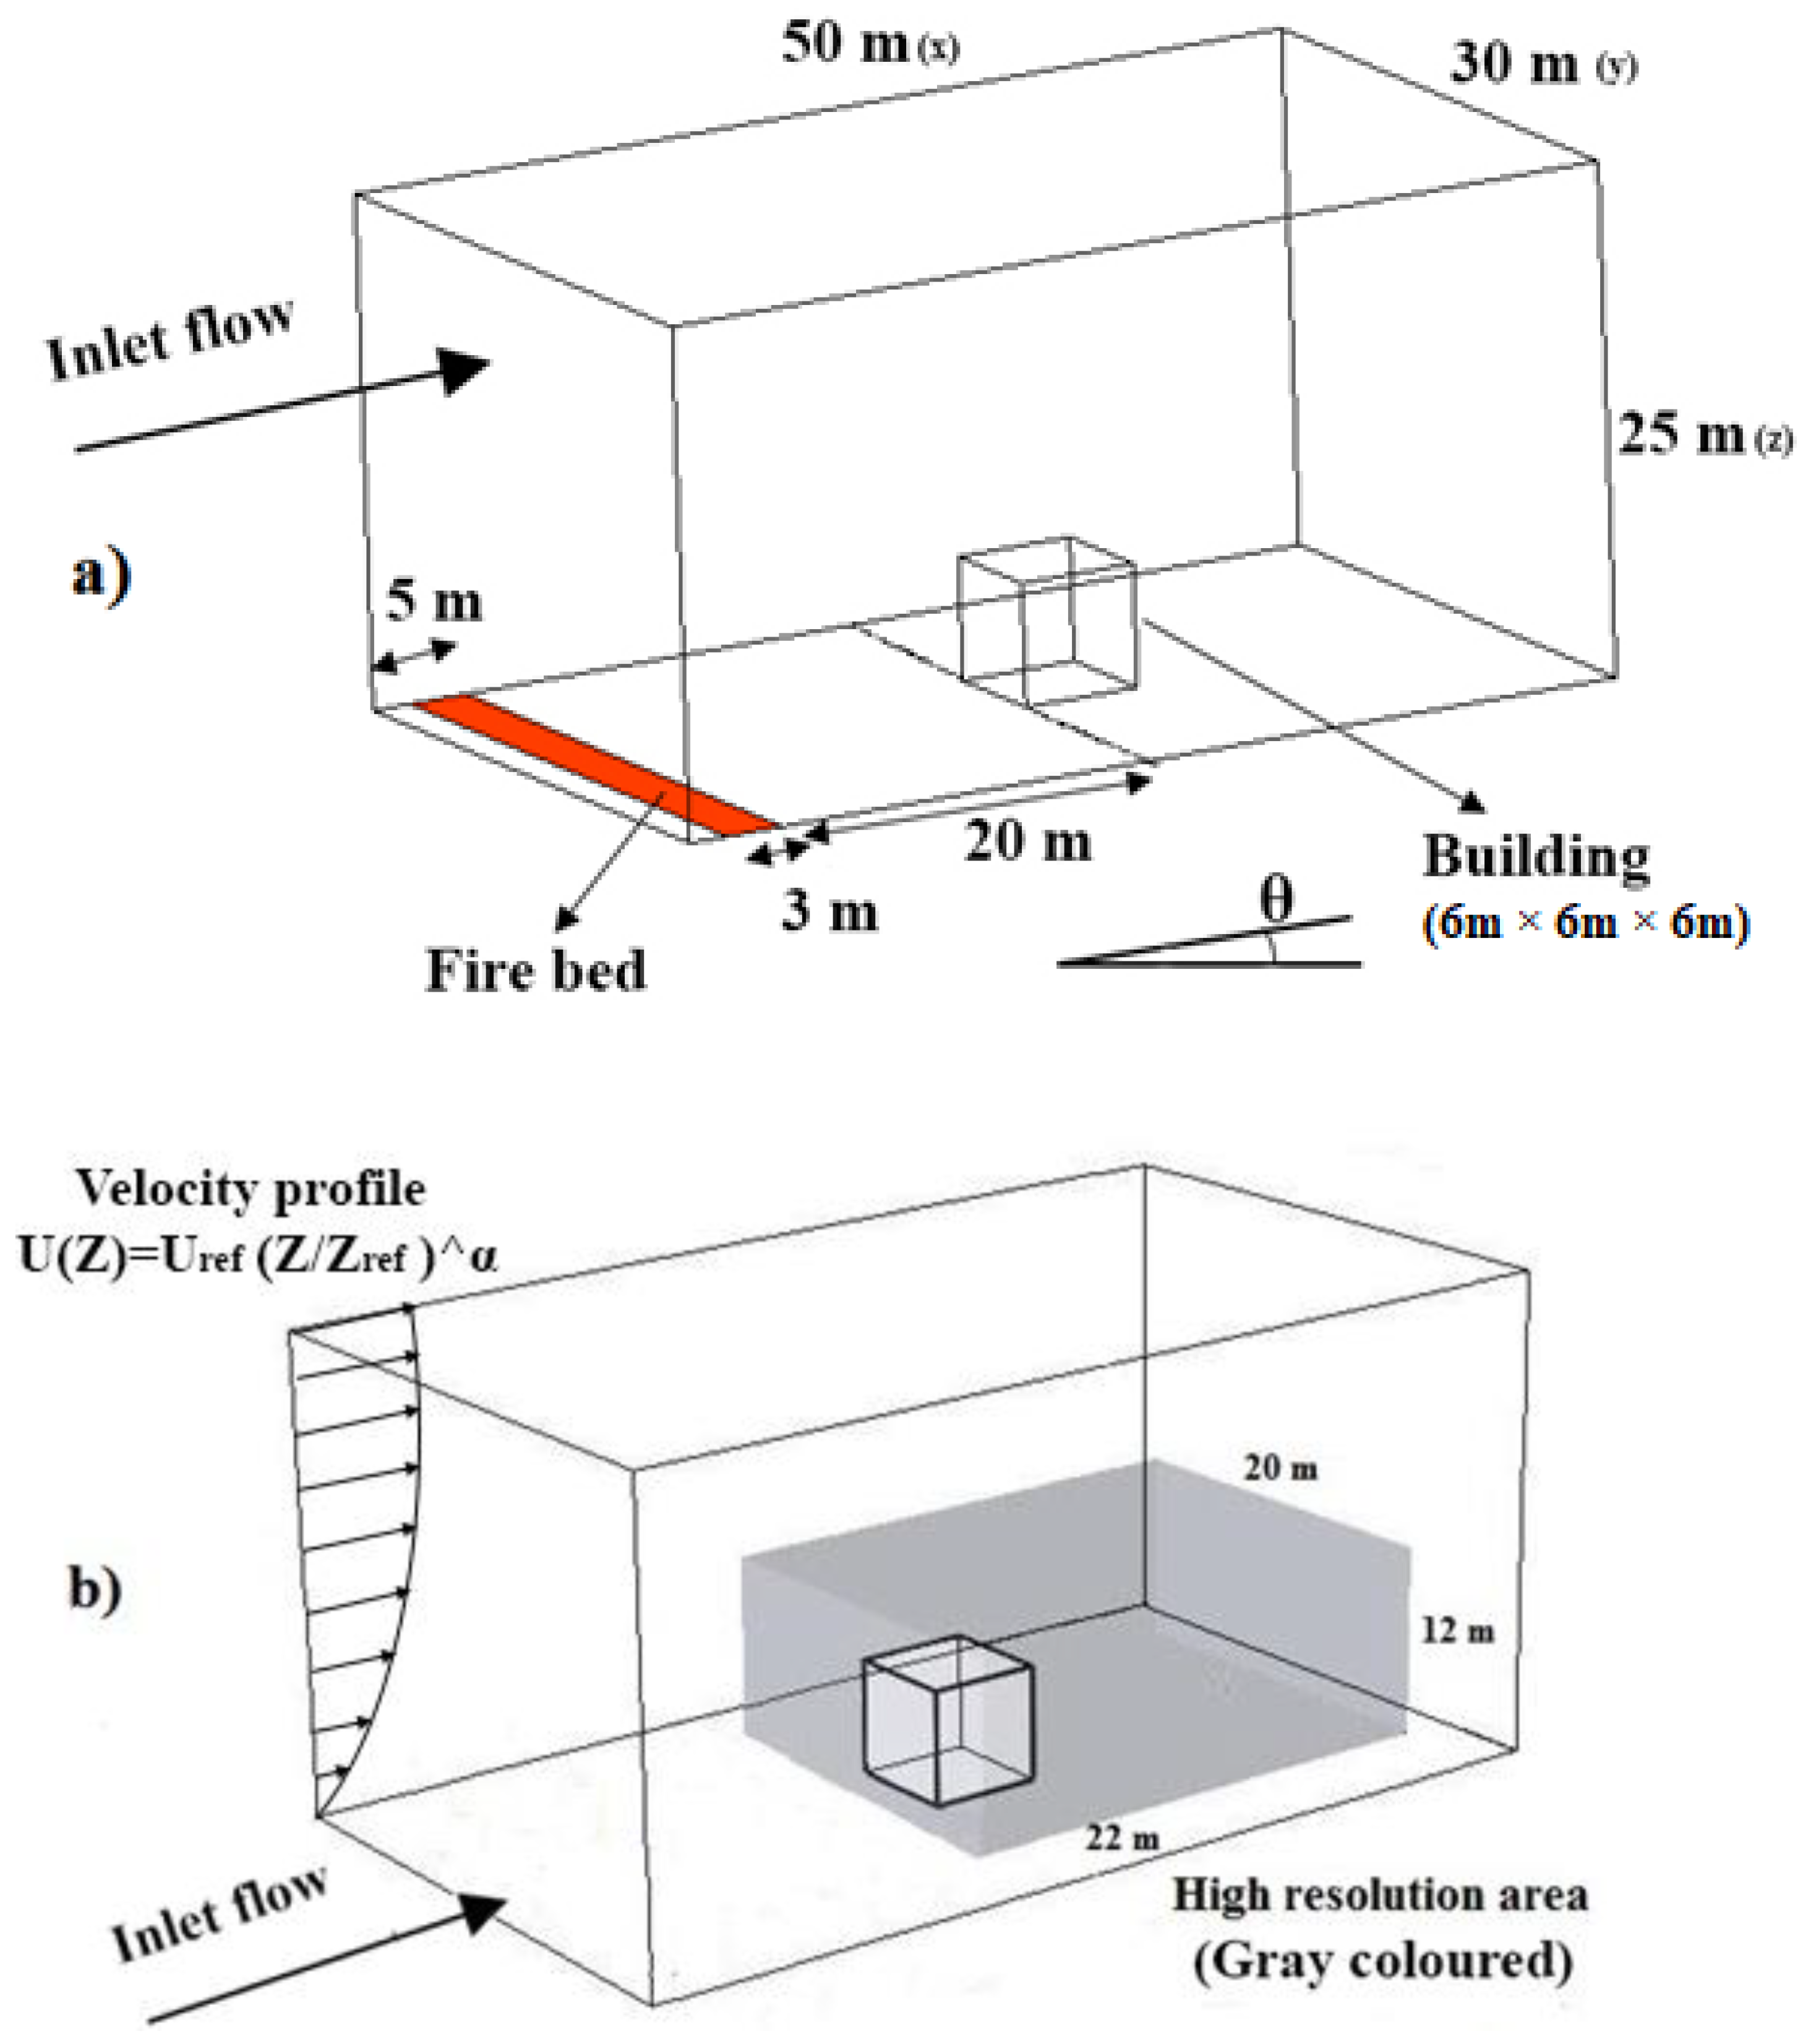
2. Model Description
3. Numerical Method
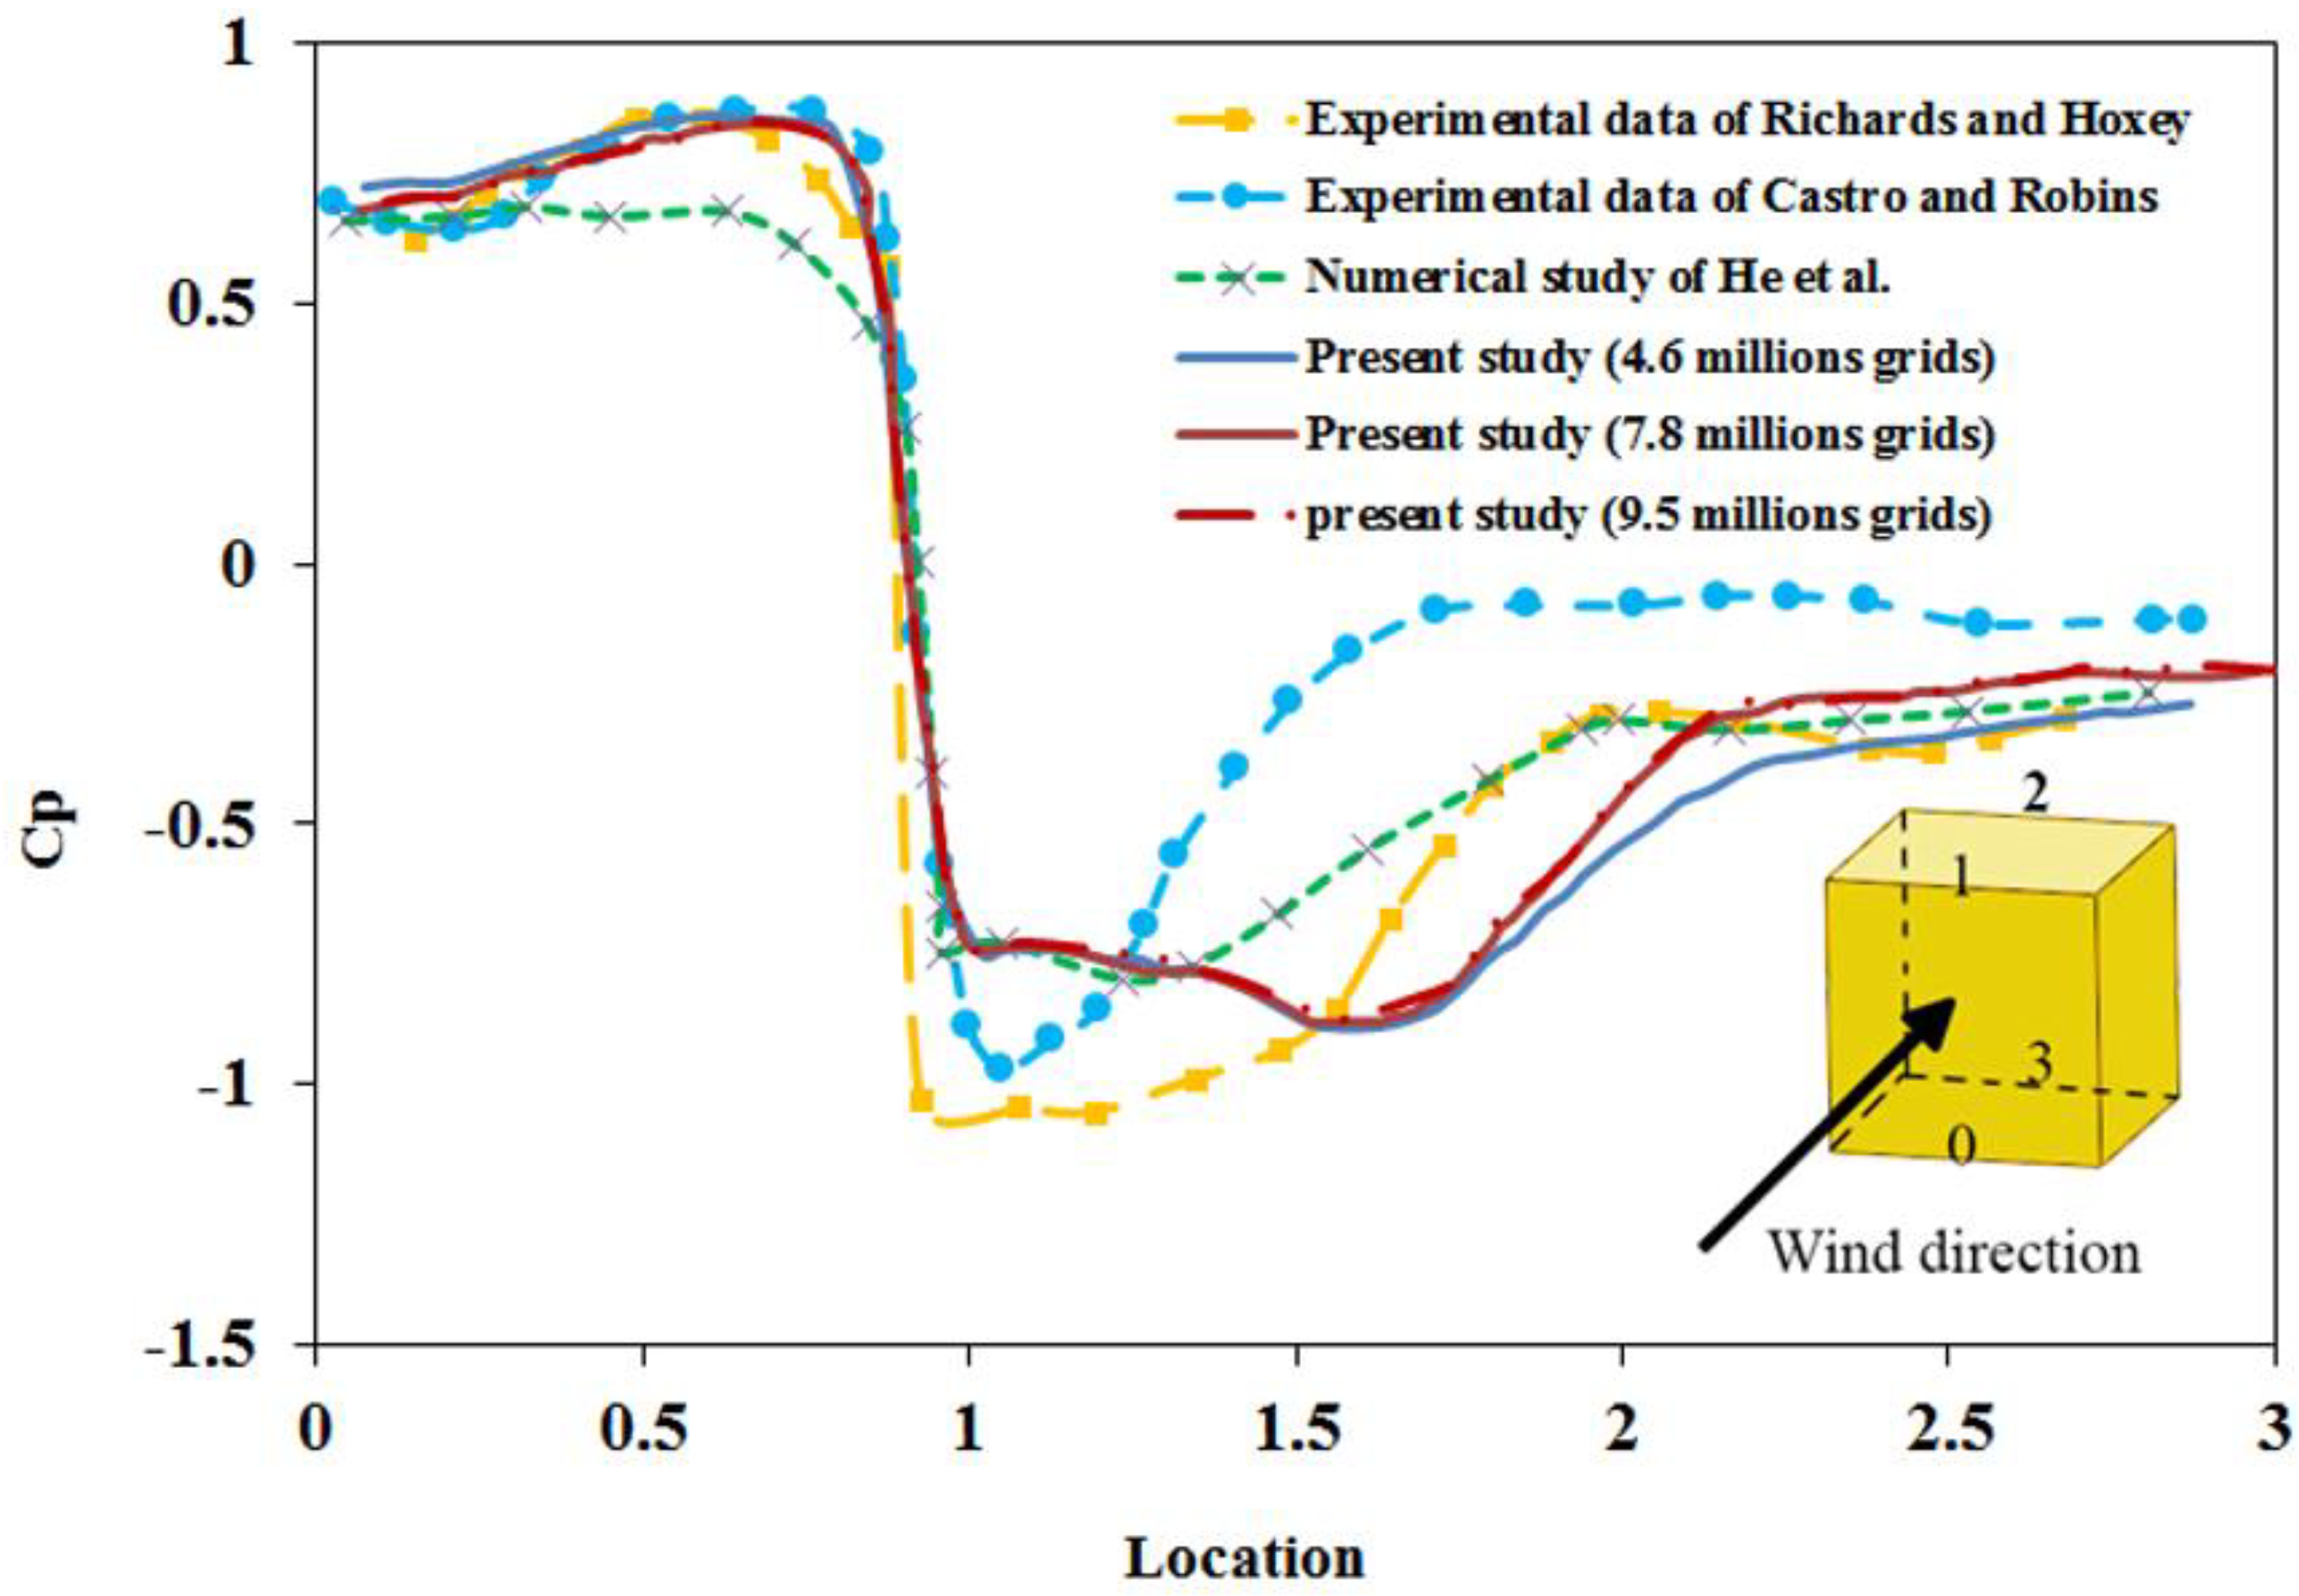
4. Model Validation
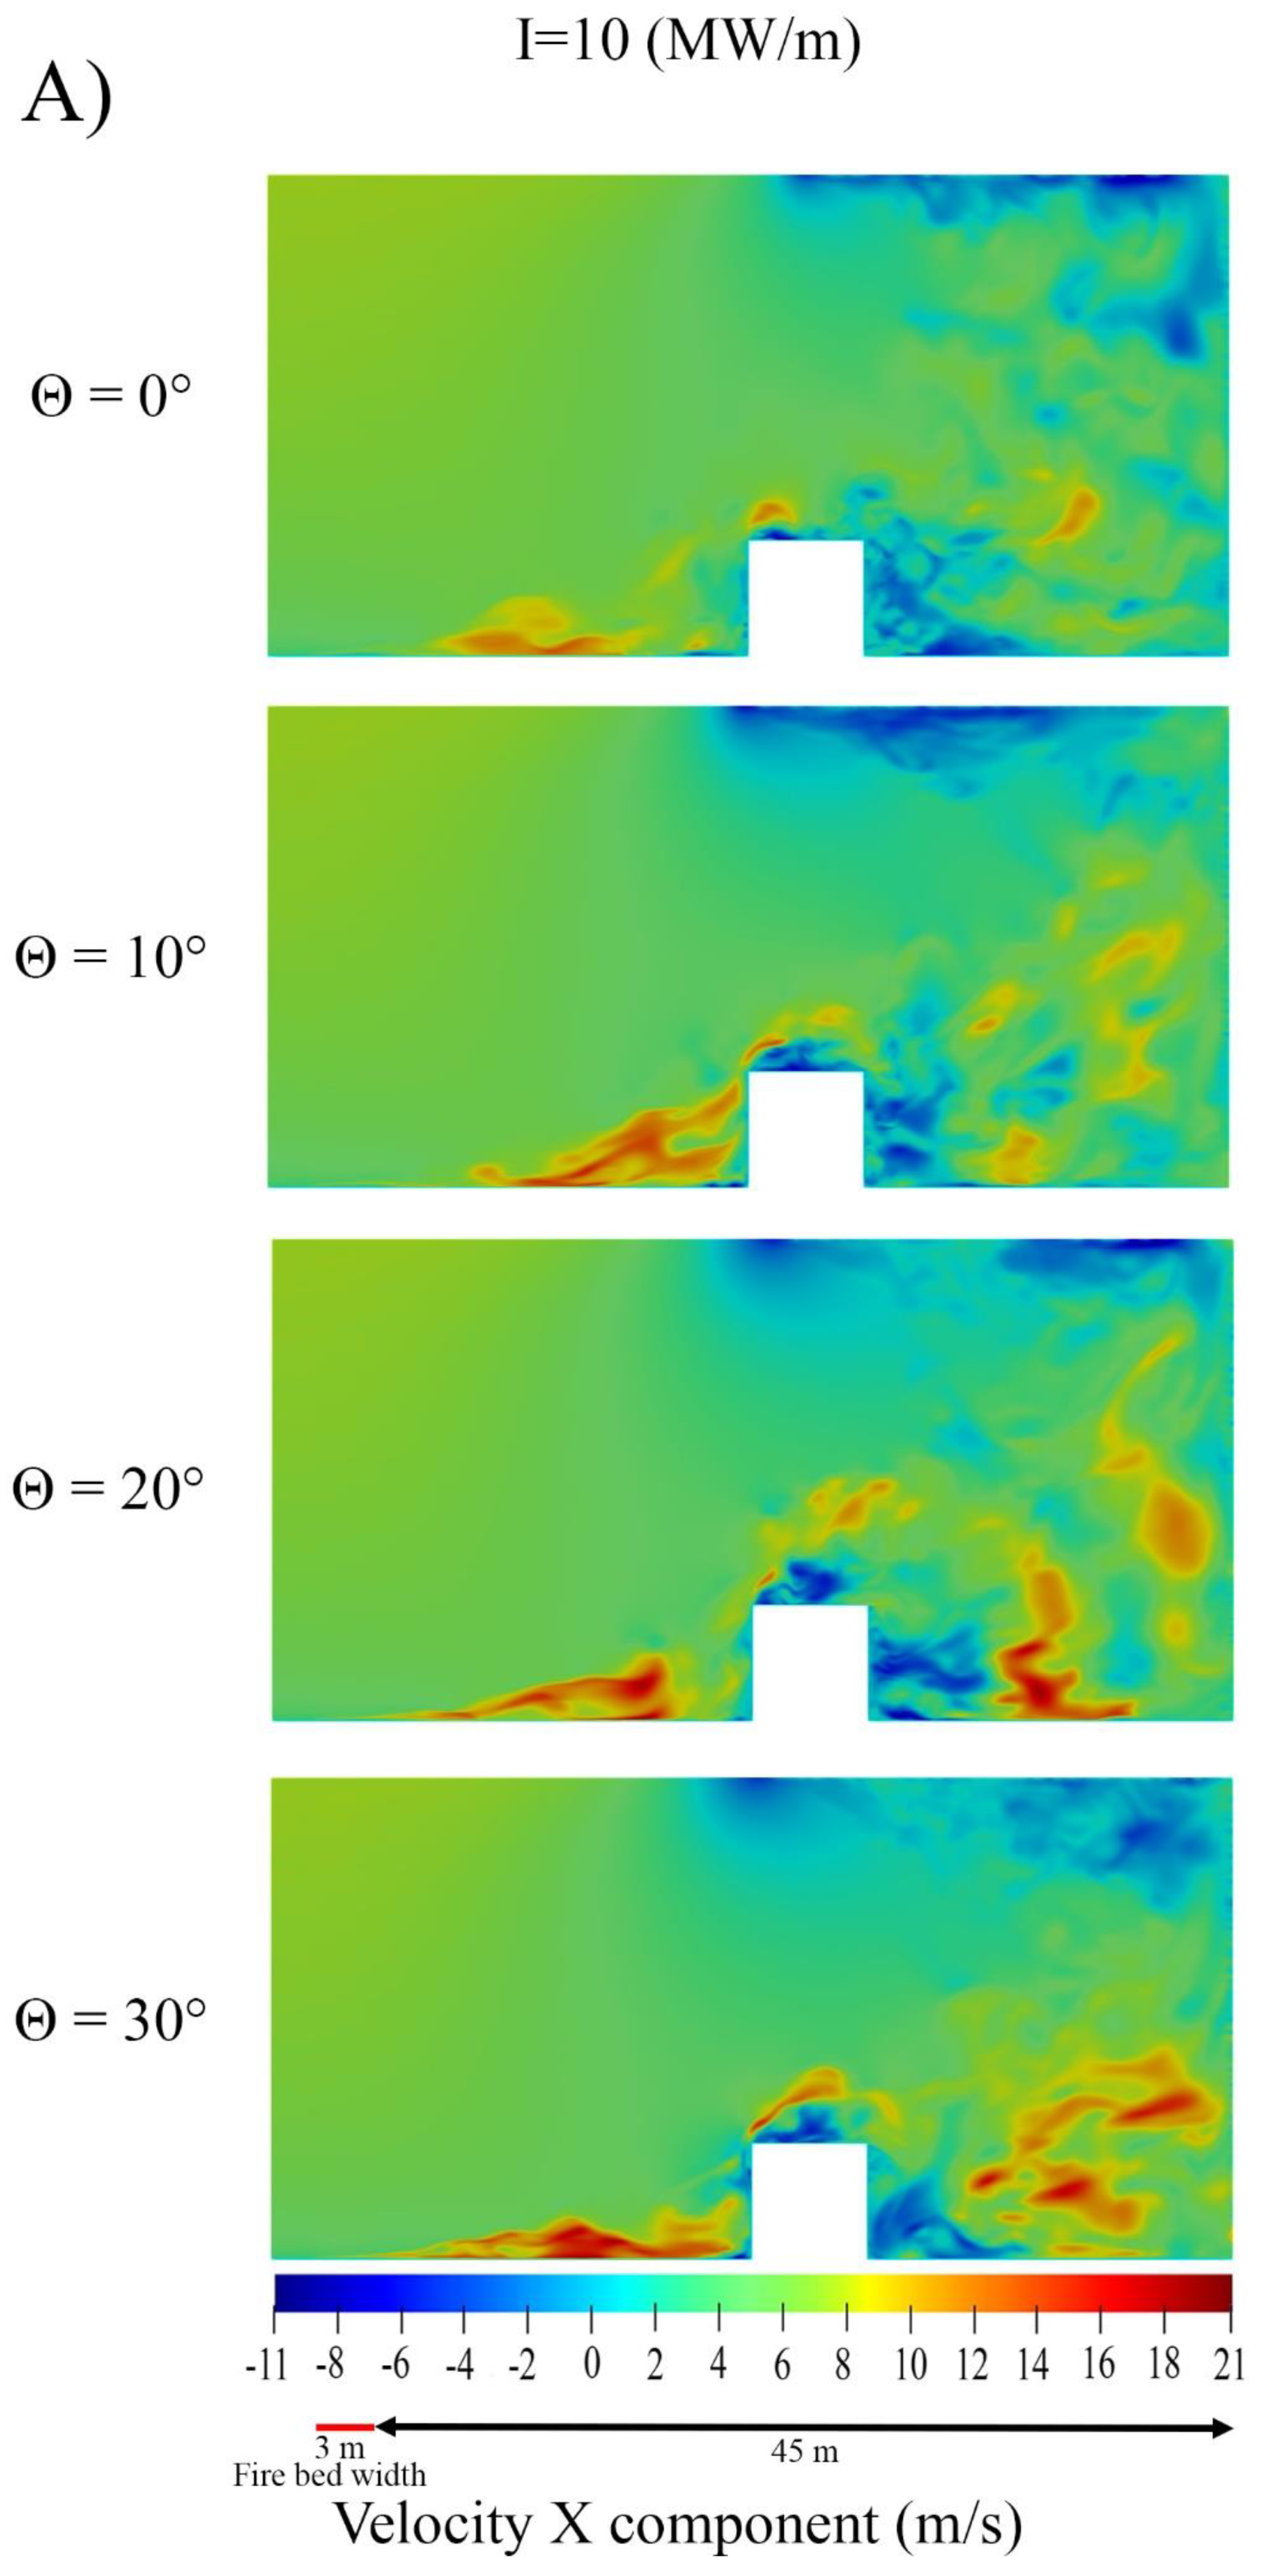
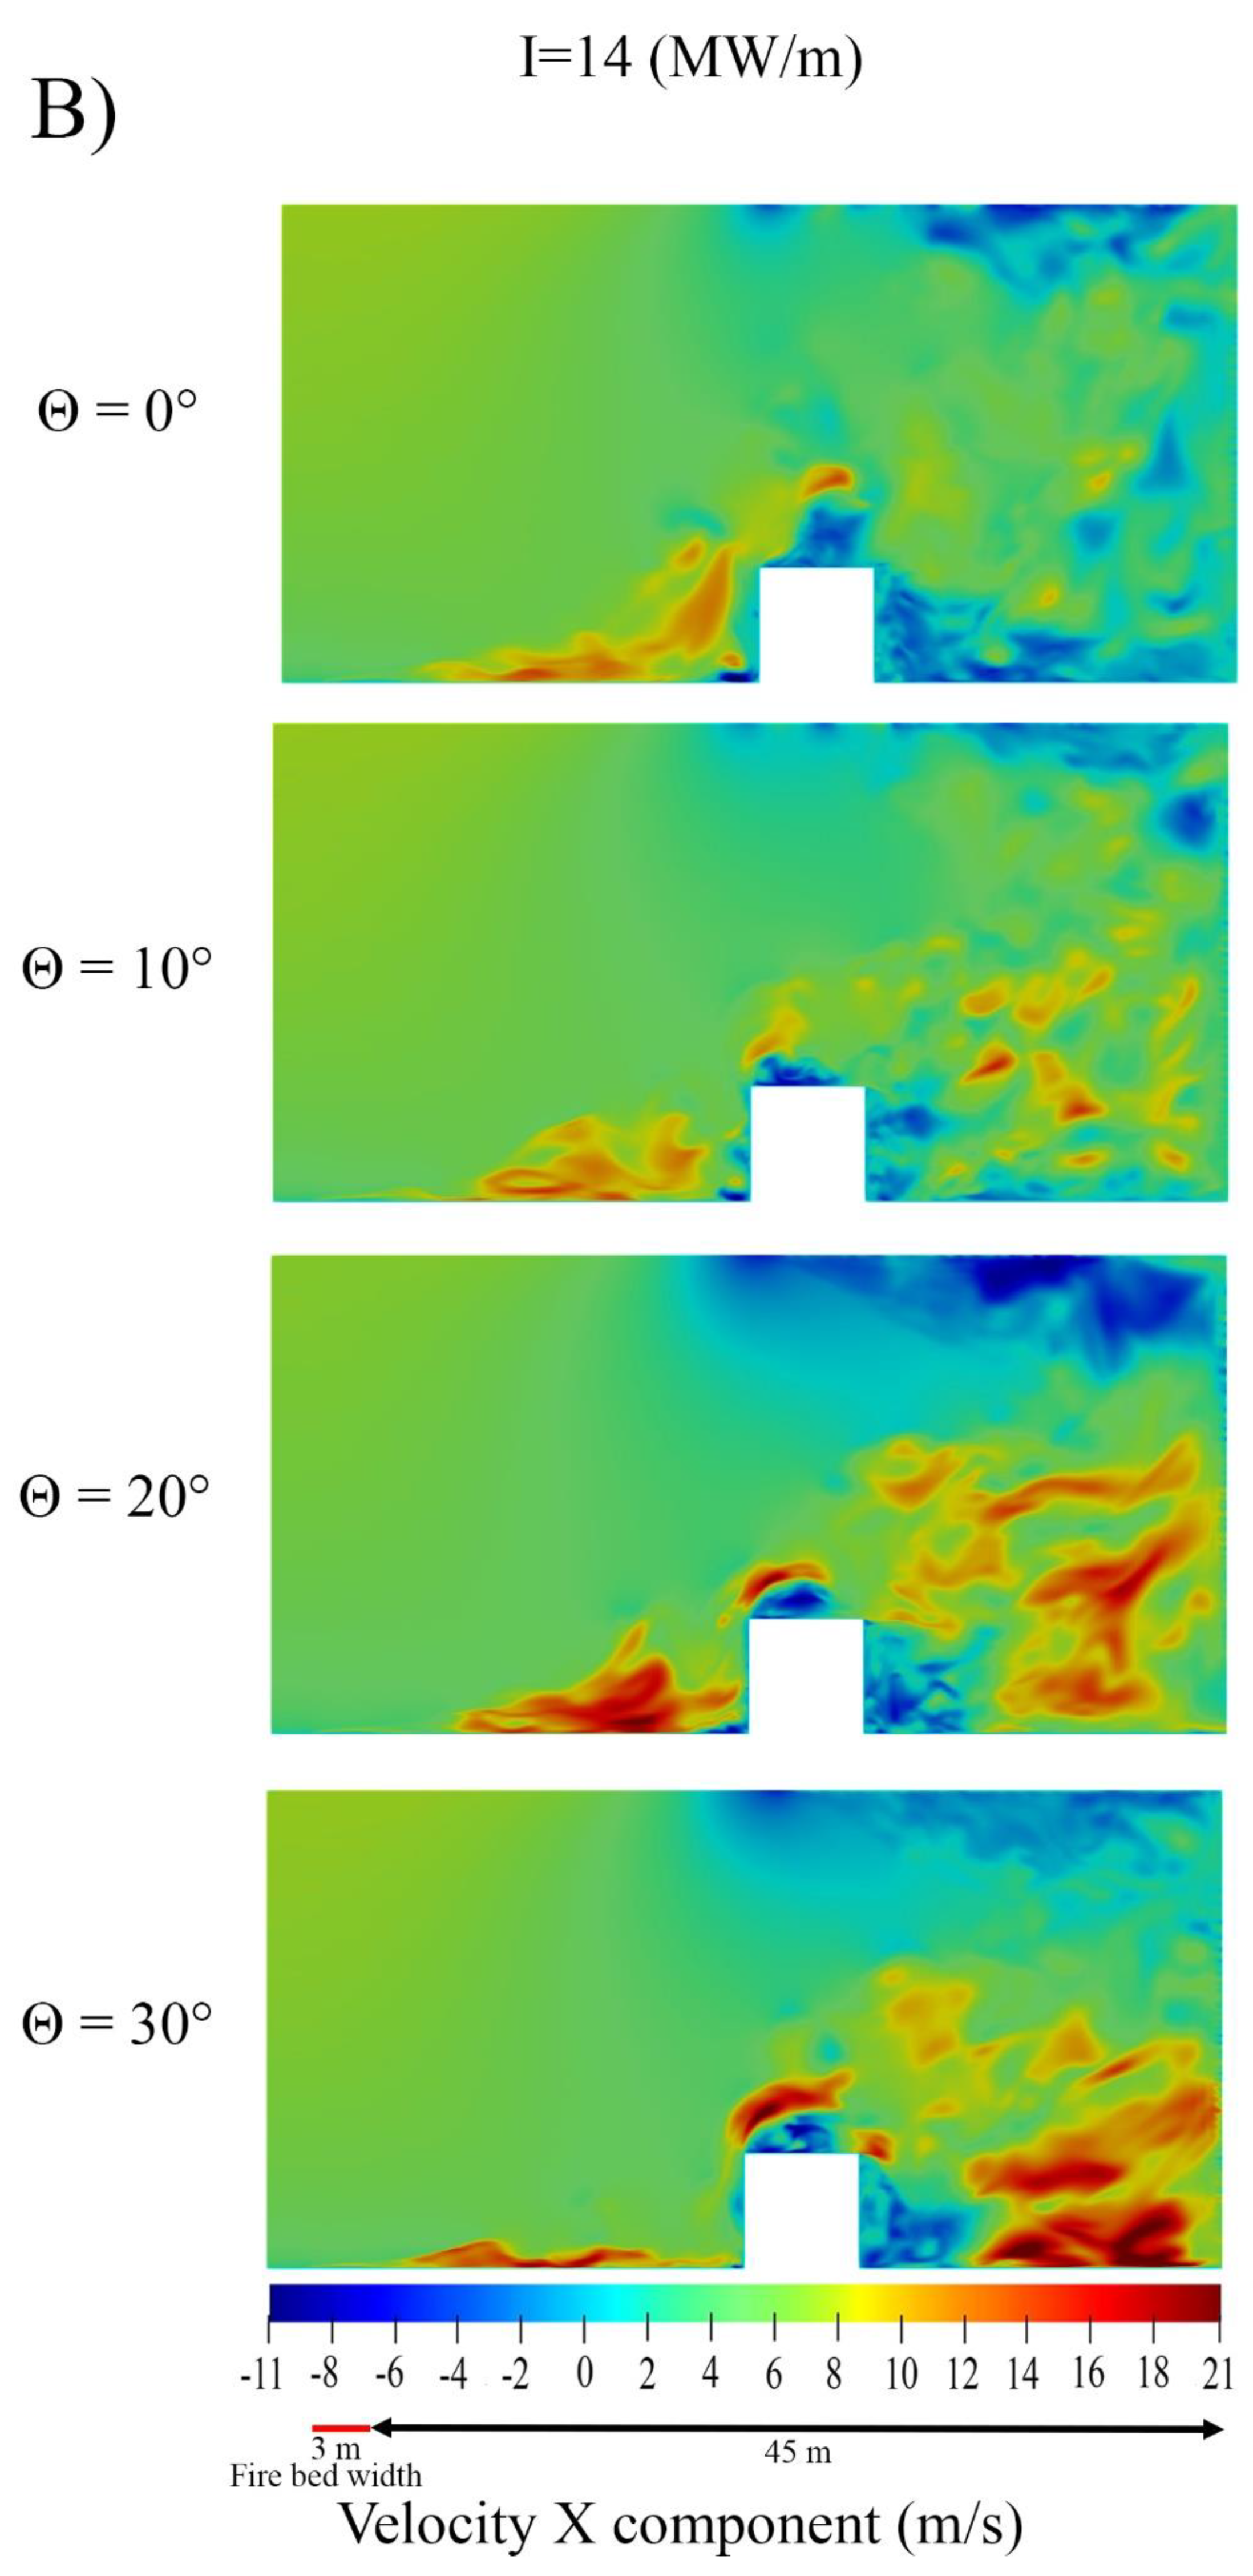
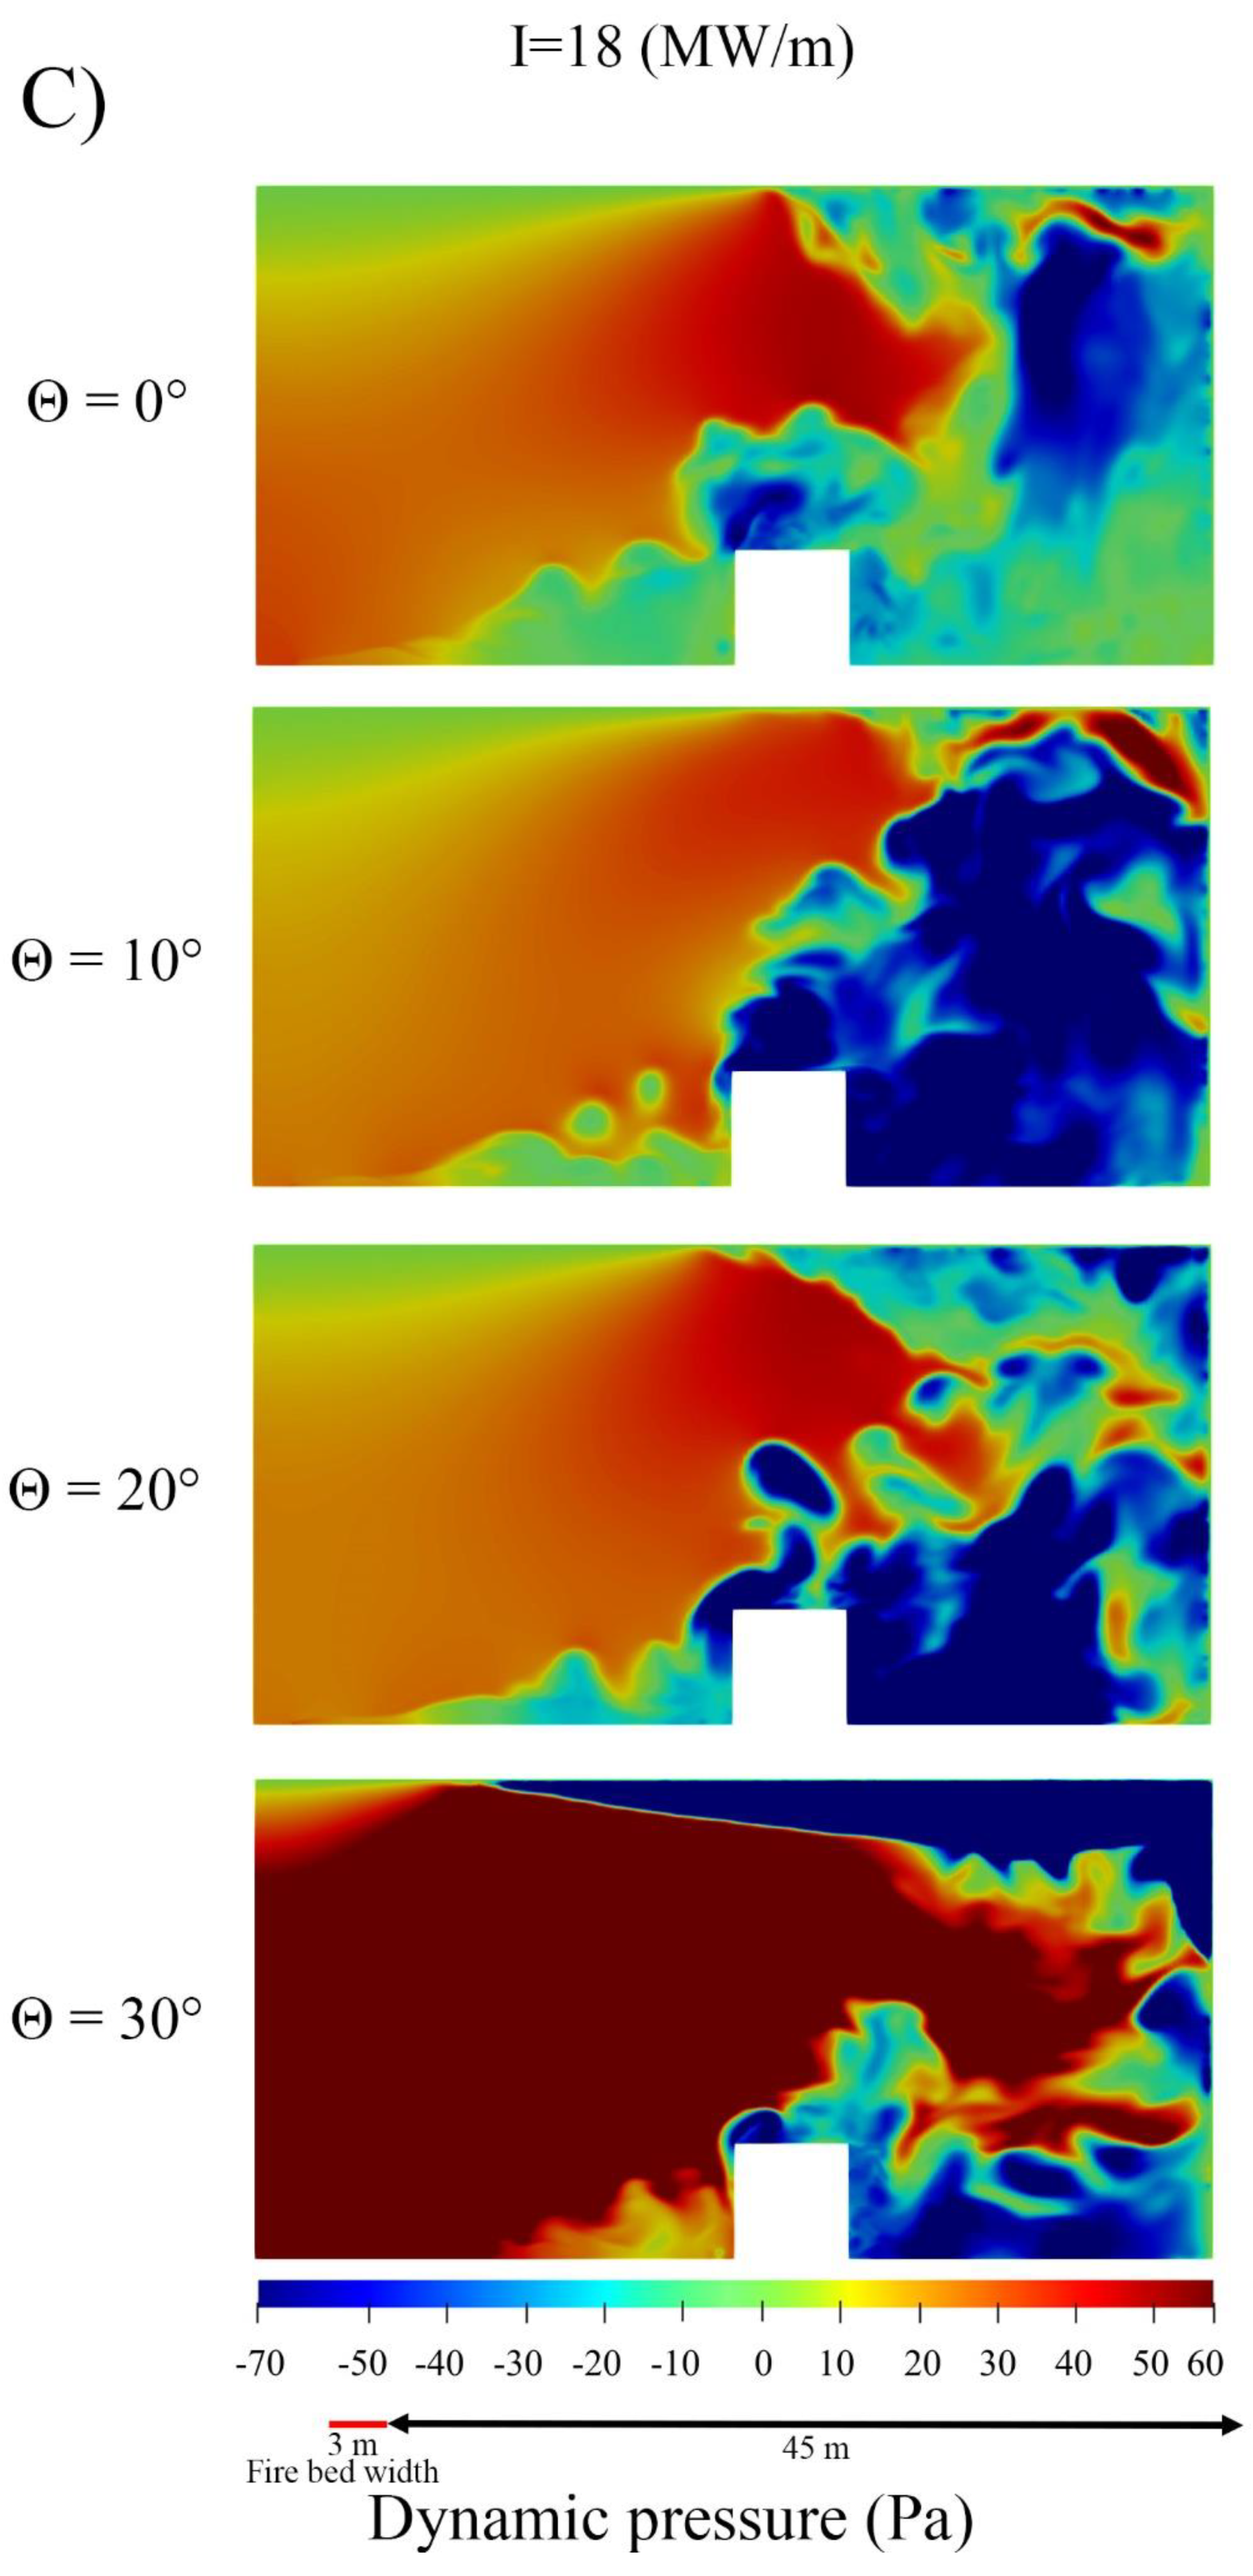
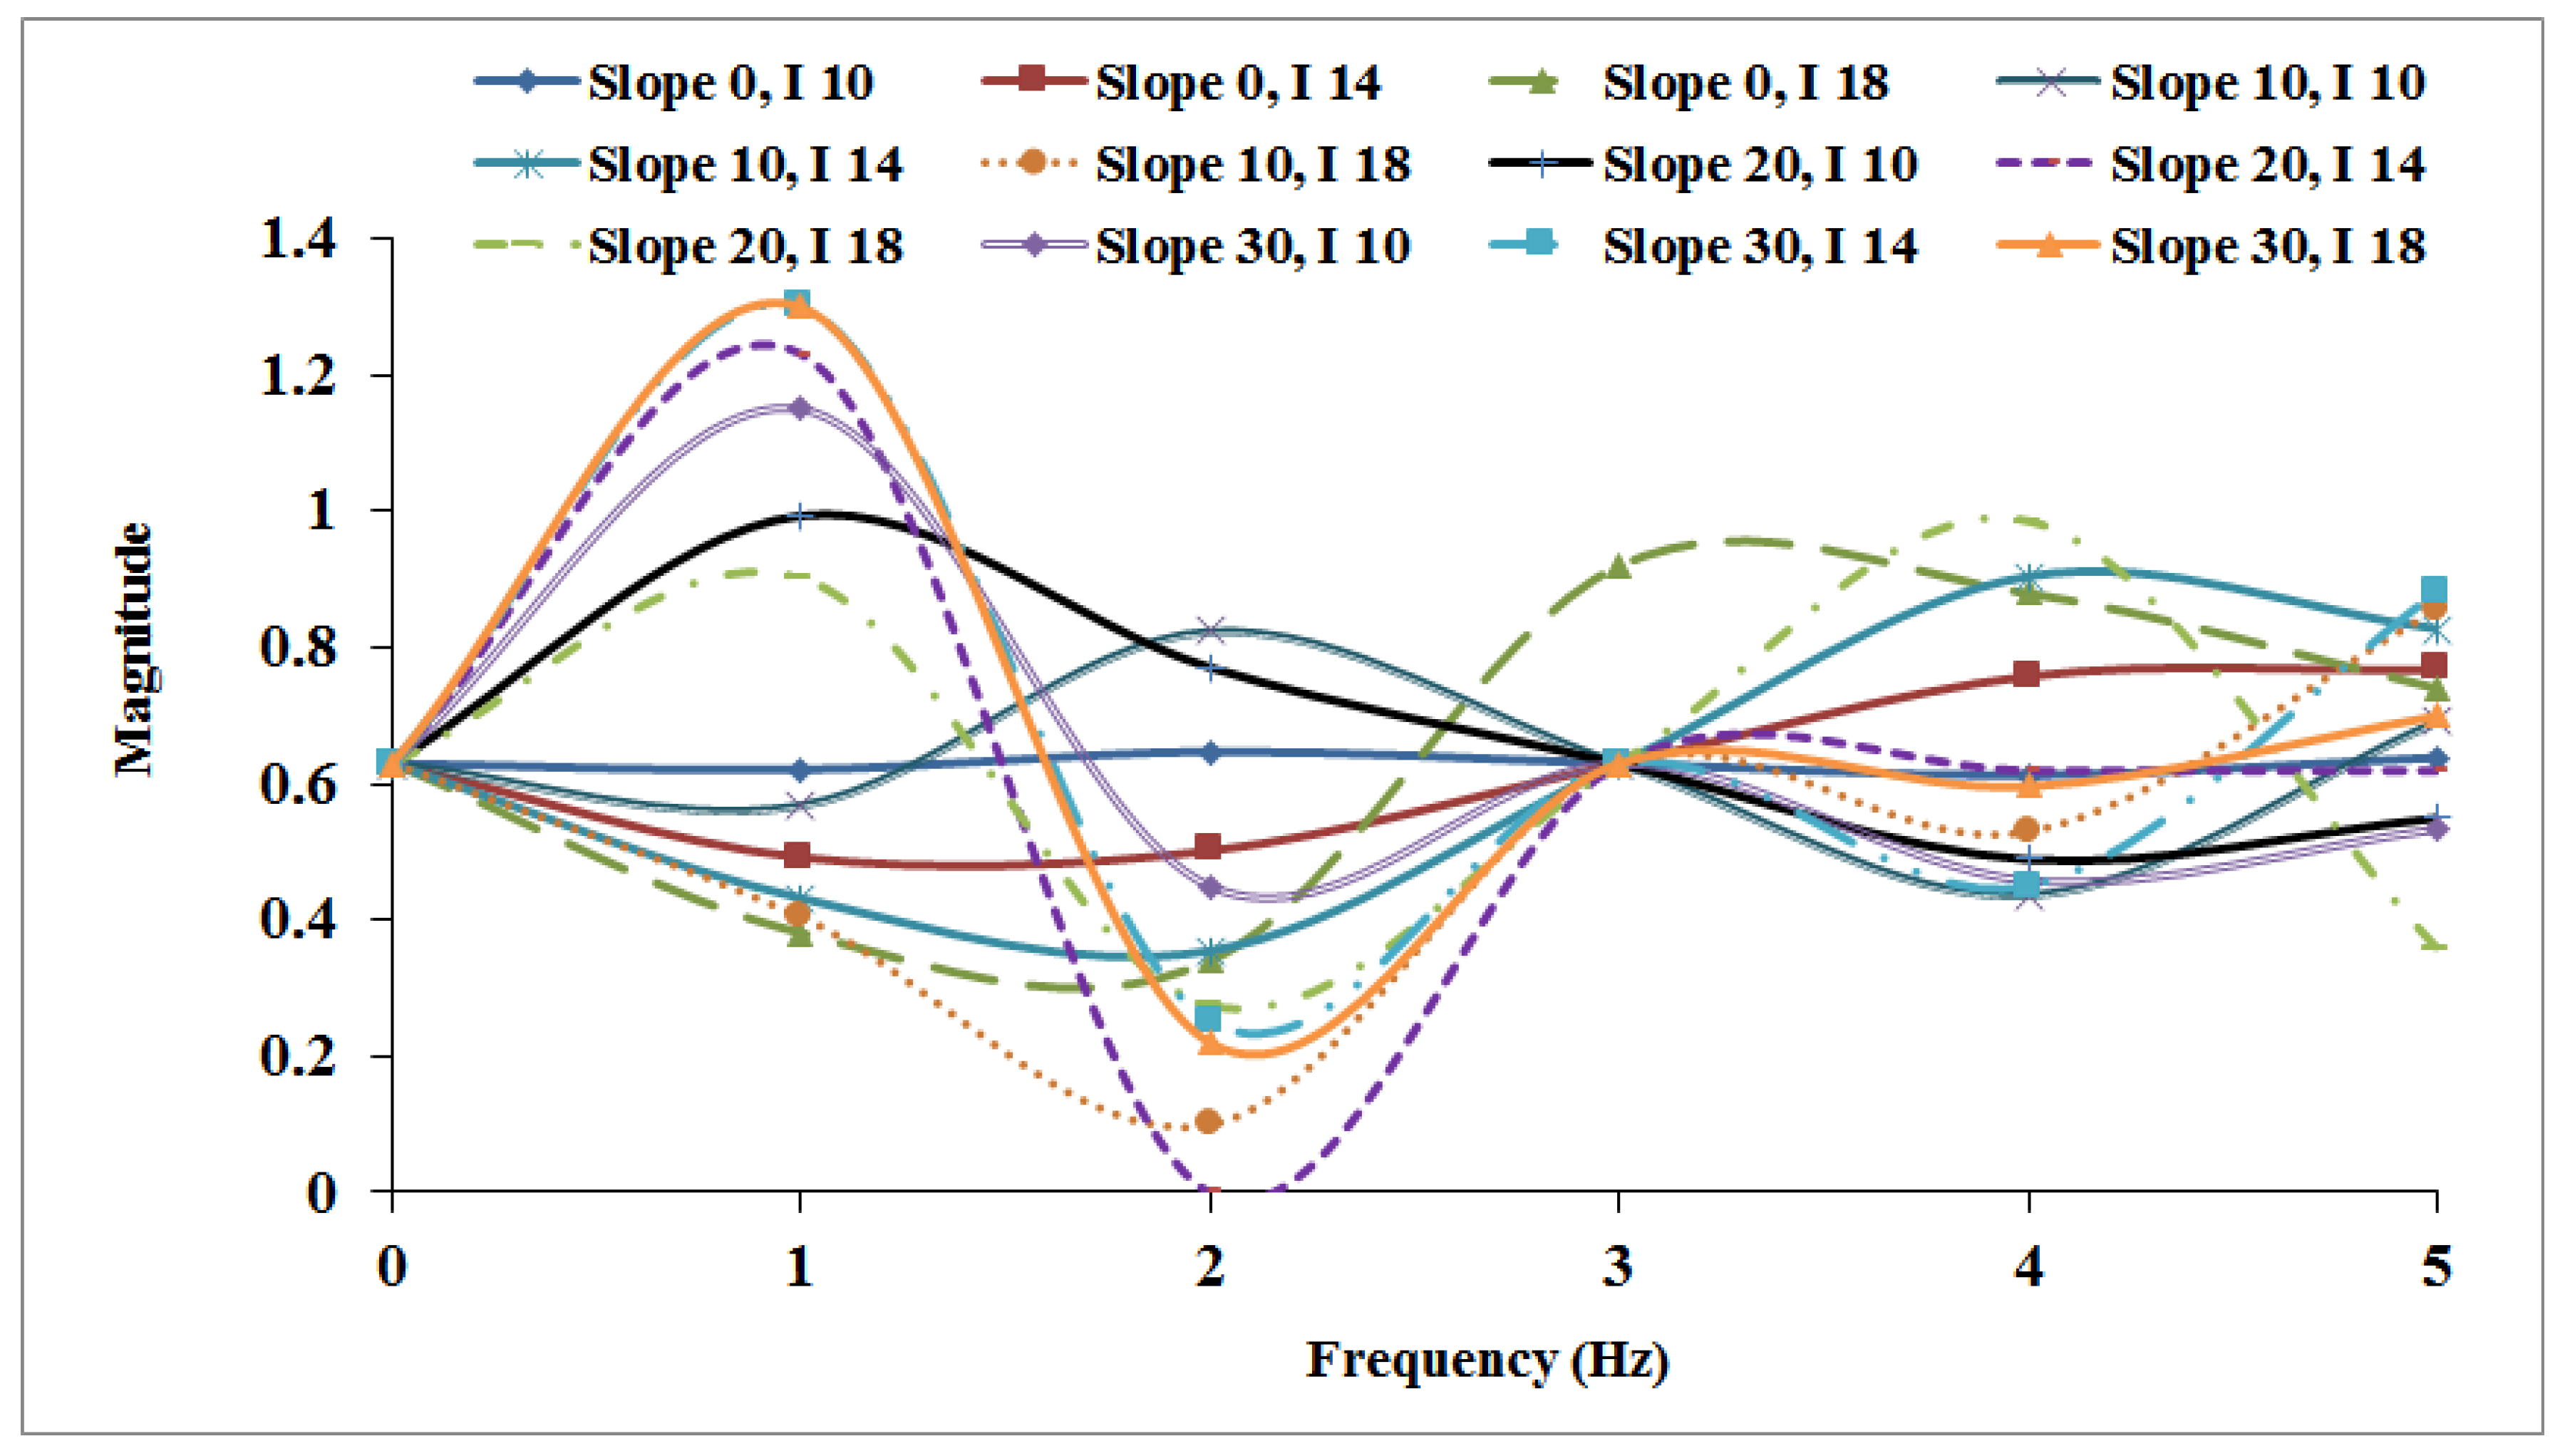
5. Result and Discussion
6. Conclusions
Author Contributions
Funding
Institutional Review Board Statement
Informed Consent Statement
Data Availability Statement
Acknowledgments
Conflicts of Interest
Abbreviations
| heat capacity (J/kg/K) | |
| f | frequency (Hz) |
| g | gravitational acceleration (m/s2) |
| sensible enthalpy (J/kg) | |
| j | mass diffusive flux (kg/m2/s) |
| number of species | |
| p | pressure (Pa) |
| Pr | Prandtl number |
| heat release per unit volume (W/m3) | |
| radiative flux (W/m2) | |
| Q | Q-criterion |
| Sc | Schmidt number |
| t | time (s) |
| T | temperature (K) |
| U/u | velocity (m/s) |
| Greek | |
| thermal diffusivity (kg/m/s) | |
| dynamic viscosity (kg/m/s) | |
| density (kg/m3) | |
| reaction rate (kg/m3/s) | |
| Subscripts | |
| c | combustion |
| i, j, k | coordinate index |
| k | specie mix mixture |
| r | radiative |
| sgs | sub-grid scale |
| t | turbulent |
| ref | reference value |
| Superscripts | |
| T | transpose |
References
- Sullivan, A.L. Wildland surface fire spread modelling, 1990–2007. 2: Empirical and quasi-empirical models. Int. J. Wildland Fire 2009, 18, 369–386. [Google Scholar] [CrossRef] [Green Version]
- Finney, M.A. The challenge of quantitative risk analysis for wildland fire. For. Ecol. Manag. 2005, 211, 97–108. [Google Scholar] [CrossRef]
- Sharples, J.J.; McRae, R.H.; Wilkes, S.R. Wind–terrain effects on the propagation of wildfires in rugged terrain: Fire channelling. Int. J. Wildland Fire 2012, 21, 282–296. [Google Scholar] [CrossRef] [Green Version]
- McArthur, A.G. Weather and Grassland Fire Behavior; Department of National Development, Forestry and Timber Bureau: Canberra, Australia, 1966; Volume 107, p. 23.
- Rothermel, R.C. A mathematical model for predicting fire spread in wildland fuels. In Intermountain Forest & Range Experiment Station, Forest Service; US Department of Agriculture: Logan, UT, USA, 1972. [Google Scholar]
- Noble, I.R.; Gill, A.M.; Bary, G.A. McArthur’s fire-danger meters expressed as equations. Aust. J. Ecol. 1980, 5, 201–203. [Google Scholar] [CrossRef]
- Sharples, J.J. Review of formal methodologies for wind–slope correction of wildfire rate of spread. Int. J. Wildland Fire 2008, 17, 179–193. [Google Scholar] [CrossRef]
- Dupuy, J.L.; Maréchal, J. Slope effect on laboratory fire spread: Contribution of radiation and convection to fuel bed preheating. Int. J. Wildland Fire 2011, 20, 289–307. [Google Scholar] [CrossRef]
- Van Wagner, C.E. Fire Behaviour Mechanisms in a Red Pine Plantation; Canadian Forest Service: Victoria, BC, Canada, 1968. [Google Scholar]
- Viegas, D.X. Fire line rotation as a mechanism for fire spread on a uniform slope. Int. J. Wildland Fire 2002, 11, 11–23. [Google Scholar] [CrossRef]
- Dupuy, J.L. Slope and fuel load effects on fire behavior: Laboratory experiments in pine needles fuel beds. Int. J. Wildland Fire 1995, 5, 153–164. [Google Scholar] [CrossRef]
- Weise, D.R.; Biging, G.S. A qualitative comparison of fire spread models incorporating wind and slope effects. For. Sci. 1997, 43, 170–180. [Google Scholar]
- Mendes-Lopes, J.M.; Ventura, J.M.; Amaral, J.M. Flame characteristics, temperature–time curves, and rate of spread in fires propagating in a bed of Pinus pinaster needles. Int. J. Wildland Fire 2003, 12, 67–84. [Google Scholar] [CrossRef]
- Vega, J.A.; Cuiñas, P.; Fonturbel, T.; Pérez-Gorostiaga, P.; Fernandez, C. Predicting fire behaviour in Galician (NW Spain) shrubland fuel complexes. In Proceedings of the 3rd International Conference on Forest Fire Research and 14th Conference on Fire and Forest Meteorology, Coimbra, Portugal, 16 November 1998; Volume 2, pp. 16–20. [Google Scholar]
- Fernandes, P.M.; Botelho, H.S.; Rego, F.C.; Loureiro, C. Empirical modelling of surface fire behaviour in maritime pine stands. Int. J. Wildland Fire 2009, 18, 698–710. [Google Scholar] [CrossRef]
- Cheney, N.P.; Gould, J.S.; Catchpole, W.R. The influence of fuel, weather and fire shape variables on fire-spread in grasslands. Int. J. Wildland Fire 1993, 3, 31–44. [Google Scholar] [CrossRef]
- Dupuy, J.L.; Maréchal, J.; Portier, D.; Valette, J.C. The effects of slope and fuel bed width on laboratory fire behaviour. Int. J. Wildland Fire 2011, 20, 272–288. [Google Scholar] [CrossRef]
- Edalati-nejad, A.; Ghodrat, M.; Simeoni, A. Numerical investigation of the effect of sloped terrain on wind-driven surface fire and its impact on idealized structures. Fire 2021, 4, 94. [Google Scholar] [CrossRef]
- Eftekharian, E.; Rashidi, M.; Ghodrat, M.; He, Y.; Kwok, K.C. LES simulation of terrain slope effects on wind enhancement by a point source fire. Case Stud. Therm. Eng. 2020, 18, 100588. [Google Scholar] [CrossRef]
- Malanson, G.P. Intensity as a third factor of disturbance regime and its effect on species diversity. Oikos 1984, 43, 411–413. [Google Scholar] [CrossRef]
- Edalati-nejad, A.; Ghodrat, M.; Fanaee, S.A.; Simeoni, A. Numerical Simulation of the Effect of Fire Intensity on Wind Driven Surface Fire and Its Impact on an Idealized Building. Fire 2022, 5, 17. [Google Scholar] [CrossRef]
- Keeley, J.E.; McGinnis, T.W. Impact of prescribed fire and other factors on cheatgrass persistence in a Sierra Nevada ponderosa pine forest. Int. J. Wildland Fire 2007, 16, 96–106. [Google Scholar] [CrossRef]
- Keeley, J.E. Fire intensity, fire severity and burn severity: A brief review and suggested usage. Int. J. Wildland Fire 2009, 18, 116–126. [Google Scholar] [CrossRef]
- Byram, G.M. Combustion of forest fuels. For. Fire Control Use 1959, 61–89. Available online: https://www.scirp.org/(S(351jmbntvnsjt1aadkposzje))/reference/ReferencesPapers.aspx?ReferenceID=1938996 (accessed on 23 October 2022).
- Hirsch, K.G.; Martell, D.L. A review of initial attack fire crew productivity and effectiveness. Int. J. Wildland Fire 1996, 6, 199–215. [Google Scholar] [CrossRef]
- Finney, M.A.; Cohen, J.D.; McAllister, S.S.; Jolly, W.M. On the need for a theory of wildland fire spread. Int. J. Wildland Fire 2012, 22, 25–36. [Google Scholar] [CrossRef]
- Sullivan, A.L. A review of wildland fire spread modelling, 1990-present, 1: Physical and quasi-physical models. arXiv 2007, arXiv:0706.3074. [Google Scholar]
- Michaletz, S.T.; Johnson, E.A. Fire and biological processes. J. Veg. Sci. 2003, 14, 622–623. [Google Scholar] [CrossRef]
- Chatto, K.; Tolhurst, K.G. A review of the relationship between fireline intensity and the ecological and economic effects of fire, and methods currently used to collect fire data. In Department of Sustainability and Environment; Forest Science Centre: Heidelberg, Australia, 2004. [Google Scholar]
- Williams, R.J.; Cook, G.D.; Gill, A.M.; Moore, P.H. Fire regime, fire intensity and tree survival in a tropical savanna in northern Australia. Aust. J. Ecol. 1999, 24, 50–59. [Google Scholar] [CrossRef]
- Auld Td O’connell, M.a. Predicting patterns of post-fire germination in 35 eastern Australian Fabaceae. Aust. J. Ecol. 1991, 16, 53–70. [Google Scholar] [CrossRef]
- O’Connor, C.; Miller, R.; Bates, J.D. Vegetation response to western juniper slash treatments. Environ. Manag. 2013, 52, 553–566. [Google Scholar] [CrossRef]
- Bradstock, R.A.; Auld, T.D. Soil temperatures during experimental bushfires in relation to fire intensity: Consequences for legume germination and fire management in south-eastern Australia. J. Appl. Ecol. 1995, 76–84. [Google Scholar] [CrossRef]
- Brooks, M.L. Peak fire temperatures and effects on annual plants in the Mojave Desert. Ecol. Appl. 2002, 12, 1088–1102. [Google Scholar] [CrossRef]
- Keeley, J.E.; Baer-Keeley, M.; Fotheringham, C.J. Alien plant dynamics following fire in Mediterranean-climate California shrublands. Ecol. Appl. 2005, 15, 2109–2125. [Google Scholar] [CrossRef]
- Wooster, M.J.; Zhukov, B.; Oertel, D. Fire radiative energy for quantitative study of biomass burning: Derivation from the BIRD experimental satellite and comparison to MODIS fire products. Remote Sens. Environ. 2003, 86, 83–107. [Google Scholar] [CrossRef]
- Dennison, P.E. Fire detection in imaging spectrometer data using atmospheric carbon dioxide absorption. Int. J. Remote Sens. 2006, 27, 3049–3055. [Google Scholar] [CrossRef]
- Caton, S.E.; Hakes, R.S.; Gorham, D.J.; Zhou, A.; Gollner, M.J. Review of pathways for building fire spread in the wildland urban interface part I: Exposure conditions. Fire Technol. 2017, 53, 429–473. [Google Scholar] [CrossRef]
- Hakes, R.S.; Caton, S.E.; Gorham, D.J.; Gollner, M.J. A review of pathways for building fire spread in the wildland urban interface part II: Response of components and systems and mitigation strategies in the United States. Fire Technol. 2017, 53, 475–515. [Google Scholar] [CrossRef]
- Sharples, J.J.; McRae, R.H.; Weber, R.O. Wind characteristics over complex terrain with implications for bushfire risk management. Environ. Model. Softw. 2010, 25, 1099–1120. [Google Scholar] [CrossRef]
- Dahale, A.; Ferguson, S.; Shotorban, B.; Mahalingam, S. Effects of distribution of bulk density and moisture content on shrub fires. Int. J. Wildland Fire 2013, 22, 625–641. [Google Scholar] [CrossRef]
- Pimont, F.; Dupuy, J.L.; Linn, R.R.; Dupont, S. Impacts of tree canopy structure on wind flows and fire propagation simulated with FIRETEC. Ann. For. Sci. 2011, 68, 523–530. [Google Scholar] [CrossRef] [Green Version]
- Linn, R.R.; Canfield, J.M.; Cunningham, P.; Edminster, C.; Dupuy, J.L.; Pimont, F. Using periodic line fires to gain a new perspective on multi-dimensional aspects of forward fire spread. Agric. For. Meteorol. 2012, 157, 60–76. [Google Scholar] [CrossRef]
- Frangieh, N.; Accary, G.; Morvan, D.; Meradji, S.; Bessonov, O. Wildfires front dynamics: 3D structures and intensity at small and large scales. Combust. Flame 2020, 211, 54–67. [Google Scholar] [CrossRef]
- Mueller, E.V.; Gallagher, M.R.; Skowronski, N.; Hadden, R.M. Approaches to Modeling Bed Drag in Pine Forest Litter for Wildland Fire Applications. Transp. Porous Media 2021, 138, 637–660. [Google Scholar] [CrossRef]
- McGrattan, K.; Hostikka, S.; McDermott, R.; Floyd, J.; Weinschenk, C.; Overholt, K. Fire dynamics simulator user’s guide. NIST Spec. Publ. 2013, 1019, 1–339. [Google Scholar]
- Mueller, E.V.; Campbell-Lochrie, Z.; Mell, W.; Hadden, R.M. Numerical Simulation of Low-Intensity Fire Spread in Pine Litter. 2018. Available online: http://hdl.handle.net/10316.2/44517 (accessed on 12 January 2021).
- Mell, W.; Maranghides, A.; McDermott, R.; Manzello, S.L. Numerical simulation and experiments of burning douglas fir trees. Combust. Flame 2009, 156, 2023–2041. [Google Scholar] [CrossRef]
- Mueller, E.; Mell, W.; Simeoni, A. Large eddy simulation of forest canopy flow for wildland fire modeling. Can. J. For. Res. 2014, 44, 1534–1544. [Google Scholar] [CrossRef]
- Poletto, R.; Craft, T.; Revell, A. A new divergence free synthetic eddy method for the reproduction of inlet flow conditions for LES. Flow Turbul. Combust. 2013, 91, 519–539. [Google Scholar] [CrossRef]
- Hostikka, S.I.; Mangs, J.O.; Mikkola, E.S. Comparison of two and three dimensional simulations of fires at wildland urban interface. Fire Saf. Sci. 2009, 9, 1353–1364. [Google Scholar] [CrossRef] [Green Version]
- Linn, R.R.; Winterkamp, J.L.; Weise, D.R.; Edminster, C. A numerical study of slope and fuel structure effects on coupled wildfire behaviour. Int. J. Wildland Fire 2010, 19, 179–201. [Google Scholar] [CrossRef]
- Mell, W.E.; Manzello, S.L.; Maranghides, A.; Butry, D.; Rehm, R.G. The wildland–urban interface fire problem–current approaches and research needs. Int. J. Wildland Fire 2010, 19, 238–251. [Google Scholar] [CrossRef]
- Morvan, D. Physical phenomena and length scales governing the behaviour of wildfires: A case for physical modelling. Fire Technol. 2011, 47, 437–460. [Google Scholar] [CrossRef]
- Miller, C.; Urban, D.L. Connectivity of forest fuels and surface fire regimes. Landsc. Ecol. 2000, 15, 145–154. [Google Scholar] [CrossRef]
- Moinuddin, K.; Khan, N.; Sutherland, D. Numerical study on effect of relative humidity (and fuel moisture) on modes of grassfire propagation. Fire Saf. J. 2021, 125, 103422. [Google Scholar] [CrossRef]
- Miller, C.; Urban, D.L. A model of surface fire, climate and forest pattern in the Sierra Nevada, California. Ecol. Model. 1999, 114, 113–135. [Google Scholar] [CrossRef]
- Morandini, F.; Silvani, X.; Dupuy, J.L.; Susset, A. Fire spread across a sloping fuel bed: Flame dynamics and heat transfers. Combust. Flame 2018, 190, 158–170. [Google Scholar] [CrossRef]
- García-Llamas, P.; Suárez-Seoane, S.; Fernández-Manso, A.; Quintano, C.; Calvo, L. Evaluation of fire severity in fire prone-ecosystems of Spain under two different environmental conditions. J. Environ. Manag. 2020, 271, 110706. [Google Scholar] [CrossRef]
- Hilton, J.; Garg, N. Rapid wind–terrain correction for wildfire simulations. Int. J. Wildland Fire 2021, 30, 410–427. [Google Scholar] [CrossRef]
- Sullivan, A.L.; Sharples, J.J.; Matthews, S.; Plucinski, M.P. A downslope fire spread correction factor based on landscape-scale fire behaviour. Environ. Model. Softw. 2014, 62, 153–163. [Google Scholar] [CrossRef]
- Clements, C.B.; Seto, D. Observations of fire–atmosphere interactions and near-surface heat transport on a slope. Bound.-Layer Meteorol. 2015, 154, 409–426. [Google Scholar] [CrossRef]
- Sharples, J.J. An overview of mountain meteorological effects relevant to fire behaviour and bushfire risk. Int. J. Wildland Fire 2009, 18, 737–754. [Google Scholar] [CrossRef]
- Simpson, C.C.; Sharples, J.J.; Evans, J.P. Sensitivity of atypical lateral fire spread to wind and slope. Geophys. Res. Lett. 2016, 43, 1744–1751. [Google Scholar] [CrossRef]
- Wang, Y.; Chatterjee, P.; de Ris, J.L. Large eddy simulation of fire plumes. Proc. Combust. Inst. 2011, 33, 2473–2480. [Google Scholar] [CrossRef]
- Ghaderi, M.; Ghodrat, M.; Sharples, J.J. LES Simulation of Wind-Driven Wildfire Interaction with Idealized Structures in the Wildland-Urban Interface. Atmosphere 2021, 12, 21. [Google Scholar] [CrossRef]
- Richards, P.J.; Hoxey, R.P. Pressures on a cubic building—Part 1: Full-scale results. J. Wind. Eng. Ind. Aerodyn. 2012, 102, 72–86. [Google Scholar] [CrossRef]
- Richards, P.; Norris, S. LES modelling of unsteady flow around the Silsoe cube. J. Wind. Eng. Ind. Aerodyn. 2015, 144, 70–78. [Google Scholar] [CrossRef]
- Smith, S.T. The Performance of Distribution Utility Poles in Wildland Fire Hazard Areas. Tech. Bull 2014. [Google Scholar]
- Wu, X. Inflow turbulence generation methods. Annu. Rev. Fluid Mech. 2017, 49, 23–49. [Google Scholar] [CrossRef]
- Tominaga, Y.; Mochida, A.; Yoshie, R.; Kataoka, H.; Nozu, T.; Yoshikawa, M.; Shirasawa, T. AIJ guidelines for practical applications of CFD to pedestrian wind environment around buildings. J. Wind. Eng. Ind. Aerodyn. 2008, 96, 1749–1761. [Google Scholar] [CrossRef]
- Greenshields, C.J. OpenFOAM User Guide; OpenFOAM Foundation Ltd.: London, UK, 2015; p. 473. [Google Scholar]
- Liu, H.; Wang, C.; Zhang, A. Numerical simulation of the wood pyrolysis with homogenous/heterogeneous moisture using FireFOAM. Energy 2020, 201, 117624. [Google Scholar] [CrossRef]
- Myers, T.; Trouvé, A.; Marshall, A. Predicting sprinkler spray dispersion in FireFOAM. Fire Saf. J. 2018, 100, 93–102. [Google Scholar] [CrossRef]
- Ren, N.; Wang, Y.; Vilfayeau, S.; Trouvé, A. Large eddy simulation of turbulent vertical wall fires supplied with gaseous fuel through porous burners. Combust. Flame 2016, 169, 194–208. [Google Scholar] [CrossRef]
- El Houssami, M.; Lamorlette, A.; Morvan, D.; Hadden, R.M.; Simeoni, A. Framework for submodel improvement in wildfire modeling. Combust. Flame 2018, 190, 12–24. [Google Scholar] [CrossRef] [Green Version]
- Favre, A. Turbulence: Space-time statistical properties and behavior in supersonic flows. Phys. Fluids 1983, 26, 2851–2863. [Google Scholar] [CrossRef]
- Magnussen, B.F.; Hjertager, B.H. On mathematical modeling of turbulent combustion with special emphasis on soot formation and combustion. In Symposium (International) on Combustion; Elsevier: Amsterdam, The Netherlands, 1977; Volume 16, pp. 719–729. [Google Scholar]
- Magnussen, B.F.; Hjertager, B.H.; Olsen, J.G.; Bhaduri, D. Effects of turbulent structure and local concentrations on soot formation and combustion in C2H2 diffusion flames. In Symposium (International) on Combustion; Elsevier: Amsterdam, The Netherlands, 1979; Volume 17, pp. 1383–1393. [Google Scholar]
- Wang, C.J.; Wen, J.X.; Chen, Z.B.; Dembele, S. Predicting radiative characteristics of hydrogen and hydrogen/methane jet fires using FireFOAM. Int. J. Hydrog. Energy 2014, 39, 20560–20569. [Google Scholar] [CrossRef]
- Almeida, Y.P.; Lage, P.L.; Silva, L.F. Large eddy simulation of a turbulent diffusion flame including thermal radiation heat transfer. Appl. Therm. Eng. 2015, 81, 412–425. [Google Scholar] [CrossRef]
- Castro, I.P.; Robins, A.G. The flow around a surface-mounted cube in uniform and turbulent streams. J. Fluid Mech. 1977, 79, 307–335. [Google Scholar] [CrossRef]
- He, Y.; Kwok, K.; Douglas, G.; Razali, I. Numerical investigation of bushfire-wind interaction and its impact on building structure. Fire Saf. Sci. 2011, 10, 1449–1462. [Google Scholar] [CrossRef]
- Gallacher, J.R.; Ripa, B.; Butler, B.W.; Fletcher, T.H. Lab-scale observations of flame attachment on slopes with implications for firefighter safety zones. Fire Saf. J. 2018, 96, 93–104. [Google Scholar] [CrossRef]
- Verma, M.K. Physics of Buoyant Flows: From Instabilities to Turbulence; World Scientific: Singapore, 2018. [Google Scholar]
- Mitsopoulos, I.; Mallinis, G.; Arianoutsou, M. Wildfire risk assessment in a typical Mediterranean wildland–urban interface of Greece. Environ. Manag. 2015, 55, 900–915. [Google Scholar] [CrossRef]
- Debnam, G.; Chow, V.; England, P. AS 3959 Construction of Buildings In Bushfire-Prone Areas–Draft For Public Comment (Dr 05060) Review of Calculation Methods And Assumptions; Environmental Science: Sydney, Australia, 2005. [Google Scholar]


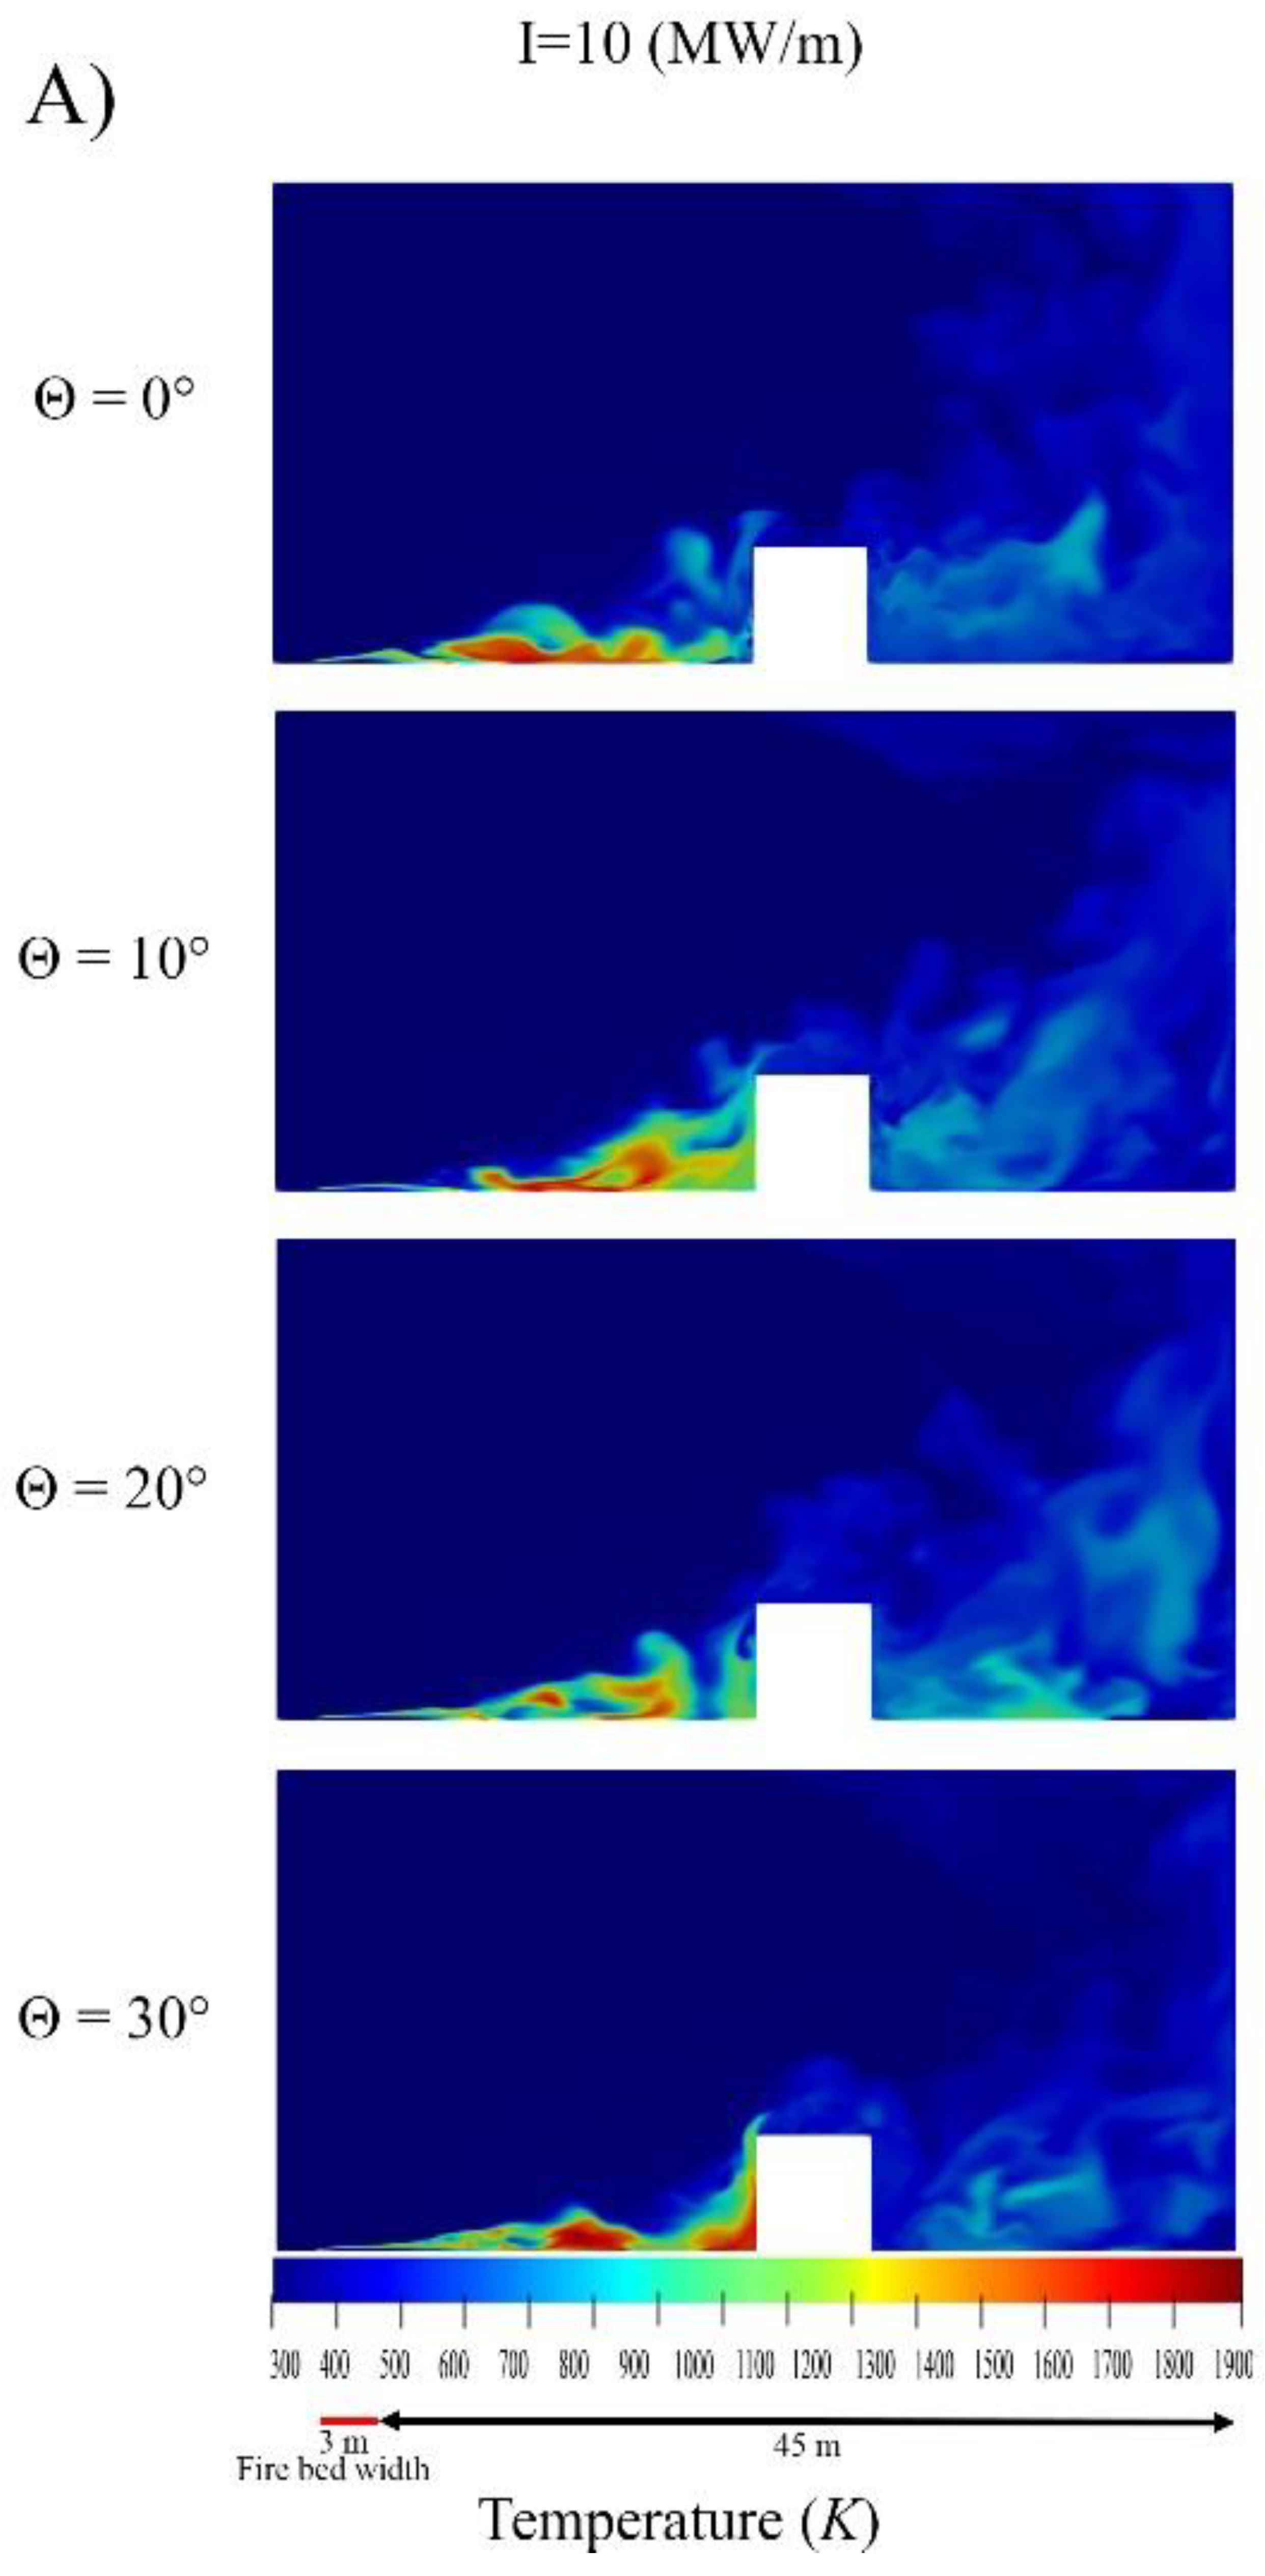
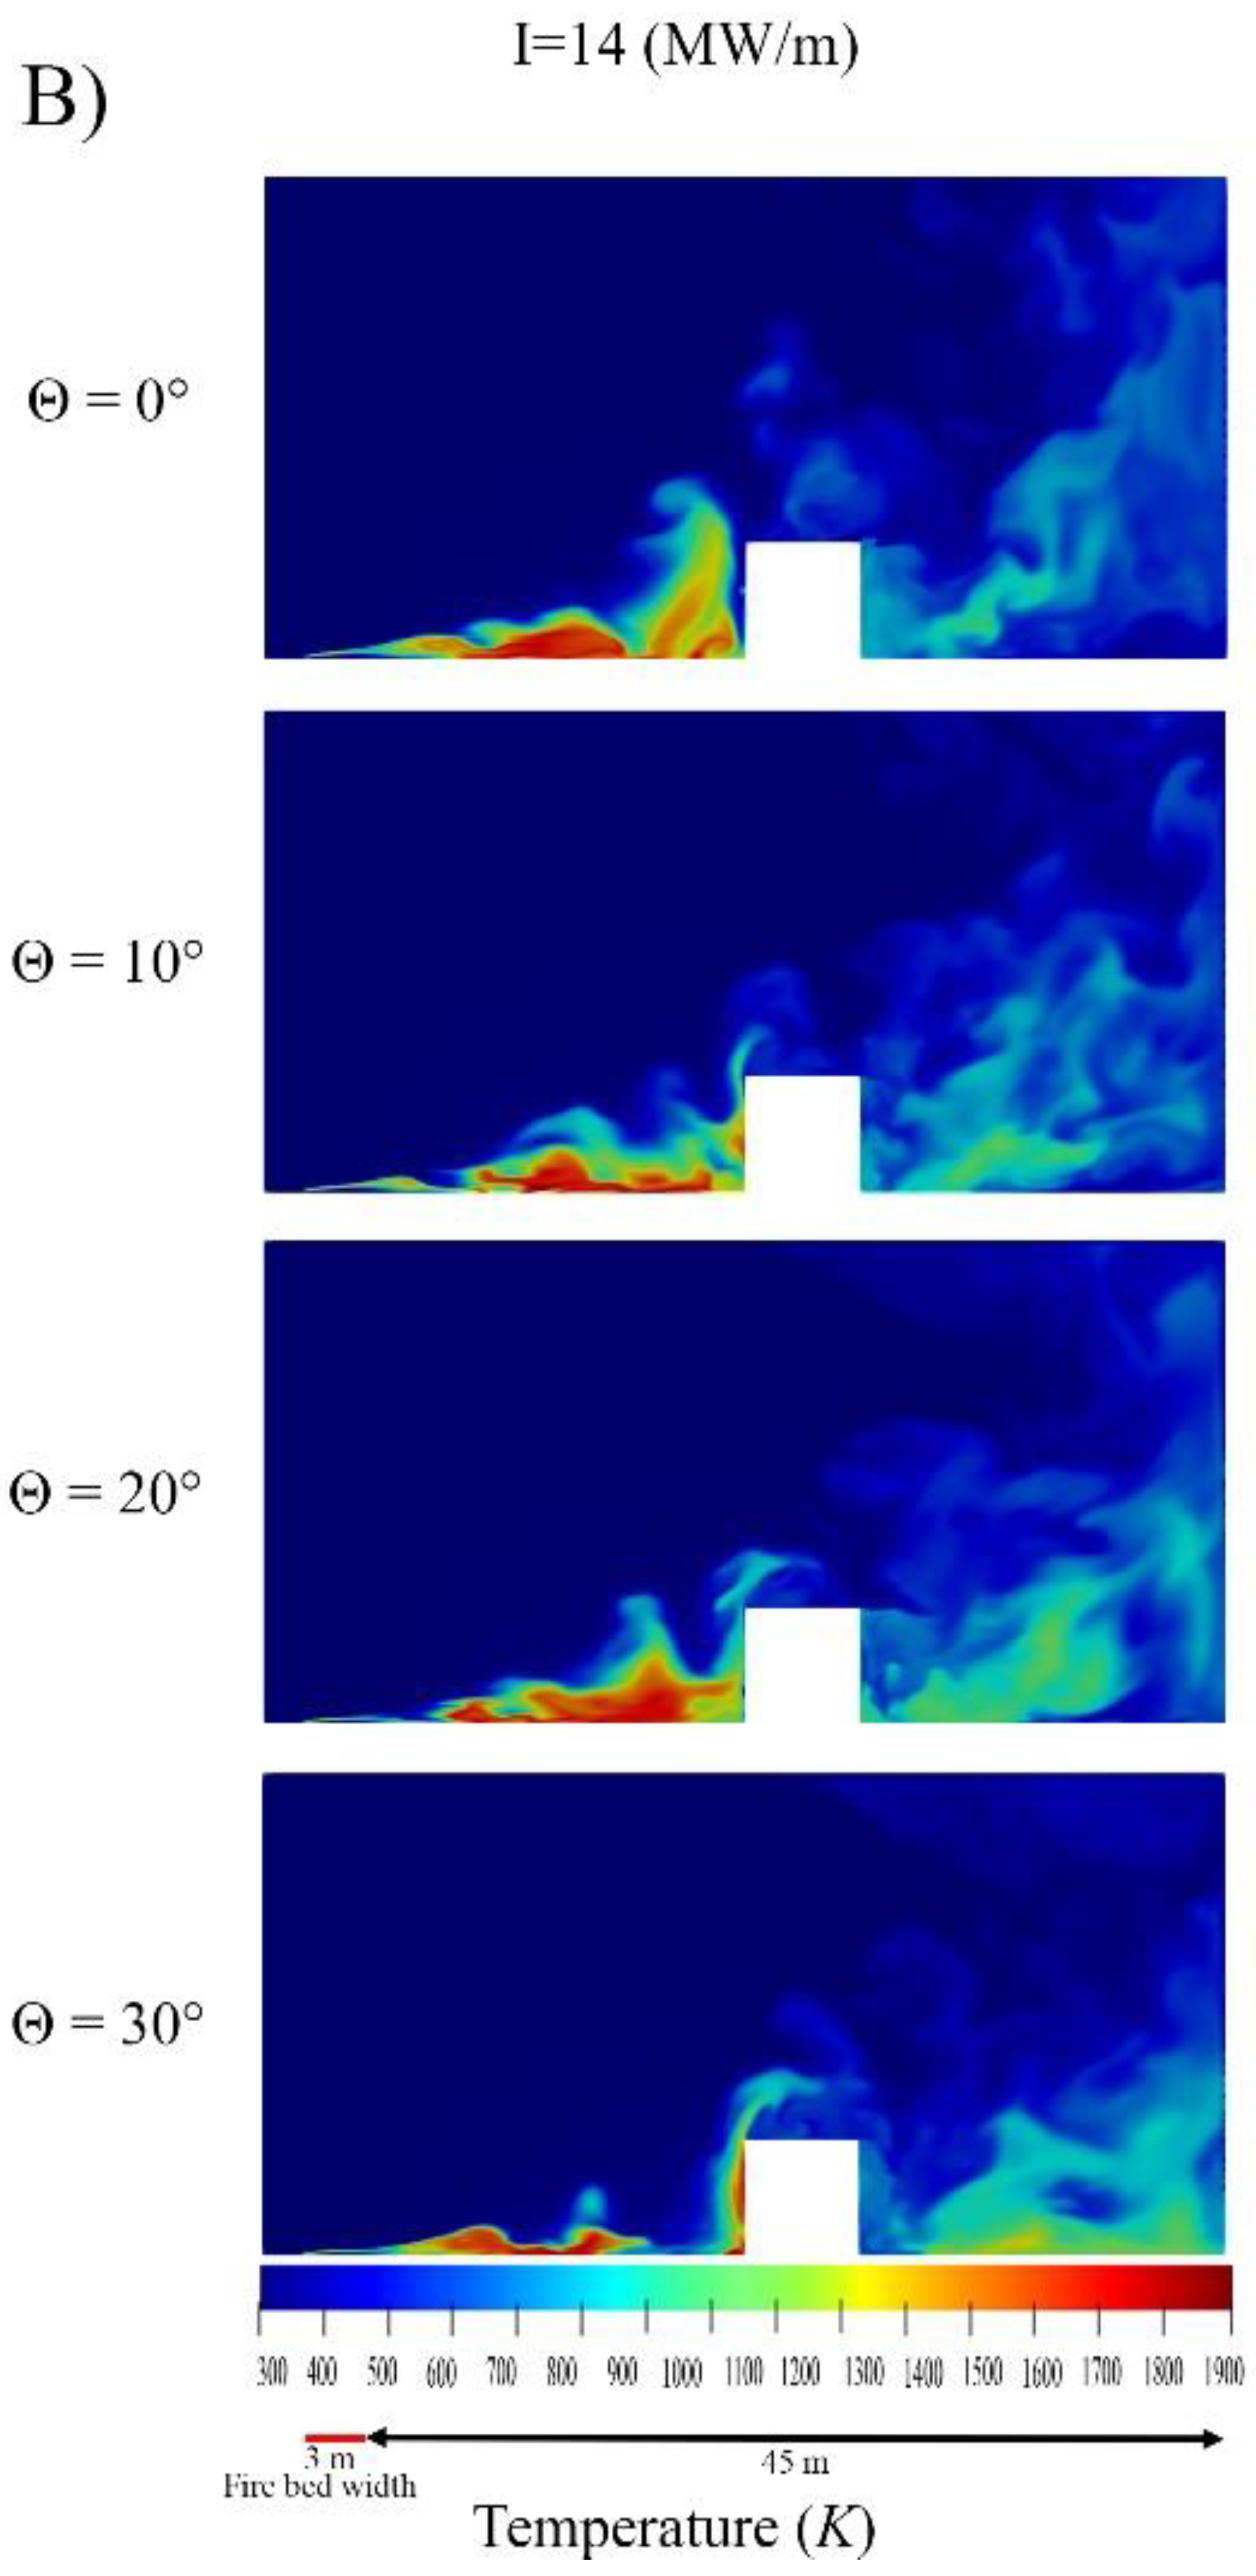
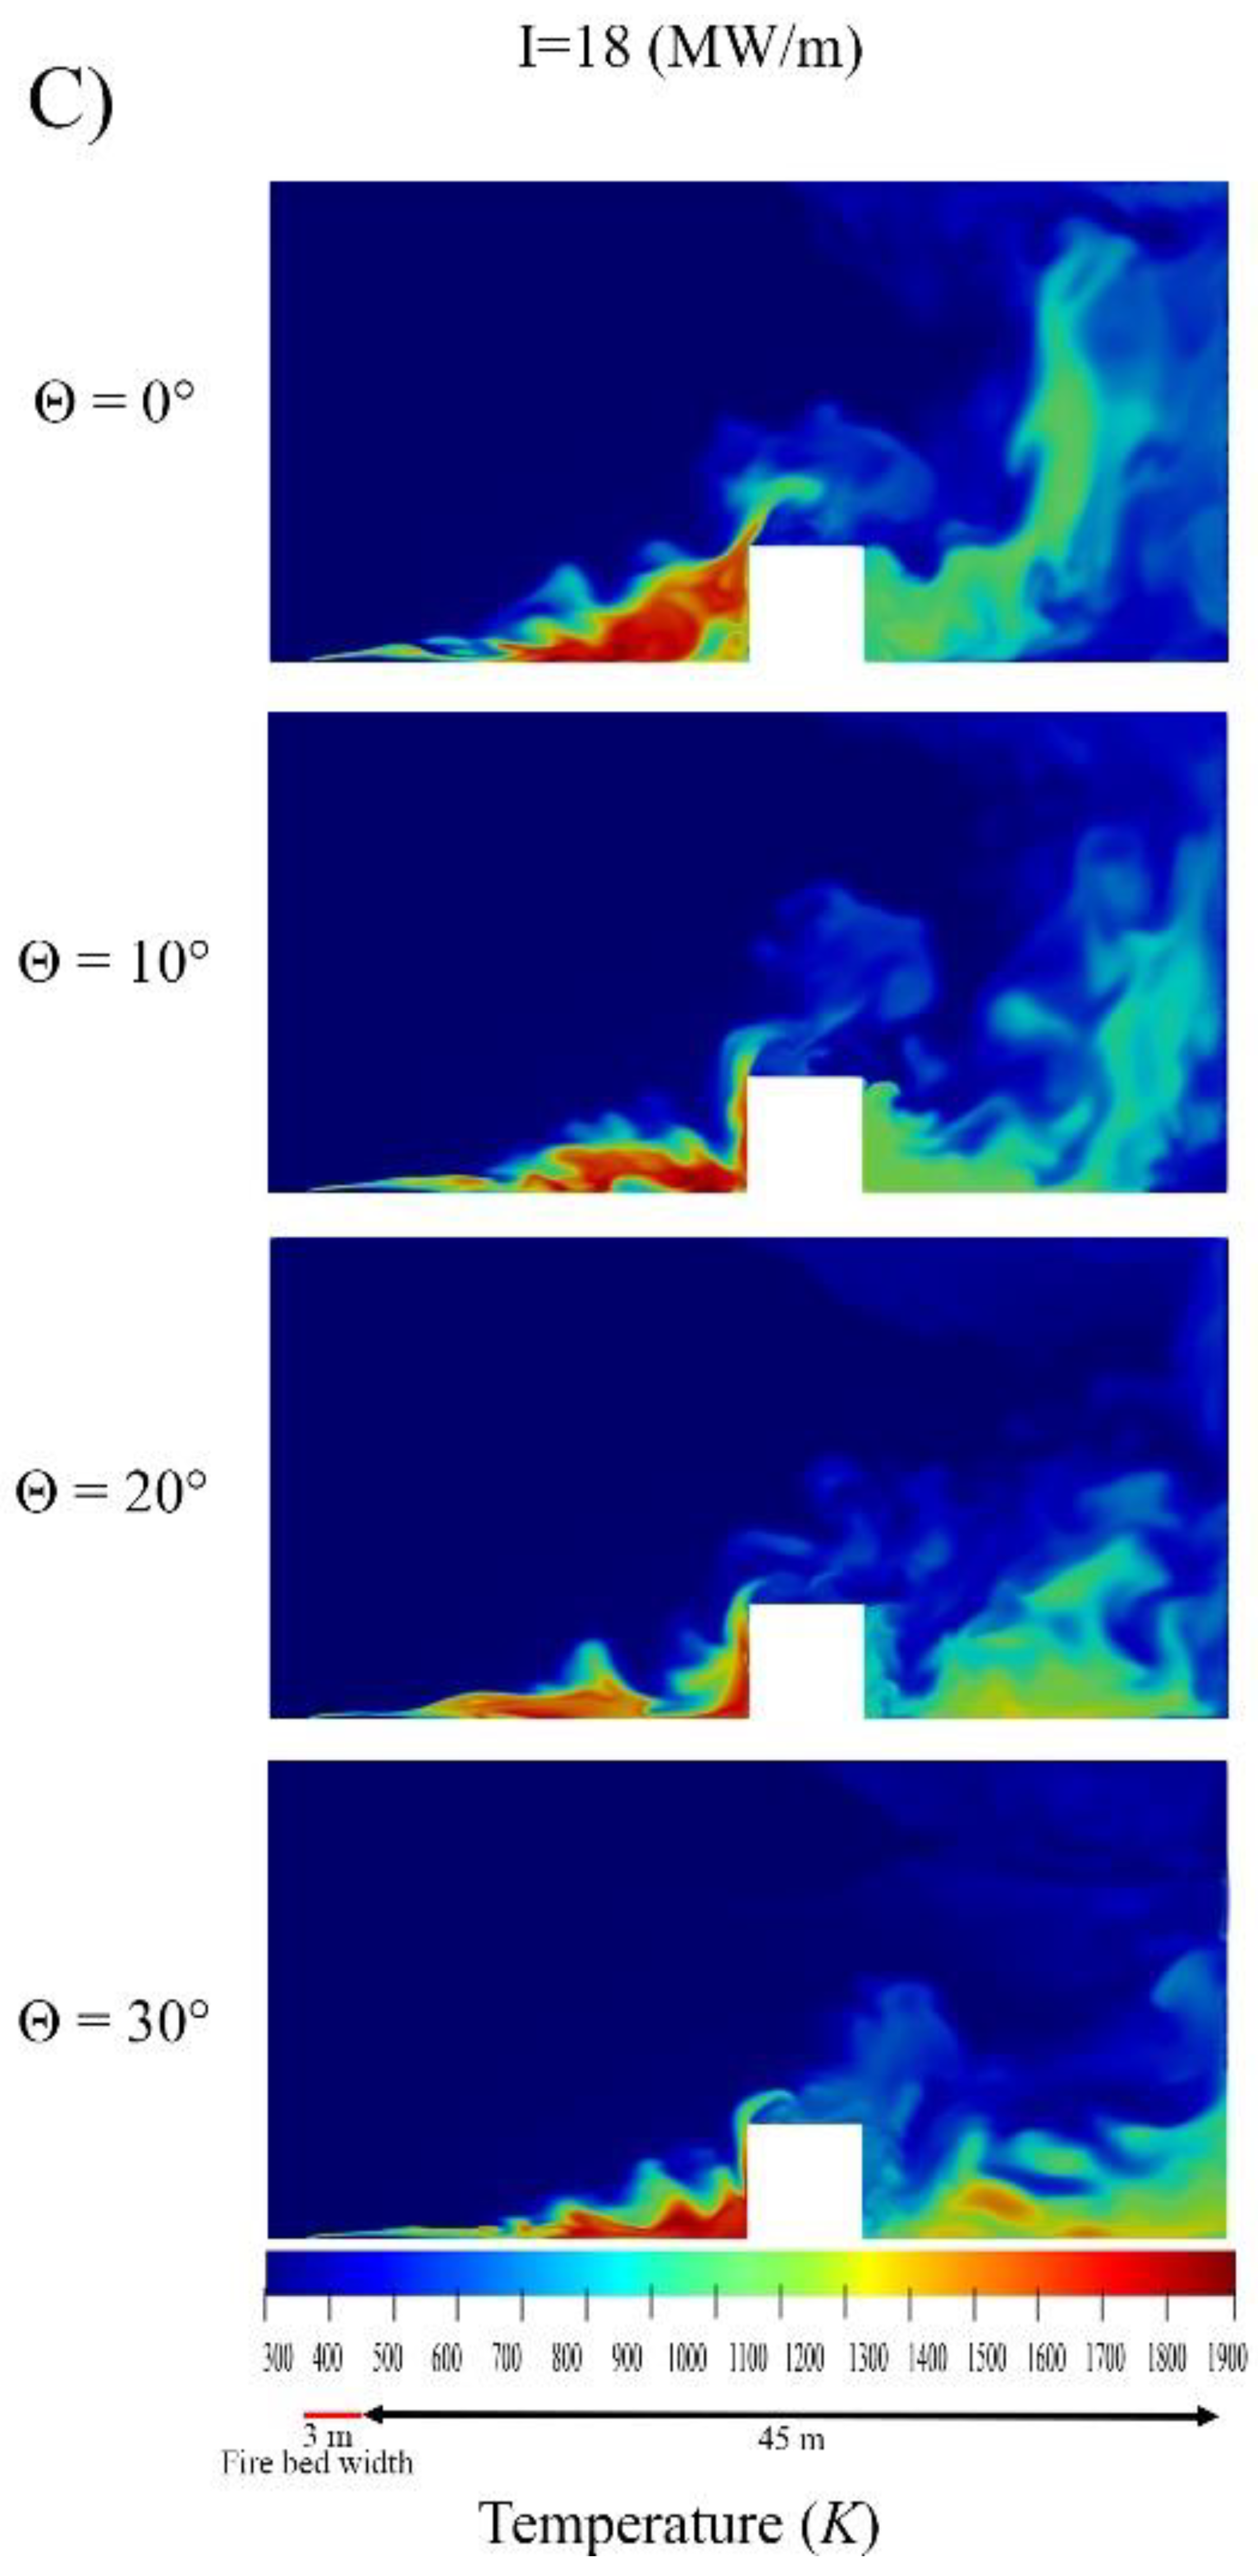
| Fire Intensity 10 (MW/m) | Fire Intensity 14 (MW/m) | Fire Intensity 18 (MW/m) | |
|---|---|---|---|
| Flame height (slope 0°), m | 2.5 | 3 | 3.5 |
| Flame height (slope 10°), m | 2 | 2.8 | 3 |
| Flame height (slope 20°), m | 1.5 | 2.5 | 2.8 |
| Flame height (slope 30°), m | 1 | 1.5 | 2.5 |
Publisher’s Note: MDPI stays neutral with regard to jurisdictional claims in published maps and institutional affiliations. |
© 2022 by the authors. Licensee MDPI, Basel, Switzerland. This article is an open access article distributed under the terms and conditions of the Creative Commons Attribution (CC BY) license (https://creativecommons.org/licenses/by/4.0/).
Share and Cite
Ghodrat, M.; Edalati-Nejad, A.; Simeoni, A. Collective Effects of Fire Intensity and Sloped Terrain on Wind-Driven Surface Fire and Its Impact on a Cubic Structure. Fire 2022, 5, 208. https://doi.org/10.3390/fire5060208
Ghodrat M, Edalati-Nejad A, Simeoni A. Collective Effects of Fire Intensity and Sloped Terrain on Wind-Driven Surface Fire and Its Impact on a Cubic Structure. Fire. 2022; 5(6):208. https://doi.org/10.3390/fire5060208
Chicago/Turabian StyleGhodrat, Maryam, Ali Edalati-Nejad, and Albert Simeoni. 2022. "Collective Effects of Fire Intensity and Sloped Terrain on Wind-Driven Surface Fire and Its Impact on a Cubic Structure" Fire 5, no. 6: 208. https://doi.org/10.3390/fire5060208