Article

Successional Pathways of Avifauna in a Shifting Mosaic Landscape: Interplay between Land Abandonment and Wildfires

CEFE, CNRS, EPHE-PSL University, Montpellier University, IRD, 1919 Route de Mende, 34293 Montpellier, France
Fire 2022, 5(6), 183; https://doi.org/10.3390/fire5060183
Submission received: 14 September 2022 / Revised: 24 October 2022 / Accepted: 31 October 2022 / Published: 3 November 2022
(This article belongs to the Special Issue Fire Regimes and Ecosystem Resilience)

Abstract

:
In Mediterranean hinterlands, land abandonment has led to the encroachment of woody vegetation prone to fire. The resulting alternation between vegetation closure and sudden opening modifies the composition of avifauna. We first conducted a stratified sampling of the avifauna in a grassland-to-forest gradient representing the closure of vegetation after abandonment (space-for-time substitution). We then conducted postfire diachronic sampling (up to 42 years) on stations belonging to this gradient. Mid-successional shrubland avifauna was the most radically modified after fire—ground-nesting species replacing shrub-nesting species—without significant change in species numbers. In the medium term, shrub-nesting birds widened their distribution in the landscape. While avifauna postfire successions in shrubland paralleled the spontaneous colonization of grasslands by woody vegetation, postfire forest successions were distinguished by the persistence of certain forest birds, resulting in assemblages of high diversity in which open-habitat birds coexisted with forest species. This temporary vegetation–avifauna mismatch results from both the reluctance of open-habitat birds to enter burned areas because of numerous snags, and the site fidelity of breeding birds. This inertia mitigates the short-term impact of fire. In the long term, spontaneous or postfire successions converge towards a homogeneous forest avifauna, to the detriment of open-habitat species of high conservation value.

1. Introduction

Every landscape is a dynamic system subject to constant change in response to disturbances [1]. These changes, in flora, fauna or structure, are referred to as ecological successions. In many northern Mediterranean hinterlands, rural depopulation has resulted in decreasing anthropic pressure on the landscape, leading to the encroachment of woody vegetation, which in turn increases the risk of wildfire [2,3,4]. Two theoretically distinct modalities can be distinguished between the secondary successions that result from these changes: (i) successions of colonization by woody vegetation after the abandonment of croplands (often referred to as ‘old-field succession’), which involves the initial removal of pre-existing vegetation, (ii) recovery successions (or regeneration succession [5]) after disturbance—the most dominant of which in the Mediterranean is fire.
A priori, postfire succession is assumed to be faster than colonization succession as the forms of plant resistance (seed banks and underground perennial organs) are already in place, so the only limitation is germination success and speed of growth. In colonization succession, the rate of propagule dispersal is an additional limiting factor [6]. The term ‘old-field succession’ in its broadest sense includes not only succession following cultivation, but that resulting from the cessation of grazing, as the cessation of cultivation is often followed by a pasture phase before total abandonment and shrub or forest encroachment [7,8].
Given the relative slowness of colonization succession, its study generally requires synchronic sampling, which consists of selecting landscape units assumed to be representative of successional stages [9,10]. While this strategy of space-for-time substitution, or chronosequence-based studies, is contested [11], it is often used in practice to study successions at decadal timescales, and can be effective if certain conditions are met [12]. In contrast, the relative rapidity of postfire succession allows the possibility of diachronic sampling in the framework of a short- or mid-term study.
The effects of land abandonment on bird diversity [13,14,15,16,17,18] and the impact of wildfires on avifauna [19,20,21,22,23,24] have generally been analysed separately, yet these two dynamics act concurrently in Mediterranean landscapes. Thus, comparative analyses could help to answer a range of closely interrelated questions [4,6,25,26,27]. In particular, whether successions are convergent or not is an old debate in ecology [28]. Convergence in forest stages has, in fact, often been observed [29,30,31,32,33]. But are spontaneous colonization succession (old-field or related) and postfire recovery succession convergent? Are they homologous? Is postfire succession an accelerated parallel of colonization succession? “Does fire merely displace the ecosystem to an earlier successional stage, or does it initiate succession of a markedly different type than that occurring in the absence of perturbation?” [34]. More generally, does the development of the postfire community follow an orderly, more or less predictable turnover of species, or is it a largely random process depending mainly on species colonization rates and landscape context [35]?
To assess these questions, we conducted a synthetic analysis encompassing all vegetation types in a Mediterranean mosaic landscape, considering two successional dynamics—spontaneous shrub and forest encroachment and the regeneration of vegetation after fire—and their consequences on avifauna. The aim was to understand the relationships between the two processes by analysing them simultaneously in a common statistical framework [36]. Combining space-for-time substitution and long-term diachronic sampling (up to 42 years in certain cases), we compared postfire successional trajectories of the avifauna in a gradient of vegetation types of increasing volume, looking for interactions between the two successional processes: common patterns as well as alternative pathways.

2. Material and Methods
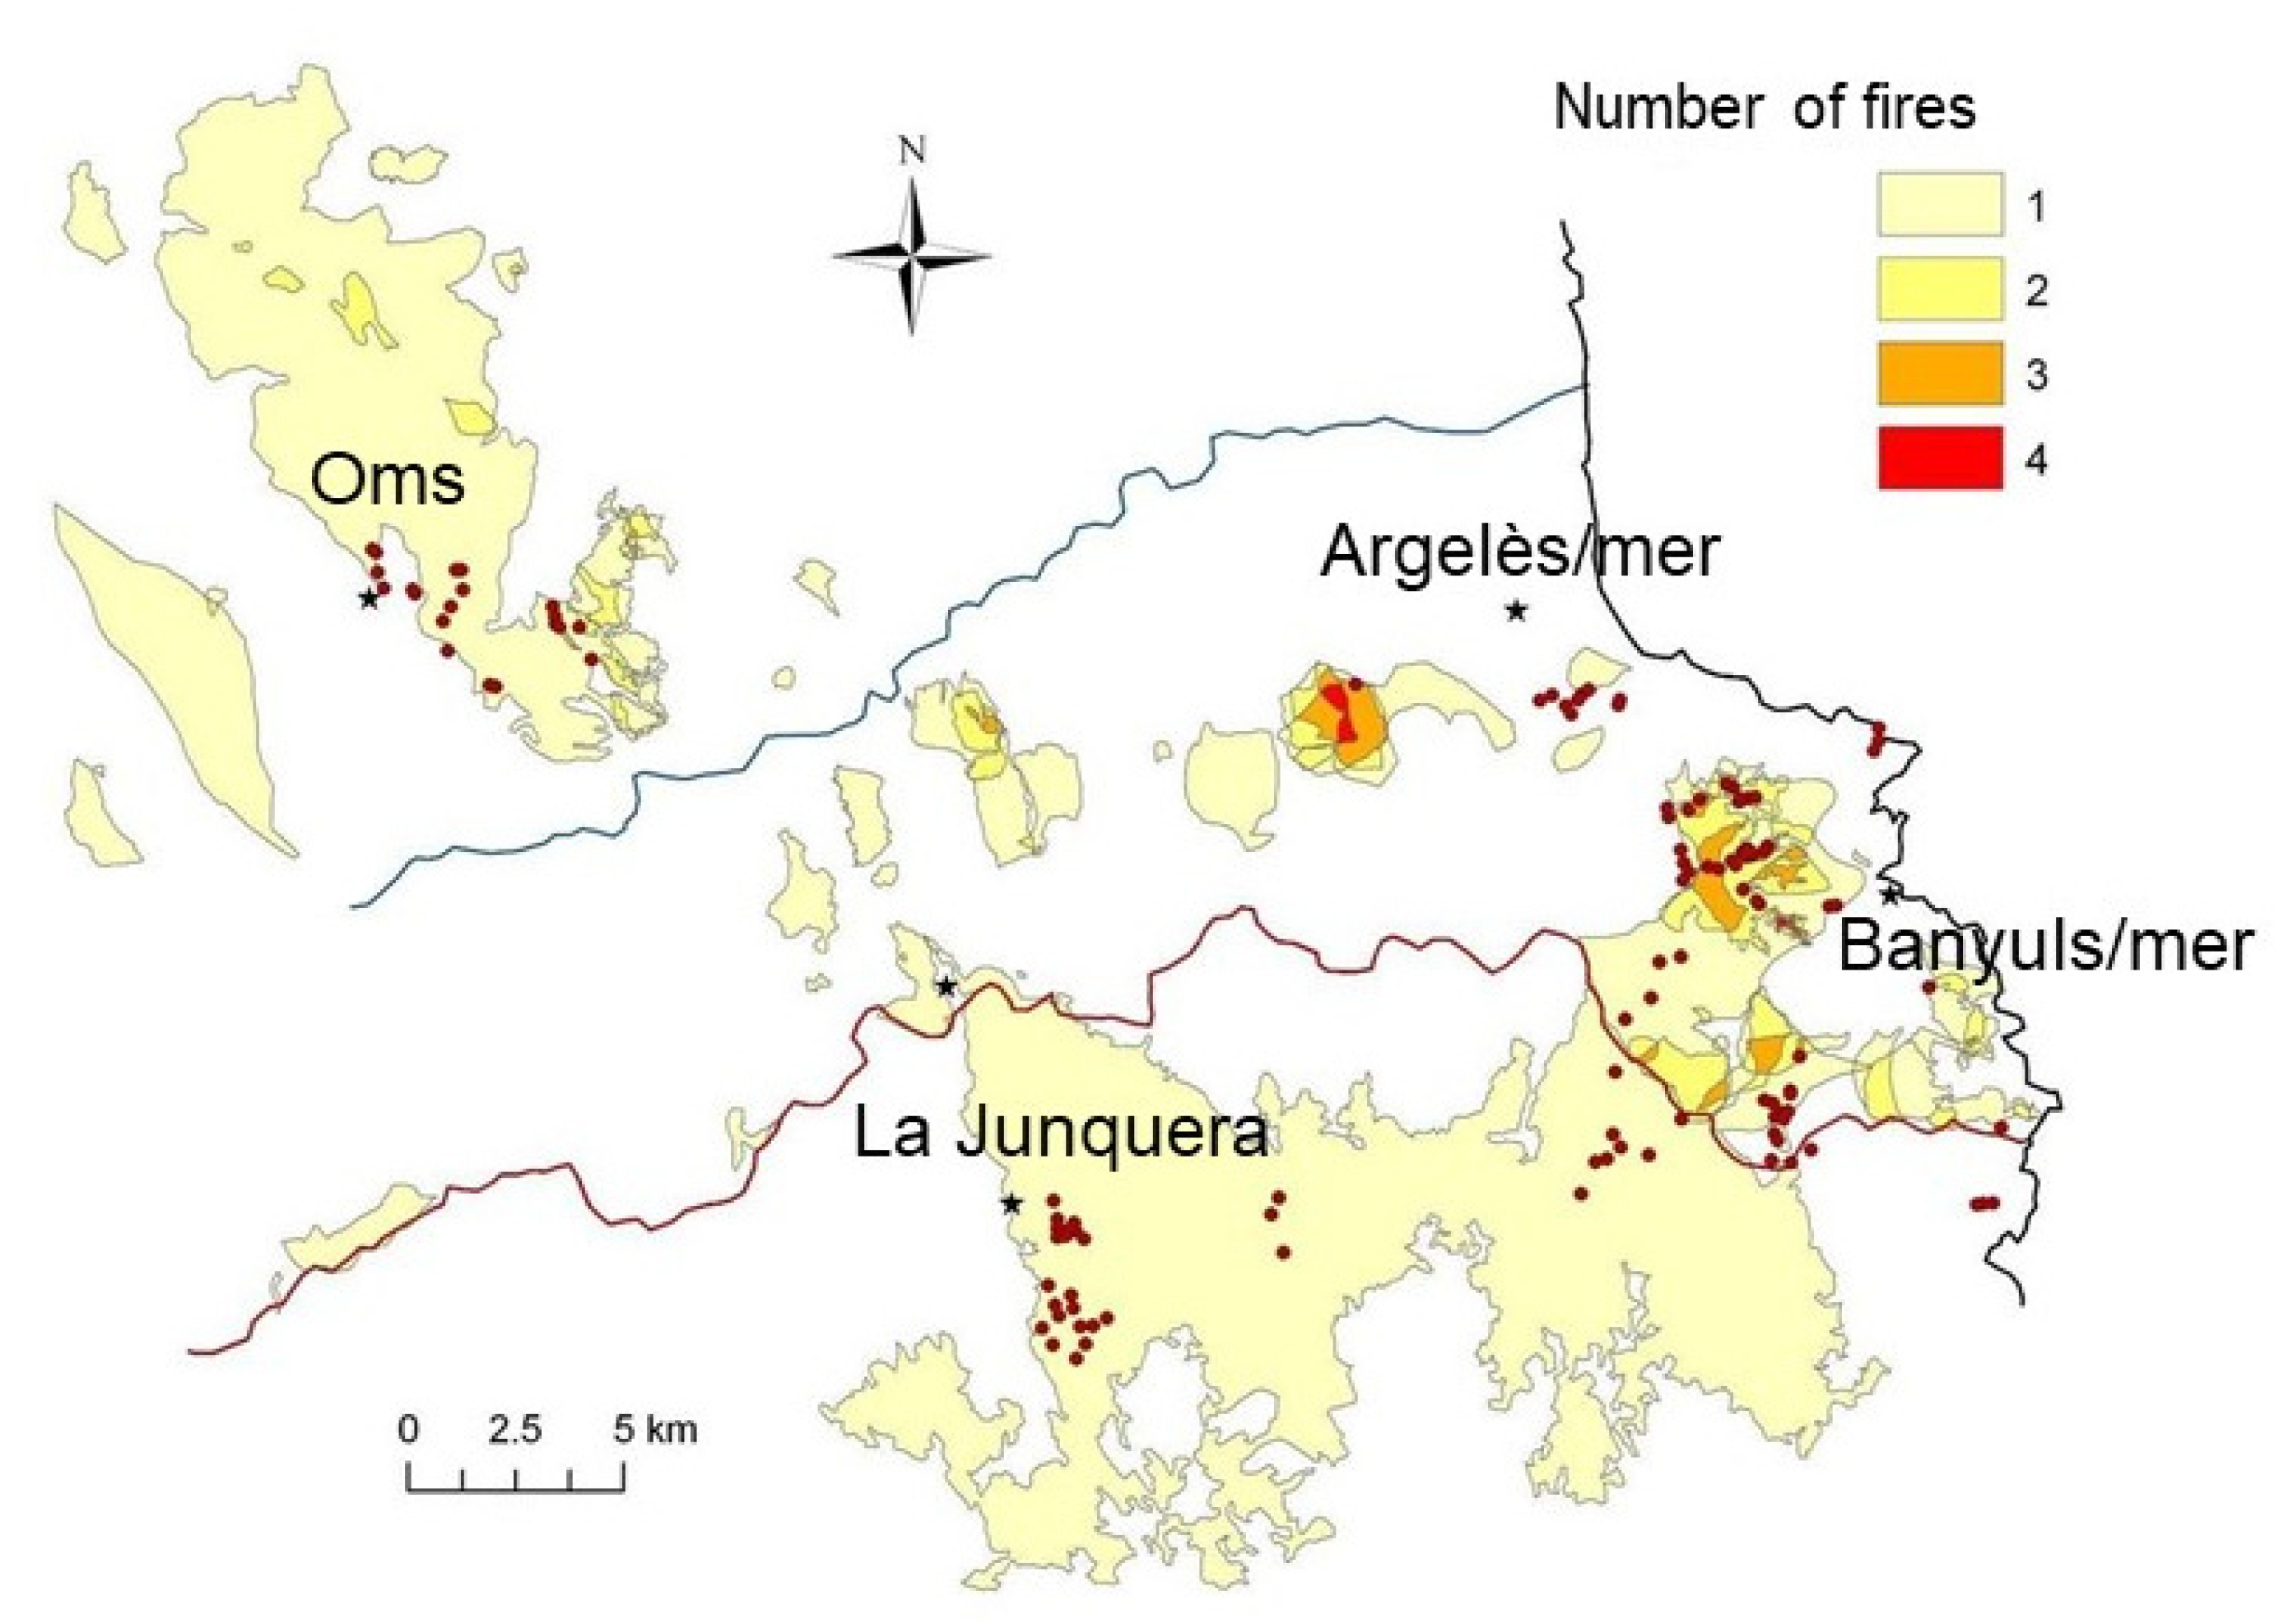
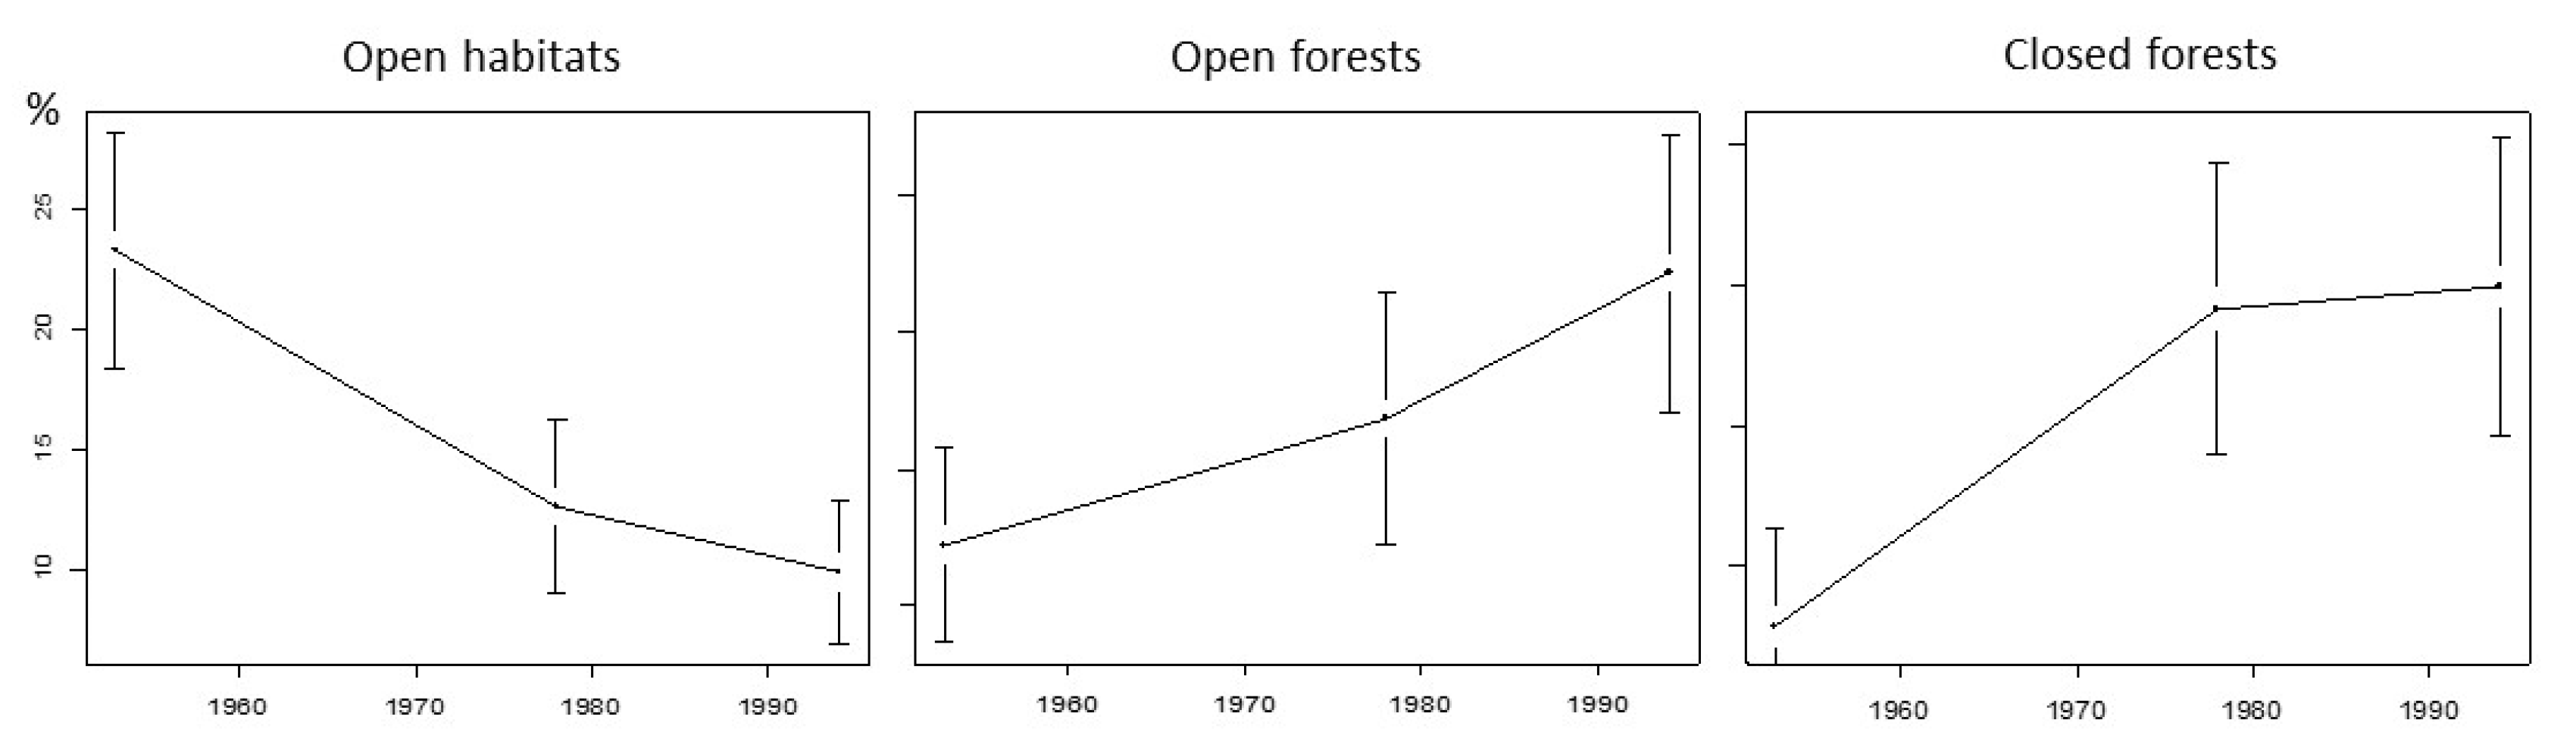
2.1. Study Area

The study area was situated in the eastern Catalan Pyrenees (42.4–42.55° N, 2.7–3.18° E), including the Mediterranean zone of the Albera Massif (both on the French and Spanish side), and a nearby hilly area (the Aspres) (Figure A1). This vegetation zone ranges from 0 to 500 m a.s.l. and is characterized by the dominant sclerophyllous trees Quercus suber and Q. ilex [3,24,36,37]. Among the dominant ligneous species, some are sprouters after fire (genera Quercus, Erica, Phillyrea), others seeders (Ulex, Cistus) or mixed (Calicotome). Contrary to other regions prone to fire (e.g., Australia, South American savannas), the cork oak Quercus suber is here the only species capable of epicormic regeneration. The evergreen, sclerophyllous Mediterranean shrubs, dominated by heather, are particularly dense and difficult to penetrate; they are usually referred to as maquis [38,39]. The climate is meso-Mediterranean. The mean annual temperature increased from about 14.7 °C in 1981 to 16 °C in 2009 in the lowland (smoothed values) [40]. Annual rainfall averages 550 mm in the lowland and increases with elevation, showing a strong summer deficit. The highly fissured schistose and siliceous substratum, together with significant winter precipitation, is relatively favourable to woody vegetation.
Over the last two centuries, the landscape of the study area has experienced dramatic changes, particularly on the French side, where most of the samples were taken [41,42,43]. Before the 19th century, large areas were devoted to extensive grazing, the cultivated land was reduced and the forests overexploited. From 1850, with the arrival of the railway and an increase in export infrastructure, vineyards dramatically expanded, uniformly covering almost all altitudes below 500 m on the French side. Livestock grazing regressed, but remained present. At that time, the human impact on the landscape reached unprecedented levels. The phylloxera crisis, which decimated vineyards, the two world wars and a decrease in the rural population then resulted in the abandonment of large areas. Maquis of increasing height colonized large formerly grazed or cultivated areas. These shrublands are particularly prone to wildfires. The antagonistic dynamics of shrub and forest encroachment alternating with wildfires has resulted in a mosaic of successional units of different stages across the landscape (e.g., Figure 1). In the landscape units affected by past fires, the vegetation structure tends to be relatively homogeneous as it is even-aged. Nine wildfires that occurred in the study area during the study period (1975–2019) were considered in this study: 1976 (Oms); 1978 (La Jonquera, Colera, Banyuls-sur-mer); 1981 (Banyuls, Port-Vendres); 1982 (Argelès-sur-mer, Port-Vendres); 1983 (Banyuls-sur-mer); 1984 (Port-Vendres); 1986 (La Jonquera, Banyuls-sur-mer); 2006 (Port-Vendres); 2012 (La Jonquera). While the dates of the fires are known, this is unfortunately not the case for the dates of cessation of cultivation or grazing, which were often progressive and not documented.

2.2. Sampling Design

We considered almost all the non-cultivated plant formations in the study area. We focused on fine-scale vegetation structure [15], not taking into account the degree of fragmentation of the formations considered, or attempting to systematically or randomly cover the area. The sampling stations were empirically chosen from the mosaic of successional habitats in order to have a relatively homogeneous vegetation structure—or one with fine-grained heterogeneity—avoiding ecotones as much as possible. This Mediterranean vegetation is often difficult to penetrate, and due to steep slopes and rugged terrain, the location of the sampling stations largely depended on their accessibility. As numerous sampling stations were within a 10-km radius, and their distribution aggregative, the samples cannot be considered independent. In the following, the term ‘station’ is synonymous with sampling site. The term ‘sample’ refers to a count made at a given station on a given date; this was the statistical unit in most of the analyses.
We looked for the conditions of a natural experiment [44] by comparing two successional modalities [45]. Our sampling design comprised two dimensions, the first synchronic, the other diachronic (Figure 2).
(1)
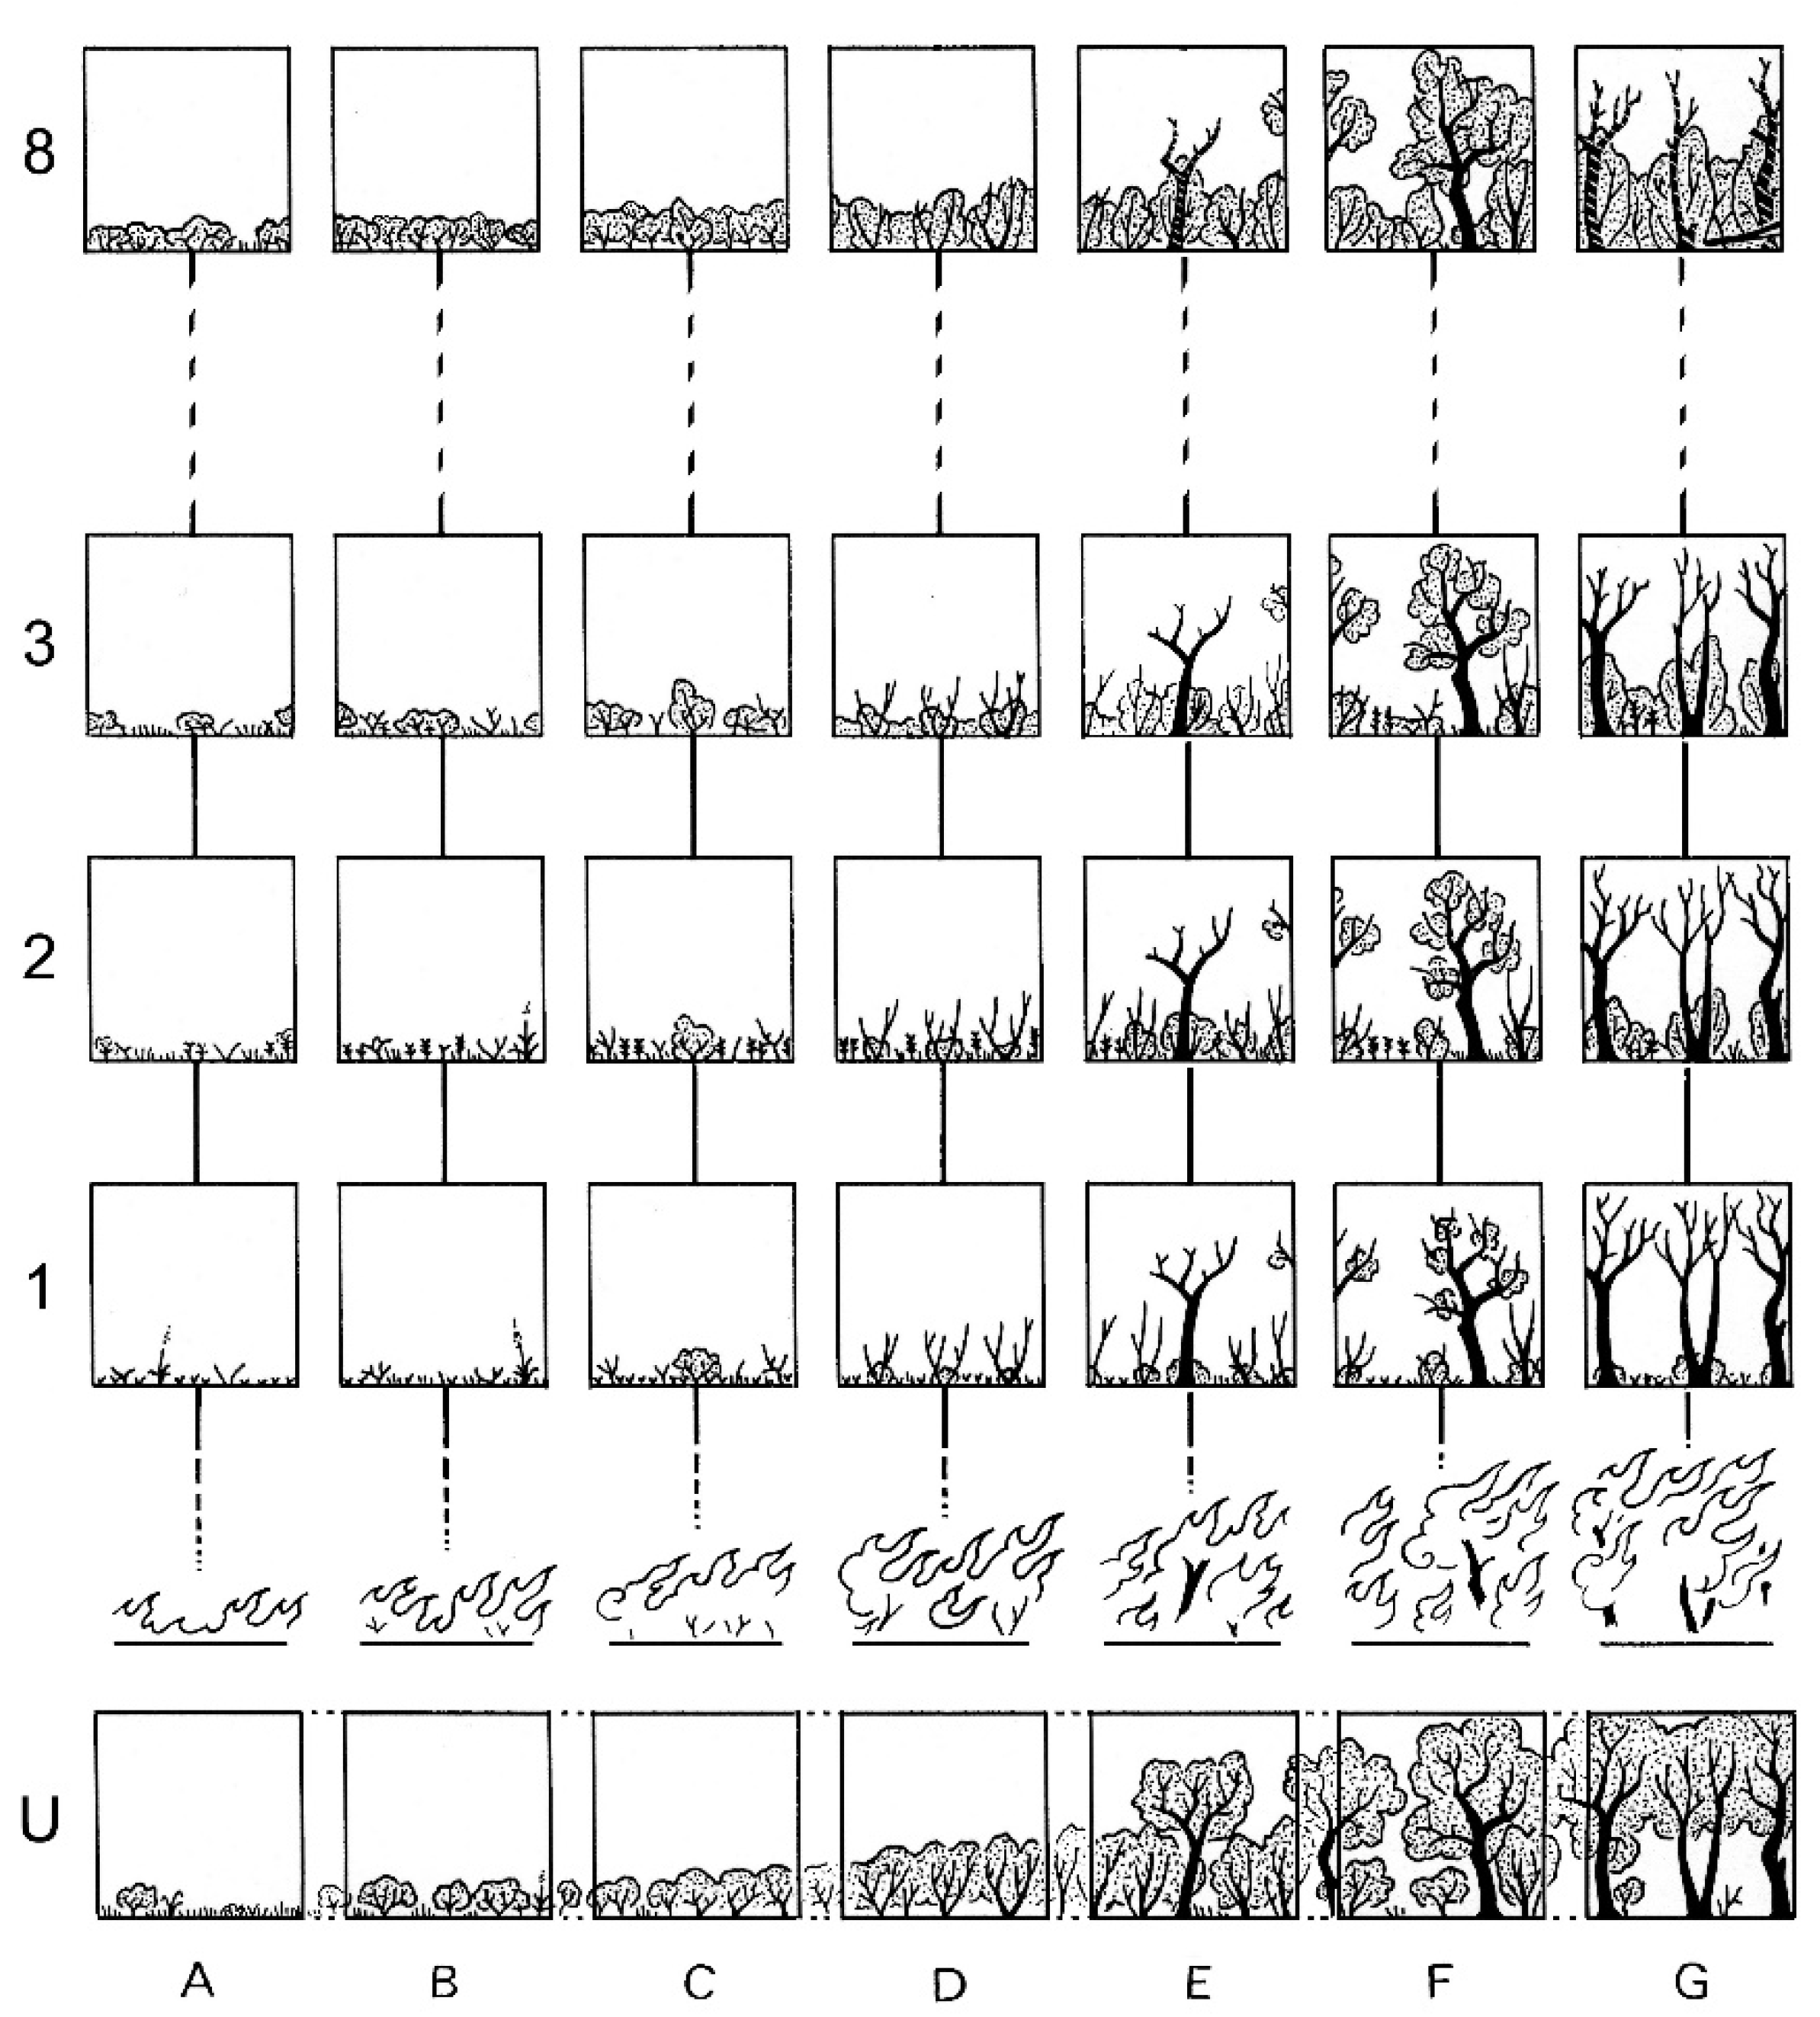
In a first step, we conducted stratified sampling of a sequence of vegetation types. In the unburned landscape mosaic of the study area, we empirically defined seven a priori classes on a grassland-to-forest gradient of increasing vegetation height and cover (i.e., increasing maturity):
  • Dry or rocky grasslands, whose dominant species is Brachypodium retusum, with a few scattered low shrubs (we could not find any grassland completely free of scrub) (n = 9 sampling stations);
  • Low and patchy scrub (generally Ulex parviflorus and Cistus spp.) with grass (n = 19);
  • Low maquis (Ulex parviflorus, Cistus spp. and Calicotome spinosa dominating), about 1–1.5 m high (n = 6);
  • Closed heather maquis (Erica arborea and E. scoparia) with Phillyrea sp., about 2 m high (n = 13);
  • Heather maquis with scattered oaks (Quercus ilex or Q. suber) (n = 7);
  • Clear cork oak (Quercus suber) forest with a more or less dense understorey (n = 47);
  • Closed holm oak (Quercus ilex) forest with a clear understorey (n = 15).
The sampling of these unburned stations was approximatively synchronic, staggered mostly from 1975 to 1978. The selected sampling stations had no trace of recent fire. It is likely that an unknown proportion of these stations had burned in the past, but a long-term convergence between the two succession types was assumed when all evidence of fire had disappeared. These seven vegetation types aimed to reconstitute, by space-for-time substitution, the changes in the landscape (succession stages) resulting from more than a century of rural abandonment and forest encroachment.
An analysis of old aerial photos of the study area confirms a twofold increase in forest area from 1953 to 1995 at the expense of open habitats [18] (Figure A2). In the absence of old images, there is other evidence of the legitimacy of this space-for-time substitution in the field: vineyard terraces and pastoral paths become visible after the woody vegetation has been eliminated by fire; abandoned sheepfolds can be seen under the maquis (stages A to E); former cultivation terraces can be seen both in maquis and in woodland (stages C to G); certain unburned holm oak stands (stage G) show an understorey of dead Erica arborea under the closed canopy, a legacy of the previous successional stage (stage E), etc. We did not consider cork oak forests (stage F) as evident precursors of holm oak forests (stage G), but placed them before the latter on the gradient due to their clear and open canopy that allows the maintenance of some undergrowth, making the transition with stage E. The holm oak and cork oak forests are currently under-exploited so that few changes are due to human action.
(2)
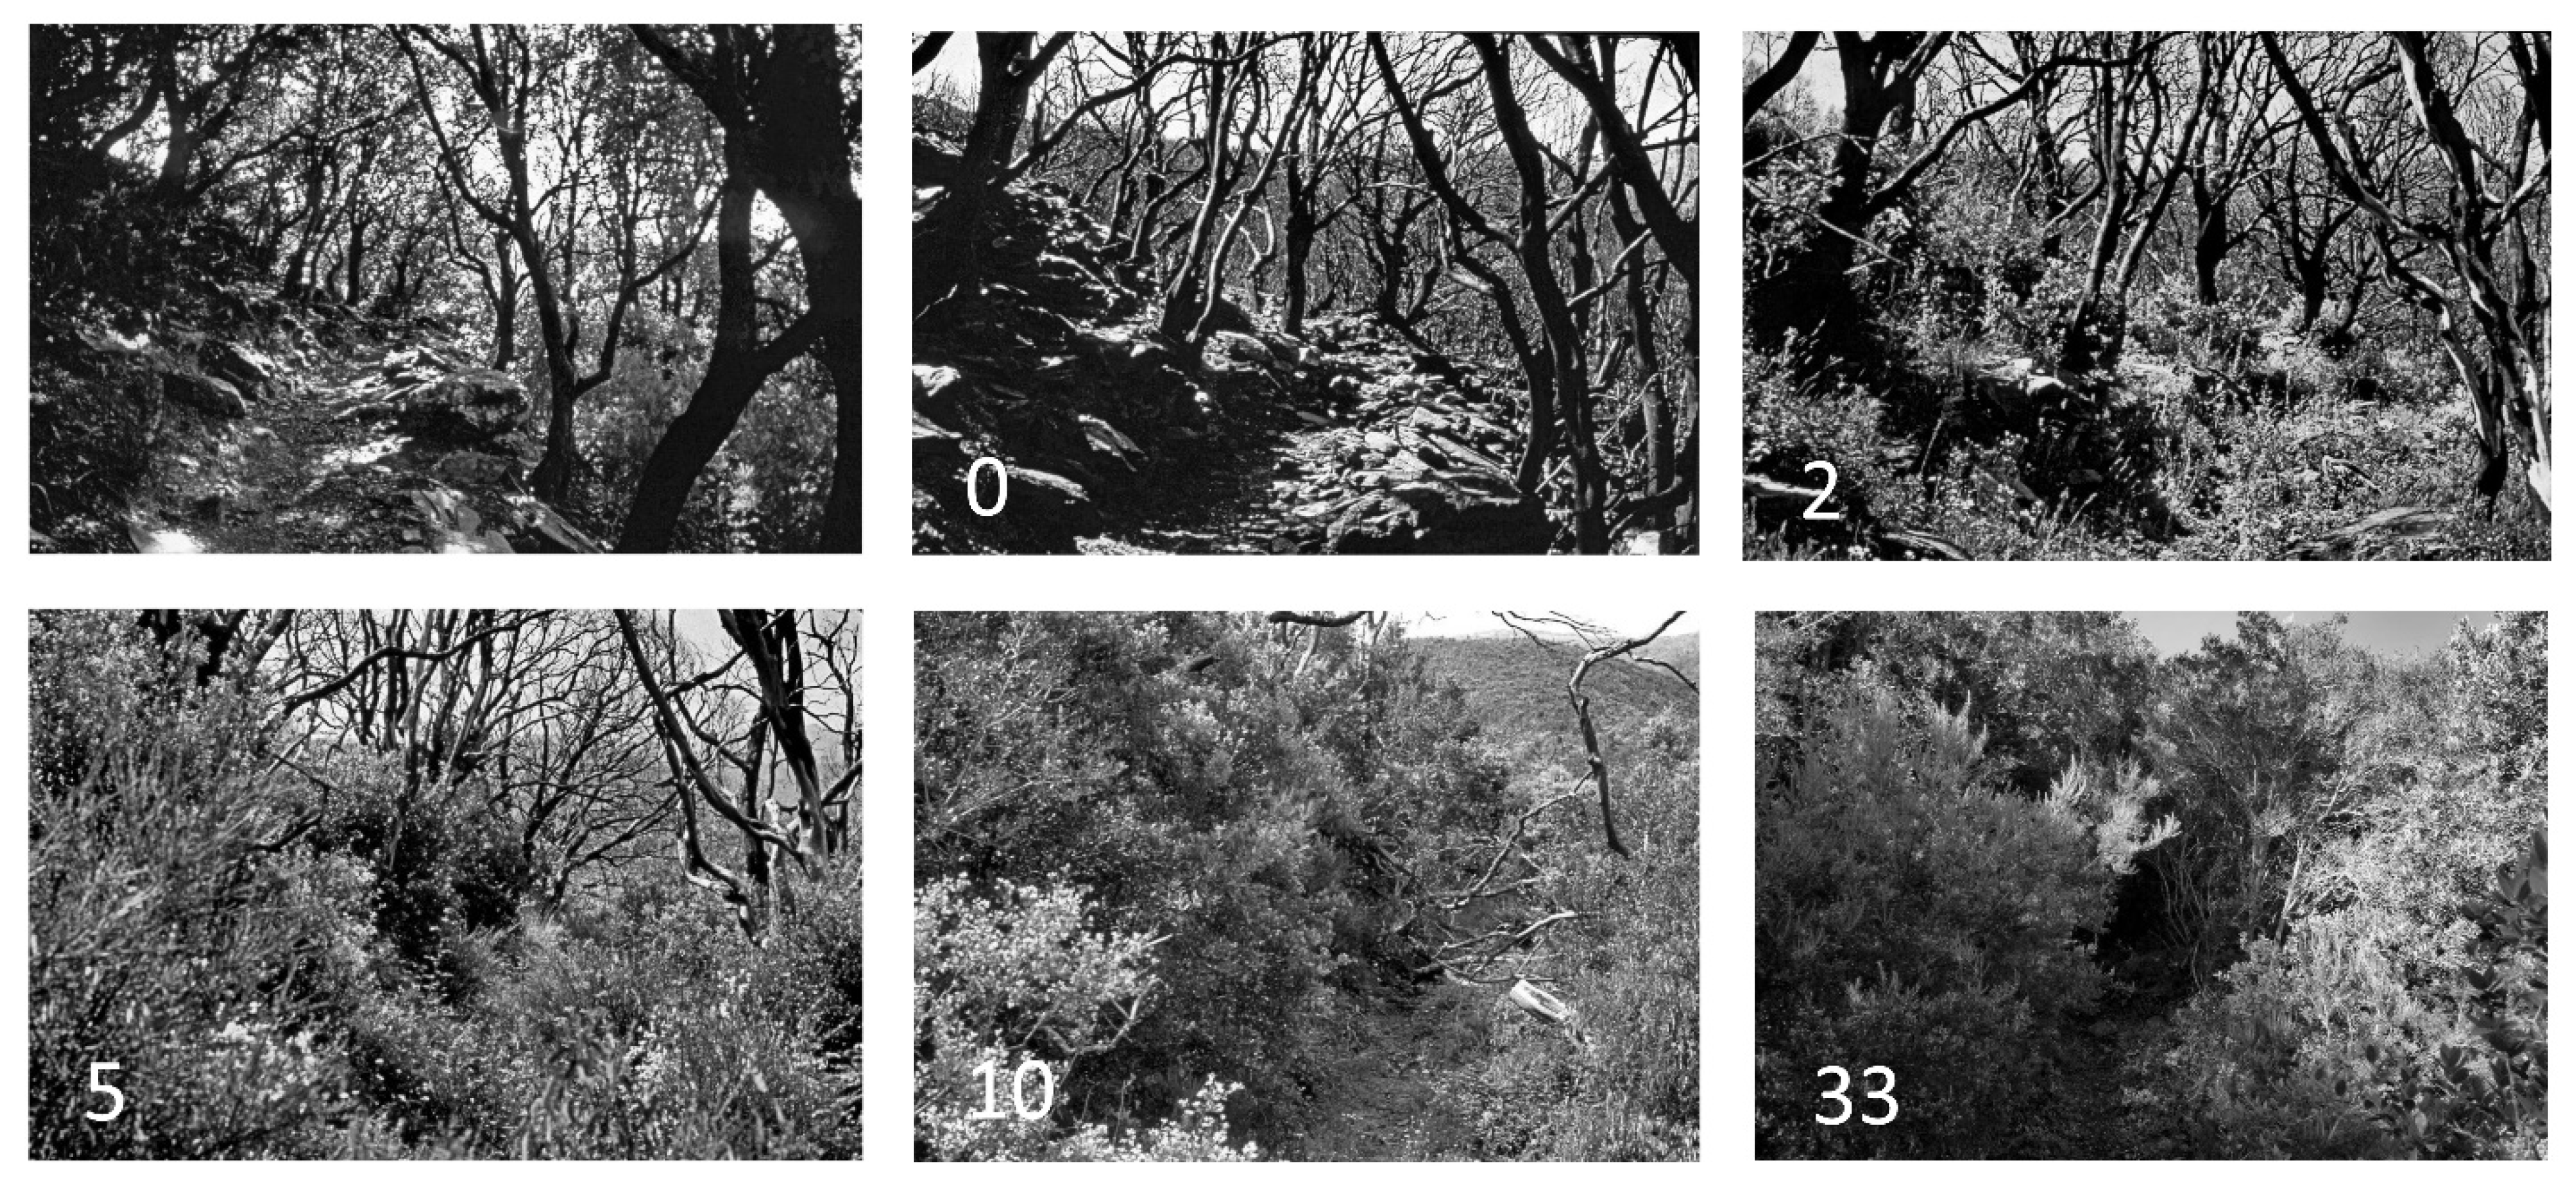
In a second step, in a before–after design, we then conducted postfire diachronic sampling on 71 selected stations belonging to the seven structural classes of the above gradient (Figure 2). This phase of the field sampling was constrained by the unpredictable occurrence and location of wildfires, by the availability of a particular vegetation type of the above categories within their perimeter, and by the presence of formerly sampled stations. Station monitoring was carried out annually, at least for the first eight years after the fire whenever possible (repeated fires could interrupt the sequences). In class G (holm oak forests; Figure 1), where no prefire samples were available, control sampling stations were selected in proximity. Due to the staggered fire dates, monitoring was not synchronous in all these stations. The large difference in surface area of the respective plant formations in the landscape, the alteration of certain stations during the study that led to the interruption of their monitoring, and various other constraints did not allow for balanced class–year numbers. The staggered fire dates smoothed out year effects other than time-since-fire in the comparisons of postfire trajectories, which compensated for the lack of parallel controls that in most cases would have been impossible to find in this rugged and heterogeneous landscape.
(3)
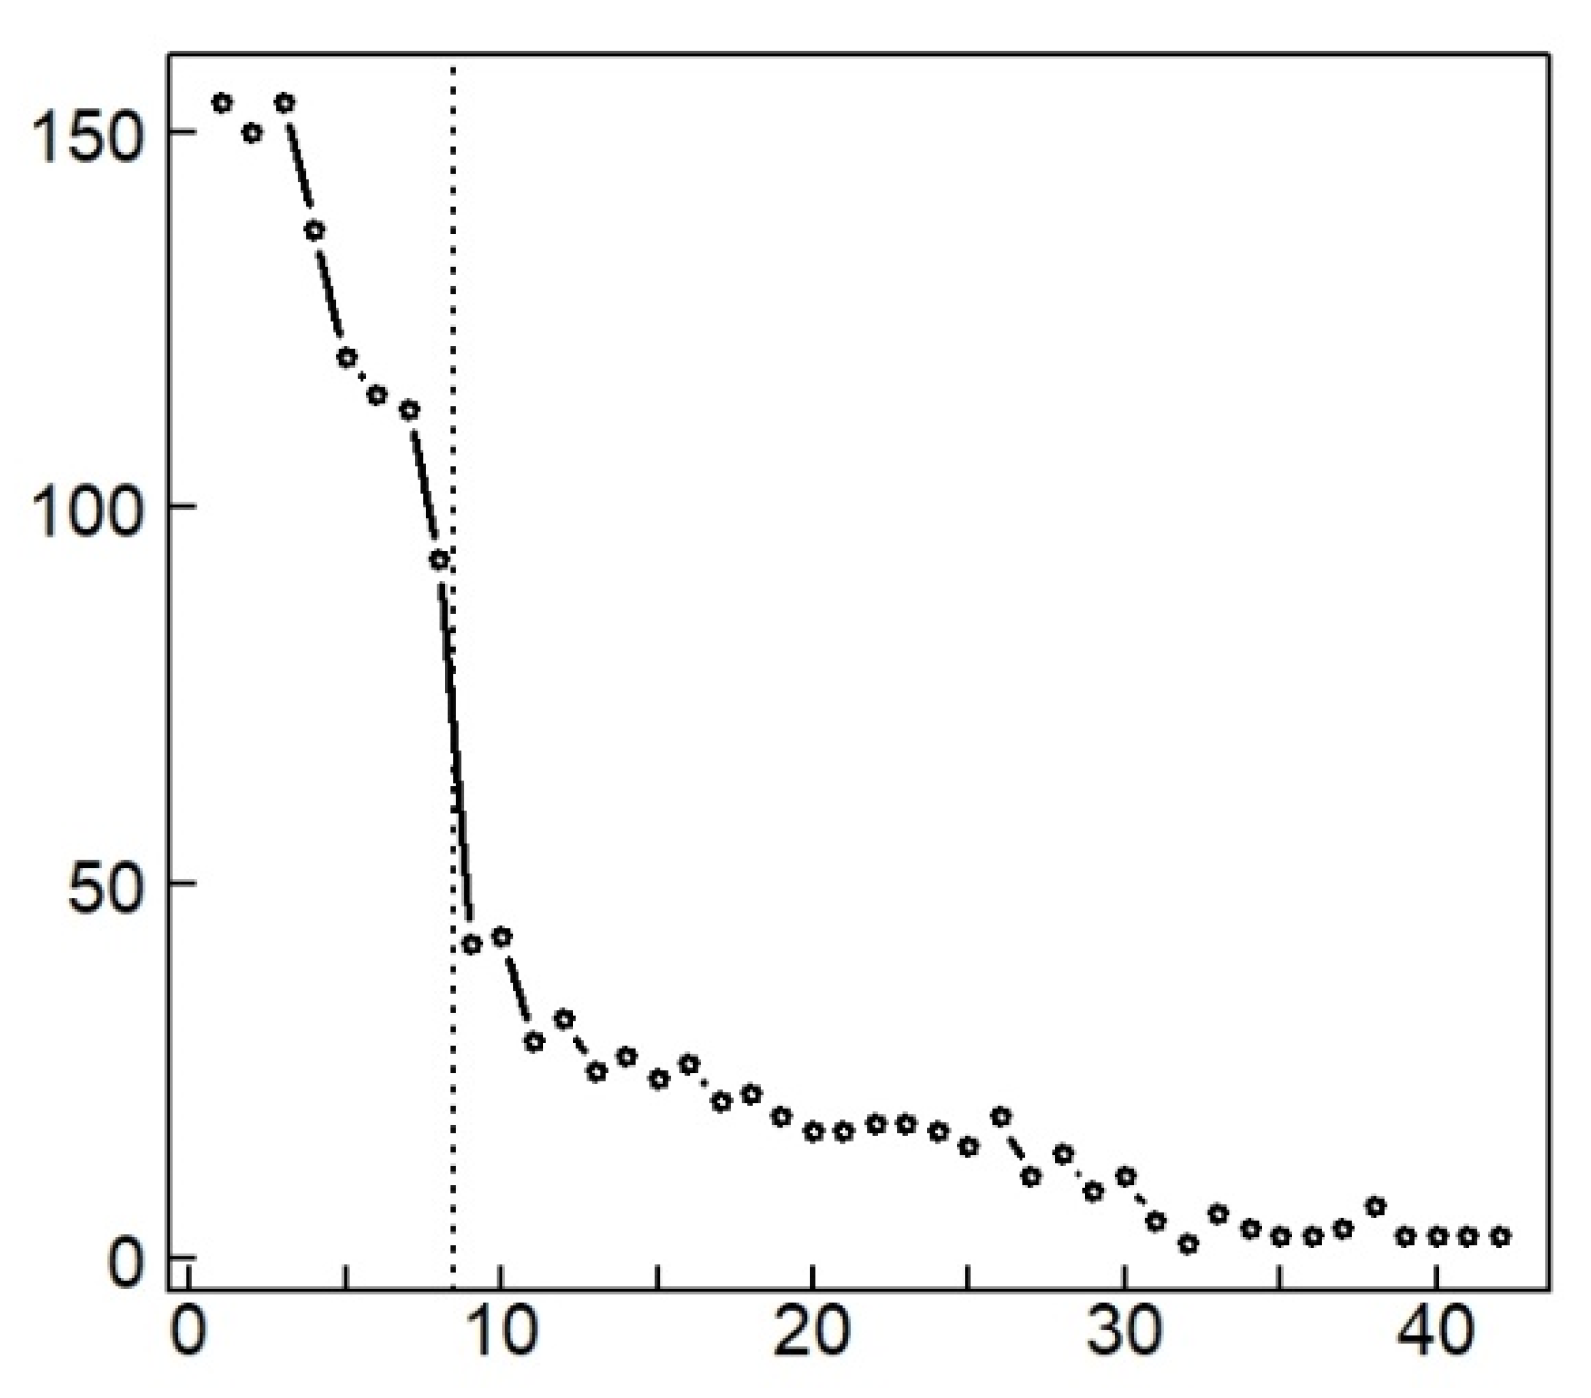
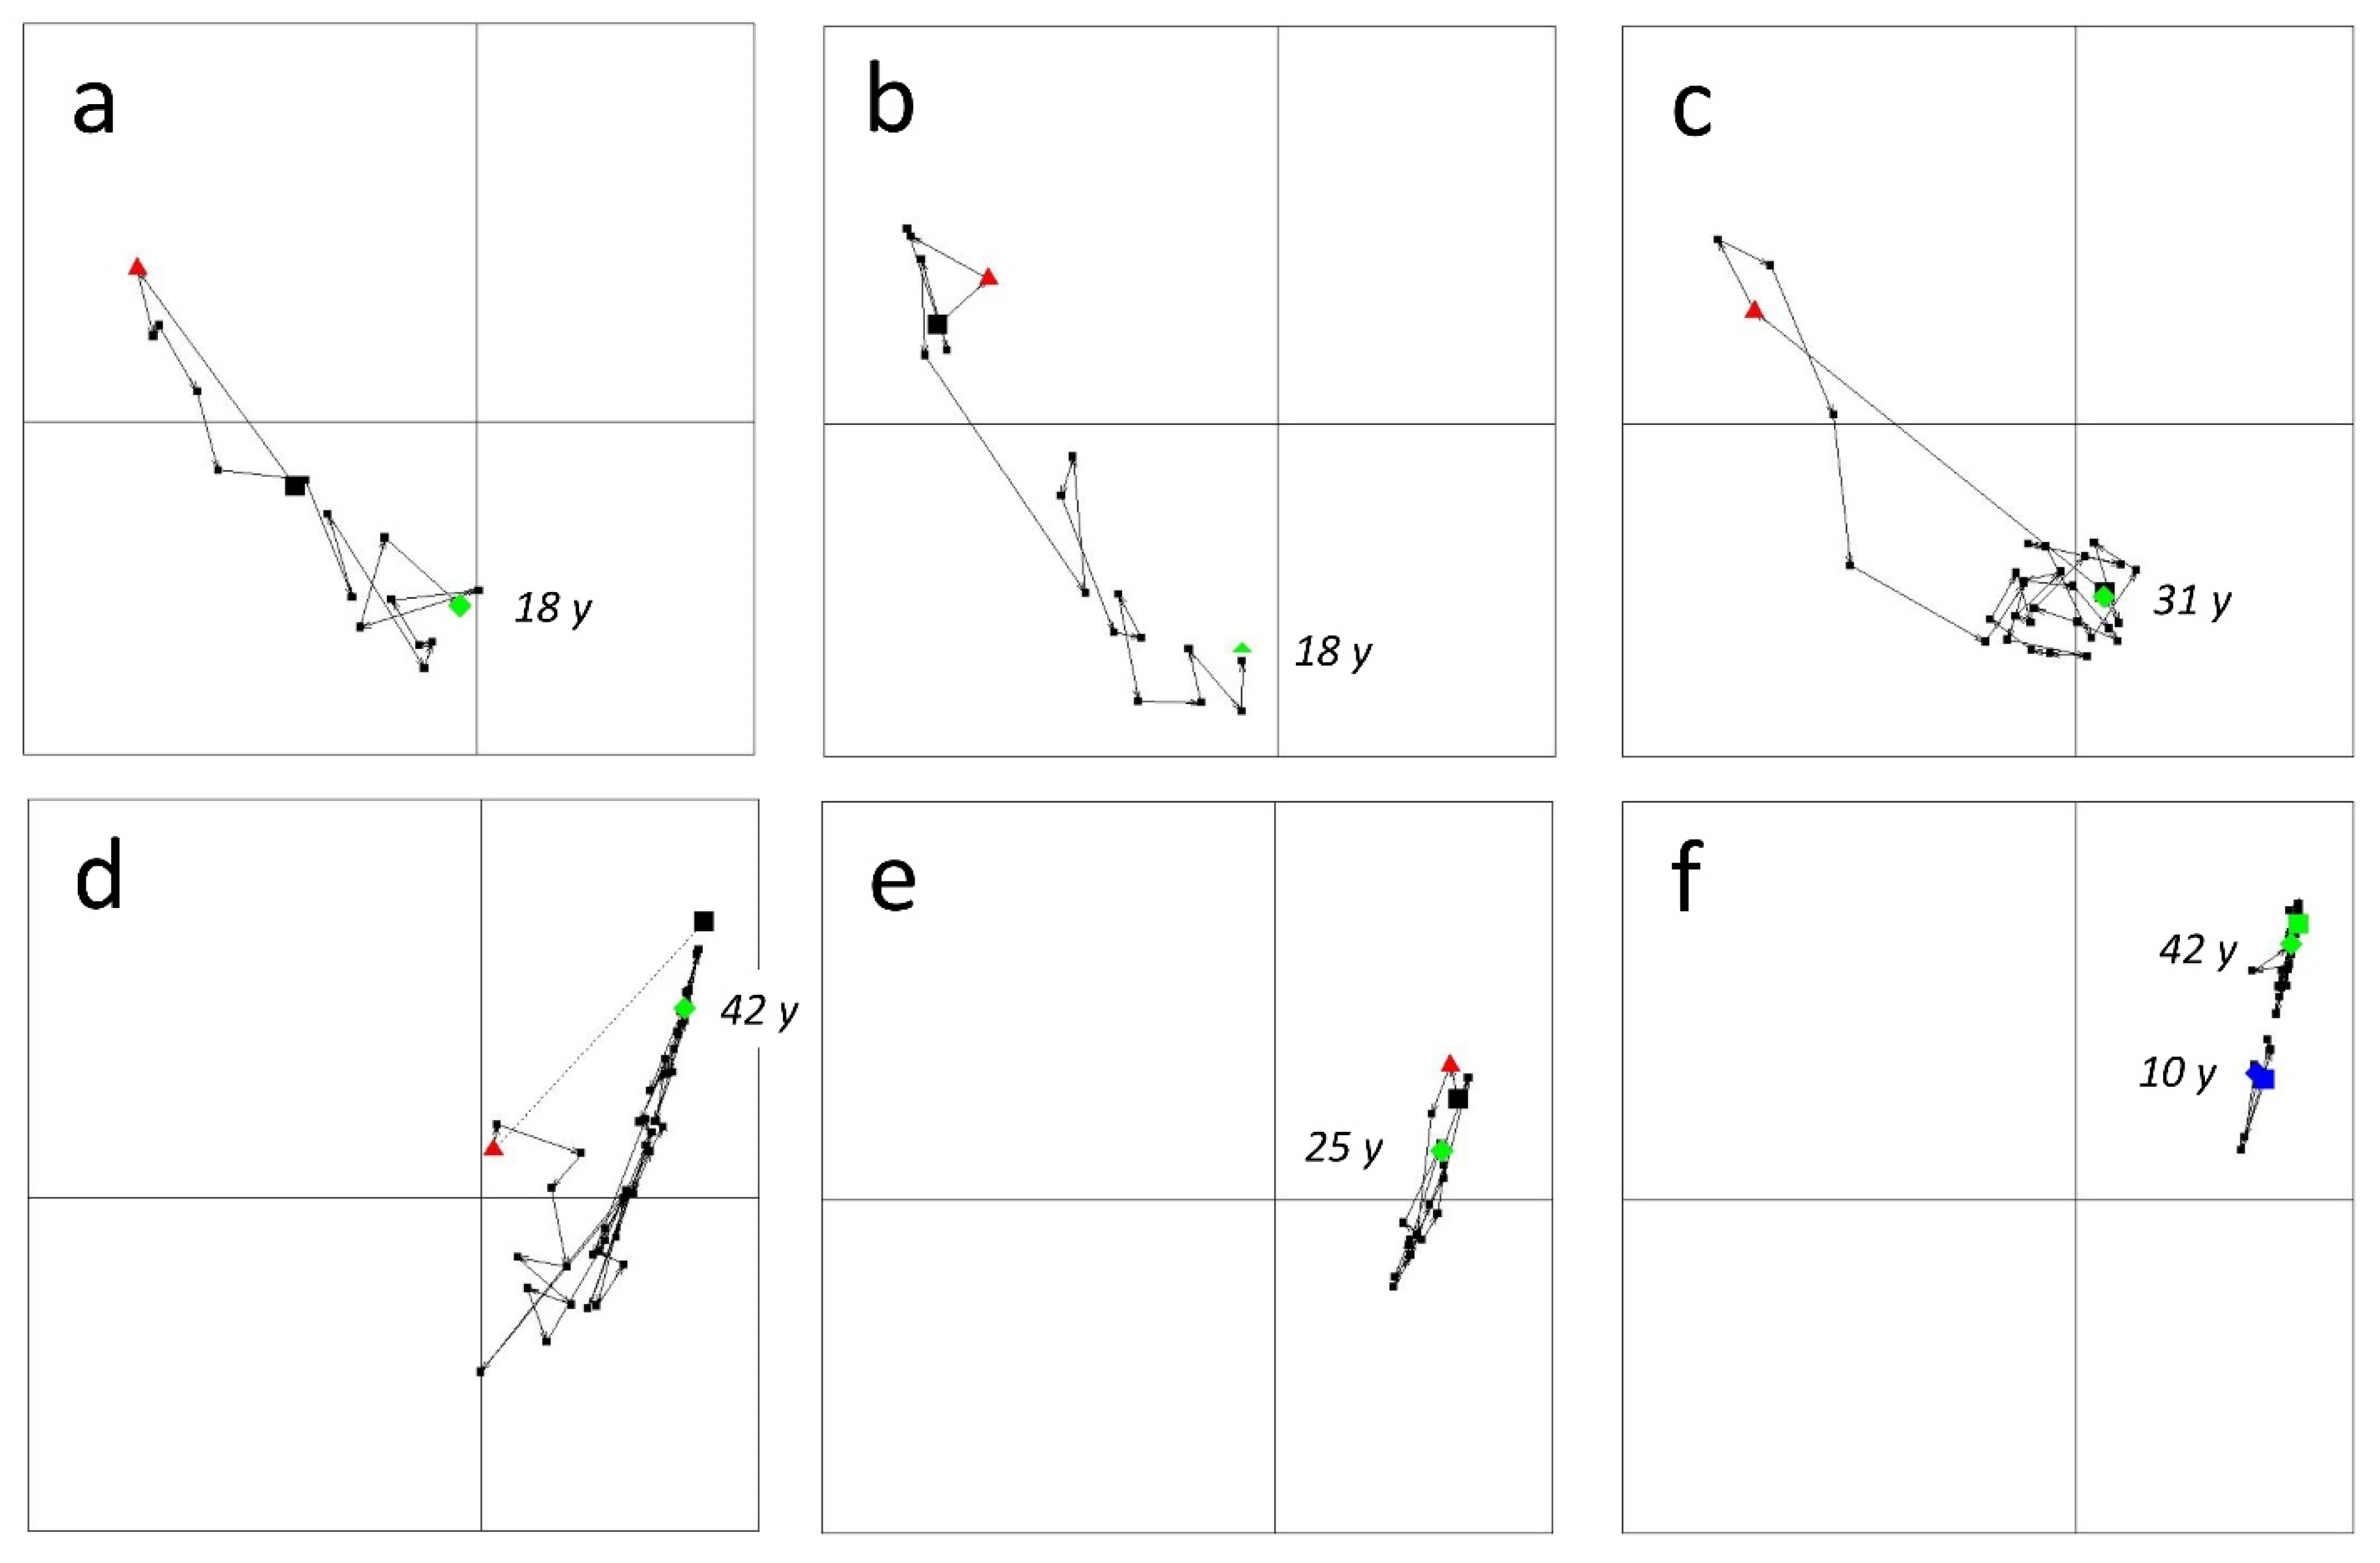
Depending on the opportunities offered by the occurrence of large wildfires during the study period, some stations—not sampled before the fire—were monitored diachronically, up to 42 years in some cases (Figure A3). These were compared as far as possible with control stations selected in the vicinity.

2.3. Sampling Method

Field sampling was carried out annually in the spring by the same observer, who simultaneously recorded bird-species assemblage and vegetation cover. Bird numbers were recorded in the morning by 20-min point counts with unlimited distance [13,24,37]. Raptors, swifts, swallows and crepuscular species were excluded from calculations. The vertical vegetation structure was quantified by visually estimating—in comparison with a reference chart—the percentage of cover around the observer within seven vegetation strata (0–0.25 m, 0.25–0.5 m, 0.5–1 m, 1–2 m, 2–4 m, 4–8 m, 8–16 m), plus the rock cover. The resulting foliage-height profiles were found to have a close relationship to avifauna composition and correlated well with a vegetation biomass estimator [46].

2.4. Statistical Analysis

Since the pioneering work of Austin [47], numerous different multivariate analyses have been applied to both the synchronic approach to succession (successional stages sampled at one time) and the diachronic approach (timeseries after a disturbance), in particular to represent changes in flora and fauna by trajectories in multidimensional spaces [17,33,46,47,48,49,50]. We chose to use correspondence analysis (CA), a standard method that is well suited to successional gradients that include unimodal variables, as is the case for many bird species and for some vegetation strata [13,31,48,49,51,52].
In CA, the lines and columns of the data matrix are normalized by their marginal sums, and thus transformed into profiles, which makes them independent of the units used (e.g., number of birds, percentage of vegetation cover). This is why—although multivariate analyses were initially applied to flora or fauna datasets—we applied CA to the matrix of vegetation layer covers. We did not use canonical correspondence analysis as a reference framework, as we wanted to take into account all the variation in the bird matrix, not only the variability explained by the vegetation variables [53]. We analysed the bird matrix independently from the vegetation matrix because there was no a priori reason why the postfire dynamics of avifauna and of vegetation should be strictly correlated and synchronous [24].
The changes affecting the avifauna in the sampling stations were represented by trajectories at one-year intervals in the ordination spaces. The shift of a given station in the multidimensional space was tracked over time (i) either on the first axis of the analysis when only the principal gradient was considered, and when the direction of the shift must be considered, (ii) or on the first plane of the analysis to draw trajectories, (iii) or on the three first axes to calculate distances.
The coexistence within the same sample of species that have more or less different positions on the axes of the analysis—i.e., different ecological optimums on the ecological gradients—represents an important form of alpha diversity, not directly related to species richness [54,55]. For a given sample and a given CA axis, we measured this alpha diversity by the variance in the scores of the species belonging to this sample (conditional within-sample variance) and, for several axes, by the sum of the conditional variance of species scores on these axes.
To measure the dissimilarities between consecutive samples recorded on a given sampling station at a one-year interval (before vs. after a fire), we used two different measurements:
The Jaccard distance was calculated from the number of species common to both samples compared to the number of species present in either or both samples, ignoring changes in species abundance. This distance is the complement of the Jaccard similarity index and varied from 0 (both species lists are identical) to 1 (no common species). This measure of species turnover did not differentiate between species, which all have the same weight in the calculations.
The Euclidian distance between two samples in the correspondence analysis was the Euclidian sum of these distances on the first three axes of the CA multidimensional space. This distance was sensitive to the identity of the species present in each of the two samples as it depended on their positions on the axes of the analysis. The further apart the ecological optima of these species were on the gradient(s), the greater the distance between the two samples. This distance, which varied from zero to an undefined maximum, measured the dissimilarity of the species niches between the two consecutive samples, without reference to the number of species present in these samples.
We performed the analysis of this dataset in two steps: (i) we submitted the whole bird × sample matrix (and, independently, the vegetation layers × matrix) to multivariate analysis (CA), all samples combined, burned or unburned, whatever the number of fires and the duration of monitoring, (ii) the multivariate space resulting from this analysis provided the reference space in which we considered a subset of this dataset restricted to the stations sampled before a fire and then monitored yearly during the eight following years, or to other selections of stations. Calculations were made with the R base and the ‘ade4’ package of R [56].

3. Results

The dataset included 1821 samples, 258 of which were prefire samples or unburned controls. These samples were collected on 116 sampling stations, including the 71 before–after stations mentioned above. The monitoring was continued for more than eight years on a small number of stations (up to 42 years in certain cases), not all of which belong to the before–after design (Figure A3).
In the analyses, 51 bird species were considered (the common names are given at their first mention in the text). Eleven other species were only occasionally recorded, rare or poorly sampled, and excluded from the dataset. The ten most abundant species were, in order of decreasing frequency: Sardinian warbler Sylvia melanocephala (present in 66% of the samples), blackbird Turdus merula (55%), nightingale Luscinia megarhynchos (52%), Dartford warbler Sylvia undata (45%), subalpine warbler Sylvia cantillans (37%), melodious warbler Hippolais polyglotta (32%), chaffinch Fringilla coelebs (30%), great tit Parus major (28%), rock bunting Emberiza cia (28%), and Linnet Linaria cannabina (28%). The relationships between species frequencies and abundances are not known.

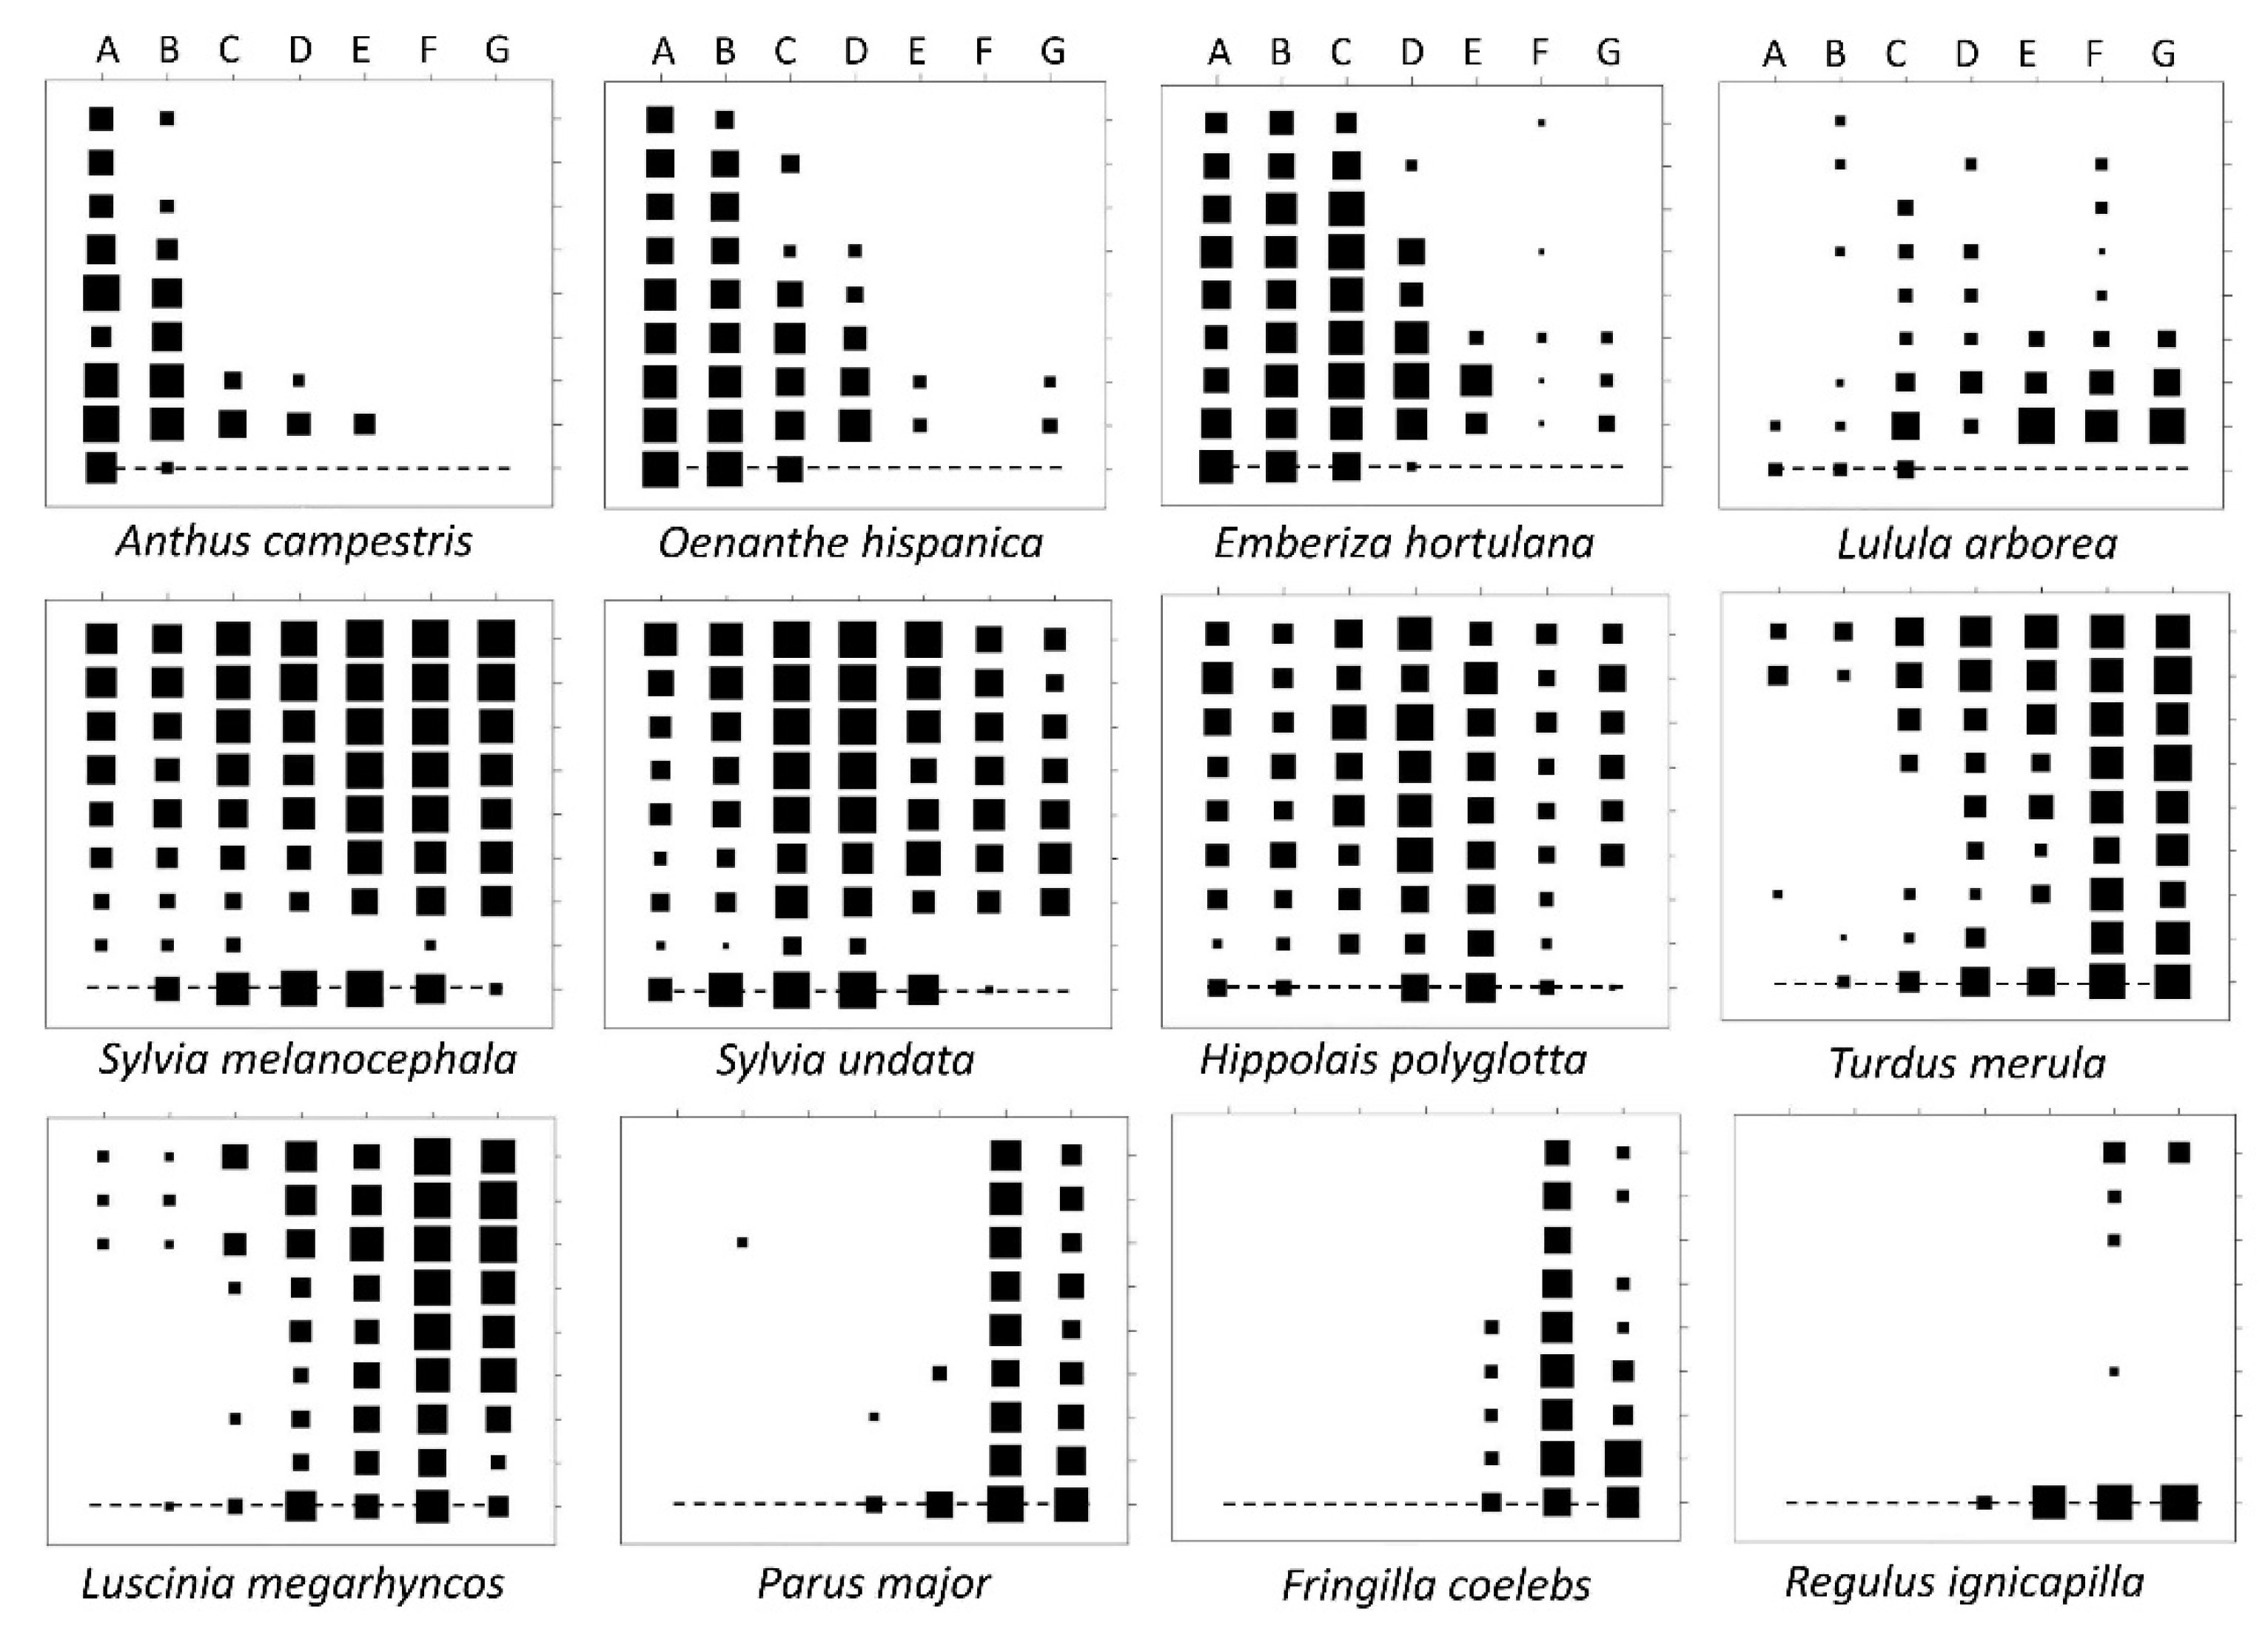
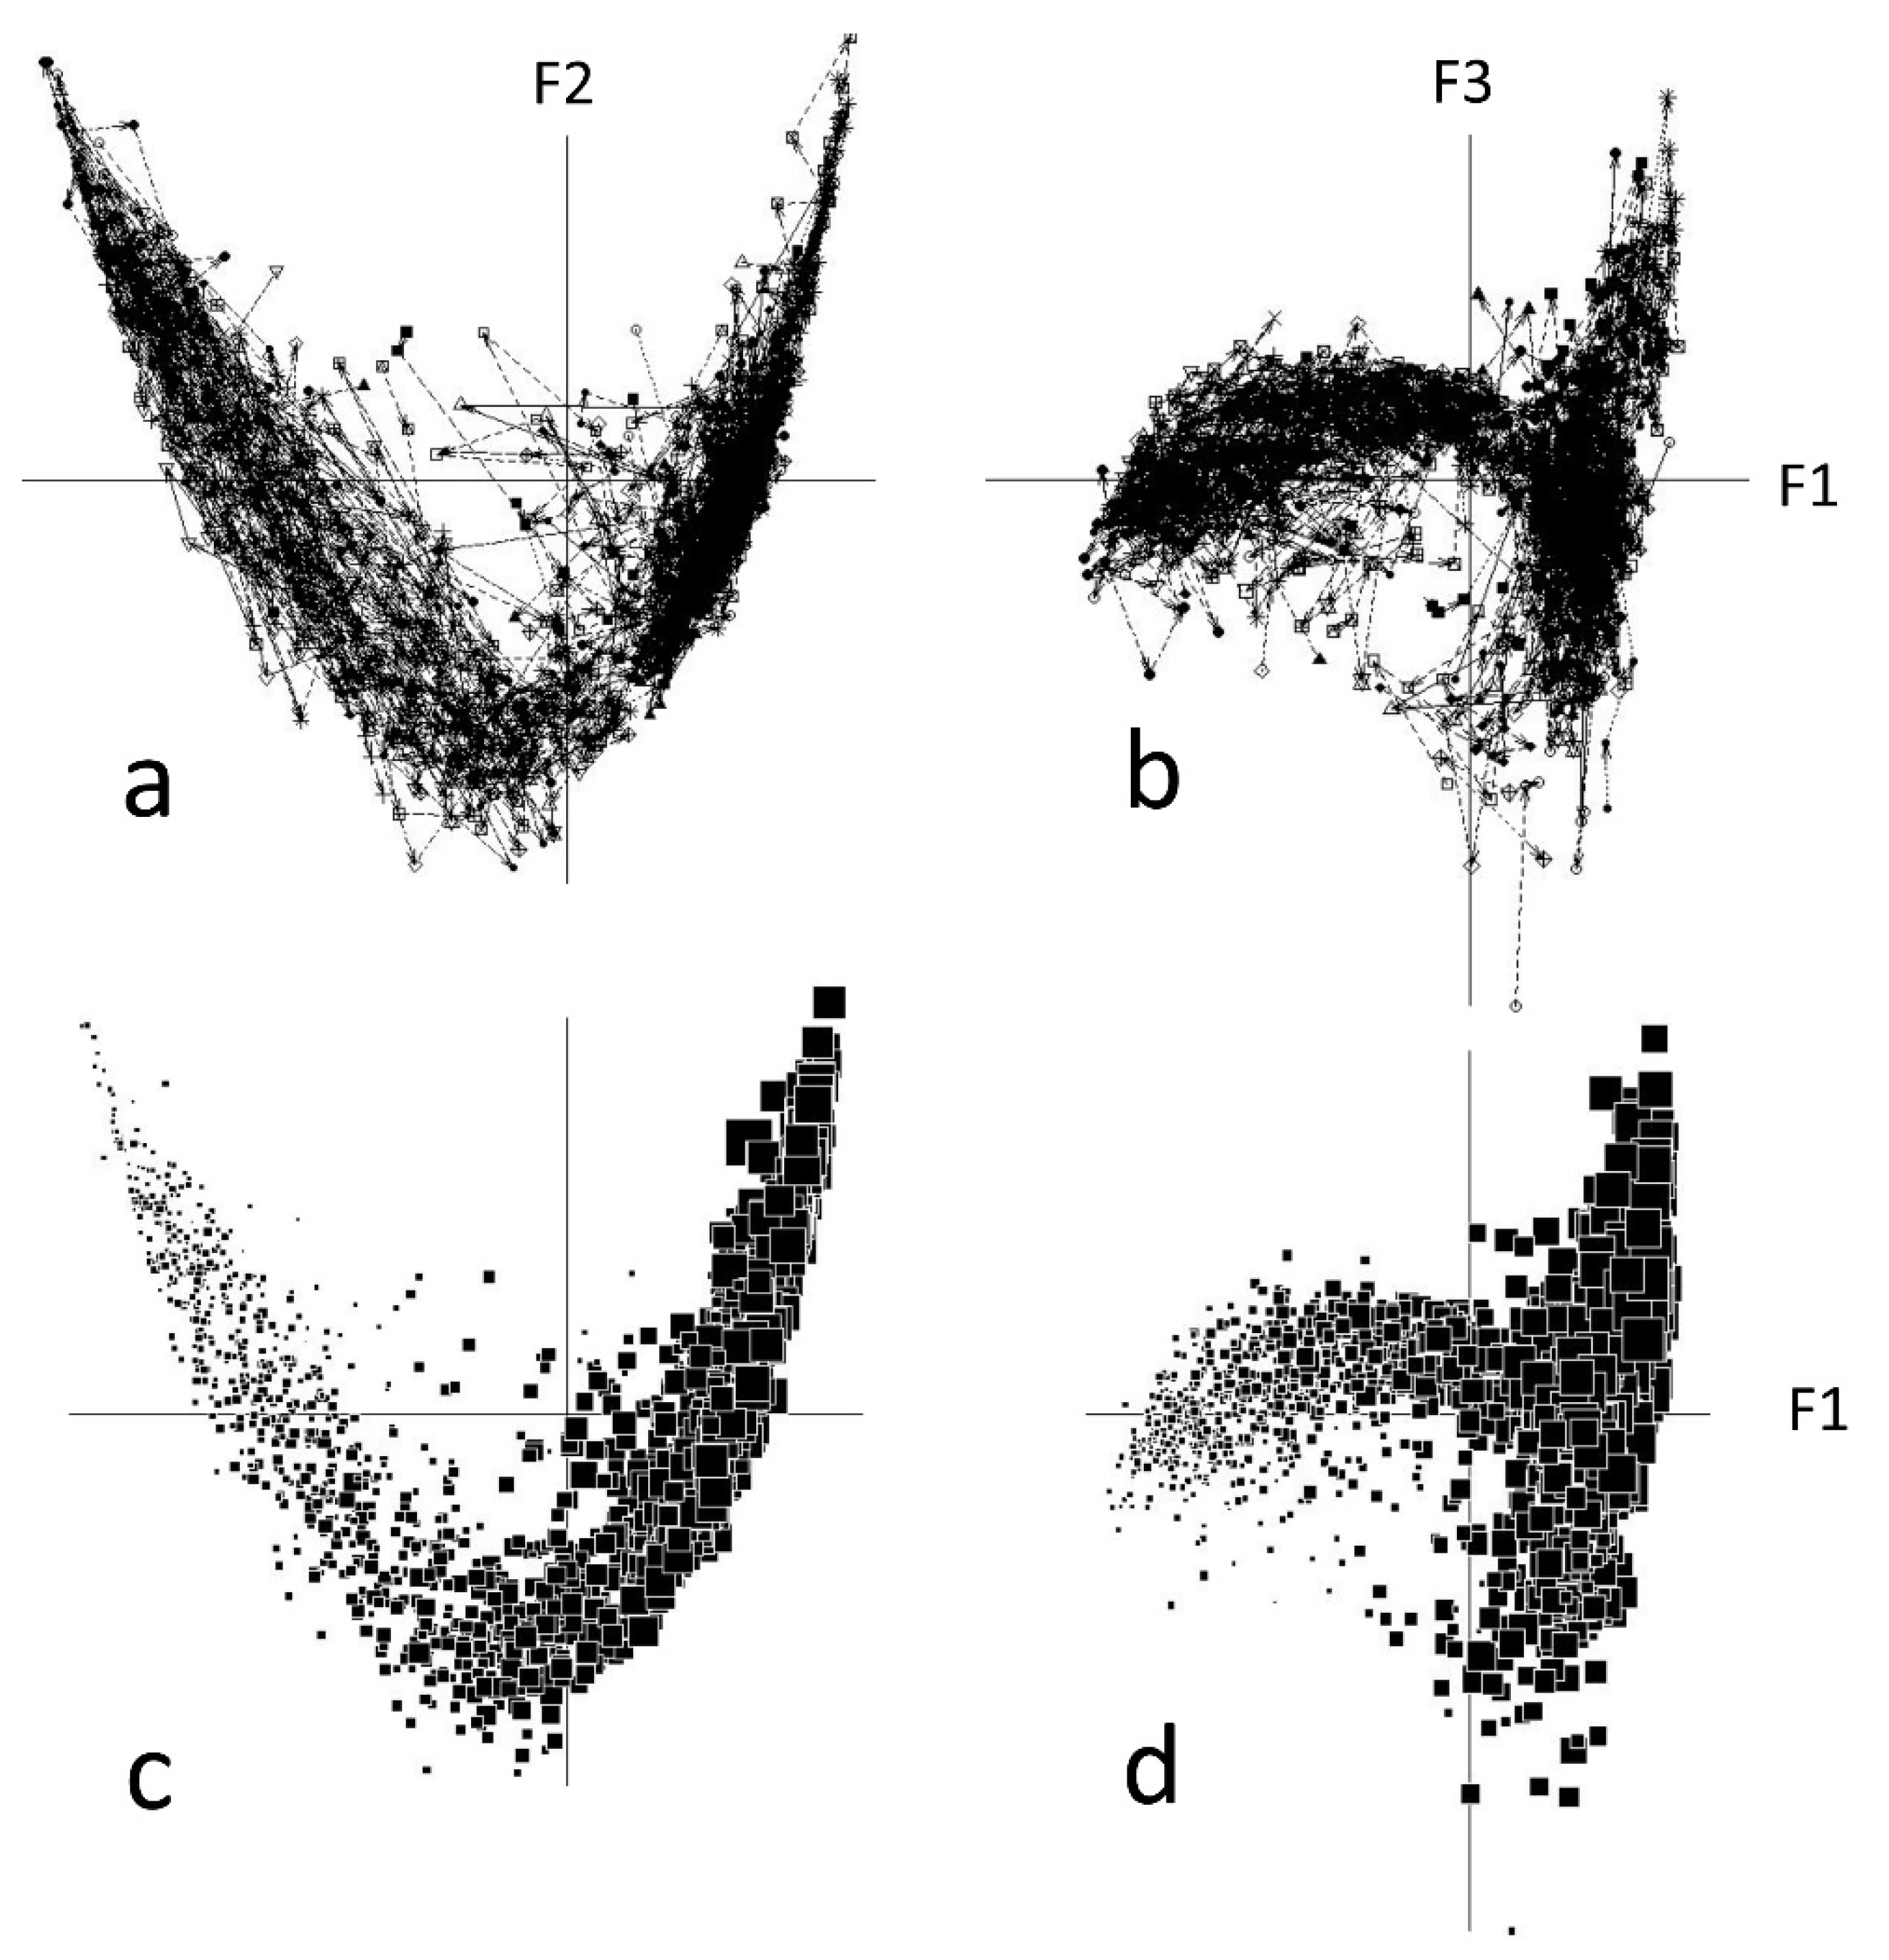
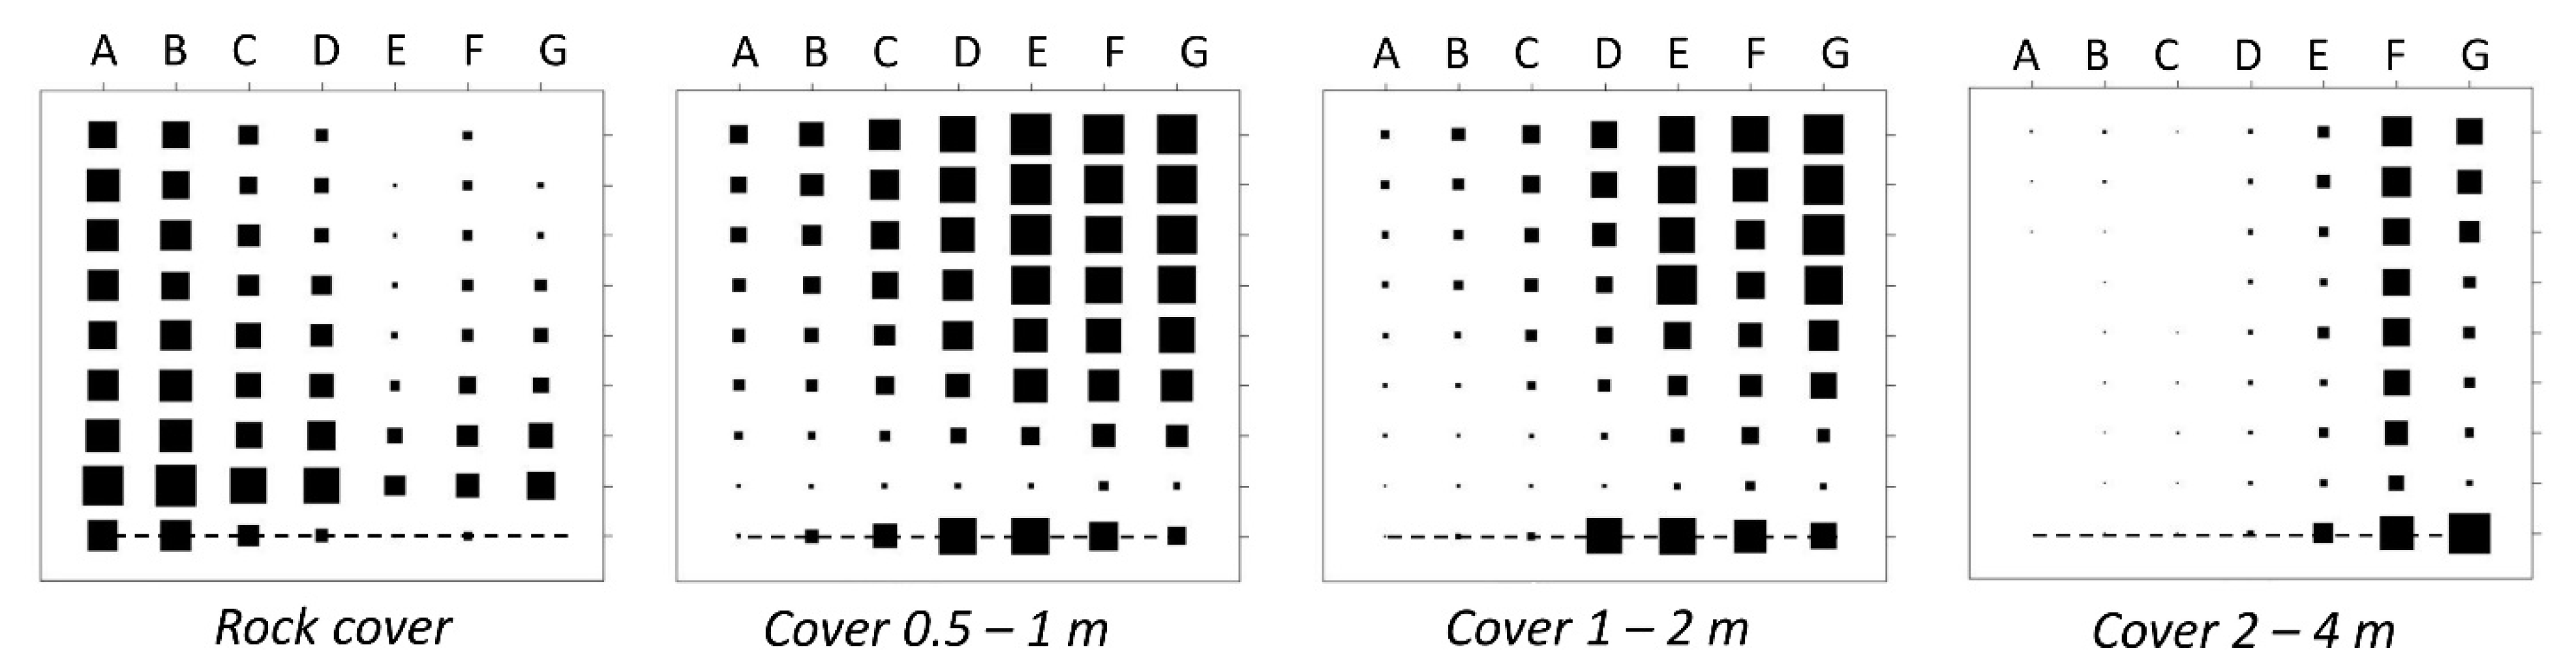
3.1. Species Distribution in Two Dimensions: Vegetation Gradient vs. Postfire Succession

In grasslands, many bird species seem little affected by fire, which usually occurs after the breeding season; site fidelity is likely, which is suggested by field observations of territorial birds on site in the weeks following a fire. After a fire, open-habitat species expanded their distribution along the vegetation gradient by colonizing formerly woody formations, but only to a point (Figure 3). Certain species (tawny pipit Anthus campestris, Thekla lark Galerida theklae, black-eared wheatear Oenanthe hispanica, ortolan bunting Emberiza hortulana, cirl bunting Emberiza cirlus, spectacled warbler Sylvia conspicillata, Linaria cannabina) could extend into mid-successional formations soon after a fire, but not into forest environments, and disappeared rapidly over the years so that their window of colonization is short. Others (Emberiza cia, woodlark Lullula arborea, red-legged partridge Alectoris rufa) penetrated the burned forests in small numbers and temporarily (usually for 2–4 years). These open-habitat colonizers were generally more frequent in holm oak burns than in cork oak burns; in the latter, they are hindered by the early canopy regeneration.
As heather leaves few stubs after a fire, and burned gorse and rockrose leave few or no branches, mid-successional shrub-nesting bird species disappear almost completely in the first spring after a fire (Sylvia undata, S. melanocephala). They reappear as soon as the bushes began to regrow and broaden their distribution on the gradient, both in former woody formations regenerating in the form of shrubs, and in grasslands progressively encroached by scrub despite the fact that they initially burned. This results in an overall increase in shrub-nesting birds in the burned landscape in the medium term (at least for one or two decades), and thus in a homogenization of the avifauna.
Only one species disappeared almost completely after a fire, at least for 7–8 years (firecrest Regulus ignicapilla). Others became rare in pre-forest formations the first years after a fire, and then recolonized (Turdus merula, Luscinia megarhynchos). A number of forest species retained a notable frequency (although generally low numbers) in burns even in the first years after a fire (Parus major, jay Garrulus glandarius, Fringilla coelebs, wood pigeon Columba palumbus). In contrast, certain species tended to be more frequent in burned than in unburned areas (Lullula arborea, goldfinch Carduelis carduelis, serin Serinus serinus, woodchat shrike Lanius senator, Emberiza cirlus). Fringilla coelebs, a typical forest species in the study area, paradoxically remains well represented in recent burns, sometimes even in increased numbers in cork oak forests [24], and subsequently decreases.
Similar two-dimensional graphical conventions can be used, for comparison with species distributions, to represent the variations in cover within vegetation strata in the seven vegetation types the eight first years after fire (Figure A4).

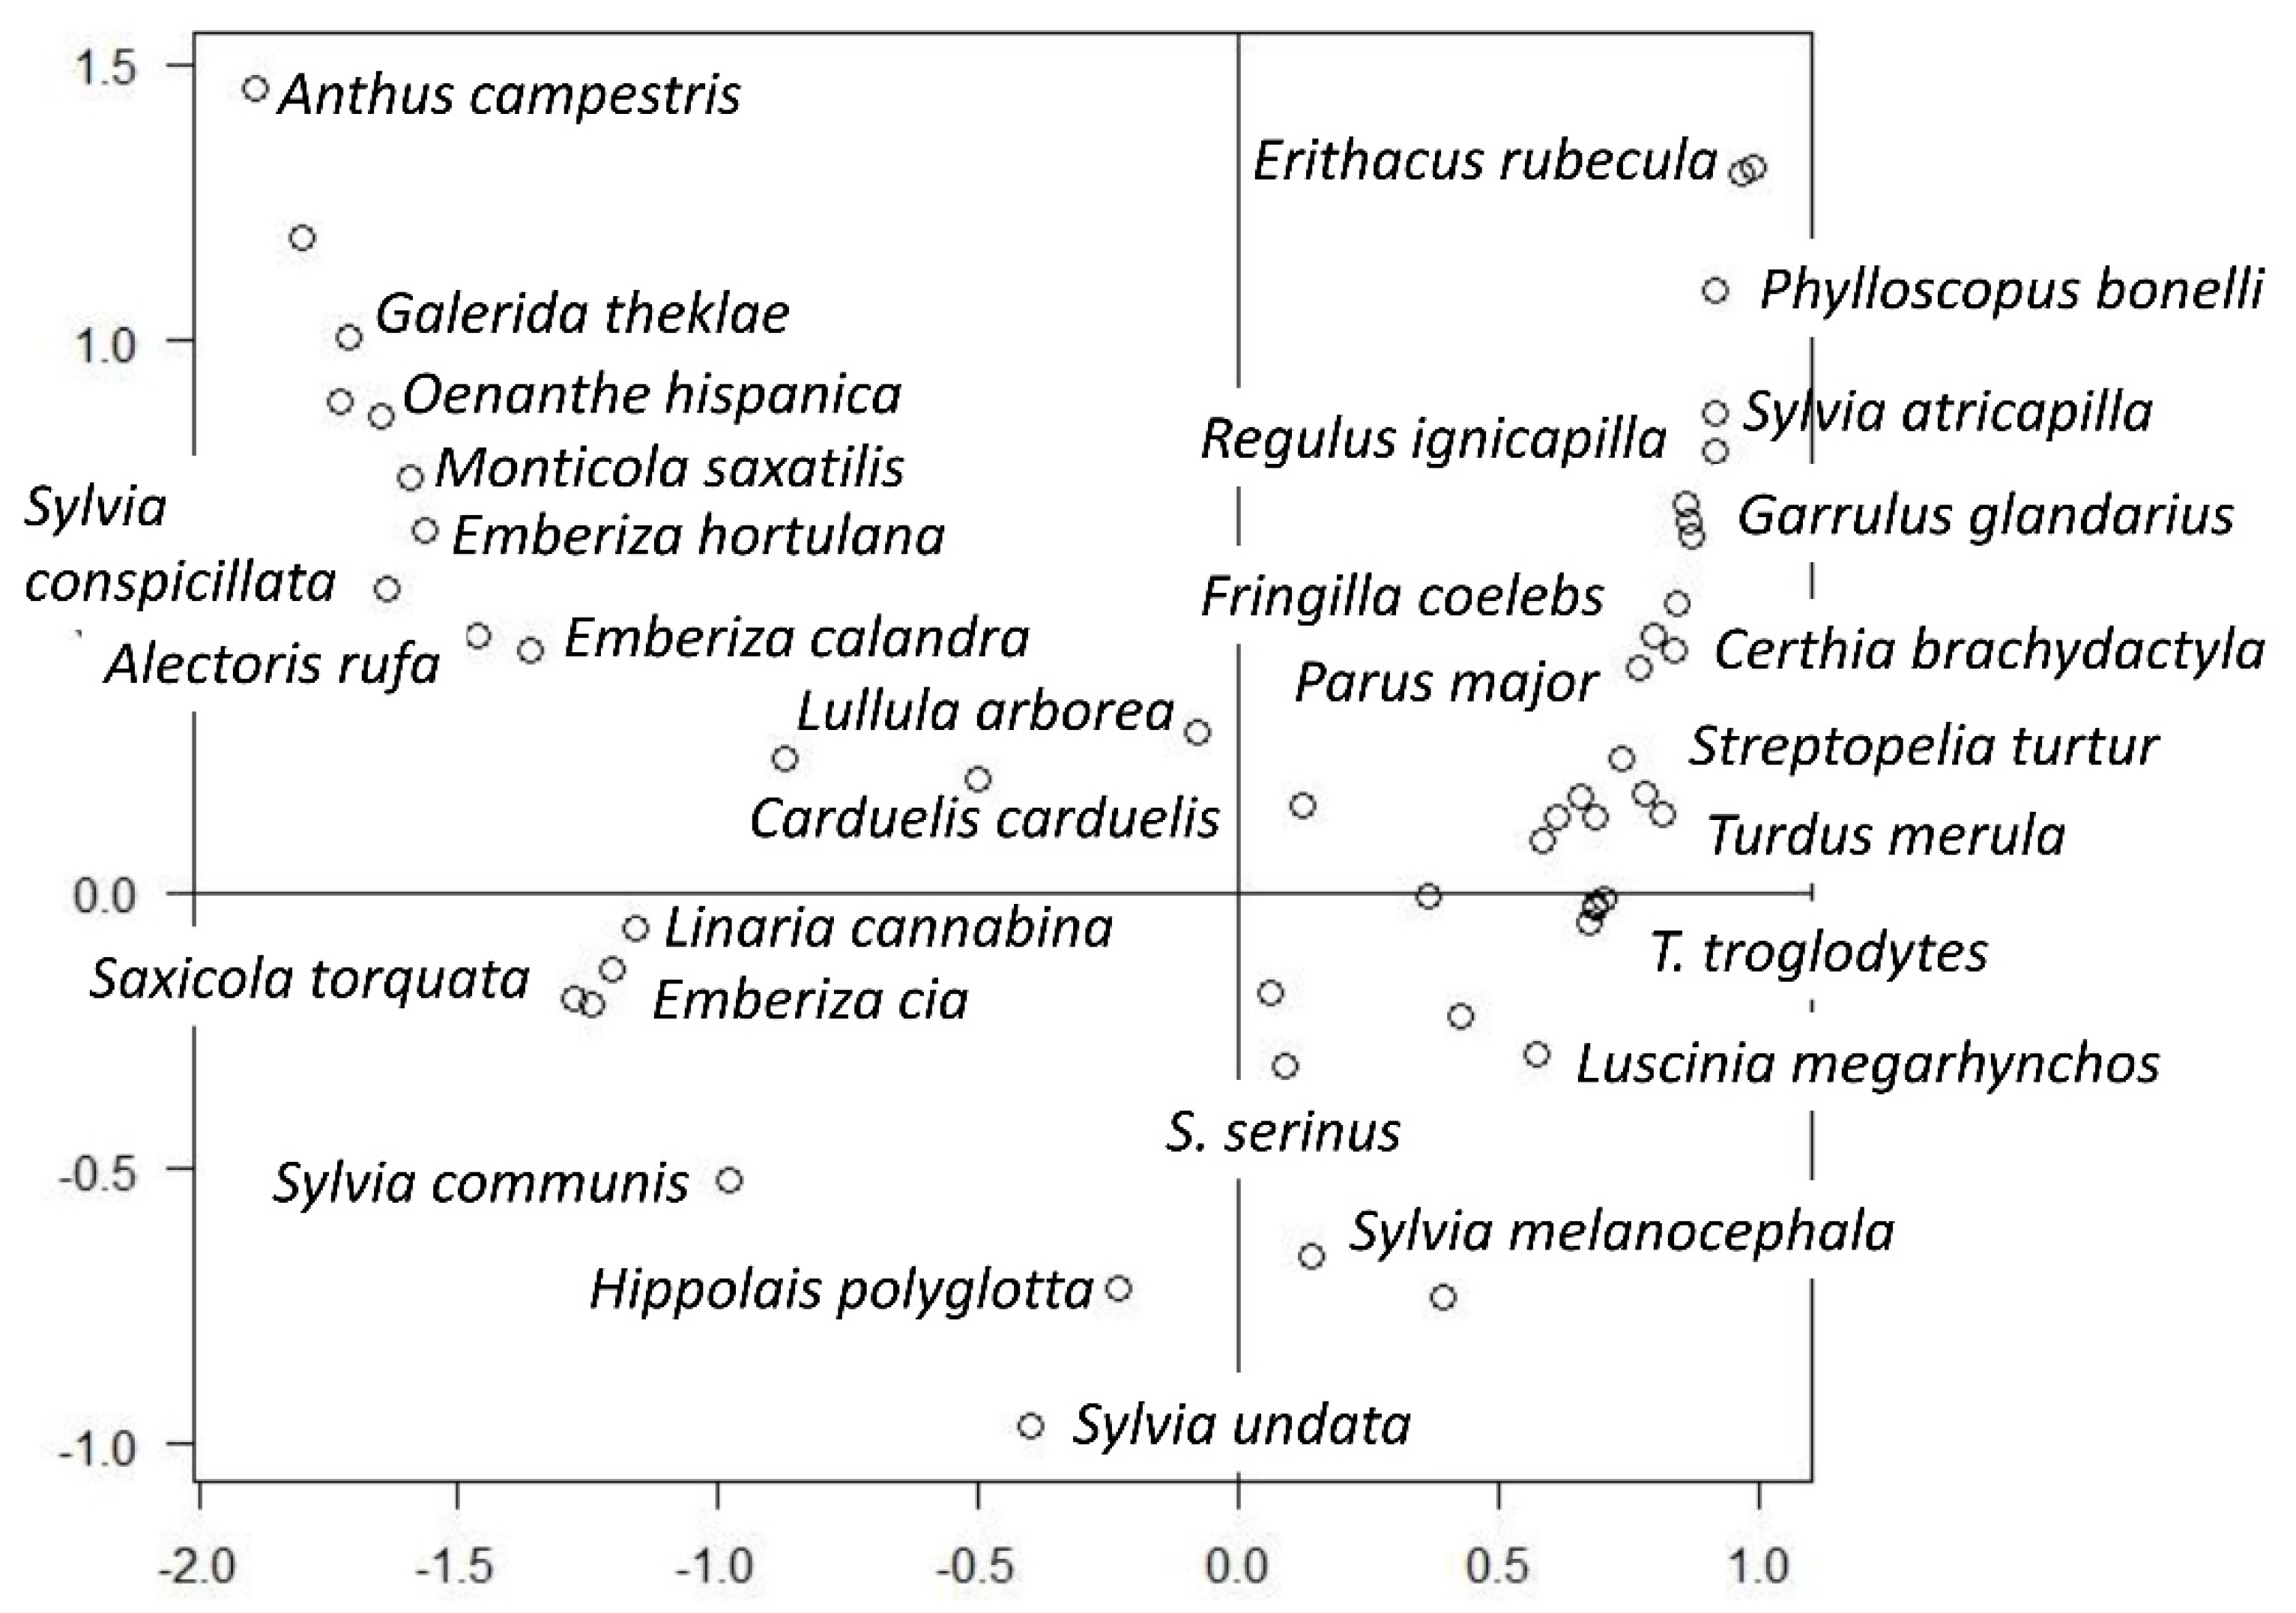
3.2. A Common Successional Gradient

Species Ordination

The first three axes of the CA of the whole bird × sample matrix (1821 lines × 51 columns) accounted for 25% of the total variance. The first axis (hereafter F1) had an eigenvalue of 0.72 and accounted for 13.9% of the variance.
The ordination of the bird species on this axis ranged from open-habitat species (Anthus campestris, quail Coturnix coturnis, Galerida theklae, Oenanthe hispanica, Emberiza hortulana, Sylvia conspicillata) to shrub-nesting species (Sylvia undata, Hippolais polyglotta, Sylvia melanocephala) to closed-forest species (nuthatch Sitta europea, robin Erithacus rubecula, Bonelli’s warbler Phylloscopus bonelli, blackcap Sylvia atricapilla, Regulus ignicapilla, short-toed treecreeper Certhia brachydactyla), or birds of heterogeneous or mid-successional formations (Carduelis carduelis, Lullula arborea, hoopoe Upupa epops, Lanius senator, Serinus serinus) (Figure 4; Table A1). This gradient, corresponding to the F1 axis, is highly and positively correlated with the index of foliage volume (R = 0.92; log-transformed) and the covers of the upper layers, and negatively with the rock cover (Table A2). It has therefore a successional meaning.
Due to the strong dominance of the first axis of the CA in term of explained variance, the second axis (eigenvalue 0.33, 6.37% of the variance; hereafter F2) is partly a quadratic function of the first (the so-called ‘arch effect’ of CA). Nevertheless, in its median, this second axis separated the most frequent birds in dense and homogeneous bushy formations (Sylvia undata, Sylvia melanocephala) on the outer side of the parabola, from birds in heterogeneous, patchy or ecotone environments (Lulula arborea, Linaria cannabina, C. carduelis, S. serinus) on the inside of the parabola. This axis was mainly and negatively correlated with the cover of the 0.25–1 m vegetation layer, i.e., with the thickness of the maquis.
At the forest extremity of the gradient, on the third axis of the analysis (hereafter F3), a subgradient distinguished a set of species more frequent in cork oak burns than in holm oak burns from the main gradient: golden oriole Oriolus oriolus (27 vs. 0.1%), Lanius senator (15.0 vs. 0%), greenfinch Chloris chloris (26.4 vs. 2.2%), Emberiza cirlus (15.2 vs. 0.1%), green woodpecker Picus viridis (13 vs. 1.9%). This axis was particularly correlated with the cover of the 1–4 m vegetation layer.
At the grassland extremity of the gradient, the fourth axis contrasted rocky habitats and their species (Oenanthe spp., Monticola ssp.) with less rugged open habitats and their species (Emberiza spp., C. coturnix) (not shown). This axis was mainly correlated with the rock cover.

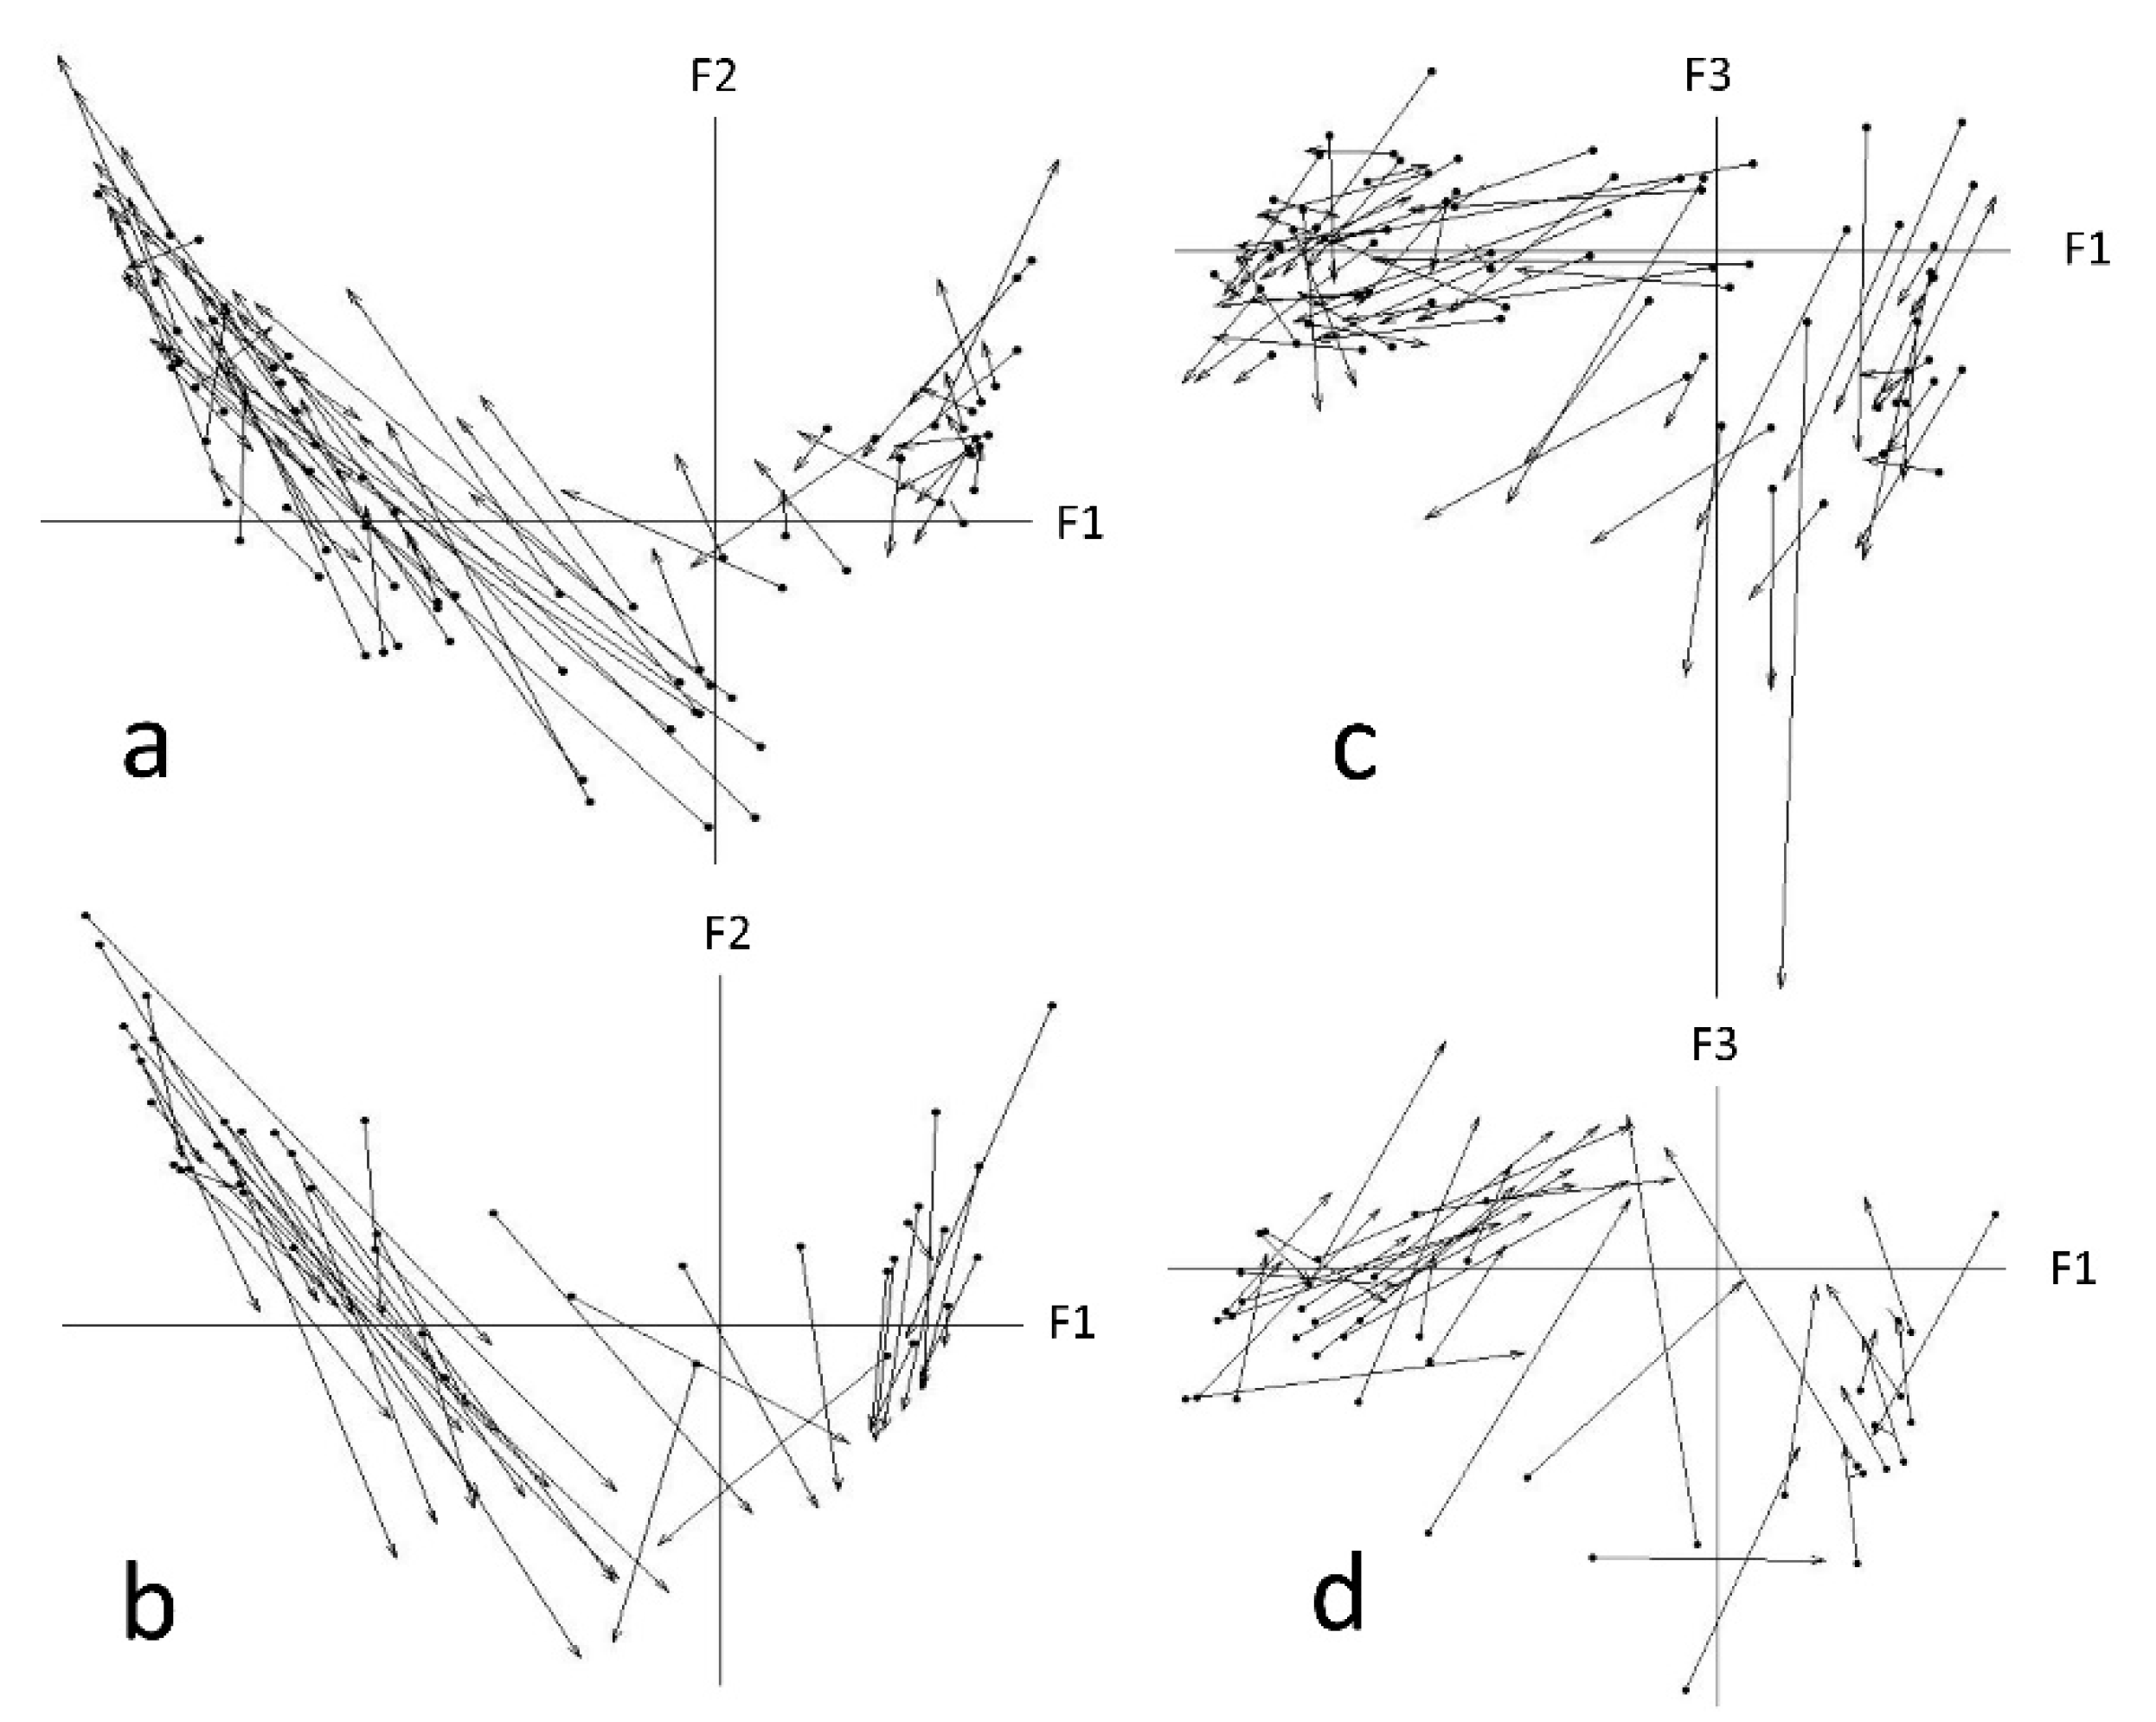
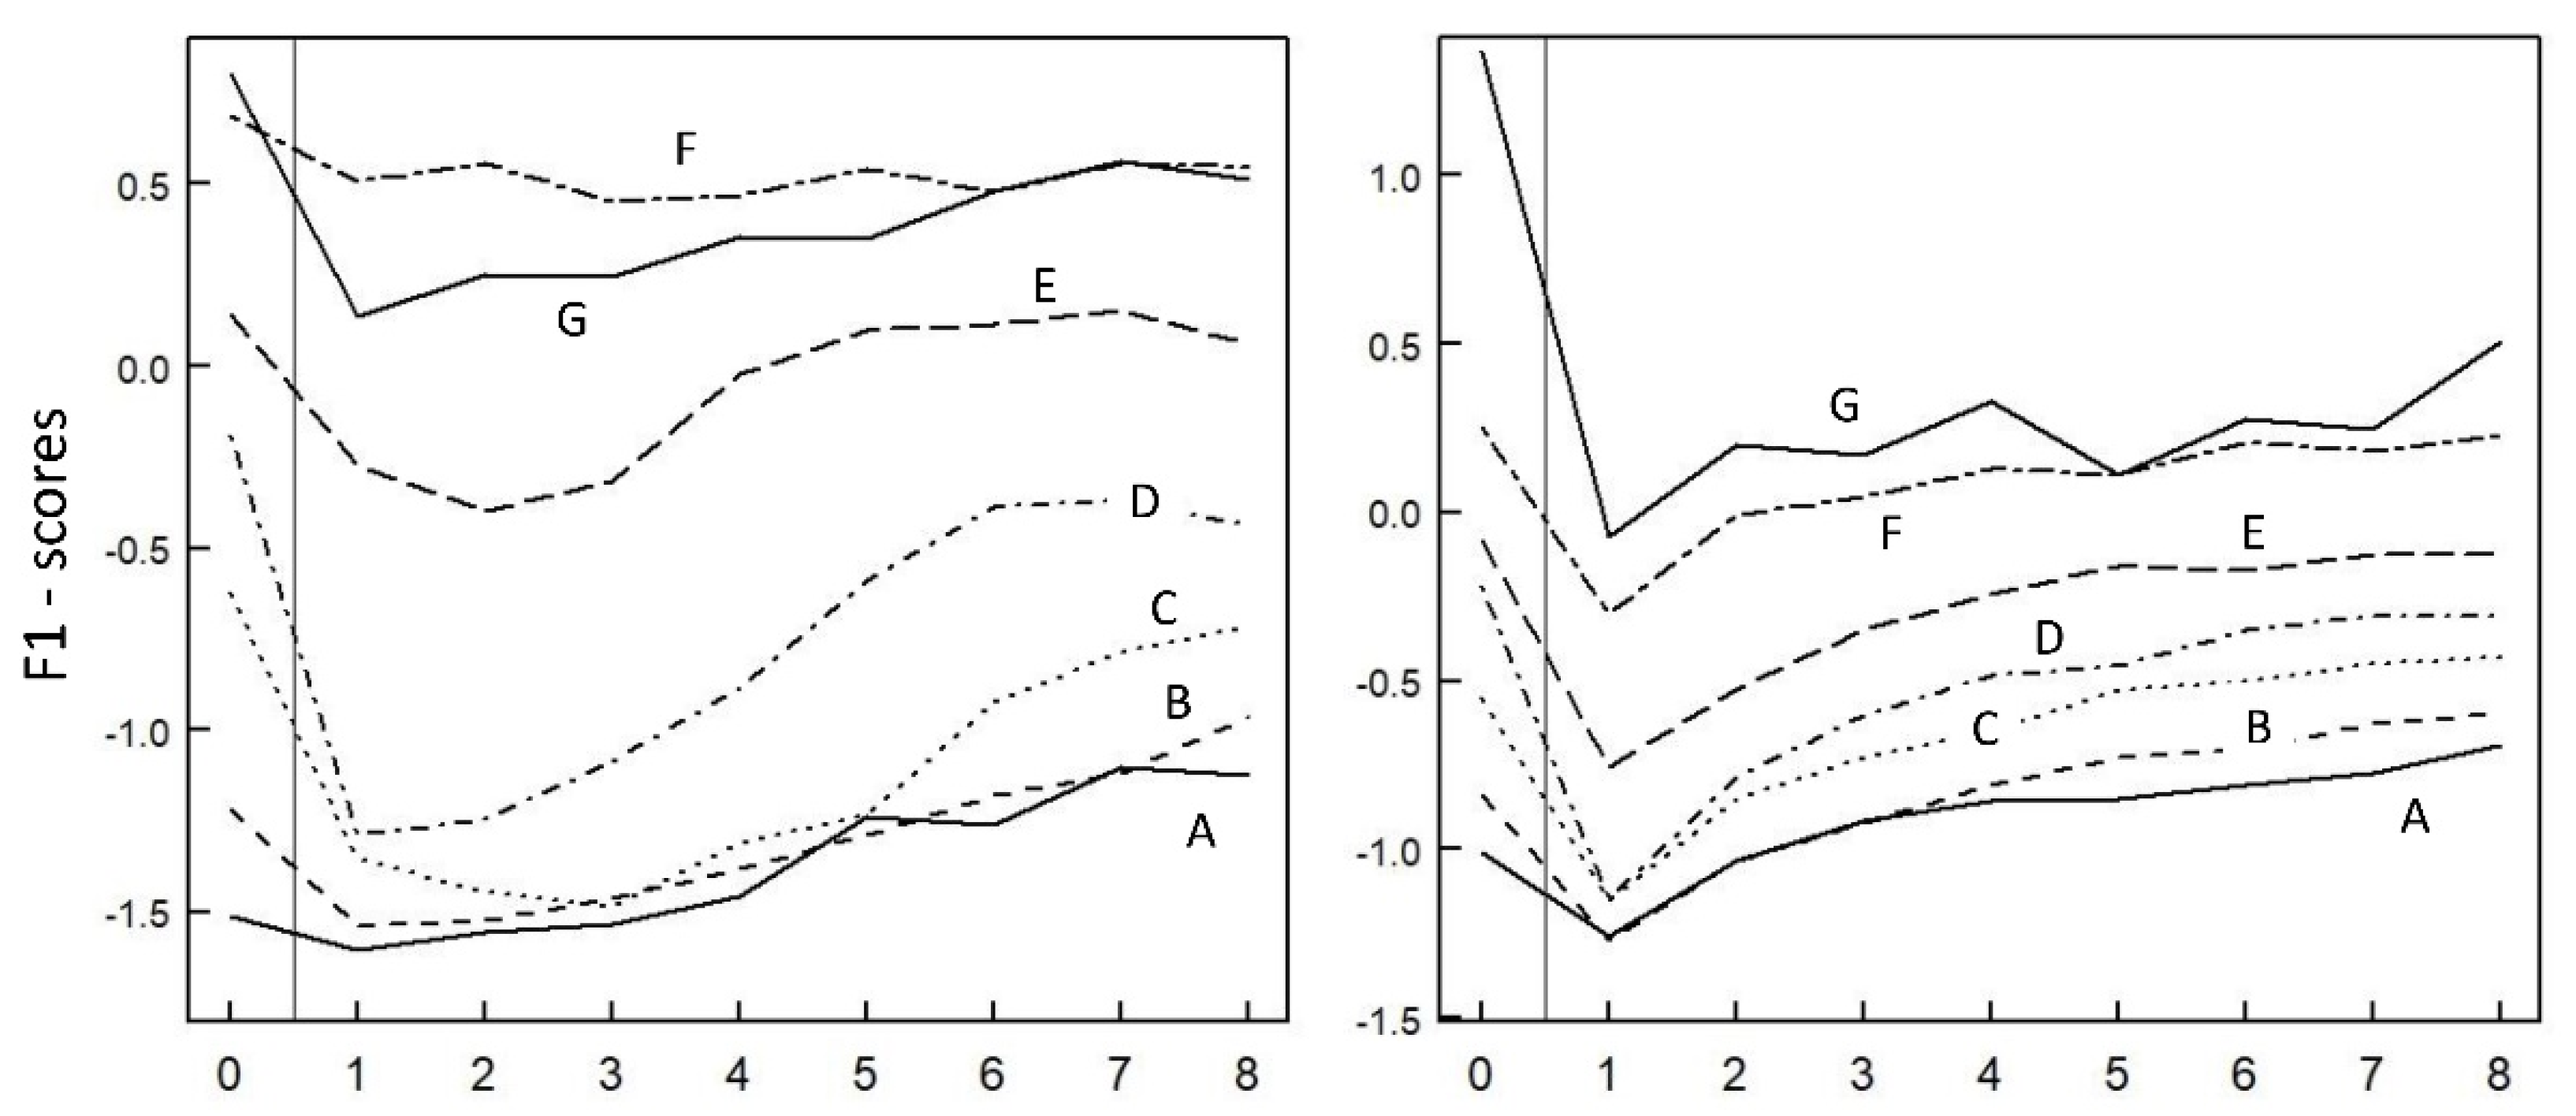
3.3. Postfire Trajectories of the Samples

In this three-dimensional space, the 154 postfire trajectories monitored at the station level merged, with few exceptions, into a common successional gradient, all fires, stations, controls and years included (Figure 5; see examples with selected stations in the next paragraph). This gradient was particularly well defined at its two extremities. It admitted more variants on the inside of the parabola, which contained the samples with species for which the scores on F1—and thus the habitat niches—are opposed (high diversity in the meaning of [54,55]). The greatest variability in trajectories, somewhat outside the main gradient on the F2 axis, was observed in the corresponding stations. This concerned mostly holm oak burns, where the proportions of open-habitat colonizers and site-tenacious forest birds may vary greatly from site to site. On the third axis, a sub-gradient characterized the postfire trajectories of the cork oak avifauna. On the fourth axis, initially distinct trajectories of rugged vs. less rugged stations quickly converged towards homogeneous shrubland avifauna (not shown).
All the stations (non-cultivated and non-urbanized) of the study area can be indexed on the first axis, which can be used as a common successional index. This axis summarizes the dynamics of the system and can account for the back-and-forth changes in avifauna in opposite directions: spontaneous and progressive grassland-to-forest succession (rightwards), regression to open-habitat avifauna as a result of fire (to the left), and postfire regeneration succession (rightwards again; see examples below).

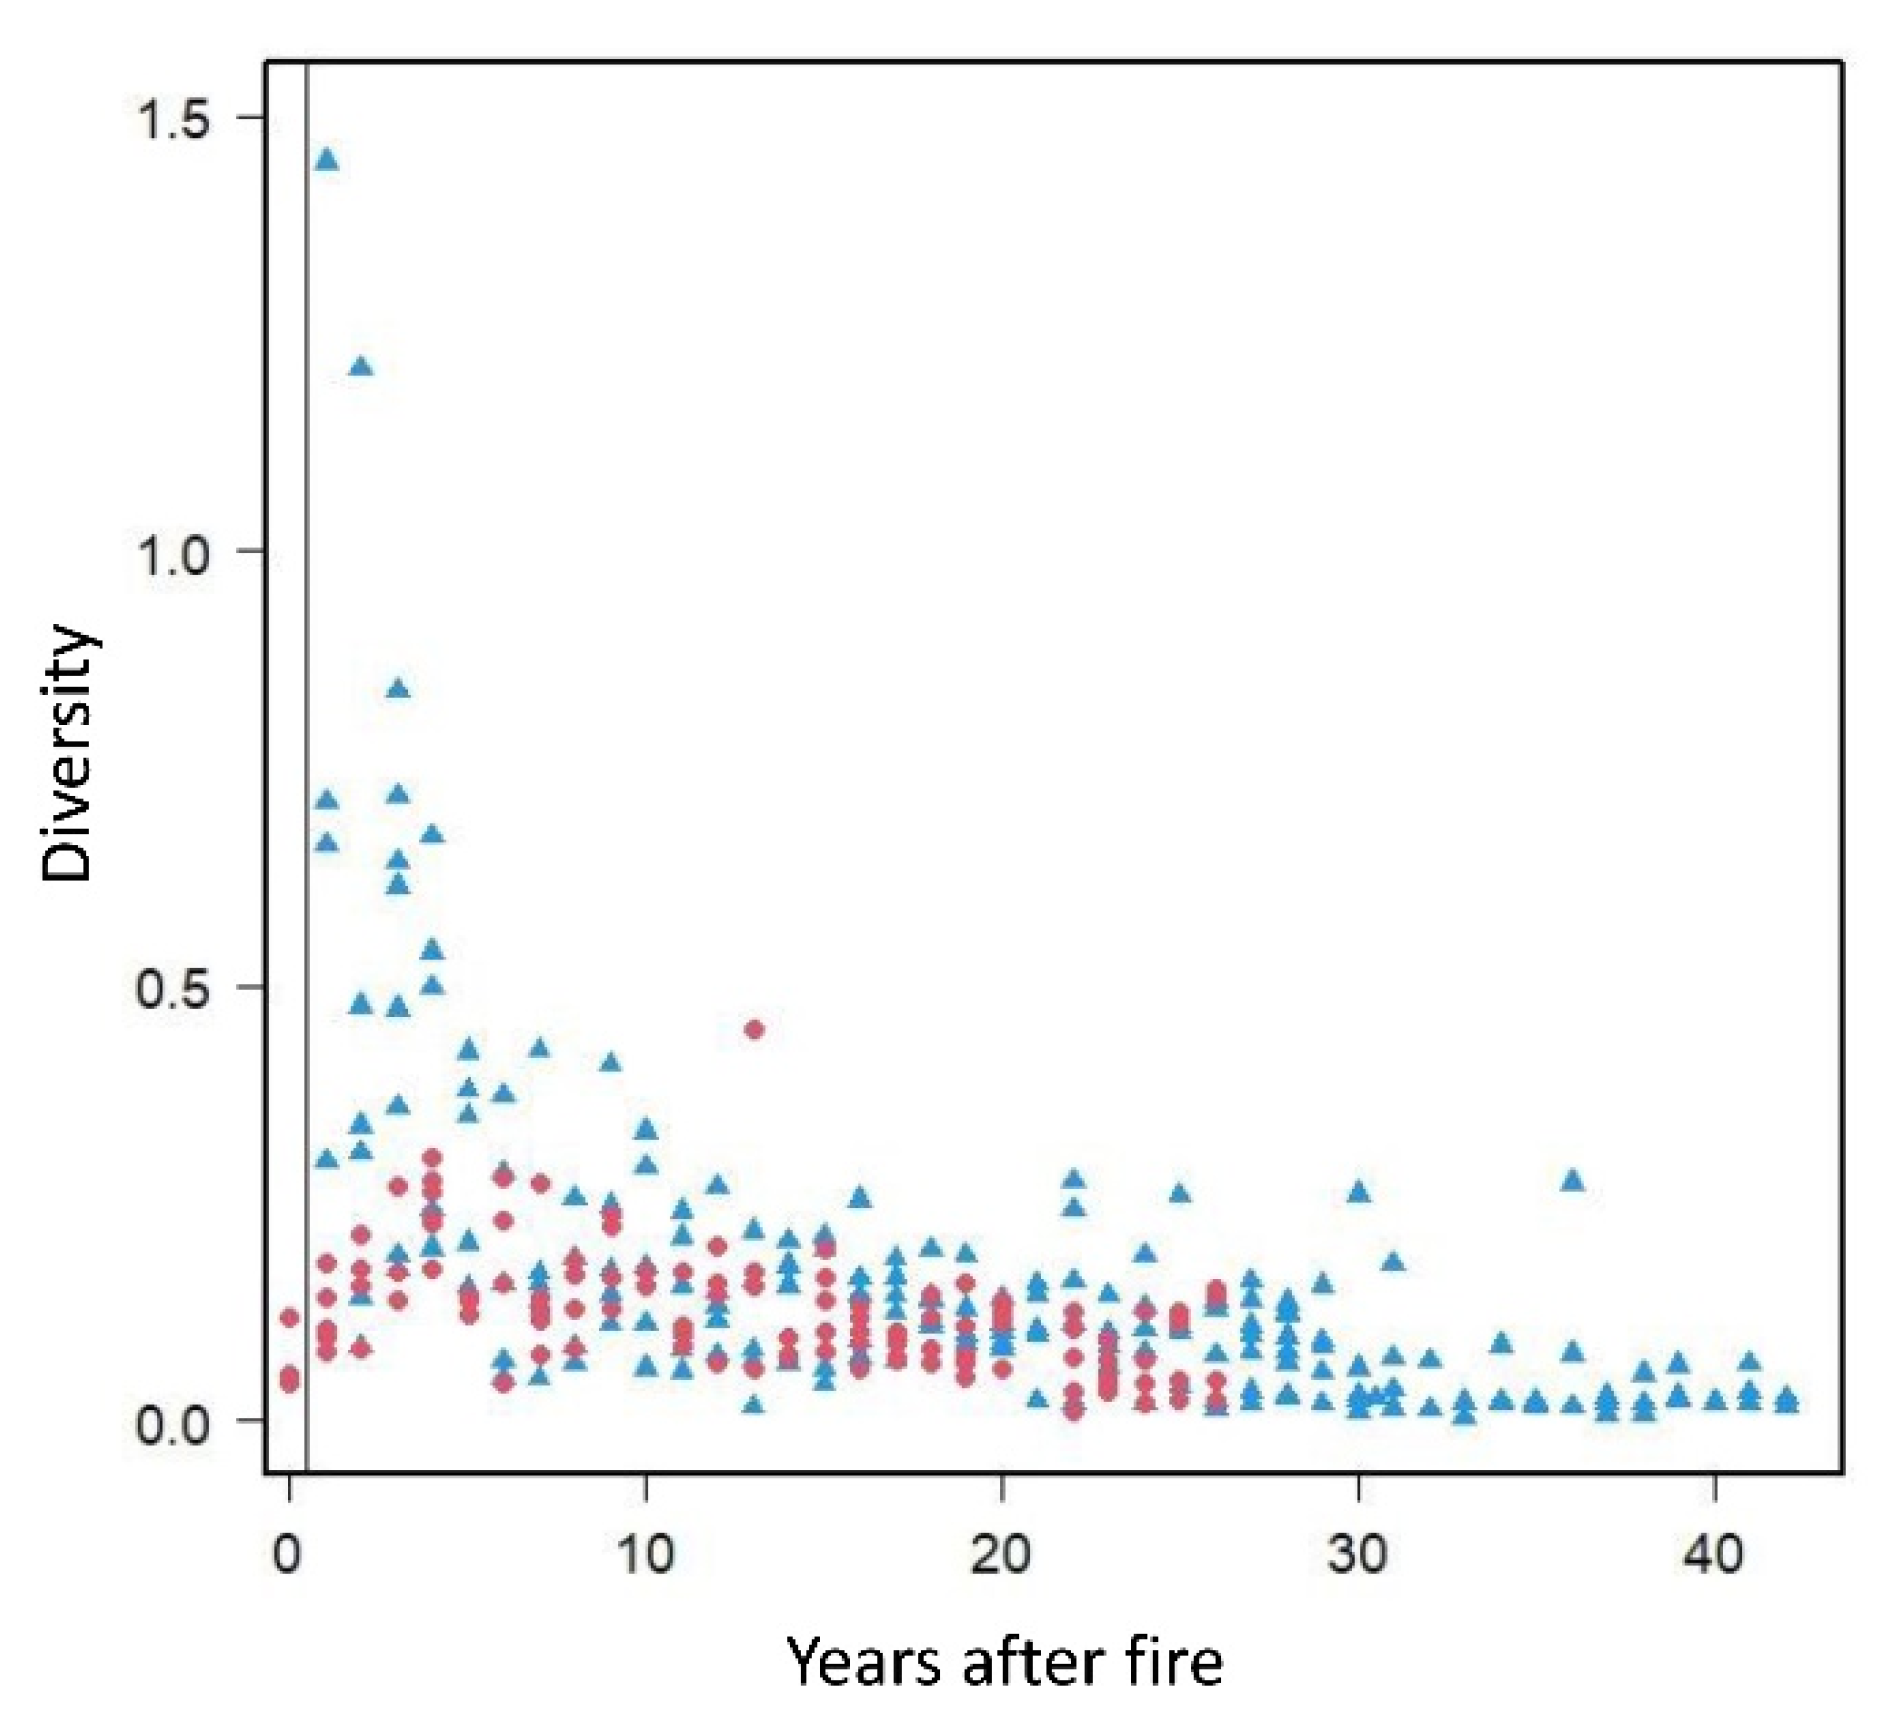
3.4. High Diversity in Recently Burned Forest Stations

In recently burned forest stations, colonizers of the open habitat coexisted with birds present before the fire that are site tenacious. This resulted in high diversity values in the sense defined above (variance in the species scores in a sample) (Figure 6). Immediately after a fire, this diversity increased suddenly, more in holm oak than in cork oak forests, as in the latter the percentage of open-habitat birds is lower. An example of this is a holm oak burn in a rugged area where Monticola saxatilis, Oenanthe hispanica and Fringilla coelebs coexisted briefly the first two years after the fire. These variations in diversity were not correlated with variations in the number of species. In non-forest habitats (classes A to D) and in the time interval of the first to eighth years after a fire, a linear model (F4,516, R2 = 0.013) showed weak additive effects of vegetation class (p = 0.03) and time since burn (p = 0.03, beta = −0.092) on the number of species. In the holm oak forests (classes E, F), the decrease is significant and more durable. (Figure A5).

3.5. Before–After Study

We also considered and illustrated a subset of the data restricted to the 71 stations sampled before a fire (on average three years before), and monitored yearly from the first to the eighth year after the fire.

3.5.1. Postfire Successional Pathways

In the first factorial plane of the CA (cf. Section 3.2.), the trajectories of the stations burned in the previous year showed a shift towards the pioneer extremity of the gradient (Figure 7a). This shift corresponded to the replacement of shrub-nesting birds by open-habitat species. The shift of the forest stations on the first axis was of lesser magnitude.
The species turnover in the sampling stations between the prefire survey and the first postfire survey, based on the Jaccard index, was largest in mid-successional heather maquis, where only 10% of the prefire species on average remained in place (Figure 8, right y-axis). This large change in species composition also concerned the ecological status of the species, as shown by the shift of the samples on the first three axes of the analysis (Figure 8, left y-axis). This shift reflected the almost complete replacement of shrub-nesting species by ground-nesting grassland species. The avifaunal shift was lower in cork oak forests (class F), and lower still near the grassland extremity of the gradient (class A).
The following eight years, the trajectories of the stations began their return towards the forest pole on the first axis. On the first factorial plane, the trajectories were directed towards the outside of the parabola, which corresponded to bird assemblages characteristic of dense, even-aged and homogeneous maquis (Figure 7b). The trajectories also tended to return to the prefire situation on the third and fourth axes. See Figure A6 for some examples of postfire trajectories in different vegetation types, for monitoring up to 42 years

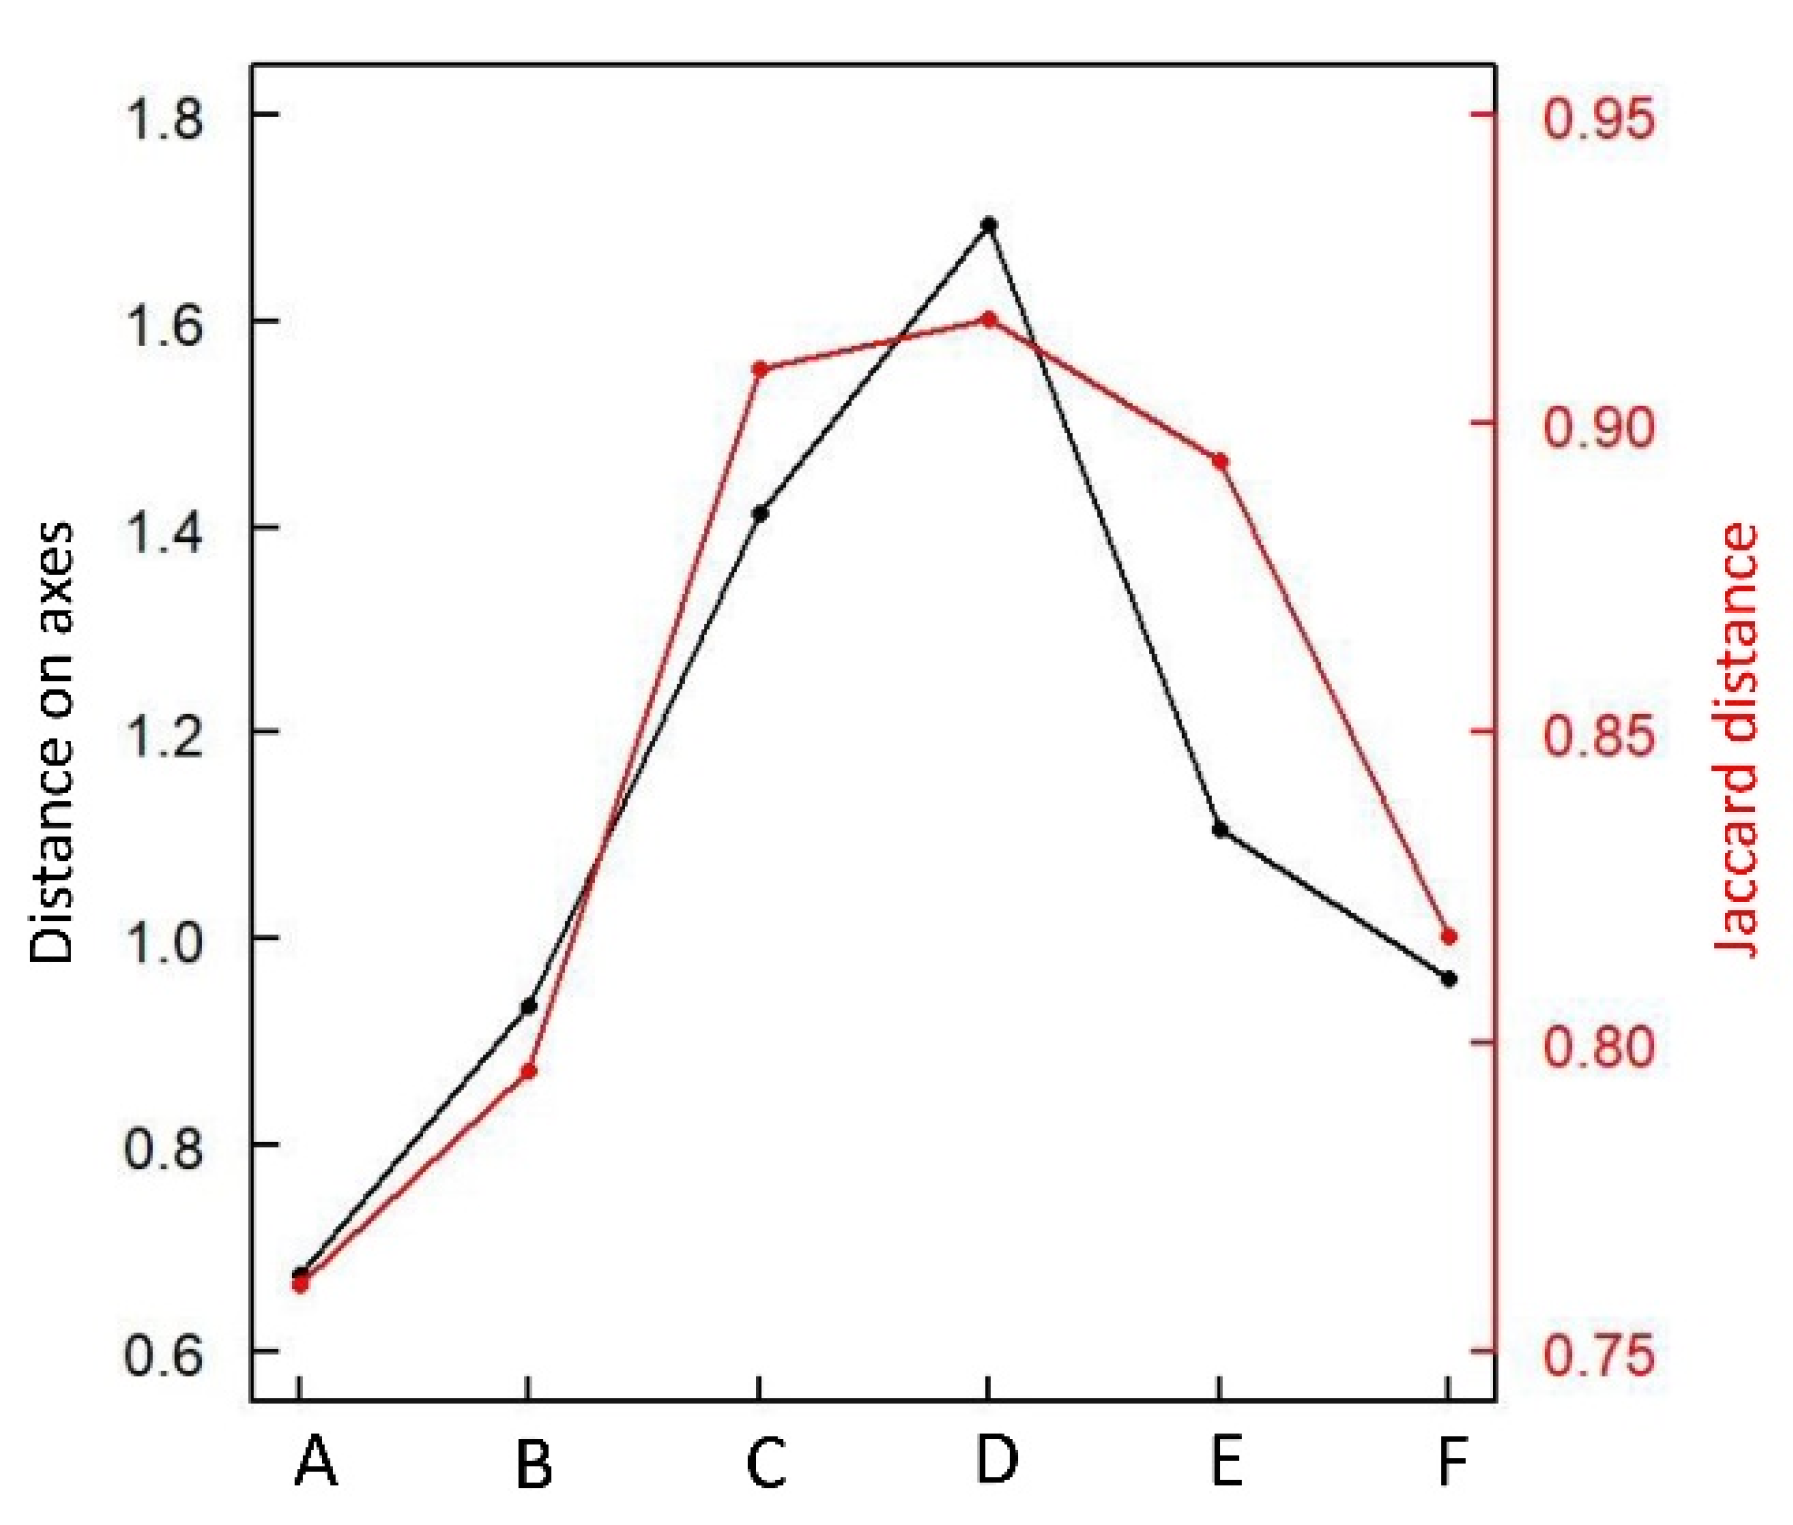
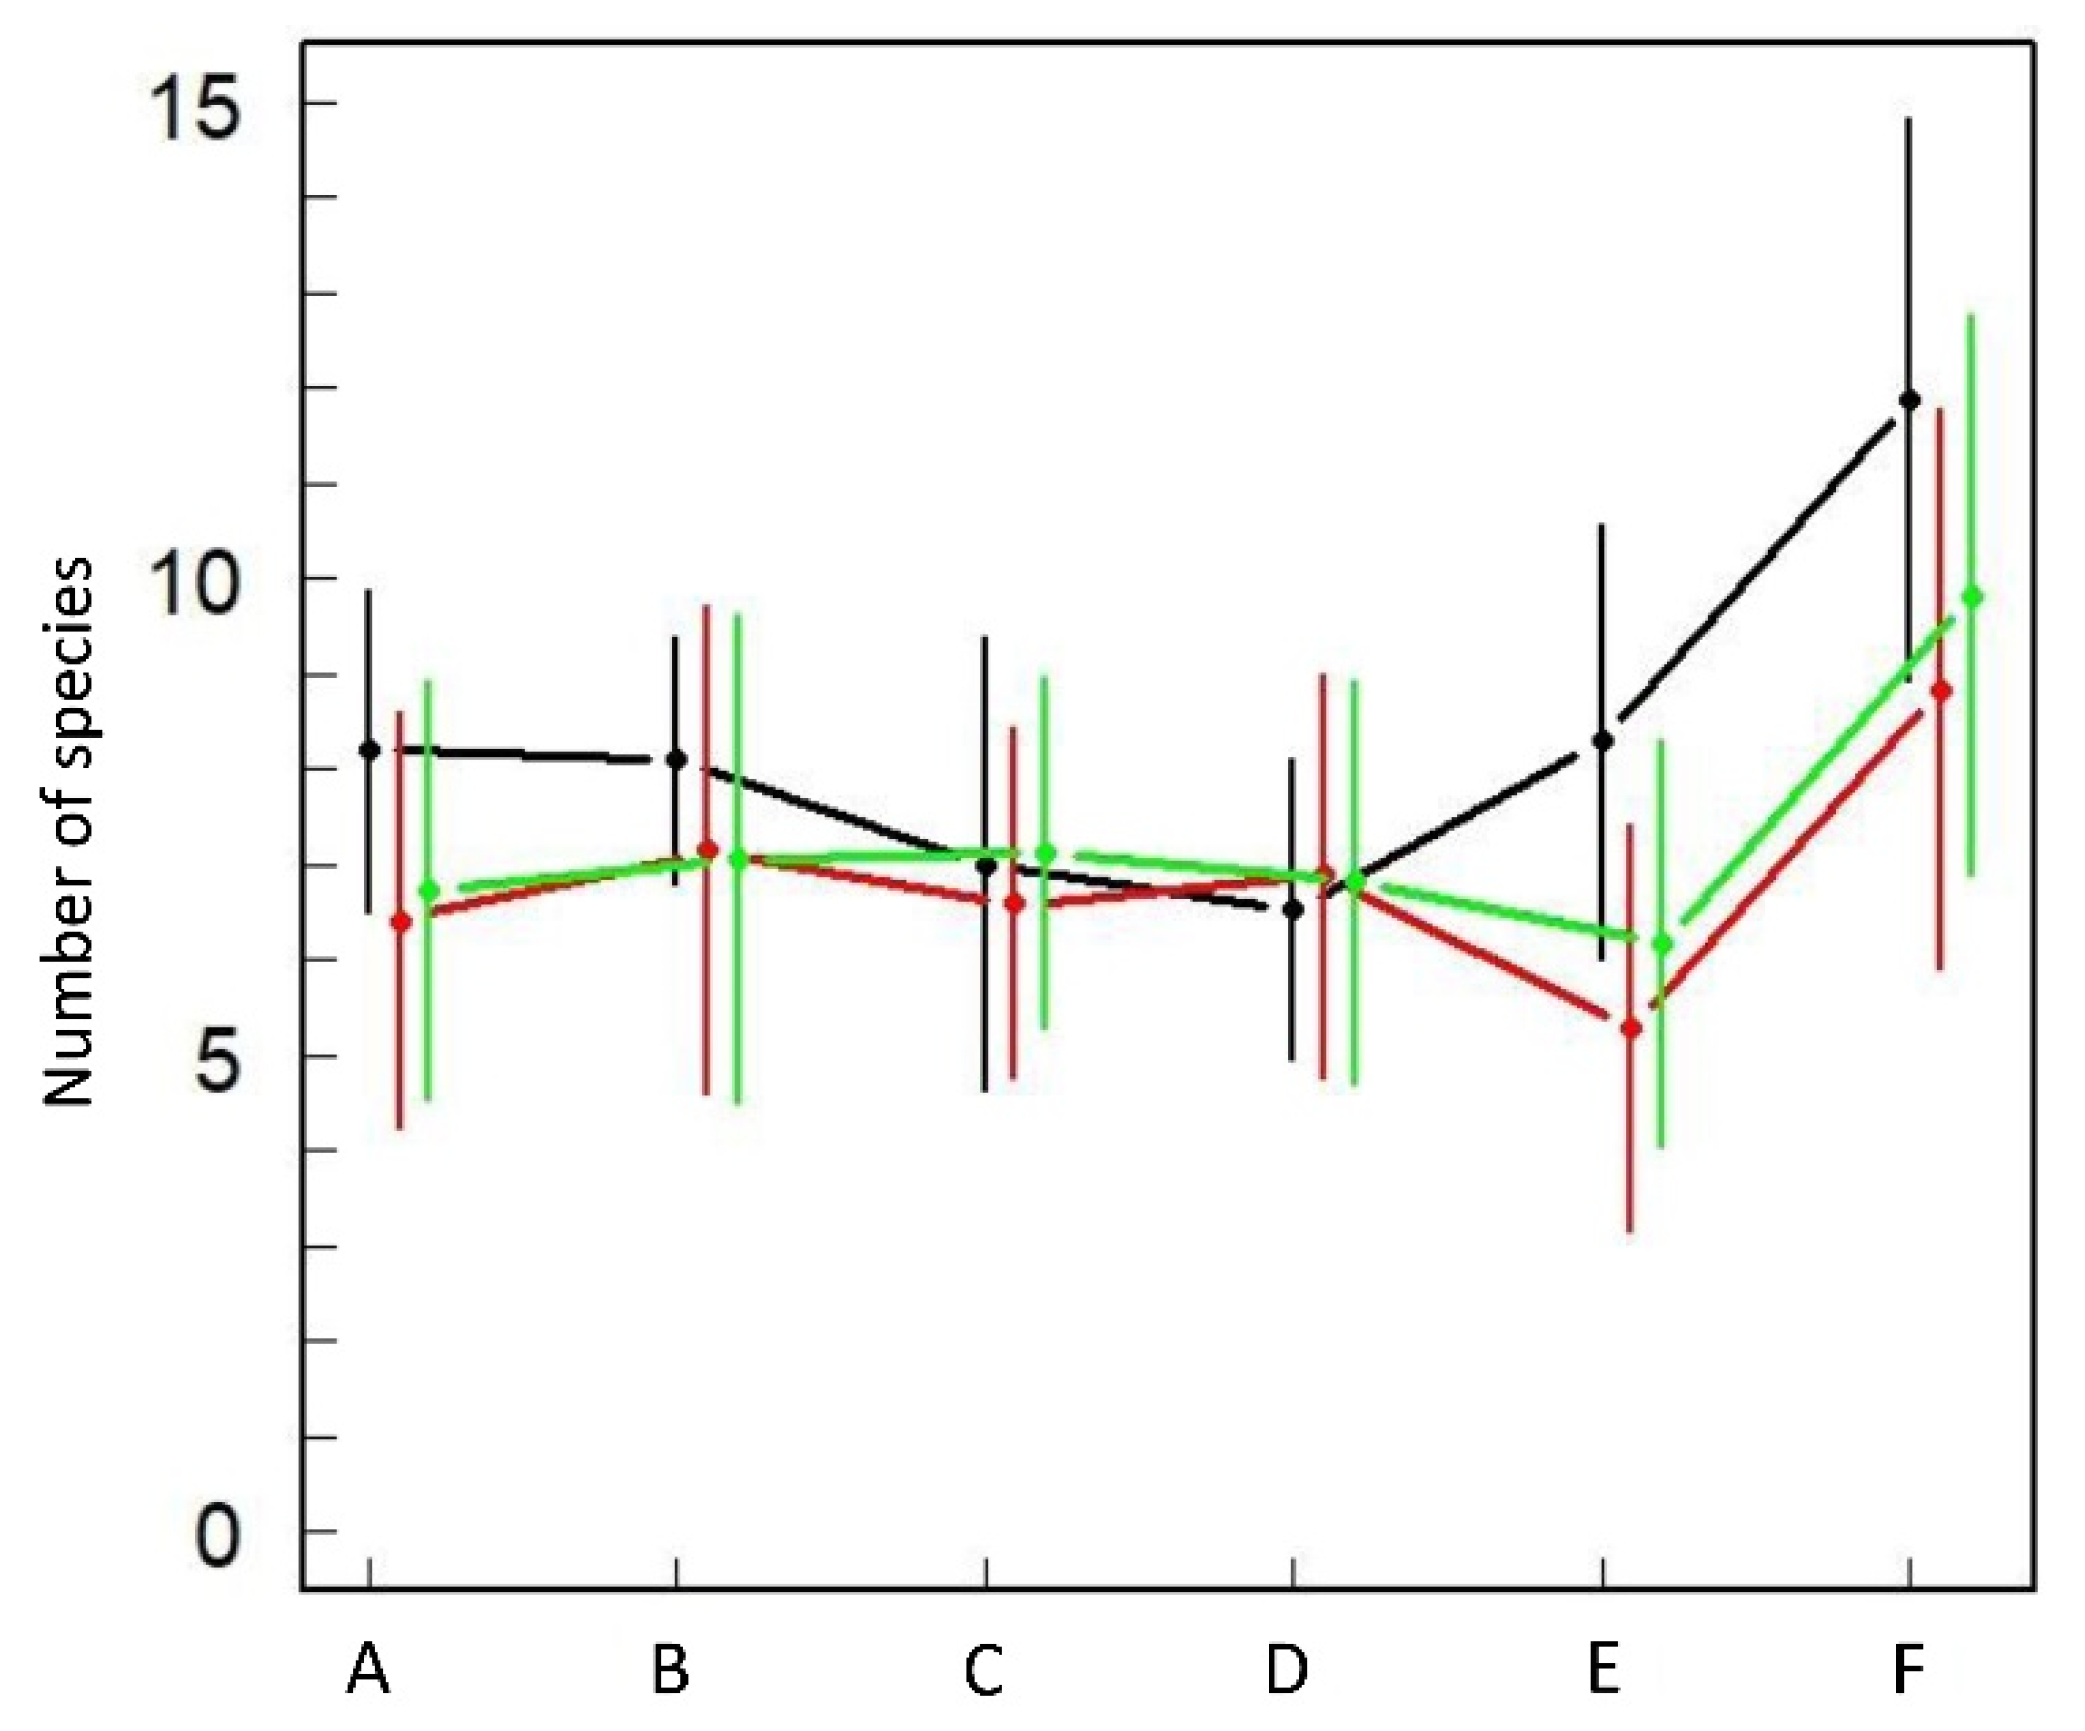
3.5.2. Avifaunal Shifts in the Seven Vegetation Types

The dynamics of the changes in avifauna in the different vegetation types during the first eight years following the fire can be summarized by the mean shifts in the corresponding stations on the first axis of the analysis (Figure 9, on left).
In the grasslands, a first small regressive shift (Figure 9, left, A) resulted from the disappearance of small scattered bushes after a fire. As soon as the third year after a fire, a shift in the other direction reflected not only the rapid recovery of avifauna, but the overshooting of the initial position due to the continuation of the successional process—colonization by bushes and the associated avifauna—rapid enough to have been recorded during the eight-year interval of the study.
In low and patchy scrub, the return time of the avifauna was about 5–6 years (Figure 9, left, B and C. In closed maquis, where the shift was maximal (Figure 7, left, D), the return time can be estimated at about 10–15 years, depending on the height of the maquis; unfortunately, our eight-year sequence did not permit any reliable extrapolation. In woodland, the shift was smaller (especially in cork oak forest; Figure 9, left, F) due to the persistence of a number of forest bird species, but the return time exceeded by far the decade and could not be estimated here.
In addition, and independently of the above analysis, the vegetation matrix (1821 lines × 8 cover variables) was also submitted to a CA (not shown). The analysis showed a strong first axis (49.5% of inertia) along which vegetation strata of increasing height followed one another: monotonic decreasing (cvR), unimodal (cv05, cv1, cv2), and monotonic increasing (cv4, cv8, cv16). Similar to the avifauna analysis, the shifts in the seven vegetation types on the main axis of this analysis were tracked for the first eight years after a fire. Contrary to what was observed for the avifauna, the dynamics of return to the prefire state seems rather parallel in the seven vegetation types; this is likely because this was driven in all cases by the regrowth speed of the plant species. The brutal regression of the vegetation structure in forest habitats (classes E, F, G; Figure 9, on the right) is not paralleled by a homologous regression of the avifauna (Figure 9 on the left), showing a mitigation of the effects of fire in the latter case.

4. Discussion

4.1. Return Time and Ratchet Effect

In our Mediterranean study area, the return time to the prefire vegetation and avifauna increases with the height and volume of the vegetation, from only 1–3 years for grasslands to about 15–20 years for cork oak forests [24] and at least 40 years for non-mature holm oak stands [37,57]. For heather maquis, we can provisionally estimate the return time at about 12–15 years. These relatively short return times, which contrast with others observed in more arid regions [21], are made possible by the relatively humid meso-Mediterranean climate of the region, and by a siliceous substrate rather favourable to vegetation. Within the eight years of our study, the recovery of grasslands and low maquis is sufficiently rapid that the pre-fire successional stages are exceeded (overcompensation [24]). In the medium term (on the order of a decade or two), the successions converge towards dense, even-aged, homogeneous maquis. Shrubland avifauna tends to become predominant in the postfire landscape, all the more so as the spontaneous encroachment of grassy areas by scrub continues [18].
Paradoxically, while the return time increases along the succession (with the exception of cork oak), the degree of change in avifauna immediately after a fire is maximal in mid-successional shrublands, not in forests [58]. It is minimal at both ends of the structural gradient, as shown by the two congruent measures of dissimilarity (Figure 8), even if the dissimilarity between pre- and postfire avifauna would have been greater in holm oak forest (not shown in Figure 8) than it was in cork oak forest. This faunal inertia is probably due to the phenomenon of site tenacity [59,60,61,62,63]. It is facilitated in grasslands as the passage of fire the previous year does not fundamentally modify the vegetation structure since the regrowth of the grass is rapid. In forests, the persistence of part of the vegetation structure —whether living or not—retains a part of the forest avifauna [52,58]. However, in the latter case, although postfire bird turnover is smaller, the return time is longer. The diversity in the sense defined above (variance in the species scores in a sample [54,55]) is a good estimator of the degree of mismatch between avifauna and habitat structure immediately after a fire in forest habitats.
The first postfire stages do not always correspond to the beginning of the structural gradient. They depend on the advancement of the plant succession before the fire; they differ from each other in the nature and quantity of the organs or structures accumulated over the years that ensure the regeneration of plants. The colonization of the landscape by plants that are very resilient to fire (e.g., the sprouters Erica and Quercus), as well as the replenishment of the seed bank by obligate seeders during intervals between fires (Cistus, Ulex), prevents any complete reset of woody formations to an open-habitat environment. This results in a ratchet effect that makes the progression towards forest avifauna ineluctable in the long term.

4.2. Three Modalities in the Postfire Successional Gradient

Depending on the type of vegetation affected by the fire, and in particular its successional stage, the pattern and mechanism of the bird succession differ; three parts can be distinguished:
In herbaceous habitats, the passage of fire does not substantially modify the composition of the avifauna. In low scrub up to and including Erica-dominated high maquis, the passage of fire results first in a return to a grassland-type avifauna; then the postfire successions reproduce the gradient of increasing plant height through shrub encroachment. These postfire successions can be considered faunistically homologous to those resulting from the spontaneous landscape dynamics (old-field succession), of which they appear an accelerated recapitulation [34].
Once trees have colonized the landscape, the postfire avifauna dynamics become different. Recent forest burns combine the presence of numerous burned trees and bare soil. This transitory structure has no equivalent in undisturbed landscapes. The persistence of snags (dead in the case of holm oak, alive in the case of cork oak) constitutes an obstacle that hinders the colonization of burned areas by many open-habitat species (e.g., crested larks, wheatears, pipits). On the other hand, this structure is favourable to bird species characteristic of heterogeneous habitats or ecotones (e.g., fringillids, buntings, shrikes) that benefit from the increased accessibility of certain resources (seeds, insects, access to the ground, perches, unobstructed views). A typical example is the wood lark Lullula arborea, which is more abundant in this type of habitat than in any other in the study area, and can be qualified as a pyrophilous colonizer.
In holm oak stands, a fraction of the forest avifauna manages to stay in place, coping with the dead canopy, so that few forest species disappear completely after a fire. As a result, the backwards shift in the succession towards open-habitat avifauna after a fire is only partial. Nevertheless, the return towards typical forest-type avifauna is slow.
In cork oak stands, the persistence of a part of the forest avifauna is naturally higher than in holm oak stands due to the rapid regeneration of a clear canopy, and the fire-caused shift is consequently lower (Figure 9). Recent cork oak burns are particularly suited to certain species (e.g., fringillids, woodlarks, buntings, shrikes, woodpeckers). The frequency of these species characterizes the postfire bird succession in cork oak forests compared to holm oak stands, resulting in a successional ‘sub-gradient’ that is a variant of the main successional gradient (Figure 5b) (see [24] for a detailed analysis of the effects of repeated fires on cork oak forests).

4.3. Variability and Convergence of Successional Pathways

In the Quercus-dominated vegetation of our study area—at least as far as birds are concerned—postfire or post-agricultural trajectories show relatively few divergent pathways. There are no pines in the study area, obligate seeders whose uncertain regeneration success introduces the possibility of branching off into alternative successional pathways [27,63]. While some heterogeneity is observed in the earliest stages of succession [22], depending on rock cover in our case, and in some burned forests—where the respective proportions of colonizer vs. site-tenacious bird species may vary from station to station—the convergence towards mid-successional bird communities is rapid [52].
The convergence of our samples at the forest end of the gradient in the multivariate space, reflected by decreasing beta diversity, shows that the landscape as a whole is tending towards a forest pole in which the avifauna is homogeneous. It also shows that postfire successions converge with old-field successions, from which they become indistinguishable. However the vegetation structure we currently observe at the forest extremity of our successional gradient is the result of dynamics of barely more than a century, and does not allow a prediction of the evolution of the system in the longer term. Whether cork oak, a heliophilous species with a clear canopy, can be maintained in the very long term without human intervention, or be spontaneously replaced by holm oak, remains unknown [64]. Moreover, the dense, closed, homogeneous holm oak stands that constitute the end of our structure gradient cannot be considered mature. They are likely to represent a transitional stage of low diversity towards a more heterogeneous mature forest in which broad-leaved oaks may play a role, and in which the avifauna may become more diverse [12,65].

5. Conclusions

Avifauna changes track changes in vegetation structure [13,15,66,67,68]. All successions, whether resulting from crop or pasture abandonment or from the regeneration of vegetation after a fire, tend to merge towards a forest pole according to a very deterministic pattern that admits relatively few variants (Figure 5). However, a major difference between the postfire successions and the post-abandonment successions is the faunal inertia of the former in their early and late stages. There is a time lag between the sudden modification of the habitat and the responses of the bird species [59], and thus in a temporary mismatch between the vegetation structure and the composition of the avifauna (Figure 9). This faunal inertia is made possible by the persistence of part of the prefire vegetation structure. It is minimal in the middle stages where, consequently, the faunal changes are the most drastic. Two behavioural mechanisms, site fidelity and habitat choice—together with the greater or lesser ability to disperse [69,70]—compete after fires so that the presence of species in burns cannot be explained only in terms of habitat selection.
The question of whether this inertia—which tends to mitigate the effects of fire on the avifauna—is solely due to the site fidelity of breeding adults, or is also extended in time by the philopatry of some young, remains open. This issue, and more generally the modalities and conditions of the site fidelity, would deserve to be studied more precisely with individually identified individuals [62], although it would be very difficult to perform severe experimental burns in forest environments.
Despite numerous fires (e.g., almost 10,000 ha burned on the French side of the Albera massif and about 25,000 ha on the Spanish side between 1978 and 1994), the landscape of our siliceous study area is closing and the forests are globally expanding. From a conservation point of view, the current closure of the landscape by woody vegetation is a threat to all open-habitat bird species, among which are a high proportion of species with high conservation value [18,70,71,72,73,74]. Controlled fire operations, combined with cattle breeding, could be used locally to maintain open space species by slowing the encroachment [75,76], but the improved control of fire risk by firefighters and more effective firefighting policy currently tend to further accelerate the trend towards afforestation. Whether this trend will continue in a context of severe warming and increasing fire frequency remains uncertain.

Funding

This research received no external funding.

Institutional Review Board Statement

Not applicable.

Informed Consent Statement

Not applicable.

Acknowledgments

This study was initiated within the framework of a research program of the Arago laboratory, Banyuls-sur-Mer (Paris-6 University, France).

Conflicts of Interest

The authors declare no conflict of interest.

Appendix A

Table A1. Scores of the bird species on the first axis of correspondence analysis of the birds × sample matrix.
Anthus campestris−1.8922Sylvia hortensis0.4283
Coturnix coturnix−1.7981Luscinia megarhynchos0.5714
Oenanthe leucura−1.7267Emberiza cirlus0.5825
Galerida theklae−1.7122Turdus merula0.6151
Oenanthe hispanica−1.6463Jynx torquilla0.6571
Sylvia conspicillata−1.6371Cuculus canorus0.6773
Monticola saxatilis−1.5935Picus viridis0.6852
Emberiza hortulana−1.5665Sylvia cantillans0.6853
Alectoris rufa−1.4619Oriolus oriolus0.6884
Emberiza calandra−1.3623Troglodytes troglodytes0.7019
Saxicola torquata−1.2745Streptopelia turtur0.7381
Monticola solitarius−1.2431Parus major0.7711
Emberiza cia−1.2066Clumba palumbus0.7828
Linaria cannabina−1.1591Fringilla coelebs0.7998
Sylvia communis−0.9809Aegithalos caudatus0.8138
Pica pica−0.8698Certhia brachydactyla0.8371
Carduelis carduelis−0.4995Lophophanes cristatus0.8420
Sylvia undata−0.3991Cyanistes caeruleus0.8622
Hippolais polyglotta−0.2333Garrulus glandarius0.8671
Lullula arborea−0.0780Sylvia borin0.8695
Lanius senator0.0609Sylvia atricapilla0.9142
Serinus serinus0.0902Phylloscopus bonelli0.9143
Upupa epops0.1227Regulus ignicapilla0.9174
Sylvia melanocephala0.1381Sitta europea0.9694
Chloris chloris0.3629Erithacus rubecula0.9879
Prunella modularis0.3957
Table A2. Eigenvalues of the four first axes of the correspondence analysis of the bird matrix, and correlation of the axes with the rock cover and the vegetation covers.
Axis 1Axis 2Axis 3Axis 4
Eigenvalue0.720.330.40.19
Inertia %13.96.44.63.6
cvR−0.680.17−0.160.30
cv025−0.46−0.56−0.25−0.08
cv050.26−0.72-−0.12
cv10.51−0.580.12−0.086
cv20.63−0.150.32-
cv40.730.380.27-
cv80.620.410.09-
cv160.320.26--
Figure A1. Map of the study area with fire contours corresponding to the 1967–2004 time interval, and some sampling stations. Compiled by Karine Jacquet from various sources [68].
Fire 05 00183 g0a1
Figure A2. Proportions of open habitats and forest habitats (as percentages of the study area) at three dates from 1953 to 1994. From Sébastien Tomas (unpublished results).
Fire 05 00183 g0a2
Figure A3. Number of samples (y-axis) as a function of the number of years since a fire (x-axis).
Fire 05 00183 g0a3
Figure A4. Mean cover values of the rock and three vegetation layers in seven classes (A to G) corresponding to a vegetation gradient (x-axis) and the first eight years after a fire (y-axis) (see Figure 1). Dashed line: the prefire gradient. The dimension of a square is normalized by the maximum cover of the layer considered.
Fire 05 00183 g0a4
Figure A5. Before/after change in species richness observed in six vegetation classes belonging to a grassland-to-woodland gradient (A to F), in unburned surveys (black curve) and burned surveys the first year (red) and the eighth year (green) after a fire.
Fire 05 00183 g0a5
Figure A6. Postfire trajectories of some study stations in the plane defined by the two first axes of correspondence analysis of the bird matrix. Each small black square corresponds to an annual survey (the maximum monitoring duration is specified). Large black squares: prefire surveys, red triangles: first postfire surveys, green diamonds: end of the chronosequences (the number of years is indicated). (a,b): low maquis, (c): Erica arborea and E. scoparia maquis, (d): holm oak stand, (e): cork oak stand, (f): repeated surveys in an unburned cork oak stand (blue) and a holm oak stand (green). The large black square in (d) corresponds to a nearby unburned control.
Fire 05 00183 g0a6

References

  1. Pickett, S.T.A.; White, P.S. (Eds.) The Ecology of Natural Disturbance and Patch Dynamics; Academic Press: Orlando, FL, USA, 1985; 472p. [Google Scholar]
  2. Moreira, F.; Viedma, O.; Arianoutsou, M.; Curt, T.; Koutsias, N.; Rigolot, E.; Bilgili, E. Landscape–wildfire interactions in southern Europe: Implications for landscape management. J. Environ. Manag. 2011, 92, 2389–2402. [Google Scholar] [CrossRef] [Green Version]
  3. Fernandes, P.M.; Monteiro-Henriques, T.; Guiomar, N.; Loureiro, C.; Barros, A.M. Bottom-up variables govern large-fire size in Portugal. Ecosystems 2016, 19, 1362–1375. [Google Scholar] [CrossRef]
  4. Ascoli, D.; Moris, J.V.; Marchetti, M.; Sallustio, L. Land use change towards forests and wooded land correlates with large and frequent wildfires in Italy. Ann. Silvic. Res. 2021, 46, 177–188. [Google Scholar]
  5. Van der Maarel, E. Vegetation dynamics: Pattern in time and space. Vegetatio 1988, 77, 7–19. [Google Scholar] [CrossRef]
  6. Tatoni, T.; Roche, P. Comparison of old-field and forest revegetation dynamics in Provence. J. Veg. Sci. 1994, 5, 295–302. [Google Scholar] [CrossRef]
  7. Perevolotsky, A.; Seligman, N.G. Role of grazing in Mediterranean rangeland ecosystems: Inversion of a paradigm. BioScience 1998, 48, 1007–1017. [Google Scholar] [CrossRef] [Green Version]
  8. Hobbs, R.J.; Walker, L.R. Old field succession: Development of concepts. In Old Fields: Dynamics and Restoration of Abandoned Farmland; Cramer, V.A., Hobbs, R.J., Eds.; Island Press: Washington, DC, USA, 2007; pp. 17–30. [Google Scholar]
  9. Pickett, S.T.A. Space-for-time substitutions as an alternative to long-term studies. In Long-Term Studies in Ecolog: Approaches and Alternatives; Likens, G.E., Ed.; Springer: New York, NY, USA, 1989; pp. 110–135. [Google Scholar]
  10. Pickett, S.T.A.; Collins, S.L.; Armesto, J.J. Models, mechanisms and pathways of succession. Bot. Rev. 1987, 53, 335–371. [Google Scholar] [CrossRef]
  11. Johson, E.A.; Miyanishi, K. Testing the assumption of chronosequences in succession. Ecol. Lett. 2008, 11, 419–431. [Google Scholar] [CrossRef]
  12. Walker, L.R.; Wardle, D.A.; Bardgett, R.D.; Clarkson, B.D. The use of chronosequences in studies of ecological succession and soil development. J. Ecol. 2010, 98, 725–736. [Google Scholar] [CrossRef]
  13. Prodon, R.; Lebreton, J.D. Breeding avifauna of a Mediterranean succession—The holm oak and cork oak series in the eastern Pyrenees, 1. Analysis and Modeling of the Structure Gradient. Oikos 1981, 37, 21–38. [Google Scholar] [CrossRef]
  14. Lanyon, W.E. Breeding birds and old-field succession on fallow Long Island farmland. Bull. Am. Mus. Nat. Hist. 1981, 168, 1–60. [Google Scholar]
  15. Bollinger, E.K. Successional changes and habitat selection in hayfield bird communities. Auk 1995, 112, 720–730. [Google Scholar]
  16. Preiss, E.; Martin, J.-L.; Debussche, M. Rural depopulation and recent landscape changes in a Mediterranean region: Consequences to the breeding avifauna. Landsc. Ecol. 1997, 12, 51–61. [Google Scholar] [CrossRef]
  17. Sirami, C.; Brotons, L.; Martin, J.-M. Vegetation and songbird response to land abandonment: From landscape to census plot. Div. Distrib. 2007, 13, 42–52. [Google Scholar] [CrossRef]
  18. Prodon, R. Consequences for avifauna of landscape encroachment by woody vegetation in northern Catalonia. Rev. Catalana d’Ornitol. 2020, 36, 1–9. [Google Scholar]
  19. Prodon, R.; Fons, R.; Athias-Binche, F. The impact of fire on animal communities in Mediterranean area. In The Role of Fire in Ecological Systems; Trabaud, L., Ed.; SPB Academic Publishing: The Hague, The Netherlands, 1987; pp. 121–157. [Google Scholar]
  20. Pons, P.; Prodon, R. Short-term temporal pattern in a Mediterranean shrubland bird community after wildfire. Acta Oecol. 1996, 17, 29–41. [Google Scholar]
  21. Herrando, S.; Brotons, L.; del Amo, R.; Llacuna, S. Bird community succession after fire in a dry Mediterranean shrubland. Ardea 2002, 90, 303–310. [Google Scholar]
  22. Herrando, S.; Brotons, L.; Llacuna, S. Does fire increase the spatial heterogeneity of bird communities in Mediterranean landscapes? Ibis 2003, 145, 307–317. [Google Scholar] [CrossRef]
  23. Pons, P.; Clavero, M.; Bas, J.M.; Prodon, R. Time-window of occurrence and vegetation cover preferences of Dartford and Sardinian Warblers after fire. J. Ornitol. 2012, 153, 921–930. [Google Scholar] [CrossRef] [Green Version]
  24. Prodon, R. Birds and the fire cycle in a resilient Mediterranean forest: Is there any baseline? Forests 2021, 12, 1644. [Google Scholar] [CrossRef]
  25. Moreira, F.; Ferreira, P.G.; Rego, F.C.; Bunting, S. Landscape changes and breeding bird assemblages in northwestern Portugal: The role of fire. Landsc. Ecol. 2001, 16, 175–187. [Google Scholar] [CrossRef]
  26. Moreira, F.; Russo, D. Modelling the impact of agricultural abandonment and wildfires on vertebrate diversity in Mediterranean Europe. Landsc. Ecol. 2007, 22, 1461–1476. [Google Scholar] [CrossRef]
  27. Zozaya, E.L.; Brotons, L.; Saura, S. Recent fire history and connectivity patterns determine bird species distribution dynamics in landscapes dominated by land abandonment. Landsc. Ecol. 2012, 27, 171–184. [Google Scholar] [CrossRef]
  28. Horn, H.S. Causes of variety in patterns of secondary successions. In Forest Succession: Concepts and Applications; West, D.C., Shugart, H.H., Botkin, D.B., Eds.; Springer: New York, NY, USA; Berlin/Heidelberg, Germany, 1981; pp. 24–35. [Google Scholar]
  29. Prach, K. Succession of vegetation in abandoned fields in Finland. Ann. Bot. Fenn. 1985, 22, 307–314. [Google Scholar]
  30. Blondel, J.; Farré, H. The convergent trajectories of bird communities along ecological successions in European forests. Oecologia 1988, 75, 83–93. [Google Scholar] [CrossRef]
  31. Hobson, K.A.; Schieck, J. Changes in bird communities in boreal mixed-wood forest: Harvest and wildfire effects over 30 years. Ecol. Appl. 1999, 9, 849–863. [Google Scholar] [CrossRef]
  32. Suárez-Seoane, S.; Osborne, P.E.; Baudry, J. Responses of birds of different biogeographic origins and habitat requirements to agricultural land abandonment in northern Spain. Biol. Conserv. 2002, 105, 333–344. [Google Scholar] [CrossRef]
  33. Del Moral, R.; Thomason, L.A.; Wenke, A.C.; Lozanoff, N.; Abata, M.D. Primary succession trajectories on pumice at Mount St. Helens, Washington. J. Veg. Sci. 2012, 23, 73–85. [Google Scholar] [CrossRef]
  34. McIntosh, R.P. The relationship between succession and the recovery process in ecosystems. In The Recovery Process in Damaged Ecosystems; Cairns, J., Jr., Ed.; Ann Arbor Sciences: Ann Arbor, MI, USA, 1980; pp. 11–62. [Google Scholar]
  35. Young, T.P.; Chase, J.M.; Huddleston, R.T. Community succession and assembly. Comparing, contrasting and combining paradigms in the context of ecological restoration. Ecol. Restor. 2001, 19, 5–18. [Google Scholar] [CrossRef]
  36. Damgaard, C. A Critique of the space-for-time substitution practice in community ecology. Trends Ecol. Evol. 2019, 34, 416–421. [Google Scholar] [CrossRef]
  37. Jacquet, K.; Prodon, R. Measuring the postfire resilience of a bird-vegetation system: A 28-year study in a Mediterranean oak woodland. Oecologia 2009, 161, 801–811. [Google Scholar] [CrossRef]
  38. Di Castri, F. Mediterranean-type shrublands of the world. In Ecosystems of the World 11: Mediterranean-Type Shrublands; Di Castri, F., Goodal, D.W., Specht, R.L., Eds.; Elsevier Publishing: Amsterdam, The Netherlands, 1981; pp. 1–52. [Google Scholar]
  39. Perelman, R. Perception of Mediterranean landscapes, particularly of maquis landscapes. In Ecosystems of the World 11: Mediterranean-Type Shrublands; Di Castri, F., Goodal, D.W., Specht, R.L., Eds.; Elsevier Publishing: Amsterdam, The Netherlands, 1981; pp. 538–554. [Google Scholar]
  40. French Environment and Energy Management Agency (ADEME); Météo-France. Changement Climatique au 20ème Siècle en Languedoc-Roussillon. Données et Références. 56p. Available online: https://occitanie.ademe.fr/mediatheque/autres-publications/energie-et-changement-climatique (accessed on 31 October 2022). (In French).
  41. Becat, J. Les Albères: Mutations économiques d’une montagne méditerranéenne: Montagne-providence du passé, montagne-paysage d’aujourd’hui. Conflent 1973, 61, 1–47. (In French) [Google Scholar]
  42. Debussche, M.; Lepart, J.; Dervieux, A. Mediterranean landscape changes: Evidence from old postcards. Glob. Ecol. Biogeogr. 1999, 8, 3–15. (In French) [Google Scholar] [CrossRef]
  43. Marty, P.; Aronson, J.; Lepart, J. Dynamics and restoration of abandoned farmland and other old fields in southern France. In Old Fields: Dynamics and Restoration of Abandoned Farmland; Cramer, V.A., Hobbs, R.J., Eds.; Island Press: Washington, DC, USA, 2007; pp. 202–224. [Google Scholar]
  44. Diamond, J. Laboratory experiments, field experiments, and natural experiments. In Community Ecology; Diamond, J., Case, T.J., Eds.; Harper and Row: New York, NY, USA, 1986; pp. 3–22. [Google Scholar]
  45. Fukami, T.; Wardle, D.A. Long-term ecological dynamics: Reciprocal insights from natural and anthropogenic gradients. Proc. R. Soc. B 2005, 272, 2105–2115. [Google Scholar] [CrossRef] [Green Version]
  46. Prodon, R.; Diaz-Delgado, R. Assessing the postfire resilience of a Mediterranean forest from satellite and ground data (NDVI, vegetation structure, avifauna). Écoscience 2021, 28, 81–91. [Google Scholar] [CrossRef]
  47. Austin, M.P. Use of ordination and other multivariate descriptive methods to study succession. Plant Ecol. 1977, 35, 165–175. [Google Scholar] [CrossRef]
  48. Malanson, G.P.; Trabaud, L. Ordination analysis of components of resilience of Quercus coccifera garrigue. Ecology 1987, 68, 463–472. [Google Scholar] [CrossRef]
  49. Halpern, C.B. Early successional pathways and the resistance and resilience of forest communities. Ecology 1988, 69, 1703–1715. [Google Scholar] [CrossRef]
  50. Prodon, R. Animal communities and vegetation dynamics: Measuring and modelling animal community dynamics along forest successions. In Responses of Forest Ecosystems to Environmental Changes; Teller, A., Mathy, P., Jeffers, J.N.R., Eds.; Elsevier: Amsterdam, The Netherlands, 1992; pp. 126–141. [Google Scholar]
  51. Debussche, M.; Escarré, J.; Lepart, J.; Houssard, C.; Lavorel, S. Changes in Mediterranean plant succession: Old-fields revisited. J. Veg. Sci. 1996, 7, 519–526. [Google Scholar] [CrossRef]
  52. Podani, J.; Csontos, P.; Tamás, J.; Miklós, I. A new multivariate approach to studying temporal changes of vegetation. Plant Ecol. 2005, 181, 85–100. [Google Scholar] [CrossRef]
  53. Saïd, S. Floristic and life-form diversity in post-pasture successions on a Mediterranean island (Corsica). Plant Ecol. 2001, 162, 67–76. [Google Scholar] [CrossRef]
  54. Chessel, D.; Lebreton, J.-D.; Prodon, R. Mesures symétriques d’amplitude d’habitat et de diversité intra-échantillon dans un tableau espèces-relevés: Cas d’un gradient simple. C. R. Acad. Sci. Paris D 1982, 295, 83–88. (In French) [Google Scholar]
  55. Thioulouse, J.; Chessel, D. A Method for Reciprocal Scaling of Species Tolerance and Sample Diversity. Ecology 1992, 73, 670–680. [Google Scholar] [CrossRef]
  56. Thioulouse, J.; Dray, S.; Dufour, A.-B.; Siberchicot, A.; Jombart, T.; Pavoine, S. Multivariate Analysis of Ecological Data with ade4; Springer: New York, USA, 2018; 329p. [Google Scholar]
  57. Jacquet, K. Biodiversité et Perturbations: Dynamique de L’avifaune Après Incendie et ses Relations Avec la Dynamique Végétale. Ph.D. Thesis, Université Montpellier-2, Montpellier, France, 10 November 2006. (In French). [Google Scholar]
  58. Barton, P.S.; Ikin, K.; Smith, A.L.; MacGregor, C.; Lindenmayer, D.B. Vegetation structure moderates the effect of fire on bird assemblages in a heterogeneous landscape. Landsc. Ecol. 2014, 29, 703–714. [Google Scholar] [CrossRef]
  59. Wiens, J.A.; Rotenberry, J.T. Response of breeding passerine birds to rangeland alteration in a North American shrubsteppe locality. J. Appl. Ecol. 1985, 22, 655–668. [Google Scholar] [CrossRef]
  60. Llimona, E.; Matheu, F.; Prodon, R. Role of standing snags and of tree regeneration in postfire bird succession: Comparison of pine and oak forests of Montserrat (Catalonia). In Fire in Mediterranean Ecosystems; Trabaud, L., Prodon, R., Eds.; Ecosystem Research Reports; ECSC-EEC-EAEC: Luxembourg, 1993; Volume 5, pp. 315–331. [Google Scholar]
  61. Hutto, R.L. Composition of bird communities following stand-replacement fires in northern Rocky Mountain (U.S.A.) conifer forests. Conserv. Biol. 1995, 9, 1041–1058. [Google Scholar] [CrossRef] [Green Version]
  62. Pons, P.; Henry, P.-Y.; Gargallo, G.; Prodon, R.; Lebreton, J.-D. Local survival after fire in Mediterranean shrublands: Combining capture-recapture data over several bird species. Popul. Ecol. 2003, 45, 187–196. [Google Scholar] [CrossRef]
  63. Lindenmayer, D.B.; Blanchard, W.; McBurney, L.; Blair, D.; Banks, S.C.; Driscoll, D.A.; Smith, A.L.; Gill, A.M. Complex responses of birds to landscape-level fire extent, fire severity and environmental drivers. Div. Distrib. 2014, 20, 467–477. [Google Scholar] [CrossRef]
  64. Santana, V.M.; Baeza, M.J.; Marrs, R.H.; Vallejo, V.R. Old-field secondary succession in SE Spain: Can fire divert it? Plant Ecol. 2010, 211, 337–349. [Google Scholar] [CrossRef]
  65. Petroselli, A.; Vessella, F.; Cavagnuolo, L.; Piovesan, G.; Schirone, B. Ecological behavior of Quercus suber and Quercus ilex inferred by topographic wetness index (TWI). Trees 2013, 27, 1201–1215. [Google Scholar] [CrossRef]
  66. Quézel, P.; Médail, F. Ecologie et Biogéographie des Forêts du Bassin Méditerranéen; Elsevier: Paris, France, 2003. (In French) [Google Scholar]
  67. MacMahon, J.A. Successional processes: Comparisons among biomes with special reference to probable roles of and influences on animals. In Forest Succession: Concepts and Applications; West, D.C., Shugart, H.H., Botkin, D.B., Eds.; Springer: New York, NY, USA; Berlin/Heidelberg, Germany, 1981; pp. 277–304. [Google Scholar]
  68. Raphael, M.G.; Morrison, M.L.; Yoder-Williams, M.P. Breeding bird populations during twenty-five years of postfire succession in the Sierra Nevada. Condor 1987, 89, 614–626. [Google Scholar] [CrossRef]
  69. Brotons, L.; Pons, P.; Herrando, S. Colonization of dynamic Mediterranean landscapes: Where do birds come from after fire. J. Biogeogr. 2005, 32, 789–798. [Google Scholar] [CrossRef]
  70. Brotons, L.; de Cáceres, M.; Fall, A.; Fortin, M.-J. Modeling bird species distribution change in fire prone Mediterranean landscapes: Incorporating species dispersal and landscape dynamics. Ecography 2012, 35, 458–467. [Google Scholar] [CrossRef]
  71. Prodon, R. Landscape dynamics and bird diversity in the north Mediterranean basin: Conservation issues. In Life and Environment in the Mediterranean; Trabaud, L., Ed.; WIT Press: Southampton, UK; Boston, MA, USA, 2000; pp. 261–299. [Google Scholar]
  72. Brawn, J.D.; Robinson, S.K.; Thompson, F.R., III. The role of disturbance in the ecology and conservation of birds. Annu. Rev. Ecol. Syst. 2001, 32, 251–276. [Google Scholar] [CrossRef] [Green Version]
  73. Clavero, M.; Brotons, L.; Herrando, S. Bird community specialization, bird conservation and disturbance: The role of wildfires. J. Anim. Ecol. 2011, 80, 128–136. [Google Scholar] [CrossRef]
  74. De Caceres, M.; Brotons, L.; Aquilué, N.; Fortin, M.-J. The combined effects of land-use legacies and novel fire regimes on bird distributions in the Mediterranean. J. Biogeogr. 2013, 40, 1535–1547. [Google Scholar] [CrossRef]
  75. Pons, P.; Lambert, B.; Rigolot, E.; Prodon, R. The effects of grassland management using fire on habitat occupancy and conservation of birds in a mosaic landscape. Biodiv. Conserv. 2003, 12, 1843–1860. [Google Scholar] [CrossRef]
  76. Pérez-Granados, C.; Serrano-Davies, E.; Noguerales, V. Returning home after fire: How fire can help us manage the persistence of scrub-steppe specialist bird population. Biodiv. Conserv. 2018, 27, 3087–3102. [Google Scholar] [CrossRef]
Figure 1. A holm oak stand (class G) before fire (top left), immediately after fire (top middle) and 2 to 33 years after fire.
Fire 05 00183 g001
Figure 2. Diagram of the sampling design: sampling stations were selected in seven vegetation classes in a unburned grassland-to-woodland gradient (x-axis), then monitored for eight years after a fire (y-axis). (A)—grasslands, with scattered scrub; (B)—low and patchy scrub; (C)—low maquis; (D)—closed heather maquis; (E)—maquis with scattered oaks (holm oaks or cork oaks); (F)—clear and open cork oak forest; (G)—closed and dense holm oak forest.
Fire 05 00183 g002
Figure 3. Mean occurrence frequency in 20-mn point counts of twelve common bird species in seven classes corresponding to a vegetation gradient from grasslands (A) to closed forests (G) (x-axis), and the first eight years after a fire (y-axis). Dashed line: the prefire gradient. (see Figure 2 for an illustration of the sampling design) The dimension of a square is normalized by the maximum frequency of the species considered.
Fire 05 00183 g003
Figure 4. Ordination of bird species on the two first planes of the correspondence analysis, and the histogram of the eigenvalues. Only the names of the most contributing and/or common species are given. The corresponding scores of the bird species on the first axis (horizontal) are given on Table A1.
Fire 05 00183 g004
Figure 5. (a,b). Envelope of the 154 postfire trajectories (including repeated fires on a same station) of the sampling stations on the two first planes of the correspondence analysis of the bird matrix (F1–F2 and F1–F3, respectively); (c,d) Indices of foliage volume in the corresponding samples.
Fire 05 00183 g005
Figure 6. Alpha diversity (conditional within-sample variance on the first CA axis) as a function of time since burn in holm oak samples (blue triangles) and in cork oak samples (red dots).
Fire 05 00183 g006
Figure 7. (a) Shifts of 71 sampling stations from their prefire positions (black dots) to their positions the first spring after a fire (arrowheads) on the first plane F1-F2 of the correspondence analysis of the bird matrix; (b) Shift of the stations from their positions the first spring after a fire (black dots) to their positions the eighth spring after a fire (arrowheads); (c,d) Idem on the plane defined by the first and third axes F1-F3 of the analysis. Repeated fires were not taken into account.
Fire 05 00183 g007
Figure 8. Mean dissimilarities between the prefire and postfire bird assemblages in samples belonging to a grassland-to-forest gradient (vegetation types A to F; see Figure 2). The dissimilarities were measured between the prefire and the first postfire samples either by Jaccard distance (in red), or by the sum of the distances on the first three axes of the correspondence analysis (in black). Repeated fires were not taken into account.
Fire 05 00183 g008
Figure 9. (left). Recovery rate of the avifauna after fire in seven vegetation types (from grassland (A) to cork oak (F) and holm oak forests (G); see Figure 2, measured by the mean shifts of samples on the first axis of the correspondence analysis of the bird matrix (y−axis). X−axis: years after fire; the abscissa 0 corresponds to the prefire situation. (Right) Recovery rate of the vegetation, based on the correspondence analysis of the vegetation cover matrix. In class G, not sampled before the fire, the prefire values are those of controls.
Fire 05 00183 g009
Publisher’s Note: MDPI stays neutral with regard to jurisdictional claims in published maps and institutional affiliations.

