
Fuel in Tasmanian Dry Eucalypt Forests: Prediction of Fuel Load and Fuel Hazard Rating from Fuel Age

Abstract
:1. Introduction
1.1. Paper Aims and Background
- To develop fuel load and fuel hazard rating (FHR) models based on the time since the last fire (i.e., fuel accumulation models);
- To test, under Tasmanian conditions, the “Overall fuel hazard assessment guide” from Victoria, Australia [14].
1.2. Fuel Load Assessment
1.3. Fuel Hazard Rating Assessment
2. Methodology
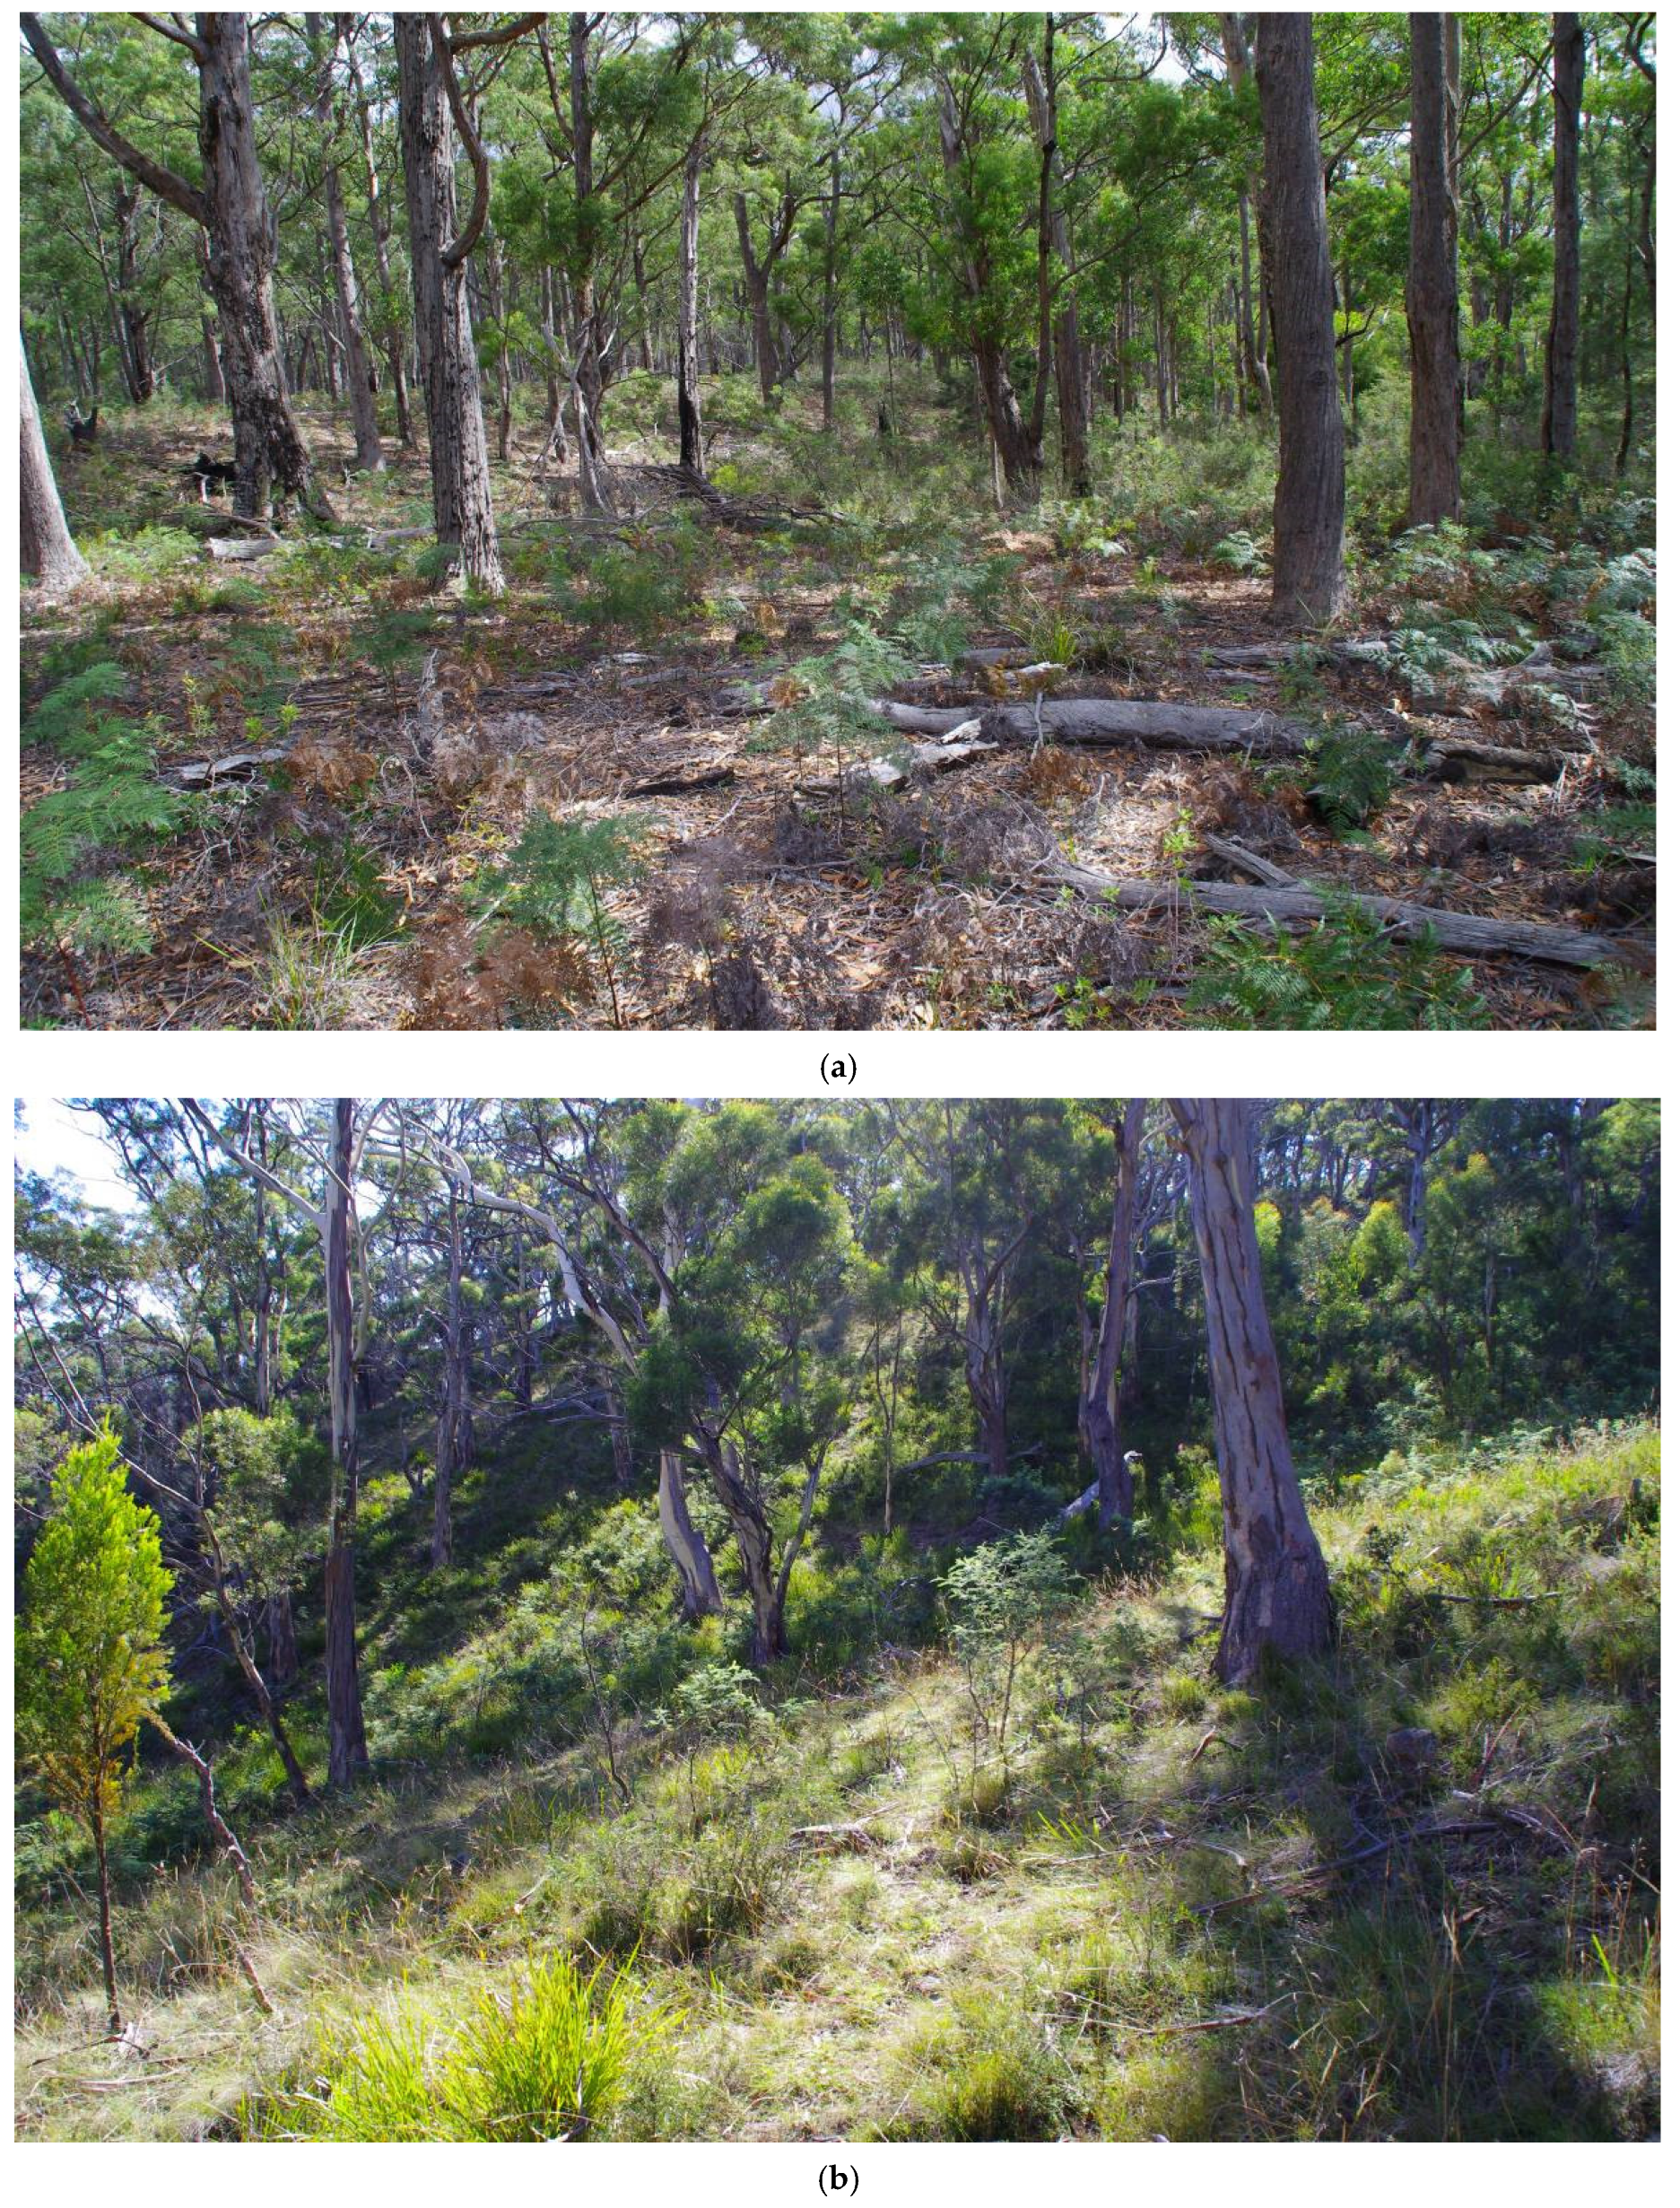
2.1. Study Sites
2.2. Fuel Load Data Collection
2.3. Fuel Hazard Rating Data Collection
“choices for the hazard rating of fuels that fit across several descriptors may be informed by the effect that different levels of attributes have on fire behaviour”.
2.4. Statistical Analysis
3. Results
3.1. Fuel Load Results
3.1.1. Combined Surface and Near Surface Fuel Load
3.1.2. Elevated Fuel Load
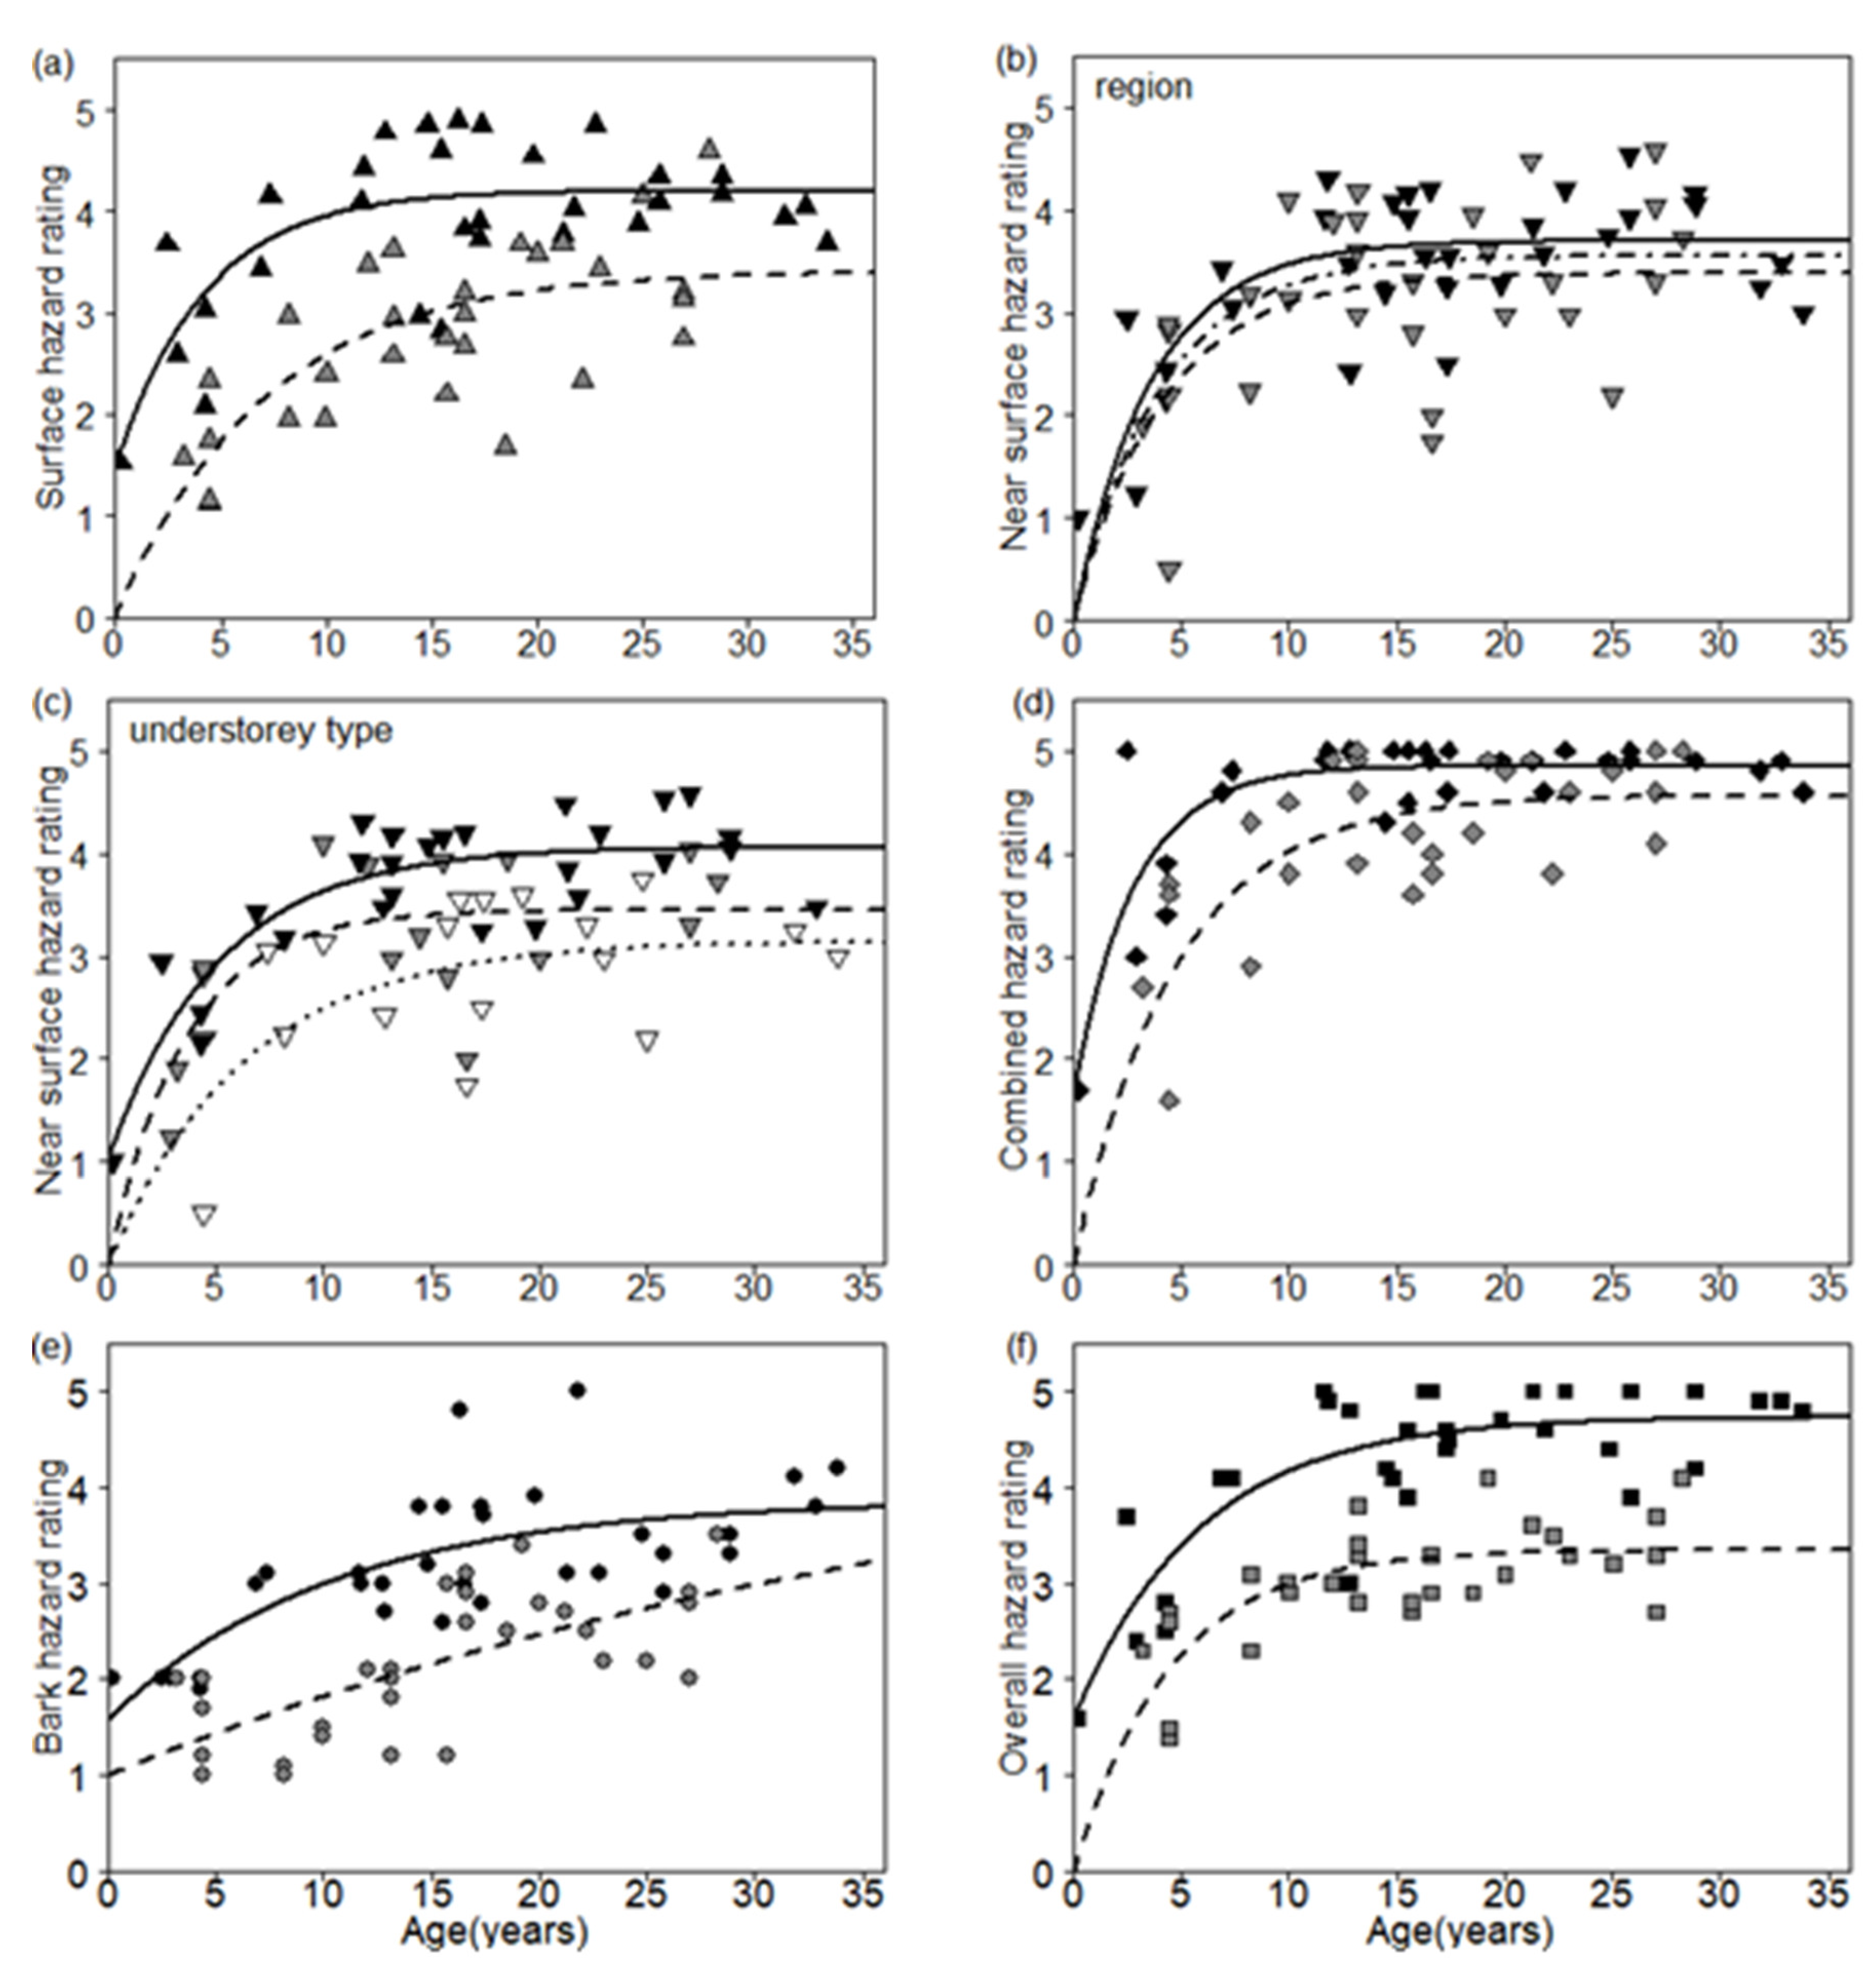
3.2. Fuel Hazard Rating Results
3.2.1. Fuel Hazard Rating Models
3.2.2. Surface Fuel Hazard Rating
3.2.3. Near-Surface Fuel Hazard Rating and Height
3.2.4. Combined Surface and Near-Surface Fuel Hazard Rating
3.2.5. Elevated Fuel Hazard Rating and Height
3.2.6. Average Near-Surface/Elevated Height
3.2.7. Bark Fuel Hazard Rating
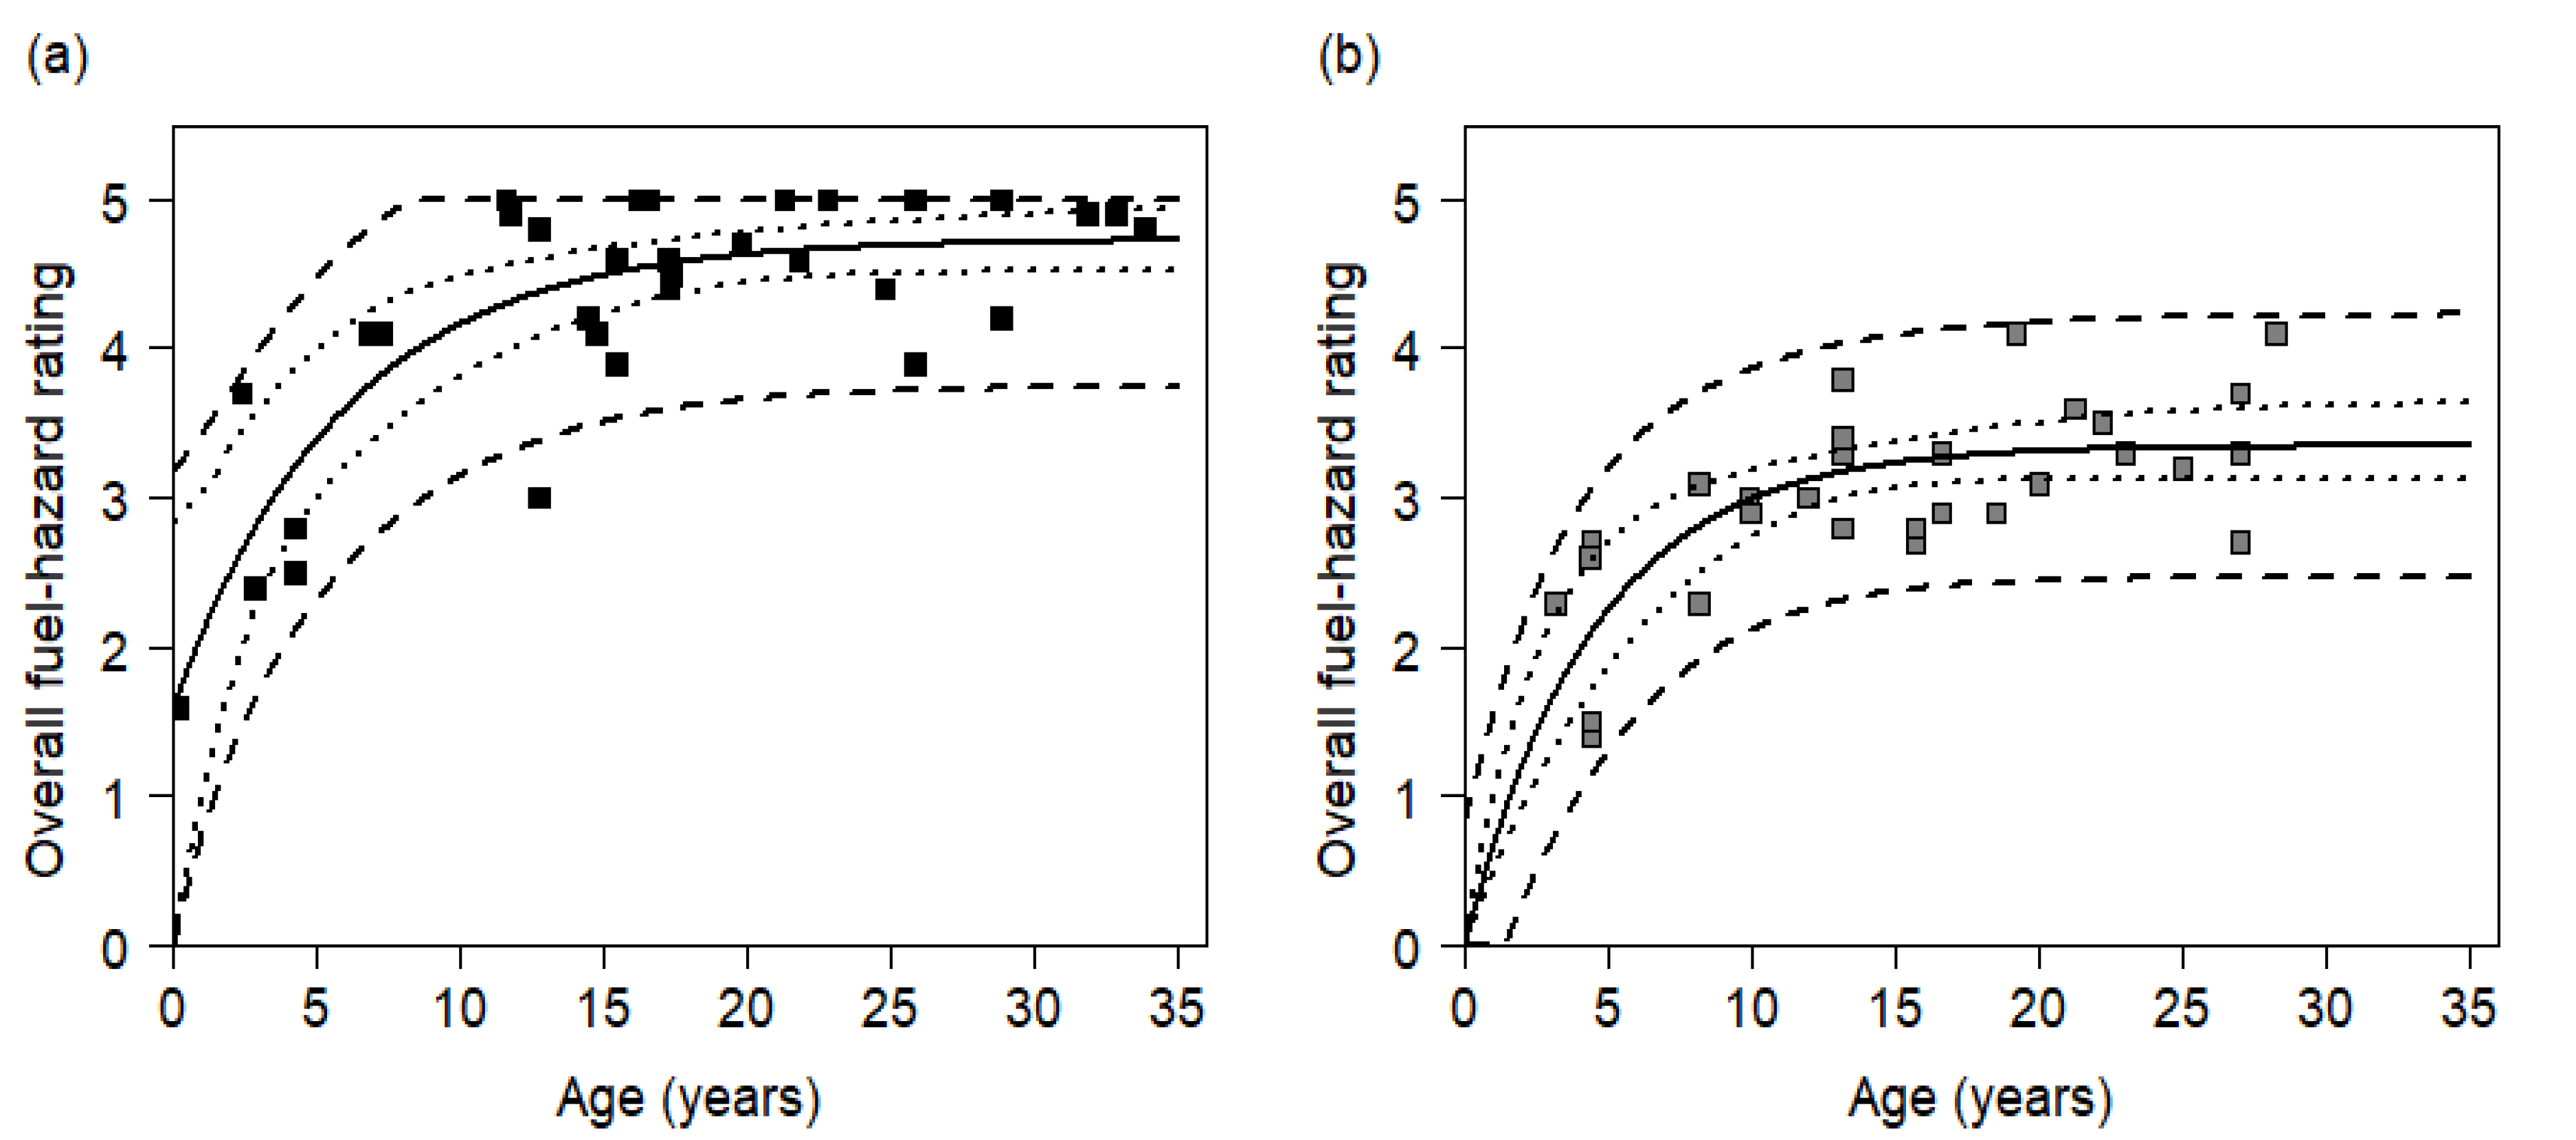
3.2.8. Overall Fuel Hazard Rating
4. Discussion
4.1. Fuel Load
4.2. Near-Surface and Elevated Fuel Height
4.3. Fuel Hazard Rating
5. Conclusions
Author Contributions
Funding
Institutional Review Board Statement
Informed Consent Statement
Data Availability Statement
Acknowledgments
Conflicts of Interest
Appendix A

| Site | Vegetation Type | Bark | Alt | Asp | Slope | Geo | Site | Vegetation Type | Bark | Alt | Asp | Slope | Geo | ||
|---|---|---|---|---|---|---|---|---|---|---|---|---|---|---|---|
| 1-NE | E.amyg | Gr | F | 130 | 100 | 8 | Dg | 69-SE | A.vert | Gr | O | 155 | 1 | 3 | Jd |
| 2-NE | E.amyg | Bk | F | 120 | 180 | 8 | Dg | 70-SE | E.glob | Lt | C | 80 | 1 | 1 | Ts |
| 3-NE | E.amyg | Hh | F | 120 | 85 | 1 | Dg | 71-SE | E.glob | Gr | C | 300 | 2 | 3 | Jd |
| 4-NE | E.amyg | Bk | F | 70 | 140 | 2 | Dg | 72-SE | E.glob | Gr | C | 430 | 1 | 2 | Jd |
| 5-NE | E.amyg | Lt | F | 80 | 350 | 1 | Dg | 73-SE | E.glob | Hh | C | 110 | 4 | 3 | Ts |
| 6-NE | E.amyg | Hh | F | 100 | 200 | 7 | Dg | 74-SE | E.glob | Lt | C | 430 | 2 | 1 | Jd |
| 7-NE | E.amyg | Bk | F | 110 | 330 | 3 | Dg | 75-SE | E.glob | Gr | C | 395 | 1 | 3 | Jd |
| 8-NE | E.amyg | Gr | F | 60 | 270 | 1 | Dg | 76-SE | E.glob | Gr | C | 150 | 3 | 1 | Ts |
| 9-NE | E.amyg | Lt | F | 80 | 65 | 3 | Dg | 77-SE | E.glob | Lt | C | 120 | 3 | 3 | Ts |
| 10-NE | E.amyg | Hh | F | 80 | 95 | 1 | Dg | 78-SE | E.glob | Gr | C | 235 | 3 | 3 | Jd |
| 11-NE | E.amyg | Bk | F | 30 | 120 | 5 | Dg | 79-SE | E.glob | Gr | C | 210 | 3 | 3 | Jd |
| 12-NE | E.amyg | Bk | F | 150 | 270 | 5 | Dg | 80-SE | E.amyg | Gr | F | 180 | 4 | 3 | Ts |
| 13-NE | E.amyg | Hh | F | 120 | 125 | 8 | Dg | 81-SE | E.amyg | Gr | F | 110 | 4 | 1 | Ts |
| 14-NE | E.amyg | Bk | F | 100 | 295 | 10 | Dg | 82-SE | E.amyg | Gr | F | 215 | 3 | 3 | Ts |
| 15-NE | E.amyg | Bk | F | 110 | 280 | 5 | Dg | 83-SE | E.amyg | Gr | F | 310 | 2 | 3 | Ts |
| 16-NE | E.amyg | Lt | F | 140 | 10 | 8 | Dg | 84-SE | E.amyg | Gr | F | 60 | 4 | 2 | Ts |
| 17-NE | E.amyg | Lt | F | 370 | 95 | 5 | Jd | 85-SE | E.amyg | Gr | F | 210 | 1 | 1 | Ts |
| 18-NE | E.amyg | Lt | F | 350 | 100 | 7 | Jd | 86-SE | E.amyg | Gr | F | 210 | 1 | 1 | Ts |
| 19-NE | E.amyg | Lt | F | 480 | 40 | 9 | Pm | 87-SE | E.amyg | Gr | F | 210 | 1 | 1 | Ts |
| 20-NE | E.amyg | Gr | F | 440 | 20 | 7 | Pm | 88-SE | E.amyg | Gr | F | 230 | 2 | 0 | Ts |
| 21-NE | E.amyg | Hh | F | 0 | 150 | 8 | Jd | 89-SE | E.amyg | Hh | F | 135 | 4 | 0 | Ts |
| 22-NE | E.amyg | Hh | F | 450 | 205 | 4 | Pm | 90-SE | E.amyg | Hh | F | 120 | 2 | 1 | Ts |
| 23-NE | E.amyg | Hh | F | 480 | 330 | 14 | Pm | 91-SE | E.amyg | Hh | F | 245 | 1 | 1 | Ts |
| 24-NE | E.amyg | Hh | F | 40 | 160 | 2 | Pm | 92-SE | E.amyg | Hh | F | 130 | 4 | 2 | Ts |
| 25-NE | E.amyg | Hh | F | 20 | 310 | 2 | Pm | 93-SE | E.amyg | Hh | F | 90 | 4 | 2 | Ts |
| 26-NE | E.amyg | Bk | F | 60 | 180 | 1 | Pm | 94-SE | E.amyg | Hh | F | 195 | 3 | 1 | Ts |
| 27-NE | E.amyg | Hh | F | 390 | 30 | 4 | Jd | 95-SE | E.amyg | Hh | F | 20 | 2 | 1 | Ts |
| 28-NE | E.amyg | Hh | F | 390 | 310 | 7 | Jd | 96-SE | E.amyg | Hh | F | 40 | 1 | 0 | Ts |
| 29-NE | E.amyg | Hh | F | 590 | 315 | 7 | Jd | 97-SE | E.amyg | Hh | F | 40 | 2 | 0 | Ts |
| 30-NE | E.amyg | Hh | F | 370 | 285 | 10 | Jd | 98-SE | E.amyg | Hh | F | 150 | 1 | 1 | Ts |
| 31-NE | E.amyg | Bk | F | 50 | 170 | 4 | Pm | 140-NE | E.obli | Bk | F | 144 | 225 | 3 | Dg |
| 32-NE | E.amyg | Bk | F | 70 | 330 | 4 | Pm | 141-NE | E.obli | Bk | F | 110 | 180 | 4 | Pm |
| 33-NE | E.amyg | Lt | F | 70 | 260 | 2 | Pm | 142-NE | E.obli | Hh | F | 180 | 45 | 5 | Dg |
| 34-NE | E.amyg | Bk | F | 70 | 70 | 1 | Pm | 143-NE | E.obli | Bk | F | 160 | 45 | 3 | Dg |
| 35-NE | E.amyg | Bk | F | 50 | 140 | 1 | Pm | 144-NE | E.obli | Bk | F | 206 | 270 | 2 | Dg |
| 36-NE | E.amyg | Lt | F | 40 | 355 | 8 | Pm | 145-NE | E.obli | Hh | F | 200 | 0 | 4 | Dg |
| 37-NE | E.amyg | Bk | F | 70 | 175 | 9 | Pm | 146-NE | E.obli | Bk | F | 198 | 90 | 8 | Dg |
| 38-NE | E.amyg | Hh | F | 50 | 0 | 17 | Pm | 147-NE | E.obli | Bk | F | 190 | 135 | 3 | Dg |
| 39-NE | E.amyg | Bk | F | 60 | 340 | 4 | Pm | 148-NE | E.obli | Bk | F | 142 | 0 | 2 | Pm |
| 40-SE | E.tenu | Lt | C | 80 | 2 | 3 | Pm | 149-NE | E.obli | Bk | F | 141 | 180 | 11 | Dg |
| 41-SE | E.tenu | Lt | C | 100 | 1 | 3 | Pm | 150-NE | E.obli | Bk | F | 70 | 180 | 2 | Pm |
| 42-SE | E.tenu | Lt | C | 300 | 1 | 2 | Pm | 151-NE | E.obli | Bk | F | 127 | 180 | 4 | Dg |
| 43-SE | E.tenu | Lt | C | 170 | 1 | 3 | Pm | 152-NE | E.obli | Hh | F | 410 | 270 | 12 | Pm |
| 44-SE | E.tenu | Lt | C | 110 | 2 | 3 | Pm | 153-NE | E.obli | Bk | F | 98 | 200 | 2 | Dg |
| 45-SE | E.tenu | Hh | C | 220 | 2 | 3 | Pm | 154-NE | E.obli | Hh | F | 104 | 0 | 4 | Pm |
| 46-SE | E.tenu | Lt | C | 90 | 1 | 3 | Pm | 155-NE | E.obli | Bk | F | 92 | 315 | 3 | Dg |
| 47-SE | E.tenu | Lt | C | 250 | 2 | 3 | Pm | 156-NE | E.obli | Bk | F | 150 | 270 | 6 | Pm |
| 48-SE | E.tenu | Lt | C | 230 | 4 | 3 | Pm | 157-NE | E.obli | Bk | F | 116 | 180 | 4 | Pm |
| 49-SE | E.pulc | Hh | C | 330 | 5 | 1 | Jd | 158-NE | E.obli | Bk | F | 59 | 90 | 5 | Jd |
| 50-SE | E.pulc | Hh | C | 260 | 2 | 1 | Jd | 159-NE | E.sieb | Hh | F | 211 | 22.5 | 6 | Dg |
| 51-SE | E.pulc | Gr | C | 240 | 2 | 2 | Jd | 160-NE | E.obli | Bk | F | 211 | 180 | 16 | Jd |
| 52-SE | E.pulc | Gr | C | 270 | 3 | 2 | Jd | 161-NE | E.obli | Bk | F | 196 | 0 | 12 | Jd |
| 53-SE | E.pulc | Hh | C | 310 | 3 | 1 | Jd | 162-NE | E.sieb | Hh | F | 145 | 310 | 12 | Dg |
| 54-SE | E.pulc | Lt | C | 310 | 4 | 1 | Jd | 163-NE | E.sieb | Bk | F | 70 | 0 | 4 | Pm |
| 55-SE | E.pulc | Gr | C | 300 | 1 | 2 | Jd | 164-NE | E.sieb | Bk | F | 62 | 45 | 10 | Pm |
| 56-SE | E.pulc | Gr | C | 80 | 3 | 1 | Jd | 165-NE | E.sieb | Hh | F | 66 | 45 | 30 | Pm |
| 57-SE | E.pulc | Gr | C | 120 | 1 | 3 | Jd | 166-NE | E.amyg | Bk | F | 147 | 0 | 3 | Pm |
| 58-SE | E.pulc | Gr | C | 120 | 1 | 3 | Jd | 167-SE | E.pulc | Hh | C | 171 | 45 | 12 | Jd |
| 59-SE | E.pulc | Hh | C | 90 | 2 | 3 | Jd | 168-SE | E.amyg | Hh | F | 75 | 90 | 5 | Ts |
| 60-SE | E.pulc | Hh | C | 210 | 3 | 1 | Jd | 169-SE | E.pulc | Gr | C | 313 | 60 | 14 | Jd |
| 61-SE | E.pulc | Hh | C | 190 | 2 | 2 | Jd | 170-SE | E.amyg | Lt | F | 114 | 270 | 14 | Pm |
| 62-SE | A.vert | Gr | O | 40 | 5 | 3 | Jd | 171-SE | E.amyg | Lt | F | 273 | 45 | 18 | Pm |
| 63-SE | A.vert | Gr | O | 55 | 3 | 1 | Jd | 172-SE | E.obli | Bk | F | 413 | 180 | 4 | Pm |
| 64-SE | A.vert | Gr | O | 150 | 1 | 2 | Jd | 173-SE | E.vimi | Gr | C | 220 | 110 | 14 | Jd |
| 65-SE | A.vert | Gr | O | 30 | 2 | 2 | Jd | 174-SE | E.obli | Hh | F | 357 | 0 | 14 | Pm |
| 66-SE | A.vert | Gr | O | 105 | 2 | 2 | Jd | 175-SE | E.obli | Hh | F | 154 | 200 | 16 | Pm |
| 67-SE | A.vert | Gr | O | 100 | 3 | 1 | Jd | 176-SE | E.obli | Hh | F | 157 | 180 | 14 | Pm |
| 68-SE | A.vert | Gr | O | 155 | 1 | 3 | Jd |
Appendix B
| Veg Type | Age | Surface | Near-Surface | Elevated | Total | ||||||||||
|---|---|---|---|---|---|---|---|---|---|---|---|---|---|---|---|
| Site | Over | Under | cvr | hgt | load | cvr | hgt | live | dead | cvr | hgt | live | dead | Load | |
| % | m | kg m−1 | % | m | kg m−1 | kg m−1 | % | m | kg m−1 | kg m−1 | kg m−1 | ||||
| 1-NE | E.amyg | Gr | 5.7 | 94 | 0.02 | 0.65 | 40 | 0.48 | 0.17 | 0.22 | 0 | - | - | 1.04 | |
| 2-NE | E.amyg | Bk | 15 | 87 | 0.02 | 0.97 | 45 | 0.33 | 0.18 | 0.49 | 0 | - | - | 1.64 | |
| 3-NE | E.amyg | Hh | 18 | 97 | 0.02 | 1.00 | 55 | 0.46 | 0.08 | 0.43 | 2 | 2.30 | - | - | 1.51 |
| 4-NE | E.amyg | Bk | 16 | 87 | 0.02 | 0.77 | 48 | 0.39 | 0.13 | 0.53 | 7 | 1.27 | - | - | 1.42 |
| 5-NE | E.amyg | Lt | 11 | 94 | 0.01 | 0.81 | 45 | 0.32 | 0.11 | 0.33 | 0 | 0.85 | - | - | 1.24 |
| 6-NE | E.amyg | Hh | 10 | 85 | 0.02 | 0.93 | 30 | 0.24 | 0.05 | 0.15 | 0 | 0.00 | - | - | 1.12 |
| 7-NE | E.amyg | Bk | 13 | 86 | 0.02 | 0.85 | 54 | 0.48 | 0.12 | 0.51 | 6 | 1.31 | - | - | 1.48 |
| 8-NE | E.amyg | Gr | 2.8 | 74 | 0.01 | 0.59 | 55 | 0.35 | 0.25 | 0.15 | 0 | 0.00 | - | - | 0.99 |
| 9-NE | E.amyg | Lt | 22.1 | 88 | 0.02 | 0.97 | 54 | 0.33 | 0.32 | 0.47 | 1 | 1.80 | - | - | 1.75 |
| 10-NE | E.amyg | Hh | 23.1 | 86 | 0.02 | 0.83 | 59 | 0.35 | 0.20 | 0.41 | 6 | 2.60 | - | - | 1.44 |
| 11-NE | E.amyg | Bk | 9.1 | 88 | 0.01 | 1.06 | 66 | 0.33 | 0.21 | 0.51 | 1 | 2.00 | - | - | 1.79 |
| 12-NE | E.amyg | Bk | 4.2 | 80 | 0.01 | 0.73 | 35 | 0.29 | 0.08 | 0.16 | 0 | 0.00 | - | - | 0.97 |
| 13-NE | E.amyg | Hh | 7.7 | 95 | 0.01 | 0.55 | 60 | 0.45 | 0.14 | 0.49 | 0 | 0.00 | - | - | 1.18 |
| 14-NE | E.amyg | Bk | 1.6 | 52 | 0.01 | 0.29 | 32 | 0.26 | 0.06 | 0.09 | 0 | 2.00 | - | - | 0.43 |
| 15-NE | E.amyg | Bk | 14.7 | 76 | 0.01 | 0.60 | 60 | 0.32 | 0.21 | 0.51 | 1 | 2.00 | - | - | 1.32 |
| 16-NE | E.amyg | Lt | 7.8 | 91 | 0.01 | 0.69 | 33 | 0.22 | 0.04 | 0.20 | 1 | 3.00 | - | - | 0.93 |
| 17-NE | E.amyg | Lt | 3.3 | 70 | 0.01 | 0.45 | 26 | 0.21 | 0.03 | 0.10 | 3 | 2.33 | - | - | 0.58 |
| 18-NE | E.amyg | Lt | 6.8 | 76 | 0.01 | 0.79 | 27 | 0.20 | 0.05 | 0.12 | 2 | 2.50 | - | - | 0.95 |
| 19-NE | E.amyg | Lt | 8.3 | 74 | 0.02 | 0.95 | 31 | 0.27 | 0.05 | 0.14 | 1 | 2.00 | - | - | 1.14 |
| 20-NE | E.amyg | Gr | 5 | 61 | 0.01 | 0.60 | 42 | 0.27 | 0.09 | 0.13 | 2 | 1.75 | - | - | 0.81 |
| 21-NE | E.amyg | Hh | 12.3 | 74 | 0.02 | 0.83 | 45 | 0.45 | 0.13 | 0.33 | 2 | 2.67 | - | - | 1.29 |
| 22-NE | E.amyg | Hh | 24.3 | 87 | 0.02 | 1.01 | 37 | 0.30 | 0.07 | 0.20 | 5 | 2.75 | - | - | 1.28 |
| 23-NE | E.amyg | Hh | 21.4 | 62 | 0.02 | 0.69 | 43 | 0.30 | 0.14 | 0.39 | 0 | 0.00 | - | - | 1.22 |
| 24-NE | E.amyg | Hh | 11.9 | 92 | 0.02 | 0.98 | 48 | 0.48 | 0.17 | 0.46 | 0 | 0.00 | - | - | 1.61 |
| 25-NE | E.amyg | Hh | 7.2 | 91 | 0.01 | 0.88 | 44 | 0.35 | 0.18 | 0.33 | 4 | 2.29 | - | - | 1.40 |
| 26-NE | E.amyg | Bk | 16.4 | 92 | 0.02 | 0.99 | 55 | 0.43 | 0.10 | 0.66 | 0 | 2.00 | - | - | 1.75 |
| 27-NE | E.amyg | Hh | 2.5 | 61 | 0.01 | 0.62 | 24 | 0.24 | 0.03 | 0.20 | 2 | 3.50 | - | - | 0.85 |
| 28-NE | E.amyg | Hh | 22.5 | 85 | 0.02 | 1.01 | 48 | 0.30 | 0.19 | 0.43 | 1 | 2.00 | - | - | 1.62 |
| 29-NE | E.amyg | Hh | 19.5 | 73 | 0.02 | 0.89 | 48 | 0.38 | 0.27 | 0.40 | 3 | 3.75 | - | - | 1.57 |
| 30-NE | E.amyg | Hh | 16.5 | 73 | 0.02 | 0.79 | 28 | 0.25 | 0.09 | 0.29 | 0 | 3.00 | - | - | 1.17 |
| 31-NE | E.amyg | Bk | 2.5 | 31 | 0.00 | 0.16 | 52 | 0.39 | 0.20 | 0.18 | 0 | 3.00 | - | - | 0.54 |
| 32-NE | E.amyg | Bk | 3.6 | 81 | 0.01 | 0.74 | 23 | 0.28 | 0.05 | 0.12 | 0 | 3.00 | - | - | 0.91 |
| 33-NE | E.amyg | Lt | 24.6 | 86 | 0.01 | 0.91 | 31 | 0.23 | 0.02 | 0.22 | 1 | 2.00 | - | - | 1.15 |
| 34-NE | E.amyg | Bk | 2.4 | 57 | 0.01 | 0.36 | 48 | 0.30 | 0.14 | 0.14 | 1 | 4.00 | - | - | 0.63 |
| 35-NE | E.amyg | Bk | 19.6 | 86 | 0.02 | 0.81 | 65 | 0.40 | 0.25 | 0.46 | 5 | 2.63 | - | - | 1.52 |
| 36-NE | E.amyg | Lt | 15.7 | 91 | 0.02 | 1.05 | 65 | 0.50 | 0.29 | 0.60 | 0 | 0.00 | - | - | 1.95 |
| 37-NE | E.amyg | Bk | 5.7 | 86 | 0.01 | 1.12 | 41 | 0.33 | 0.06 | 0.22 | 1 | 2.00 | - | - | 1.40 |
| 38-NE | E.amyg | Hh | 16.7 | 84 | 0.02 | 0.87 | 53 | 0.31 | 0.11 | 0.36 | 0 | 0.00 | - | - | 1.33 |
| 39-NE | E.amyg | Bk | 19.7 | 94 | 0.02 | 0.95 | 65 | 0.53 | 0.19 | 0.40 | 1 | 3.00 | - | - | 1.54 |
| 40-SE | E.tenu | Lt | 29.5 | 100 | 0.02 | 0.66 | 20 | 0.09 | 0.11 | 0.02 | 80 | 2.20 | 0.37 | 0.12 | 1.28 |
| 41-SE | E.tenu | Lt | 17.5 | 60 | 0.02 | 0.86 | 30 | 0.12 | 0.03 | 0.01 | 30 | 2.55 | 0.04 | 0.01 | 0.95 |
| 42-SE | E.tenu | Lt | 14 | 90 | 0.02 | 1.01 | 60 | 0.15 | 0.05 | 0.00 | 40 | 2.64 | 0.05 | 0.01 | 1.13 |
| 43-SE | E.tenu | Lt | 12 | 60 | 0.03 | 0.87 | 40 | 0.21 | 0.02 | 0.01 | 40 | 2.79 | 0.02 | 0.01 | 0.92 |
| 44-SE | E.tenu | Lt | 12 | 60 | 0.03 | 0.62 | 20 | 0.24 | 0.03 | 0.01 | 20 | 1.26 | 0.02 | 0.00 | 0.68 |
| 45-SE | E.tenu | Hh | 8 | 70 | 0.02 | 1.20 | 50 | 0.18 | 0.03 | 0.00 | 20 | 1.46 | 0.02 | 0.00 | 1.26 |
| 46-SE | E.tenu | Lt | 6 | 80 | 0.03 | 0.64 | 60 | 0.40 | 0.04 | 0.04 | 50 | 1.72 | 0.02 | 0.01 | 0.75 |
| 47-SE | E.tenu | Lt | 3.5 | 70 | 0.02 | 0.44 | 20 | 0.37 | 0.05 | 0.00 | 30 | 1.74 | 0.01 | 0.00 | 0.50 |
| 48-SE | E.tenu | Lt | 2.5 | 70 | 0.03 | 0.18 | 60 | 0.33 | 0.01 | 0.01 | 40 | 1.91 | 0.00 | 0.02 | 0.23 |
| 49-SE | E.pulc | Hh | 28.1 | 90 | 0.03 | 1.11 | 100 | 0.34 | 0.19 | 0.26 | 30 | 1.66 | 0.15 | 0.00 | 1.70 |
| 50-SE | E.pulc | Hh | 28 | 90 | 0.03 | 1.39 | 70 | 0.14 | 0.24 | 0.04 | 30 | 1.36 | 0.05 | 0.01 | 1.72 |
| 51-SE | E.pulc | Gr | 12 | 80 | 0.03 | 1.46 | 70 | 0.12 | 0.12 | 0.04 | 30 | 1.39 | 0.03 | 0.00 | 1.65 |
| 52-SE | E.pulc | Gr | 12 | 100 | 0.03 | 1.45 | 70 | 0.12 | 0.13 | 0.04 | 50 | 2.16 | 0.03 | 0.01 | 1.66 |
| 53-SE | E.pulc | Hh | 11 | 80 | 0.02 | 0.68 | 80 | 0.15 | 0.12 | 0.08 | 10 | 2.66 | 0.10 | 0.00 | 0.98 |
| 54-SE | E.pulc | Lt | 8 | 100 | 0.02 | 0.54 | 50 | 0.16 | 0.20 | 0.02 | 20 | 2.50 | 0.07 | 0.00 | 0.83 |
| 55-SE | E.pulc | Gr | 7 | 100 | 0.02 | 0.77 | 60 | 0.19 | 0.36 | 0.02 | 10 | 4.06 | 0.02 | 0.00 | 1.16 |
| 56-SE | E.pulc | Gr | 3.5 | 90 | 0.01 | 0.41 | 50 | 0.20 | 0.07 | 0.01 | 40 | 3.14 | 0.00 | 0.03 | 0.52 |
| 57-SE | E.pulc | Gr | 1.5 | 60 | 0.01 | 0.12 | 70 | 0.15 | 0.10 | 0.01 | 20 | 3.87 | 0.00 | 0.00 | 0.24 |
| 58-SE | E.pulc | Gr | 0.9 | 50 | 0.01 | 0.08 | 60 | 0.16 | 0.06 | 0.01 | 30 | 4.72 | 0.00 | 0.00 | 0.16 |
| 59-SE | E.pulc | Hh | 0.3 | 60 | 0.03 | 0.15 | 20 | 0.12 | 0.00 | 0.00 | 20 | 1.33 | 0.00 | 0.01 | 0.16 |
| 60-SE | E.pulc | Hh | 0.1 | 40 | 0.03 | 0.12 | 20 | 0.13 | 0.00 | 0.01 | 0 | 5.80 | 0.00 | 0.01 | 0.13 |
| 61-SE | E.pulc | Hh | 0.1 | 60 | 0.03 | 0.12 | 30 | 0.19 | 0.00 | 0.02 | 0 | 4.24 | 0.00 | 0.00 | 0.14 |
| 62-SE | A.vert | Gr | 27 | 100 | 0.04 | 1.27 | 90 | 0.21 | 0.13 | 0.02 | 20 | 3.75 | 0.03 | 0.00 | 1.46 |
| 63-SE | A.vert | Gr | 13 | 100 | 0.03 | 1.10 | 100 | 0.23 | 0.09 | 0.00 | 10 | 3.65 | 0.02 | 0.00 | 1.21 |
| 64-SE | A.vert | Gr | 10 | 80 | 0.03 | 0.92 | 60 | 0.25 | 0.08 | 0.01 | 20 | 1.53 | 0.03 | 0.01 | 1.05 |
| 65-SE | A.vert | Gr | 5.5 | 100 | 0.03 | 0.72 | 80 | 0.19 | 0.04 | 0.01 | 10 | 1.50 | 0.01 | 0.00 | 0.78 |
| 66-SE | A.vert | Gr | 4.5 | 90 | 0.02 | 1.05 | 90 | 0.19 | 0.11 | 0.16 | 20 | 1.79 | 0.02 | 0.00 | 1.34 |
| 67-SE | A.vert | Gr | 3 | 80 | 0.02 | 1.02 | 60 | 0.17 | 0.09 | 0.01 | 20 | 2.07 | 0.03 | 0.00 | 1.16 |
| 68-SE | A.vert | Gr | 1.5 | 80 | 0.02 | 0.17 | 80 | 0.17 | 0.11 | 0.01 | 10 | 3.64 | 0.00 | 0.01 | 0.30 |
| 69-SE | A.vert | Gr | 0.8 | 40 | 0.02 | 0.09 | 60 | 0.18 | 0.02 | 0.01 | 20 | 6.05 | 0.00 | 0.01 | 0.13 |
| 70-SE | E.glob | Lt | 28.4 | 100 | 0.02 | 1.67 | 30 | 0.17 | 0.09 | 0.06 | 10 | 5.33 | 0.06 | 0.00 | 1.88 |
| 71-SE | E.glob | Gr | 13 | 100 | 0.02 | 0.81 | 80 | 0.17 | 0.05 | 0.01 | 30 | 4.85 | 0.04 | 0.01 | 0.92 |
| 72-SE | E.glob | Gr | 10 | 100 | 0.02 | 1.05 | 100 | 0.16 | 0.07 | 0.02 | 60 | 5.35 | 0.08 | 0.01 | 1.22 |
| 73-SE | E.glob | Hh | 6 | 70 | 0.02 | 0.57 | 60 | 0.13 | 0.05 | 0.07 | 50 | 3.87 | 0.09 | 0.01 | 0.78 |
| 74-SE | E.glob | Lt | 4 | 100 | 0.02 | 0.40 | 60 | 0.10 | 0.22 | 0.03 | 40 | 4.13 | 0.02 | 0.00 | 0.67 |
| 75-SE | E.glob | Gr | 2.5 | 80 | 0.01 | 0.26 | 60 | 0.13 | 0.04 | 0.00 | 40 | 6.27 | 0.00 | 0.01 | 0.31 |
| 76-SE | E.glob | Gr | 1.6 | 60 | 0.01 | 0.49 | 50 | 0.12 | 0.03 | 0.00 | 10 | 4.52 | 0.00 | 0.01 | 0.54 |
| 77-SE | E.glob | Lt | 1.6 | 70 | 0.02 | 0.37 | 50 | 0.16 | 0.34 | 0.01 | 20 | 3.96 | 0.00 | 0.01 | 0.73 |
| 78-SE | E.glob | Gr | 1.2 | 50 | 0.02 | 0.12 | 90 | 0.20 | 0.12 | 0.03 | 20 | 4.06 | 0.00 | 0.02 | 0.30 |
| 79-SE | E.glob | Gr | 0.2 | 40 | 0.02 | 0.10 | 30 | 0.21 | 0.00 | 0.02 | 10 | 1.53 | 0.00 | 0.01 | 0.13 |
| 80-SE | E.amyg | Gr | 19 | 90 | 0.02 | 0.74 | 100 | 0.26 | 0.14 | 0.12 | 2 | 3.12 | 0.03 | 0.03 | 1.07 |
| 81-SE | E.amyg | Gr | 12 | 80 | 0.02 | 0.44 | 70 | 0.24 | 0.08 | 0.00 | 20 | 3.05 | 0.05 | 0.00 | 0.57 |
| 82-SE | E.amyg | Gr | 10 | 100 | 0.02 | 0.54 | 70 | 0.20 | 0.35 | 0.07 | 40 | 3.05 | 0.05 | 0.03 | 1.03 |
| 83-SE | E.amyg | Gr | 7 | 100 | 0.02 | 0.43 | 90 | 0.16 | 0.23 | 0.06 | 40 | 3.51 | 0.06 | 0.01 | 0.79 |
| 84-SE | E.amyg | Gr | 3 | 80 | 0.02 | 0.15 | 80 | 0.09 | 0.11 | 0.02 | 30 | 3.66 | 0.00 | 0.02 | 0.31 |
| 85-SE | E.amyg | Gr | 1.5 | 50 | 0.03 | 0.06 | 70 | 0.15 | 0.13 | 0.01 | 20 | 3.64 | 0.01 | 0.01 | 0.23 |
| 86-SE | E.amyg | Gr | 1 | 30 | 0.03 | 0.04 | 60 | 0.21 | 0.13 | 0.02 | 10 | 5.80 | 0.00 | 0.02 | 0.21 |
| 87-SE | E.amyg | Gr | 0.2 | 50 | 0.03 | 0.12 | 40 | 0.20 | 0.00 | 0.04 | 10 | 5.01 | 0.00 | 0.02 | 0.19 |
| 88-SE | E.amyg | Gr | 29 | 90 | 0.03 | 1.86 | 50 | 0.20 | 0.11 | 0.22 | 30 | 4.47 | 0.03 | 0.00 | 2.22 |
| 89-SE | E.amyg | Hh | 19 | 100 | 0.02 | 0.78 | 50 | 0.16 | 0.34 | 0.24 | 40 | 4.46 | 0.07 | 0.03 | 1.46 |
| 90-SE | E.amyg | Hh | 18 | 90 | 0.02 | 0.47 | 90 | 0.17 | 0.35 | 0.24 | 30 | 2.70 | 0.07 | 0.00 | 1.13 |
| 91-SE | E.amyg | Hh | 10 | 90 | 0.02 | 0.86 | 90 | 0.20 | 0.20 | 0.13 | 50 | 2.36 | 0.06 | 0.01 | 1.26 |
| 92-SE | E.amyg | Hh | 6 | 90 | 0.02 | 0.40 | 90 | 0.21 | 0.23 | 0.02 | 30 | 1.49 | 0.08 | 0.03 | 0.77 |
| 93-SE | E.amyg | Hh | 6 | 80 | 0.02 | 0.29 | 60 | 0.21 | 0.12 | 0.01 | 50 | 1.62 | 0.04 | 0.01 | 0.47 |
| 94-SE | E.amyg | Hh | 5 | 100 | 0.01 | 0.31 | 100 | 0.17 | 0.12 | 0.06 | 80 | 1.81 | 0.15 | 0.00 | 0.64 |
| 95-SE | E.amyg | Hh | 3 | 50 | 0.01 | 0.30 | 70 | 0.14 | 0.28 | 0.01 | 20 | 4.33 | 0.00 | 0.06 | 0.64 |
| 96-SE | E.amyg | Hh | 0.8 | 40 | 0.01 | 0.08 | 60 | 0.15 | 0.19 | 0.01 | 20 | 5.08 | 0.00 | 0.05 | 0.33 |
| 97-SE | E.amyg | Hh | 0.5 | 50 | 0.02 | 0.11 | 0 | 0.12 | 0.14 | 0.01 | 20 | 6.80 | 0.00 | 0.03 | 0.28 |
| 98-SE | E.amyg | Hh | 0.2 | 50 | 0.03 | 0.12 | 20 | 0.05 | 0.00 | 0.04 | 10 | 1.55 | 0.00 | 0.02 | 0.19 |
| 140-NE | E.obli | Bk | 15.5 | 95 | 0.03 | 1.03 | 30 | 0.41 | 0.11 | 0.18 | 4 | 1.51 | - | - | 1.33 |
| 141-NE | E.obli | Bk | 17.6 | 94 | 0.03 | 0.96 | 27 | 0.33 | 0.10 | 0.10 | 4 | 1.38 | - | - | 1.16 |
| 142-NE | E.obli | Hh | 8.6 | 88 | 0.03 | 1.07 | 25 | 0.31 | 0.05 | 0.05 | 2 | 1.56 | - | - | 1.18 |
| 143-NE | E.obli | Bk | 0.7 | 29 | 0.02 | 0.23 | 11 | 0.22 | 0.01 | 0.01 | 1 | 1.20 | - | - | 0.25 |
| 144-NE | E.obli | Bk | 0.7 | 67 | 0.03 | 0.52 | 27 | 0.26 | 0.09 | 0.02 | 4 | 1.25 | - | - | 0.64 |
| 145-NE | E.obli | Hh | 25.6 | 93 | 0.03 | 1.00 | 35 | 0.32 | 0.11 | 0.19 | 3 | 0.97 | - | - | 1.30 |
| 146-NE | E.obli | Bk | 17.5 | 89 | 0.02 | 0.79 | 24 | 0.25 | 0.09 | 0.16 | 1 | 1.45 | - | - | 1.03 |
| 147-NE | E.obli | Bk | 2.8 | 43 | 0.02 | 0.30 | 24 | 0.31 | 0.07 | 0.09 | 0 | 1.00 | - | - | 0.46 |
| 148-NE | E.obli | Bk | 3.7 | 97 | 0.03 | 0.95 | 29 | 0.30 | 0.08 | 0.22 | 1 | 1.03 | - | - | 1.25 |
| 149-NE | E.obli | Bk | 15.6 | 90 | 0.03 | 1.15 | 16 | 0.20 | 0.03 | 0.10 | 2 | 0.90 | - | - | 1.28 |
| 150-NE | E.obli | Bk | 13.6 | 97 | 0.03 | 1.00 | 31 | 0.30 | 0.07 | 0.23 | 6 | 1.29 | - | - | 1.31 |
| 151-NE | E.obli | Bk | 27.6 | 85 | 0.03 | 0.85 | 19 | 0.25 | 0.06 | 0.13 | 0 | 1.10 | - | - | 1.04 |
| 152-NE | E.obli | Hh | 22.7 | 89 | 0.03 | 0.95 | 19 | 0.28 | 0.12 | 0.16 | 1 | 1.14 | - | - | 1.23 |
| 153-NE | E.obli | Bk | 12.7 | 98 | 0.03 | 0.84 | 28 | 0.43 | 0.17 | 0.34 | 0 | 0.00 | - | - | 1.35 |
| 154-NE | E.obli | Hh | 20.7 | 93 | 0.03 | 1.09 | 26 | 0.28 | 0.11 | 0.11 | 4 | 1.24 | - | - | 1.30 |
| 155-NE | E.obli | Bk | 5.7 | 72 | 0.01 | 0.52 | 22 | 0.26 | 0.15 | 0.11 | 1 | 1.33 | - | - | 0.78 |
| 156-NE | E.obli | Bk | 11.7 | 97 | 0.02 | 0.94 | 26 | 0.31 | 0.16 | 0.23 | 0 | 0.95 | - | - | 1.32 |
| 157-NE | E.obli | Bk | 6.7 | 91 | 0.02 | 0.86 | 27 | 0.33 | 0.11 | 0.30 | 3 | 1.42 | - | - | 1.27 |
| 158-NE | E.obli | Bk | 2.7 | 87 | 0.02 | 0.49 | 29 | 0.34 | 0.11 | 0.14 | 1 | 1.17 | - | - | 0.74 |
| 159-NE | E.sieb | Hh | 12.7 | 93 | 0.03 | 0.93 | 18 | 0.19 | 0.16 | 0.09 | 2 | 1.46 | - | - | 1.17 |
| 160-NE | E.obli | Bk | 22.7 | 94 | 0.04 | 1.47 | 20 | 0.27 | 0.02 | 0.14 | 1 | 1.05 | - | - | 1.63 |
| 161-NE | E.obli | Bk | 7.7 | 88 | 0.02 | 0.66 | 23 | 0.34 | 0.05 | 0.05 | 0 | 1.40 | - | - | 0.76 |
| 162-NE | E.sieb | Hh | 2.7 | 39 | 0.02 | 0.33 | 8 | 0.17 | 0.01 | 0.02 | 1 | 1.52 | - | - | 0.36 |
| 163-NE | E.sieb | Bk | 10.1 | 95 | 0.02 | 1.26 | 23 | 0.23 | 0.05 | 0.07 | 2 | 1.45 | - | - | 1.38 |
| 164-NE | E.sieb | Bk | 19.3 | 94 | 0.03 | 1.66 | 9 | 0.15 | 0.01 | 0.06 | 3 | 1.30 | - | - | 1.73 |
| 165-NE | E.sieb | Hh | 5.8 | 75 | 0.02 | 0.88 | 8 | 0.17 | 0.00 | 0.07 | 1 | 1.00 | - | - | 0.96 |
| 166-NE | E.amyg | Bk | 22.8 | 98 | 0.03 | 1.00 | 41 | 0.49 | 0.24 | 0.37 | 1 | 1.33 | - | - | 1.61 |
| 167-SE | E.pulc | Hh | 24 | 83 | 0.02 | 0.53 | 75 | 0.40 | 0.28 | 0.30 | 16 | 1.44 | - | - | 1.11 |
| 168-SE | E.amyg | Hh | 22.8 | 93 | 0.03 | 0.95 | 48 | 0.42 | 0.23 | 0.08 | 3 | 1.38 | - | - | 1.26 |
| 169-SE | E.pulc | Gr | 23.7 | 72 | 0.03 | 0.84 | 24 | 0.19 | 0.06 | 0.23 | 0 | 0.00 | - | - | 1.14 |
| 170-SE | E.amyg | Lt | 20.9 | 75 | 0.02 | 0.56 | 47 | 0.15 | 0.17 | 0.25 | 4 | 1.06 | - | - | 0.98 |
| 171-SE | E.amyg | Lt | 22.9 | 58 | 0.01 | 0.62 | 41 | 0.10 | 0.02 | 0.17 | 4 | 1.33 | - | - | 0.80 |
| 172-SE | E.obli | Bk | 2.1 | 55 | 0.01 | 0.42 | 19 | 0.23 | 0.05 | 0.01 | 2 | 1.52 | - | - | 0.48 |
| 173-SE | E.vimi | Gr | 24.9 | 56 | 0.02 | 0.76 | 68 | 0.16 | 0.07 | 0.05 | 3 | 1.15 | - | - | 0.88 |
| 174-SE | E.obli | Hh | 6.9 | 90 | 0.02 | 0.72 | 20 | 0.17 | 0.12 | 0.02 | 0 | 0.00 | - | - | 0.86 |
| 175-SE | E.obli | Hh | 18.9 | 87 | 0.02 | 0.85 | 21 | 0.29 | 0.13 | 0.10 | 4 | 1.42 | - | - | 1.08 |
| 176-SE | E.obli | Hh | 18 | 70 | 0.02 | 0.65 | 11 | 0.19 | 0.08 | 0.06 | 6 | 1.31 | - | - | 0.79 |
Appendix C
| Over- | Under | Surface | Near-Surface | Elevated | Bark | Overall | ||||||||||||||
| Site | Storey | Storey | Age | horiz | cvr | hgt | FHR | horiz | cvr | hgt | dead | FHR | horiz | vert | cvr | hgt | dead | FHR | FHR | FHR |
| 1-NE | E.amyg | Gr | 15.5 | 3.2 | 44 | 0.04 | 2.8 | 3.1 | 53 | 0.38 | 56 | 3.9 | 0.4 | 0.4 | 4 | 1.33 | 10 | 0.4 | 2.6 | 3.9 |
| 2-NE | E.amyg | Bk | 15.5 | 4.8 | 86 | 0.10 | 4.6 | 4.1 | 66 | 0.29 | 54 | 4.2 | 0.8 | 1 | 9 | 1.15 | 61 | 1.7 | 3.8 | 4.6 |
| 4-NE | E.amyg | Bk | 25.8 | 4.6 | 82 | 0.07 | 4.4 | 4.1 | 70 | 0.35 | 59 | 4.5 | 3.9 | 5 | 64 | 1.38 | 50 | 4.6 | 3.3 | 5 |
| 5-NE | E.amyg | Lt | 7.3 | 4.5 | 84 | 0.04 | 4.2 | 1.8 | 21 | 0.22 | 51 | 3.1 | 1.7 | 3.3 | 26 | 0.71 | 39 | 2.7 | 3.1 | 4.1 |
| 6-NE | E.amyg | Hh | 19.8 | 4.5 | 91 | 0.06 | 4.6 | 1.6 | 18 | 0.20 | 76 | 3.3 | 1.4 | 1.9 | 15 | 0.84 | 31 | 2.2 | 3.9 | 4.7 |
| 7-NE | E.amyg | Bk | 22.8 | 5 | 92 | 0.08 | 4.9 | 3.2 | 50 | 0.27 | 69 | 4.2 | 3.4 | 4.2 | 53 | 1.15 | 62 | 4.3 | 3.1 | 5 |
| 8-NE | E.amyg | Gr | 2.9 | 3.5 | 61 | 0.02 | 2.6 | 1.3 | 15 | 0.24 | 5 | 1.2 | 0.1 | 0.1 | 1 | 0.50 | 5 | 0.2 | 2 | 2.4 |
| 10-NE | E.amyg | Hh | 32.8 | 4.3 | 79 | 0.06 | 4.1 | 2.5 | 32 | 0.27 | 53 | 3.5 | 2.4 | 3 | 33 | 1.36 | 41 | 3.4 | 3.8 | 4.9 |
| 11-NE | E.amyg | Bk | 18.8 | 5 | 92 | 0.14 | 4.8 | 4.9 | 87 | 0.34 | 90 | 5 | 4.7 | 5 | 78 | 1.50 | 59 | 4.9 | 3.9 | 5 |
| 13-NE | E.amyg | Hh | 17.3 | 3.7 | 63 | 0.05 | 3.7 | 1.4 | 15 | 0.19 | 83 | 3.3 | 2.7 | 3.3 | 42 | 1.55 | 25 | 3.1 | 2.8 | 4.4 |
| 14-NE | E.amyg | Bk | 0.2 | 2 | 31 | 0.01 | 1.5 | 1 | 5 | 0.14 | 5 | 1 | 0.1 | 0.1 | 1 | 0.40 | 5 | 0.1 | 2 | 1.6 |
| 15-NE | E.amyg | Bk | 6.9 | 3.2 | 75 | 0.05 | 3.4 | 2.7 | 33 | 0.30 | 44 | 3.4 | 1.5 | 1.3 | 18 | 1.20 | 35 | 2.7 | 3 | 4.1 |
| 16-NE | E.amyg | Lt | 17.4 | 5 | 92 | 0.06 | 4.9 | 2.2 | 29 | 0.23 | 70 | 3.6 | 1.8 | 1.8 | 19 | 1.05 | 41 | 3.1 | 3.7 | 4.5 |
| 17-NE | E.amyg | Lt | 12.8 | 5 | 90 | 0.07 | 4.8 | 1.8 | 16 | 0.17 | 38 | 2.4 | 1.7 | 1.1 | 15 | 1.55 | 5 | 1.2 | 2.7 | 3 |
| 18-NE | E.amyg | Lt | 16.3 | 5 | 95 | 0.11 | 4.9 | 2.2 | 17 | 0.18 | 97 | 3.6 | 0.7 | 0.7 | 4 | 0.68 | 5 | 0.7 | 4.8 | 5 |
| 19-NE | E.amyg | Lt | 17.3 | 4.5 | 67 | 0.06 | 3.9 | 1.4 | 16 | 0.24 | 60 | 2.5 | 0.5 | 1 | 3 | 0.50 | 24 | 1 | 3.8 | 4.6 |
| 20-NE | E.amyg | Gr | 14.5 | 3.2 | 55 | 0.05 | 3 | 2.7 | 41 | 0.22 | 36 | 3.2 | 0 | 0 | 0 | NA | 0 | 3.8 | 4.2 | |
| 21-NE | E.amyg | Hh | 21.8 | 4.2 | 77 | 0.10 | 4 | 3.3 | 49 | 0.36 | 51 | 3.6 | 1.9 | 1.9 | 23 | 1.63 | 11 | 1.4 | 5 | 4.6 |
| 22-NE | E.amyg | Hh | 4.3 | 3.3 | 51 | 0.04 | 3 | 1.5 | 17 | 0.17 | 29 | 2.2 | 1.6 | 1.6 | 16 | 1.10 | 3 | 1.3 | 1.9 | 2.8 |
| 23-NE | E.amyg | Hh | 4.3 | 2.3 | 30 | 0.03 | 2.1 | 2.3 | 28 | 0.18 | 28 | 2.5 | 1.1 | 0.8 | 9 | 1.21 | 1 | 0.8 | 2 | 2.5 |
| 24-NE | E.amyg | Hh | 21.3 | 4 | 70 | 0.06 | 3.8 | 2.9 | 39 | 0.26 | 62 | 3.9 | 4.2 | 4.5 | 67 | 1.35 | 50 | 4.5 | 3.1 | 5 |
| 25-NE | E.amyg | Hh | 16.5 | 4 | 73 | 0.08 | 3.8 | 4 | 67 | 0.29 | 45 | 4.2 | 3.4 | 3.8 | 48 | 1.25 | 49 | 4.2 | 3 | 5 |
| 26-NE | E.amyg | Bk | 2.5 | 4 | 61 | 0.10 | 3.7 | 3 | 28 | 0.31 | 30 | 3 | 3.2 | 3.6 | 32 | 1.35 | 13 | 2.3 | 2 | 3.7 |
| 31-NE | E.amyg | Bk | 11.8 | 4.7 | 84 | 0.08 | 4.4 | 3.9 | 61 | 0.28 | 53 | 4.3 | 3.6 | 4.8 | 54 | 1.15 | 26 | 3.8 | 3 | 4.9 |
| 32-NE | E.amyg | Bk | 12.8 | 4.9 | 93 | 0.05 | 4.8 | 1.9 | 25 | 0.20 | 69 | 3.5 | 1.9 | 3 | 27 | 0.93 | 35 | 3.2 | 3 | 4.8 |
| 33-NE | E.amyg | Lt | 33.8 | 4.5 | 79 | 0.03 | 3.7 | 1.4 | 13 | 0.16 | 75 | 3 | 0.3 | 0.7 | 2 | 0.58 | 38 | 0.8 | 4.2 | 4.8 |
| 34-NE | E.amyg | Bk | 11.6 | 4.4 | 76 | 0.06 | 4.1 | 2.6 | 37 | 0.24 | 69 | 3.9 | 3.8 | 3.9 | 55 | 1.18 | 25 | 3.9 | 3.1 | 5 |
| 35-NE | E.amyg | Bk | 28.8 | 4.4 | 81 | 0.08 | 4.4 | 3.5 | 54 | 0.36 | 54 | 4.1 | 1.1 | 1.4 | 13 | 1.20 | 37 | 1.5 | 3.5 | 4.2 |
| 36-NE | E.amyg | Lt | 24.8 | 4.1 | 69 | 0.07 | 3.9 | 3.1 | 50 | 0.38 | 46 | 3.8 | 0.5 | 0.8 | 4 | 0.58 | 18 | 0.7 | 3.5 | 4.4 |
| 37-NE | E.amyg | Bk | 14.8 | 4.9 | 94 | 0.10 | 4.9 | 3 | 39 | 0.25 | 77 | 4.1 | 2.2 | 3.4 | 19 | 0.98 | 20 | 2.5 | 3.2 | 4.1 |
| 38-NE | E.amyg | Hh | 25.8 | 4.4 | 76 | 0.06 | 4.1 | 3.4 | 53 | 0.31 | 48 | 3.9 | 1.5 | 2 | 16 | 1.22 | 23 | 2.1 | 2.9 | 3.9 |
| 39-NE | E.amyg | Bk | 28.8 | 4.7 | 84 | 0.04 | 4.2 | 3.2 | 46 | 0.30 | 64 | 4.2 | 3.8 | 4.6 | 57 | 0.98 | 35 | 4.2 | 3.3 | 5 |
| 41-SE | E.tenu | Bk | 8.2 | 2.7 | 50 | 0.07 | 3 | 1.3 | 12 | 0.25 | 92 | 3.2 | 0.6 | 0.7 | 7 | 0.54 | 8 | 0.7 | 1.1 | 3.1 |
| 43-SE | E.tenu | Lt | 27 | 1.4 | 13 | 0.03 | 1.7 | 1.2 | 16 | 0.11 | 43 | 2.6 | 0.8 | 0.8 | 9 | 0.59 | 6 | 0.8 | 1.2 | 2.3 |
| 44-SE | E.tenu | Lt | 4.4 | 1 | 11 | 0.04 | 1.1 | 0.5 | 2 | 0.30 | 5 | 0.5 | 0 | 0 | 0 | 0 | NA | 0 | 1 | 1.4 |
| 45-SE | E.tenu | Hh | 13.2 | 3.5 | 72 | 0.08 | 3.6 | 2.5 | 42 | 0.31 | 62 | 3.6 | 2.5 | 2.3 | 39 | 1.37 | 6 | 1.7 | 2.1 | 3.3 |
| 48-SE | E.tenu | Lt | 15.7 | 2.7 | 60 | 0.06 | 2.8 | 1.6 | 22 | 0.19 | 59 | 3.3 | 0.4 | 0.4 | 4 | 1.09 | 5 | 0.4 | 1.2 | 2.7 |
| 49-SE | E.pulc | Hh | 13.2 | 3.6 | 74 | 0.08 | 3.6 | 3.3 | 60 | 0.40 | 47 | 3.9 | 3.4 | 3.6 | 60 | 1.70 | 10 | 2.3 | 1.2 | 3.8 |
| 51-SE | E.pulc | Gr | 27 | 3.2 | 49 | 0.03 | 2.8 | 2.3 | 31 | 0.24 | 62 | 3.3 | 1.1 | 0.8 | 6 | 1.92 | 3 | 0.8 | 2 | 2.7 |
| 52-SE | E.pulc | Gr | 27 | 3.4 | 52 | 0.06 | 3.2 | 4 | 71 | 0.31 | 51 | 4 | 2.2 | 2.6 | 31 | 1.56 | 3 | 1.5 | 2.8 | 3.3 |
| 53-SE | E.pulc | Hh | 13.2 | 3 | 37 | 0.08 | 3 | 3.9 | 62 | 0.30 | 49 | 4.2 | 2.5 | 3.2 | 32 | 1.18 | 14 | 2.2 | 2 | 3.4 |
| 54-SE | E.pulc | Lt | 23 | 3.4 | 65 | 0.09 | 3.4 | 2.7 | 39 | 0.25 | 31 | 3 | 0.9 | 1.7 | 10 | 0.83 | 8 | 1.1 | 2.2 | 3.3 |
| 55-SE | E.pulc | Gr | 13.2 | 2.1 | 35 | 0.06 | 2.6 | 2.3 | 43 | 0.19 | 29 | 3 | 1.3 | 1.4 | 13 | 0.38 | 5 | 1.2 | 1.8 | 2.8 |
| 56-SE | E.pulc | Gr | 18.5 | 2 | 22 | 0.02 | 1.7 | 3.1 | 48 | 0.20 | 56 | 4 | 0.4 | 0.5 | 4 | 0.88 | 5 | 0.3 | 2.5 | 2.9 |
| 58-SE | E.pulc | Lt | 13.2 | 3.2 | 57 | 0.02 | 2.5 | 2.1 | 29 | 0.38 | 72 | 2.5 | 0 | 0 | 0 | 0 | NA | 0 | 2 | 2.5 |
| 60-SE | E.pulc | Hh | 27 | 3.3 | 54 | 0.04 | 3.1 | 4 | 68 | 0.28 | 65 | 4.6 | 2 | 1.4 | 17 | 2.03 | 3 | 1.3 | 2.9 | 3.7 |
| 62-SE | A.vert | Gr | 9 | 3.3 | 57 | 0.05 | 3.3 | 4 | 69 | 0.28 | 67 | 4.6 | 1.1 | 0.9 | 12 | 1.28 | 5 | 1 | 2.1 | 3.2 |
| 63-SE | A.vert | Gr | 6.3 | 2.4 | 34 | 0.06 | 2.7 | 4 | 77 | 0.30 | 57 | 4.5 | 2.2 | 1.5 | 23 | 1.78 | 6 | 1.5 | 2 | 3.2 |
| 64-SE | A.vert | Gr | 25 | 2.3 | 31 | 0.03 | 2.1 | 3.5 | 58 | 0.24 | 48 | 3.8 | 0.7 | 1.1 | 4 | 0.93 | 2 | 0.7 | 1.9 | 2.9 |
| 65-SE | A.vert | Gr | 5.2 | 3.9 | 70 | 0.03 | 3.1 | 2.1 | 33 | 0.18 | 40 | 2.8 | 0.2 | 0.2 | 1 | 1.13 | 53 | 0.4 | 2.1 | 3.1 |
| 66-SE | A.vert | Gr | 10 | 2.9 | 49 | 0.03 | 2.5 | 2.9 | 46 | 0.29 | 68 | 4.1 | 3 | 3 | 39 | 1.93 | 28 | 3.1 | 2 | 3.7 |
| 67-SE | A.vert | Gr | 5 | 1.8 | 20 | 0.04 | 2 | 3.7 | 67 | 0.29 | 62 | 4.5 | 3.3 | 3.2 | 44 | 1.80 | 13 | 2.5 | 2 | 3.5 |
| 69-SE | A.vert | Gr | 4.4 | 2.6 | 29 | 0.03 | 2.3 | 3 | 43 | 0.29 | 23 | 2.8 | 0.6 | 0.7 | 5 | 0.90 | 4 | 0.5 | 1.7 | 2.7 |
| 70-SE | E.glob | Lt | 16.6 | 3.3 | 52 | 0.05 | 3 | 0.9 | 13 | 0.28 | 56 | 2 | 0 | 0 | 0 | 0 | NA | 0 | 2.9 | 3.3 |
| 71-SE | E.glob | Gr | 28.2 | 4.9 | 87 | 0.08 | 4.6 | 2.9 | 43 | 0.28 | 53 | 3.7 | 1.3 | 2.4 | 13 | 1.06 | 9 | 1.2 | 3.5 | 4.1 |
| 72-SE | E.glob | Gr | 9.9 | 2 | 30 | 0.03 | 2 | 3.9 | 70 | 0.28 | 44 | 4.1 | 0.7 | 1.5 | 5 | 0.54 | 5 | 0.7 | 1.5 | 3 |
| 73-SE | E.glob | Gr | 21.2 | 3.9 | 63 | 0.12 | 3.7 | 3.8 | 57 | 0.29 | 80 | 4.5 | 2.6 | 2.7 | 31 | 1.53 | 10 | 1.8 | 2.7 | 3.6 |
| 74-SE | E.glob | Lt | 19.2 | 3.5 | 74 | 0.08 | 3.7 | 2.5 | 26 | 0.18 | 73 | 3.6 | 1.7 | 2 | 12 | 0.82 | 12 | 1.6 | 3.4 | 4.1 |
| 75-SE | E.glob | Gr | 15.7 | 2.7 | 47 | 0.03 | 2.2 | 2 | 22 | 0.19 | 34 | 2.8 | 2.6 | 2.8 | 15 | 0.57 | 5 | 1.5 | 3 | 2.8 |
| 76-SE | E.glob | Gr | 16.6 | 2.7 | 51 | 0.04 | 2.7 | 1.9 | 33 | 0.24 | 26 | 2 | 0 | 0 | 0 | 0 | NA | 0 | 2.6 | 3.3 |
| 77-SE | E.glob | Lt | 16.6 | 3.3 | 61 | 0.05 | 3.2 | 1.5 | 13 | 0.19 | 29 | 1.8 | 0.1 | 0 | 1 | 2.00 | 5 | 0.1 | 3.1 | 2.9 |
| 78-SE | E.glob | Gr | 4.4 | 1.9 | 19 | 0.03 | 1.8 | 2.4 | 51 | 0.26 | 25 | 2.9 | 1.7 | 1.4 | 27 | 0.01 | 5 | 1.3 | 1.2 | 2.6 |
| 79-SE | E.glob | Gr | 4.4 | 2.3 | 29 | 0.06 | 2.7 | 2.8 | 49 | 0.25 | 33 | 3.3 | 2.8 | 2.4 | 48 | 0.01 | 5 | 1.9 | 2.5 | 3.4 |
| 82-SE | E.amyg | Gr | 25 | 2.6 | 39 | 0.08 | 2.9 | 3.7 | 71 | 0.18 | 21 | 3.1 | 0.4 | 0.4 | 4 | 1.63 | 50 | 0.5 | 2.2 | 2.9 |
| 83-SE | E.amyg | Lt | 22.2 | 2.5 | 51 | 0.03 | 2.3 | 1.9 | 22 | 0.19 | 64 | 3.3 | 1.5 | 3 | 12 | 0.42 | 19 | 2.1 | 2.5 | 3.5 |
| 87-SE | E.amyg | Gr | 3.2 | 1.4 | 14 | 0.03 | 1.6 | 0.9 | 8 | 0.20 | 68 | 1.9 | 0.5 | 0.5 | 4 | 0.53 | 15 | 0.7 | 2 | 2.3 |
| 88-SE | E.amyg | Gr | 12 | 3.5 | 63 | 0.08 | 3.5 | 3.4 | 55 | 0.28 | 43 | 3.9 | 2 | 2.1 | 28 | 0.78 | 6 | 1.5 | 2.1 | 3 |
| 90-SE | E.amyg | Bk | 3.2 | 1.4 | 17 | 0.03 | 1.7 | 0.2 | 2 | 0.23 | 28 | 0.4 | 4.8 | 4.5 | 90 | 1.50 | 25 | 4.4 | 2 | 4.8 |
| 91-SE | E.amyg | Lt | 25 | 4.5 | 76 | 0.06 | 4.2 | 1.8 | 25 | 0.20 | 24 | 2.2 | 0.5 | 0.4 | 4 | 0.52 | 5 | 0.4 | 2.2 | 3.2 |
| 94-SE | E.amyg | Gr | 20 | 3.5 | 73 | 0.08 | 3.6 | 1.8 | 24 | 0.23 | 48 | 3 | 1.2 | 1.4 | 17 | 0.51 | 6 | 1.2 | 2.8 | 3.1 |
| 101-SE | E.amyg | Gr | 4.4 | 1.2 | 10 | 1 | 1.2 | 1.1 | 7 | 12 | 33 | 2.2 | 0.7 | 0.7 | 4 | 49 | 5 | 0.7 | 2 | 1.5 |
| 102-SE | E.tenu | Lt | 8.2 | 2 | 22 | 3 | 2 | 2.4 | 28 | 11 | 22 | 2.2 | 0.1 | 0.2 | 1 | 50 | 5 | 0.1 | 1 | 2.3 |
| 103-SE | E.tenu | Lt | 10 | 1.8 | 25 | 5 | 2.4 | 1.1 | 12 | 15 | 98 | 3.1 | 0.7 | 0.7 | 5 | 35 | 5 | 0.7 | 1.4 | 2.9 |
Appendix D
| Site Identifier | Number |
| Date | |
| Easting | 6 figure grid reference |
| Northing | 7 figure grid reference |
| Datum | Fuel load sites: AGD66/55; FHR sites: GDA94/55 |
| Location | GPS or map, accuracy in metres |
| Altitude | Metres |
| Aspect | Degrees magnetic |
| Slope | Degrees |
| Geology | Geology map followed by field inspection |
| Fire age | Year (month if known), fire history map, oral record, aging using nodes and/or ring counts |
| Tree cover and height | Visual estimate to the nearest 10% and metre |
| vegetation type | Species and cover (Braun-Blanquet index [69]): |
| 1 = <1%, 2 = 1 to 5%, 3 = 5 to 25%, 4 = 25 to 50%, 5 = 50 to 75%, 6 = 75 to 100% |
| Project | Stratum | Variable | Data Recorded | Data Range |
|---|---|---|---|---|
| Fuel load | Surface | cover | projective cover | 0 to 100 |
| depth | centimetres | |||
| Near-surface | cover | projective cover | 0 to 100 | |
| height | centimetres | |||
| Elevated | cover | projective cover | 0 to 100 | |
| height | centimetres | |||
| Fuel hazard rating | Surface | cover | projective cover | 0 to 100 |
| depth | centimetres | |||
| horizontal continuity | category | L, M, H, VH, E | ||
| decomposition state | category | L to VH | ||
| Near-surface | cover | projective cover | 0 to 100 | |
| dead | visual estimate, percent | 0 to 100 | ||
| height | centimetres | |||
| horizontal continuity | category | L, M, H, VH, E | ||
| Elevated | cover | projective cover | 0 to 100 | |
| dead | visual estimate, percent | 0 to 100 | ||
| height | centimetres | |||
| horizontal continuity | category | L, M, H, VH, E | ||
| vertical continuity | category | L, M, H, VH, E | ||
| Bark | bark type | category | fibrous, candle or other | |
| attachment | category | L, M, H, VH, E | ||
| amount | category | L, M, H, VH, E |
References
- Hollis, J.J.; Gould, J.S.; Cruz, M.G.; McCaw, W.L. Framework for an Australian fuel classification to support bushfire management. Aust. For. 2015, 78, 1–17. [Google Scholar] [CrossRef]
- Cruz, M.G.; Gould, J.S.; Hollis, J.J.; McCaw, W.L. A hierarchical classification of wildland fire fuels for Australian vegetation types. Fire 2018, 1, 13. [Google Scholar] [CrossRef] [Green Version]
- Cruz, M.G.; Gould, J.S.; Alexander, M.E.; Sullivan, A.L.; McCaw, W.L.; Matthews, S. Empirical-based models for predicting head-fire rate of spread in Australian fuel types. Aust. For. 2015, 78, 118–158. [Google Scholar] [CrossRef]
- Cruz, M.G.; Sullivan, A.L.; Gould, J.S.; Hurley, R.J.; Plucinski, M.P. Got to burn to learn: The effect of fuel load on grassland fire behaviour and its management implications. Int. J. Wildland Fire 2018, 27, 727–741. [Google Scholar] [CrossRef]
- Luke, R.H.; McArthur, A.G. Bushfires in Australia; Australian Government Publishing Service: Canberra, Australia, 1978.
- Tolhurst, K.G.; Cheney, N.P. Synopsis of the Knowledge Used in Prescribed Burning in Victoria; Fire Management Branch, Department of Natural Resources and Environment: Melbourne, Australia, 1999.
- Sneeuwjagt, R.J.; Peet, G.B. Forest Fire Behaviour Tables for Western Australia; Department of Conservation and Land Management: Perth, Australia, 1985.
- Gould, J.S. Prescribed burning in coastal regrowth E. sieberi forest. In The Burning Question: Fire Management in New South Wales; Ross, J., Ed.; University of New England: Armidale, Australia, 1993. [Google Scholar]
- Gould, J.S.; McCaw, W.L.; Cheney, N.P.; Ellis, P.F.; Knight, I.K.; Sullivan, A.L. Project Vesta—Fire in Dry Eucalypt Forest: Fuel Structure, Fuel Dynamics and Fire Behaviour; Ensis-CSIRO: Canberra, Australia; Department of Environment and Conservation: Perth, Australia, 2007.
- Gould, J.S.; McCaw, W.L.; Cheney, N.P.; Ellis, P.F.; Matthews, S. Field Guide: Fuel Assessment and Fire Behaviour Prediction in Dry Eucalypt Forest; Ensis-CSIRO: Canberra, Australia; Department of Environment and Conservation: Perth, Australia, 2007.
- Cheney, N.P.; Gould, J.S.; McCaw, W.L.; Anderson, W.R. Predicting fire behaviour in dry eucalypt forest in southern Australia. For. Ecol. Manag. 2012, 280, 120–131. [Google Scholar] [CrossRef]
- McCaw, W.L.; Gould, J.S.; Cheney, N.P.; Ellis, P.F.M.; Anderson, W.R. Changes in behaviour of fire in dry eucalypt forest as fuel increases with age. For. Ecol. Manag. 2012, 271, 170–181. [Google Scholar] [CrossRef]
- Byram, G.M. Chapter 3: Forest fire—Control and use. In Combustion of Forest Fuels; Davis, K.P., Byram, G.M., Krumm, W.R., Eds.; McGraw-Hill: New York, NY, USA, 1959. [Google Scholar]
- Hines, F.; Tolhurst, K.G.; Wilson, A.A.G.; McCarthy, G.J. Overall Fuel Hazard Assessment Guide, 4th ed.; Report 82; Victorian Government Department of Sustainability and Environment: Melbourne, Australia, 2010.
- Department for Environment and Heritage (DEH). Overall Fuel Hazard Guide for South Australia, 2nd ed.; Department for Environment and Heritage (DEH): Adelaide, Australia, 2012. [Google Scholar]
- McArthur, A.G. Leaflet 80. Control Burning in Eucalypt Forests; Commonwealth of Australia, Forestry and Timber Bureau, Forest Research Institute: Canberra, Australia, 1962. [Google Scholar]
- McArthur, A.G. Fire Behaviour in Eucalypt Forests; Forestry and Timber Bureau Leaflet 107; Commonwealth of Australia: Canberra, Australia, 1967. [Google Scholar]
- McArthur, A.G. Forest Fire Danger Meter, Mark 5; Forest Research Institute, Forestry and Timber Bureau: Canberra, Australia, 1973. [Google Scholar]
- Noble, I.R.; Bary, G.A.V.; Gill, A.M. McArthur’s fire—Danger meters expressed as equations. Aust. J. Ecol. 1980, 5, 201–203. [Google Scholar] [CrossRef]
- Cruz, M.G.; Cheney, N.P.; Gould, J.S.; McCaw, W.L.; Kilinc, M.; Sullivan, A.L. An empirical-based model for predicting the forward spread rate of wildfires in eucalypt forests. Int. J. Wildland Fire 2022, 31, 81–95. [Google Scholar] [CrossRef]
- Tolhurst, K.G.; Chong, D.M.; Pitts, A. PHOENIX—A Dynamic Fire Characterization Simulation Tool; Bushfire Cooperative Research Centre: Melbourne, Australia, 2007. [Google Scholar]
- Tolhurst, K.G.; Shields, B.; Chong, D. PHOENIX: Development and application of a bushfire risk management tool. Aust. J. Emerg. Manag. 2008, 23, 47–54. [Google Scholar]
- Swedosh, W.; Hilton, J.; Miller, C. Spark Evaluation—0.9.7: Comparison of Wildfire Rate of Spread Models Implemented within the Spark Framework to Historical Reconstructions of Wildfire Events; CSIRO: Canberra, Australia, 2018.
- Hilton, J.E.; Swedosh, W.; Hetherton, L.; Sullivan, A.; Prakash, M. Spark User Guide 1.1.2.; CSIRO: Canberra, Australia, 2019.
- Hilton, J.E. Spark—A Bushfire Modelling Toolkit; CSIRO: Canberra, Australia, 2019.
- Hollis, J.J.; Matthews, S.; Grootemaat, S.; Fox-Hughes, P.; Kenny, B.; Sauvage, S. Defining a meaningful framework for the Australian Fire Danger Rating System Research prototype. In Proceedings of the 6th International Fire Behaviour and Fuels Conference, Sydney, Australia, 29 April–3 May 2019; International Association of Wildland Fire: Missoula, MT, USA, 2019. [Google Scholar]
- Matthews, S.; Sauvage, S.; Grootemaat, S.; Hollis, J.J.; Kenny, B.; Fox-Hughes, P. Implementation of models and the forecast system for the Australian Fire Danger Rating System. In Proceedings of the 6th International Fire Behaviour and Fuels Conference, Sydney, Australia, 29 April–3 May 2019; International Association of Wildland Fire: Missoula, MT, USA, 2019. [Google Scholar]
- AS3958:2018; Bushfire Attack Level. Construction of Buildings in Bushfire-Prone Areas. Standards Australia: Sydney, Australia, 2018.
- Marsden-Smedley, J.B.; Anderson, W.R. Fuel load and fuel hazard prediction in Tasmanian dry forests. In Proceedings of the School of Geography & Environmental Studies Conference 2011, Hobart, Australia, 28–29 June 2011; Tasmanian Fire Research Fund, Parks and Wildlife Service: Hobart, Australia, 2011. [Google Scholar]
- Peet, G.B. Litter accumulation in Jarrah and Karri forests. Aust. For. 1971, 35, 258–262. [Google Scholar] [CrossRef]
- Raison, R.J.; Woods, P.V.; Khanna, P.K. Dynamics of fire fuels in recurrently burnt eucalypt forest. Aust. For. 1983, 46, 294–302. [Google Scholar] [CrossRef]
- O’Connell, A.M. Litter dynamics in Karri (Eucalyptus diversicolor) forests of south-western Australia. J. Ecol. 1987, 75, 781–796. [Google Scholar] [CrossRef]
- Burrows, N.D. Experimental Development of a Fire Management Model for Jarrah (Eucalyptus marginata Donn ex Sm.) Forest. Ph.D. Thesis, Australian National University, Canberra, Australia, 1994. [Google Scholar]
- McCaw, W.L.; Neal, J.E.; Smith, R.H. Fuel accumulation following prescribed burning in young even-aged stands of karri (Eucalyptus diversicolor). Aust. For. 1996, 59, 171–177. [Google Scholar] [CrossRef]
- Gould, J.S.; McCaw, W.L.; Cheney, N.P. Quantifying fine fuel dynamics and structure in dry eucalypt forest (Eucalyptus marginata) in Western Australia for fire management. For. Ecol. Manag. 2011, 262, 531–546. [Google Scholar] [CrossRef]
- Van Loon, A.P. Bushland Fuel Quantities in the Blue Mountains: Litter and Understorey; Research Note 33; Forest Commission of New South Wales: Sydney, Australia, 1977.
- Fox, B.J.; Fox, M.D.; McKay, G.M. Litter accumulation after fire in a eucalypt forest. Aust. J. Bot. 1979, 27, 157–165. [Google Scholar] [CrossRef]
- Walker, J. Fuel dynamics in Australian forests. In Fire and the Australian Biota; Gill, A.M., Groves, R.H., Noble, I.R., Eds.; Australian Academy of Science: Canberra, Australia, 1981. [Google Scholar]
- Watson, P.J.; Penman, S.; Horsey, B. Bushfire Fuels in NSW Forests and Grassy Woodlands; Fuels Modelling Project Final Report for the NSW Rural Fire Service and Centre for Environmental Risk Management of Bushfires; University of Wollongong: Wollongong, Australia, 2012. [Google Scholar]
- Fensham, R.J. The management implications of fine fuel dynamics in bushlands surrounding Hobart, Tasmania. J. Environ. Manag. 1992, 36, 301–320. [Google Scholar] [CrossRef]
- Neyland, M.; Askey-Doran, M. Effects of repeated fires on dry sclerophyll (E. sieberi) forests in eastern Tasmania. In Fire and Biodiversity: The Effects and Effectiveness of Fire Management. Proceedings of a Conference Held 8 and 9 October 1994, Footscray, Melbourne, Victoria; Department of the Environment, Sport and Territories, Biodiversity Unit: Canberra, Australia, 1994. [Google Scholar]
- Marsden-Smedley, J.B.; Catchpole, W.R. Fire modelling in Tasmanian buttongrass moorlands. I. Fuel characteristics. Int. J. Wildland Fire 1995, 5, 203–214. [Google Scholar] [CrossRef]
- Leonard, S. Predicting sustained fire spread in Tasmanian native grasslands. Environ. Manag. 2009, 44, 430–440. [Google Scholar] [CrossRef]
- Bresnehan, S.J. An Assessment of Fuel Characteristics and Fuel Loads in Dry Sclerophyll Forests in South-East Tasmania. Ph.D. Thesis, School of Geography and Environmental Studies, University of Tasmania, Hobart, Australia, 2003. [Google Scholar]
- Bresnehan, S.J.; Pyrke, A.F. Dry Forest Fuels in South-East Tasmania: Field Prediction Guide; Parks and Wildlife Service, Forestry Tasmania, Tasmania Fire Service and Hobart City Council: Hobart, Australia, 1998. [Google Scholar]
- McCarthy, G.J.; Tolhurst, K.G.; Chatto, K. Overall Fuel Hazard Guide; Fire Management Research Report 47; Department of Natural Resources and Environment: Melbourne, Australia, 1999.
- De Salas, M.F.; Baker, M.L. A Census of the Vascular Plants of Tasmania, Including Macquarie Island; Tasmanian Herbarium, Tasmanian Museum and Art Gallery, Department of State Growth: Hobart, Australia, 2021. [Google Scholar]
- TasVeg3. TasVeg; Version 3; Tasmanian Vegetation Monitoring and Mapping Program, Resource Management and Conservation Division, Department of Primary Industries and Water: Hobart, Australia, 2016.
- Marsden-Smedley, J.B.; Rudman, T.; Catchpole, W.R.; Pyrke, A.F. Buttongrass moorland fire behaviour prediction and management. TasForests 1999, 11, 87–107. [Google Scholar]
- Forsyth, S.M.; Clarke, M.J.; Calver, C.R.; McClenaghan, M.P.; Corbett, K.D. Geology of Southeast Tasmania. In Geological Atlas 1:250,000 Digital Series; Mineral Resources Tasmania: Hobart, Australia, 1995. [Google Scholar]
- Forsyth, S.M.; Clarke, M.J.; Calver, C.R.; McClenaghan, M.P.; Corbett, K.D. Geology of Northeast Tasmania. In Geological Atlas 1:250,000 Digital Series; Mineral Resources Tasmania: Hobart, Australia, 1995. [Google Scholar]
- McDonald, R.C.; Isbell, R.F.; Speight, J.G.; Walker, J.; Hopkins, M.S. Australian Soil and Land Survey Handbook, 2nd ed.; CSIRO: Canberra, Australia, 1998.
- Olson, J.S. Energy storage and the balance of producers and decomposers in ecological systems. Ecology 1963, 44, 322–332. [Google Scholar] [CrossRef] [Green Version]
- Davis, M. The Effectiveness of Planned Burning in Removing Fuel Hazard in Dry Eucalypt Forests. Ph.D. Thesis, School of Geography and Environmental Studies, University of Tasmania, Hobart, Australia, 2010. [Google Scholar]
- R Core Team. R: A Language and Environment for Statistical Computing; R Foundation for Statistical Computing: Vienna, Austria, 2021. [Google Scholar]
- Byrd, R.H.; Lu, P.; Nocedal, J. A limited memory algorithm for bound constrained optimization. SIAM J. Sci. Comput. 1995, 16, 1190–1208. [Google Scholar] [CrossRef]
- Shapiro, S.S.; Wilk, M.B. An analysis of variance test for normality. Biometrika 1965, 52, 591–611. [Google Scholar] [CrossRef]
- Akaike, H. A new look at the statistical model identification. IEEE Trans. Autom. Control. 1974, 19, 716–723. [Google Scholar] [CrossRef]
- Levene, H. Robust tests for equality of variances. In Contributions to Probability and Statistics: Essays in Honor of Harold Hotelling; Olkin, I., Hotelling, H., Eds.; Stanford University Press: Redwood City, CA, USA, 1960; pp. 278–292. [Google Scholar]
- Willmott, C.J. Some comments on the evaluation of model performance. Bull. Am. Meteorol. Soc. 1982, 63, 1309–1313. [Google Scholar] [CrossRef] [Green Version]
- Efron, B.; Tibshirani, R.J. An Introduction to the Bootstrap; Chapman and Hall: Boca Raton, FL, USA, 1993. [Google Scholar]
- Nelder, J.A.; Mead, R. A simplex algorithm for function minimization. Comput. J. 1965, 7, 308–313. [Google Scholar] [CrossRef]
- Tukey, J. Comparing individual means in the analysis of variance. Biometrics 1949, 5, 99–114. [Google Scholar] [CrossRef] [PubMed]
- Keith, D. Ocean Shores to Desert Dunes: The Native Vegetation of New South Wales and the ACT; Department of Environment and Conservation: Hurstville, Australia, 2004.
- Chatzopoulos-Vouzoglanis, K.; Reinke, K.J.; Mariela Soto-Berelov, M.; Chermelle Engel, C.; Jones, S.D. Comparing geostationary and polar-orbiting satellite sensor estimates of Fire Radiative Power (FRP) during the Black Summer Fires (2019–2020) in south-eastern Australia. Int. J. Wildland Fire 2022, 31, 572–585. [Google Scholar] [CrossRef]
- Gibson, R.; Danaher, T.; Hehir, W.; Collins, L. A remote sensing approach to mapping fire severity in south-eastern Australia using sentinel 2 and random forest. Remote Sens. Environ. 2020, 240, 111702. [Google Scholar] [CrossRef]
- McKinley, J. Determining Transitions in Fuel Hazard in Tasmania’s Lowland Heathlands. Ph.D. Thesis, School of Geography and Environmental Studies, University of Tasmania, Hobart, Australia, 2011. [Google Scholar]
- Marsden-Smedley, J.B. Tasmanian Wildfires January–February 2013: Forcett-Dunalley, Repulse, Bicheno, Giblin River, Montumana, Molesworth and Gretna; Report Prepared for the Tasmania Fire Service and the Bushfire Co-Operative Research Centre; Bushfire CRC: Melbourne, Australia, 2014. [Google Scholar]
- Mueller-Dombois, D.; Ellenberg, H. Aims and Methods of Vegetation Ecology; John Wiley and Sons: New York, NY, USA, 1974. [Google Scholar]


| NE Sites | SE Sites | All Sites | |||||||
|---|---|---|---|---|---|---|---|---|---|
| Variable | Mean | Min | Max | Mean | Min | Max | Mean | Min | Max |
| Age, Years | 12.39 | 0.74 | 27.65 | 9.77 | 0.10 | 29.50 | 11.07 | 0.10 | 29.50 |
| Surface fuel load | |||||||||
| cover, % | 81.53 | 28.50 | 97.75 | 76.12 | 30.00 | 100.00 | 78.80 | 28.50 | 100.00 |
| Depth, m | 0.0195 | 0.0039 | 0.0353 | 0.022 | 0.0116 | 0.0366 | 0.0208 | 0.0039 | 0.0366 |
| Load, kg m−2 | 0.825 | 0.157 | 1.657 | 0.592 | 0.095 | 1.348 | 0.708 | 0.095 | 1.657 |
| Near-surface fuel load | |||||||||
| cover, % | 35.86 | 7.63 | 65.75 | 58.07 | 0.00 | 100.00 | 47.05 | 0.00 | 100.00 |
| Height, m | 0.3151 | 0.1513 | 0.5325 | 0.1879 | 0.05 | 0.4225 | 0.2511 | 0.05 | 0.5325 |
| Live load, kg m−2 | 0.114 | 0.005 | 0.319 | 0.125 | 0.006 | 0.279 | 0.12 | 0.005 | 0.319 |
| Dead load, kg m−2 | 0.246 | 0.012 | 0.661 | 0.071 | 0.014 | 0.298 | 0.158 | 0.012 | 0.661 |
| Load, kg m−2 | 0.36 | 0.025 | 0.894 | 0.197 | 0.059 | 0.574 | 0.278 | 0.025 | 0.894 |
| Elevated fuel load | |||||||||
| cover, % | 1.59 | 0 | 6.5 | 24.31 | 0 | 80 | 13.03 | 0 | 80 |
| Height, m | 1.216 | 0 | 4 | 0 | 0 | 0 | 2.498 | 0.85 | 6.8 |
| Live load, kg m−2 | - | - | - | 0.085 | 0 | 0.304 | 0.061 | 0 | 0.304 |
| Dead load, kg m−2 | - | - | - | 0.05 | 0 | 0.236 | 0.035 | 0 | 0.236 |
| Load, kg m−2 | - | - | - | 0.135 | 0 | 0.462 | 0.096 | 0 | 0.462 |
| Total load, kg m−2 | 1.185 | 0.252 | 1.946 | 0.923 | 0.206 | 1.769 | 1.053 | 0.206 | 1.946 |
| NE Sites | SE Sites Except Allocasurina | All Sites | |||||||
|---|---|---|---|---|---|---|---|---|---|
| Variable | Mean | Min | Max | Mean | Min | Max | Mean | Min | Max |
| Age | 16.89 | 0.20 | 33.81 | 15.38 | 3.18 | 28.22 | 15.43 | 0.20 | 33.81 |
| Surface FHR | |||||||||
| continuity | 4.16 | 2.00 | 5.00 | 2.84 | 1.00 | 4.90 | 3.43 | 1.00 | 5.00 |
| Cover, % | 73.67 | 30.00 | 94.50 | 47.32 | 10.00 | 87.00 | 58.90 | 10.00 | 94.50 |
| Depth, m | 0.0595 | 0.001 | 0.105 | 0.0536 | 0.013 | 0.120 | 0.0545 | 0.010 | 0.120 |
| Rating | 3.93 | 1.53 | 4.90 | 2.72 | 1.13 | 4.60 | 3.25 | 1.13 | 4.90 |
| Near-surface FHR | |||||||||
| continuity | 2.56 | 1.00 | 4.10 | 2.36 | 0.50 | 4.00 | 2.54 | 0.50 | 4.10 |
| Cover, % | 34.86 | 5.00 | 69.50 | 34.82 | 2.25 | 70.50 | 36.94 | 2.25 | 76.50 |
| Dead, % | 53.39 | 4.50 | 96.50 | 48.22 | 5.00 | 98.00 | 51.43 | 4.50 | 98.00 |
| Rating | 3.42 | 1.00 | 4.98 | 2.98 | 0.35 | 4.58 | 3.26 | 0.35 | 4.98 |
| Combined surface and near-surface FHR | |||||||||
| rating | 4.62 | 1.70 | 5.00 | 3.99 | 1.60 | 5.00 | 4.33 | 1.60 | 5.00 |
| Elevated FHR | |||||||||
| horizontal continuity | 1.81 | 0.00 | 4.20 | 1.19 | 0.00 | 3.40 | 1.53 | 0.00 | 4.20 |
| Vertical continuity | 2.19 | 0.00 | 5.00 | 1.37 | 0.00 | 3.60 | 1.77 | 0.00 | 5.00 |
| Cover, % | 23.47 | 0.00 | 67.00 | 13.20 | 0.00 | 59.50 | 18.80 | 0.00 | 67.00 |
| Dead, % | 27.03 | 0.71 | 61.50 | 7.03 | 2.78 | 18.50 | 17.51 | 0.71 | 61.50 |
| Rating | 2.24 | 0.00 | 4.88 | 1.07 | 0.00 | 4.37 | 1.62 | 0.00 | 4.88 |
| Bark FHR | |||||||||
| rating | 3.24 | 1.90 | 5.00 | 2.12 | 1.00 | 3.50 | 2.61 | 1.00 | 5.00 |
| Overall FHR | |||||||||
| rating | 4.26 | 1.60 | 5.00 | 3.05 | 1.40 | 4.80 | 3.60 | 1.40 | 5.00 |
| Horizontal | Vertical | ||||
|---|---|---|---|---|---|
| Continuity | Continuity | Cover | Height | Dead % | |
| Surface | 0.50 | 0.25 | 0.25 | ||
| Near-surface | 0.25 | 0.25 | 0.50 | ||
| Elevated | 0.25 | 0.10 | 0.15 | 0.50 |
| Region | Species or Understorey | n | k | |
|---|---|---|---|---|
| NE | E. amygdalina and E. sieberi | 45 | 1.54 (0.06) | 0.19 (0.03) |
| NE | E. obliqua | 21 | 1.27 (0.07) | 0.26 (0.07) |
| NE | All NE eucalyptus species combined | 66 | 1.45 (0.05) | 0.21 (0.03) |
| SE | E. amygdalina and E. tenuiramis | 30 | 1.10 (0.09) | 0.13 (0.02) |
| SE | E. globulus/viminalis | 11 | 1.35 (0.14) | 0.13 (0.02) |
| SE | E. pulchella | 14 | 1.55 (0.12) | 0.13 (0.02) |
| SE | A. verticillata | 8 | 1.27 (0.18) | 0.29 (0.14) |
| SE | All SE eucalypt species combined | 59 | 1.25 (0.10) | 0.12 (0.03) |
| Region | Species | RMSE | MAE | MBE |
|---|---|---|---|---|
| (kg m−2) | (kg m−2) | (kg m−2) | ||
| NE | E. amygdalina/E. sieberi and E. obliqua | 0.20 | 0.17 | 0.00 |
| NE | All NE eucalypt species combined | 0.22 | 0.18 | 0.00 |
| SE | E. globulus/viminalis, E. pulchella and E. amygdalina/tenuiramis | 0.22 | 0.17 | −0.0 1 |
| SE | A. verticillata | 0.24 | 0.23 | −0.03 |
| SE | All SE eucalypt species combined | 0.24 | 0.18 | −0.01 |
| Component | Understorey | Metric | n | c | m1 | m2 | m |
|---|---|---|---|---|---|---|---|
| Elevated load | Litter/grassy | kg m−2 | 39 | 9.0 | 0.02 (0.01) | 0.05 (0.01) | |
| Elevated load | Heathy | kg m−2 | 19 | 5.9 | 0.04 (0.01) | 0.08 (0.01) | |
| Elevated load | Overall | kg m−2 | 58 | 8.6 | 0.03 (0.01) | 0.06 (0.01) | |
| Near surface height | Litter | m | 18 | 0.26 (0.01) | |||
| Near surface height | Grassy/bracken/heathy | m | 44 | 0.21 (0.01) | |||
| Near surface height | Overall | m | 62 | 0.25 (0.01) | |||
| Elevated height | Litter/grassy | m | 30 | 0.83 (0.08) | |||
| Elevated height | Bracken/heathy | m | 27 | 8.8 | 0.97 (0.12) | 1.29 (0.06) | |
| Elevated height | Overall | m | 57 | 11.5 | 0.74 (0.11) | 1.11 (0.06) | |
| Average height | Litter/grassy | m | 30 | 0.15 (0.02) | |||
| Average height | Bracken/heathy | m | 27 | 8.2 | 0.21 (0.10) | 0.62 (0.06) | |
| Average height | Overall | m | 57 | 11.1 | 0.15 (0.07) | 0.39 (0.04) |
| Fuel Component | Understorey | RMSE | MAE | MBE |
|---|---|---|---|---|
| (kg m−1) | (kg m−1) | (kg m−1) | ||
| Elevated load | Litter/grassy | 0.02 | 0.01 | 0 |
| Elevated load | Heathy | 0.04 | 0.03 | 0 |
| Elevated load | Overall | 0.03 | 0.02 | 0 |
| (m) | (m) | (m) | ||
| Near surface height | Litter | 0.06 | 0.05 | 0 |
| Near surface height | Grassy/bracken/heathy | 0.06 | 0.05 | 0 |
| Near surface height | Overall | 0.06 | 0.05 | 0 |
| Elevated height | Litter/grassy | 0.44 | 0.34 | 0 |
| Elevated height | Bracken/heathy | 0.30 | 0.24 | 0 |
| Elevated height | Overall | 0.40 | 0.33 | 0 |
| Average height | Litter/grassy | 0.13 | 0.09 | 0 |
| Average height | Bracken/heathy | 0.26 | 0.20 | 0 |
| Average height | Overall | 0.28 | 0.23 | 0 |
| Group | Fuel Hazard Stratum | n | k | ||
|---|---|---|---|---|---|
| NE sites | Surface | 32 | 4.2 (0.2) | 0.24 (0.09) | 1.5 (0.6) |
| SE sites | Surface | 30 | 3.4 (0.3) | 0.14 (0.04) | 0 |
| NE/SE sites | Near-surface | 62 | 3.6 (0.1) | 0.25 (0.05) | 0 |
| Litter | Near-surface | 18 | 3.2 (0.3) | 0.16 (0.06) | 0 |
| Grass | Near-surface | 17 | 3.5 (0.2) | 0.28 (0.07) | 0 |
| Heath/bracken | Near-surface | 27 | 4.1 (0.1) | 0.20 (0.05) | 1.0 (0.4) |
| NE sites | Combined surface and near-surface | 32 | 4.9 (0.1) | 0.36 (0.08) | 1.7 (0.4) |
| SE sites | Combined surface and near-surface | 30 | 4.6 (0.2) | 0.21 (0.04) | 0 |
| NE sites | Bark | 32 | 3.9 (0.4) | 0.10 (0.05) | 1.6 (0.4) |
| SE sites | Bark | 30 | 5 | 0.02 (0.00) | 1.0 (0.3) |
| NE sites | Overall | 32 | 4.7 (0.2) | 0.17 (0.05) | 1.6 (0.5) |
| SE sites | Overall | 30 | 3.5 (0.1) | 0.22 (0.04) | 0 |
| Fuel Hazard Stratum | RMSE | MAE | MBE |
|---|---|---|---|
| NE surface | 0.57 | 0.45 | 0.00 |
| SE surface | 0.61 | 0.51 | 0.01 |
| NE/SE near-surface | 0.70 | 0.55 | 0.01 |
| Litter near-surface | 0.65 | 0.55 | −0.01 |
| Grass near-surface | 0.57 | 0.50 | −0.01 |
| Heath/bracken near-surface | 0.40 | 0.34 | 0.00 |
| NE combined surface and near-surface | 0.37 | 0.24 | 0.00 |
| SE combined surface and near-surface | 0.60 | 0.53 | 0.00 |
| NE bark | 0.52 | 0.42 | 0.00 |
| SE bark | 0.54 | 0.45 | 0.00 |
| NE overall | 0.49 | 0.39 | 0.00 |
| SE overall | 0.42 | 0.35 | 0.00 |
Publisher’s Note: MDPI stays neutral with regard to jurisdictional claims in published maps and institutional affiliations. |
© 2022 by the authors. Licensee MDPI, Basel, Switzerland. This article is an open access article distributed under the terms and conditions of the Creative Commons Attribution (CC BY) license (https://creativecommons.org/licenses/by/4.0/).
Share and Cite
Marsden-Smedley, J.B.; Anderson, W.R.; Pyrke, A.F. Fuel in Tasmanian Dry Eucalypt Forests: Prediction of Fuel Load and Fuel Hazard Rating from Fuel Age. Fire 2022, 5, 103. https://doi.org/10.3390/fire5040103
Marsden-Smedley JB, Anderson WR, Pyrke AF. Fuel in Tasmanian Dry Eucalypt Forests: Prediction of Fuel Load and Fuel Hazard Rating from Fuel Age. Fire. 2022; 5(4):103. https://doi.org/10.3390/fire5040103
Chicago/Turabian StyleMarsden-Smedley, Jon B., Wendy R. Anderson, and Adrian F. Pyrke. 2022. "Fuel in Tasmanian Dry Eucalypt Forests: Prediction of Fuel Load and Fuel Hazard Rating from Fuel Age" Fire 5, no. 4: 103. https://doi.org/10.3390/fire5040103