1. Introduction
Although the wildland-urban interface (WUI) is not a new matter, fires in WUI communities have suddenly increased in frequency [
1]. The impacts of growing wildfire have been recorded over the past few decades [
2,
3] and are expected to increase in intensity due to climate change in different parts of the world.
Wildfire management at the wildland-urban interface (WUI) is becoming more challenging due to expanding development of human inhabitation and sharp growth of land use. This creates substantial wildfire risk to households located at these areas, as combustible grasslands are susceptible to encounter infrastructure. This condition increases the impact of wildfires on structures, especially with fast moving wildfires which makes devising the action plans more difficult.
The key point in understanding the problem and finding an appropriate solution is to deal with the aerodynamic behaviour of the flow around the built area, the rate of spread of the fire and its relation to fuel which is directly linked with the intensity of the fire. All such parameters, more or less, play a role in alleviating the impacts of wind driven wildfires on the wildland-urban interface secretions.
Depending on the exposure conditions, structures may ignite as wildfire spreads toward a WUI community [
4]. Accordingly, understanding the wind effect on the wildland-urban interface is an important criterion in predicting fire behaviour. By far, there are no experimental studies investigating the combined effect of fire and wind on structures. However, some researchers such as Richards et al. [
5] have reported an experimental and numerical investigation on the mean pressure of a cube-shaped building to obtain important sets of information about the aerodynamic behaviour of a building in the wind flow without the presence of fire. Hostikka et al. [
6] investigated the fire behaviour at the wildland-urban interface, focusing on the numerical simulation, and shed a light on understanding the thermal impact of bushfires on buildings. Their findings indicate that a mesh size of 0.25 m is appropriate for thermal radiation numerical simulations. The authors found that mirror boundaries in the computational domain on the sides of the fire front are practical and valid for decreasing the computational cost. Fryanova and Perminov [
7] studied the impact of fire intensity and wind speed on the ignition probability of building structures. In the study, the crown fire is found as a heat source which was measured by the empirical data of gas velocity and mean crown fire temperature, dependent on fire intensity values. The thermal and hydrodynamic effects of wind flow on buildings were explored. The effect of fire-wind interaction on structures was investigated by Ghodrat et al. [
8]. In this study, wind direction, terrain slope angle, and the impact of wind on fire modelling, were analysed. Additionally, the impact of the transmission of a fire from a wildfire to a wildland-urban interface (WUI) is explored. The authors claimed that at the wildland-urban interface (WUI), both fuels of structure and wildland can be combined, and simulations of this regime must consider the coupling effects between structural and wildland fuels. The wind and buoyancy force effects on the fire intensity were highlighted by Frangieh et al. [
9]. In the study, a three-dimensional structure of a fire was investigated numerically on laboratory and field scales. In the study, the unsteady RANS approach and a Large Eddy Simulation were applied to simulate the reactive turbulent flow.
Mell et al. [
10] studied the wildland-urban interface phenomenon and their challenges and reported that fire behaviour can be predicted in a near realistically broad range by physics-based models under a variety of atmospheric and terrain slope conditions. These models with supporting experimental data proved to be very useful in developing risk assessment and mitigation strategies for realistic wildland-urban interface (WUI) fuels and environmental conditions.
Ambient wind conditions also play a major role in fire spread, fire intensity and flame features [
11]. Clark et al. [
12] assessed the interactions between prevalent fire behaviour and fire intensity, canopy fuels, and above-canopy turbulence and energy fluxes. They investigated the fire behaviour and consumption of the fuel in wildfires linked to turbulence and energy fluxes and found that higher-intensity head fires lead to larger consumption of shrubs and canopy fuels, but they are also estimated a large increase in the turbulence and heat flux above the canopy.
Edalati-nejad et al. [
13], investigated the effect of wind and terrain slope on fire and their impact on structures. In the study, a time-related simulation was performed to investigate the effect of wind-driven fire on a structure placed on inclined terrain. Various upslope terrain angles of 0, 10, 20, and 30° at different velocities of wind were simulated by FireFoam, a solver of OpenFOAM software. The result showed that at a constant heat release rate and wind velocity, increasing the terrain slope leads to raise in the higher temperature areas near the building. The experimental studies including empirical fires and employed fuels were reported in detail by Ghodrat et al. [
14]. In their work, the latest data are reviewed, and prospective pathways are provided. An investigation on the wind flow and fire spread dynamics in a sloped terrain was performed by Abouali et al. [
15]. In the work, both computational and experimental studies were conducted. The authors acknowledged that wind, fuel and terrain topography are the dominant factors affecting wildfire behaviour, in which their physical interactions cause unexpected fire behavior. The influence of fuel, weather and fire shape on fire-spread in grasslands was studied by Cheney et al. [
16]. In the study, it was concluded that even though wind is important for grass fires, fuel load is the primary determinant of fire intensity. A numerical study and empirical measurement of flame geometry and potential of crown fire initiation in wildfire propagation was conducted by Morvan [
17]. The author reported a generalized ignition of the canopy, resulting in a substantial growth of fire intensity by radiation heat transfer between the flame and the canopy as a fuel. It is also shown that the most efficient way to reduce intensity of surface fire and hence reducing the risk of converting surface fire to crown fire is to decrease fire intensity. This can be achieved by cutting off the surface biomass piled up on the ground partially or completely.
An improvement in wildfire modelling was conducted by El Houssami et al. [
18]. In the investigation, an experimental and numerical study was conducted to analyse the performance of different sub-models and constraints to describe the flaming dynamics of wildfires. Their results showed a good agreement between the predicted mass loss rates and heat release rates for the used sub-model.
It is widely known that wind, fuel moisture content, fuel load, and terrain slope are the key factors influencing the behaviour of wildfires. The level of impact of a wildfire on the environment largely depends on the intensity with which the fire burns [
19]. Wildfire intensity is defined by three key parameters: the weather conditions (current and forebear), the topography of the area, and the fuel load and type [
16,
20]. Particularly, once other influences such as fuel moisture are equivalent, a larger amount of fuel leads to greater fire intensity [
21]. Therefore, fuel load management is a key component in wildfire alleviation practice [
22].
Fuel moisture content (FMC) is a central element influencing the intensity of a fire [
23], as it regulates the terms of ignition, the amount of fuel burned and the combustion rates of various categories of fuel [
24]. By increasing the fuel moisture content, the fire intensity decreases; this can be explained by the massive release of water vapor ahead of the fire that effectively results in a reduction in oxygen supply to the fire-front [
24], also changing the phase of the water, so the vapor needs a huge amount of heat load due to its high value of specific vaporization heat. The effect of fire intensity on live fuel fire was investigated by Trollope and Tainton [
25]. The results indicate that fire intensities more than 3.5 MW/m cannot be controlled. Morvan [
23] used a 2D physics-based FIRESTAR2D model to explore the behaviour of surface fire spread and to find out how moisture content of the fuel, which is directly associated with the intensity of the fire, can affect this behaviour. He proposed an exponential correlation for fire RoS that has been normalized by RoS (at 0% moisture content). Other researchers such as Overholt et al. [
26] tried to characterize fuel properties of little bluestem grass experimentally. They then conducted a physics-based simulation using WFDS to investigate grassfire spread on the field scale with no grid convergence study and found a specific range of radiative heat flux associated with fuel moisture, ranging from 6 to 22%; this was not similar to the high values used in [
23,
24,
27,
28]. The results of the study conducted by Overholt et al. [
26] also showed that the fuel moisture content had the most significant impact on the fire spread rate.
Marino et al. combined experimental and physics-based modelling analysis to analyse the impact of fuel moisture content on the Rate of Spread (RoS) of a fire. (3D) FIRETEC simulations were employed for physics-based modelling. They found there is a link between moisture content, fire intensity, and fire behaviour including RoS.
Many studies have outlined the impact of FMC and, hence, fire intensity on fire behaviour. Banerjee et al. [
29] also investigated the effect of fuel moisture on wildfire. Six sets of simulations representing a wide range of fire behaviour, in terms of intensity and spread rate were studied. Their findings also showed that fire intensity is significantly affected by fuel load and the speed of fire propagation, and it is influenced by wind. However, fuel moisture significantly reduces both fire intensity and rate of spread. Effect of moisture content on thermal decomposition and auto-ignition of wood, as a biofuel, was explored by Gong et al. [
20]. They used FireFOAM to replicate experimental measurements. Their results showed that the temperatures increase more quickly by increasing heat flux and decreasing moisture content. Advection and the self-heating of organic porous media were investigated by Aganetti et al. [
30]. The authors developed a convection-diffusion model using the CFD tool OpenFOAM to examine the impact of advection in the self-heating process of bio-solids. Moinuddin et al. [
31] conducted a numerical study on the impact of fuel moisture on grassfire spread behaviour. Different relative humidity and fuel moisture were found to have a considerable impact on grassfire spread rate and fire intensity. Their results also showed that lower relative humidity and fuel moisture result in greater fire intensity and a faster spread.
The ignition of live fuel, using ForestFireFOAM, a CFD solver specialized to simulation of vegetation fire, based on FireFOAM, was investigated by Lamorlette et al. [
32]. The authors concluded that the improved non-equilibrium thermal model can successfully calculate ignition and flaming time, peak heat release rate (HRR) at ignition and mean HRR through flaming combustion on a validation case. They found that the aforementioned parameters agree well with the obtained experimental correlations on ignition time and peak heat release rate on a wide range of fuel moisture content.
In another study, the fire spread originated from the fuel bed to the lower canopy of patterned grassland used in wildland-urban interfaces, was simulated by Terrei et al. [
33]. The authors claimed that a wildland-urban interface fire starts usually in surface fuel with dead grass, then spreads to shrubs and trees when the lower canopy is near the ground. The impacts of weather condition on fire intensity and rate of fire spread were analysed in other studies [
34,
35,
36].
The presented literature survey indicates that despite a number of studies carried out in the field of fire intensity and fuel content, the basic understanding of the impact of a wind-driven surface fire and its intensity on building structures in the wildland-urban interface needs more investigation.
Previous works provide indispensable data concerning the impact of fuel energy content on fire behaviour and propagation. However, the fundamental mechanisms of how the intensity of the wind driven surface fire influences the buildings at the Wildland urban interface (WUI) and how this varies temperature and wind velocity profiles on and around the building still requires further study. This work aims to fill the gap by providing a quantitative and systematic analysis of the factors contributing to the alteration of the velocity profile and the surface temperature of a building with various fire intensities. This paper is an initial attempt to simulate a wildland-urban interface with a building structure, for various fire intensity values, using the FireFOAM solver. The impact of wildfire, with a wide range of fire intensity values, on building structures in terms of thermal load, both in terms of convection and radiation, have been examined and reported here.
2. Geometrical Model and Boundary Conditions
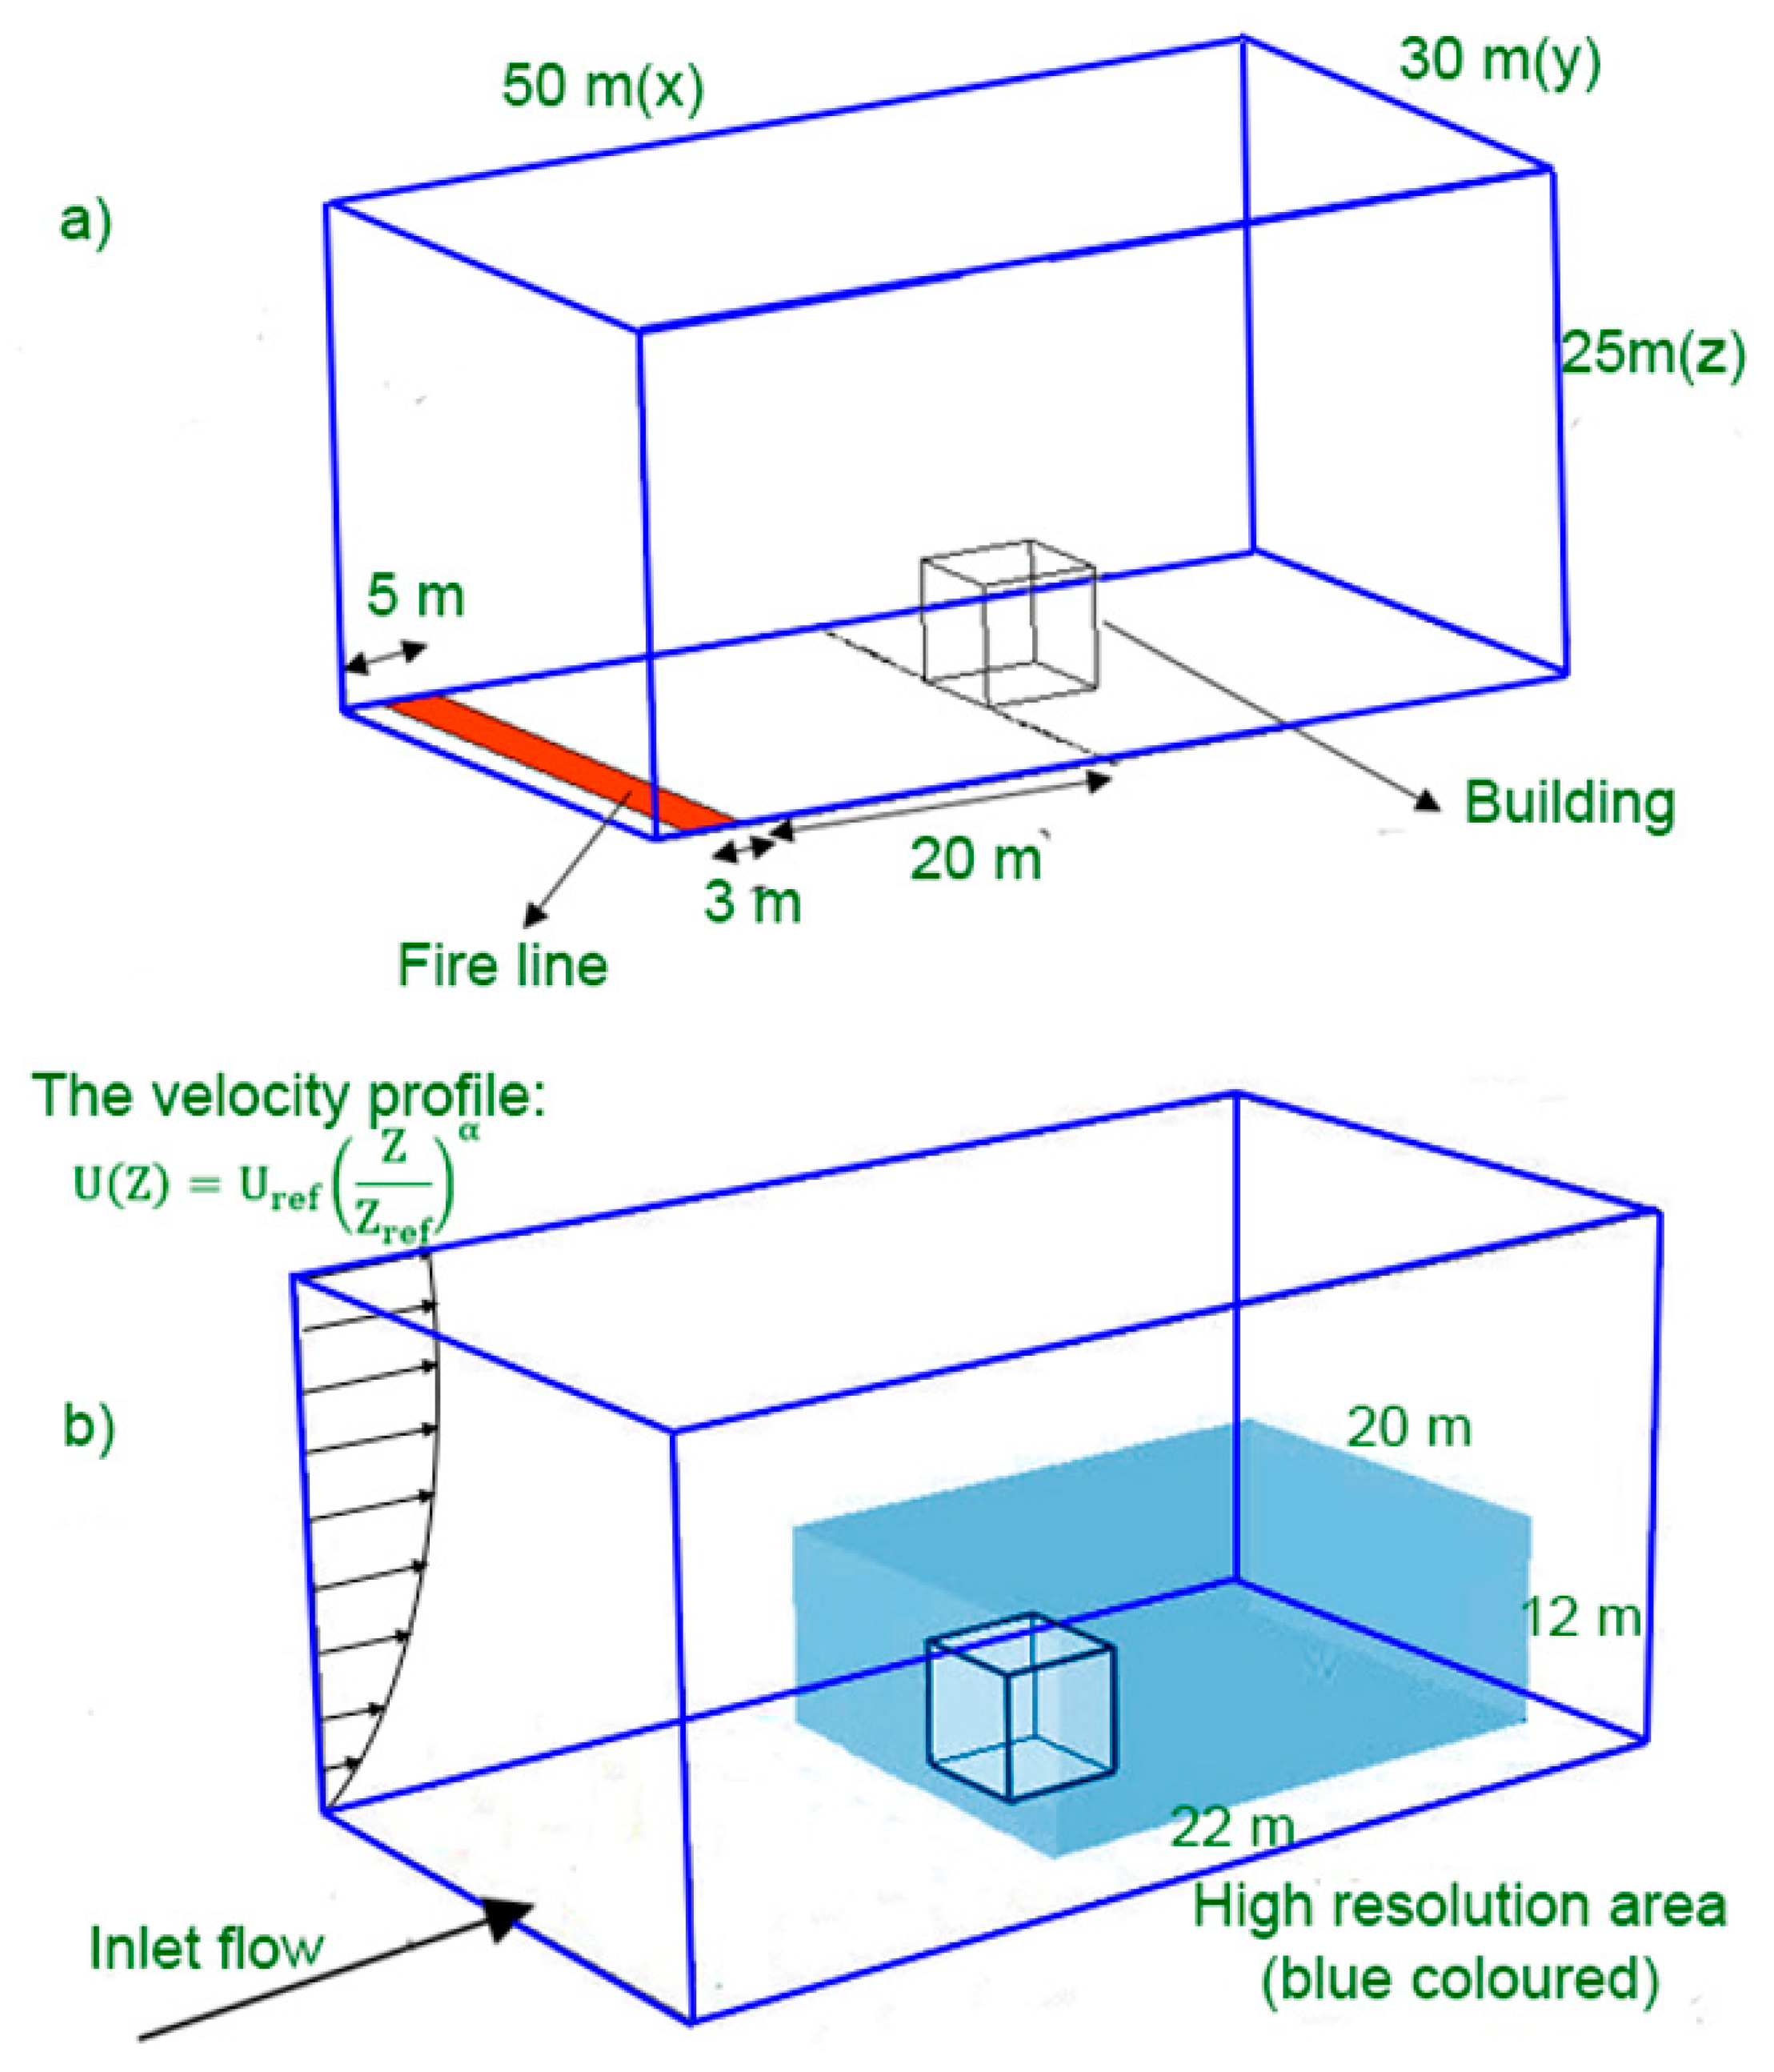
In the present investigation, the considered computational domain is a cubic structure with a size of 6 × 6 × 6 m, which is the exact size of the Silsoe building in their experimental study [
5]. It is worth noting that the Silsoe experiment was conducted in idealized conditions, namely a cubic building and flat terrain, and offers a collection of key scale data on the fundamental aerodynamic behaviour of low-rise structures under various wind loads.
As shown in
Figure 1a, the building is located in the 50 × 30 × 25 m computational domain. In the current study, according to the recommendations made by Richards and Norris [
37], the boundaries of the considered domain are far enough from the building to avoid unfavourable boundary condition effects.
To analyse the impact of fire intensity [
38] on the idealized building downstream from the fire, a 3 m width fire bed burning across the entire domain was positioned 20 m upstream from the building to simulate a line fire pattern. Methane with a heat of combustion equal to 45,435 kJ/kg [
39] was selected as a fuel to provide fire intensities of 10, 14, and 18 MW/m, which are equivalent to a common wildfire with a spread rate of 0.75–0.8 m/s and a fuel load of 0.4–0.6 kg/m
2 in a grassland.
The fire intensity value can be defined as follows [
38]:
where, d is the burning strip of the fire line and R shows the combustion rate, which is heat of combustion multiplied by the burning fuel mass flow rate.
To obtain more accurate computational results near the cube and downstream from the fire, a near-wall region with a size of 22 × 20 × 12 m was considered as a high-resolution mesh subdomain (See
Figure 1b) with a resolution five times higher than the other part of the domain. In order to reconstruct the turbulent flow fluctuations, a random noise with the mean flow velocity was applied at the domain inlet. Additionally, at the inlet domain, a power-law velocity profile was used as presented in Equation (2) and shown in
Figure 1b.
To decrease the cost associated with simulating a transient process, the simulation of spatially evolving turbulent flows started with an inflow boundary that is transferred to a shorter distance upstream from the domain of interest [
40]. In order to decrease the simulation cost and to obtain effective inflow data and turbulent inflow conditions, a simple and efficient method is to put random fluctuations on a desired mean velocity profile [
41]. The random fluctuation method is used in a number of numerical studies to simulate perturbations to the flow [
42,
43].
The boundary layer at the atmosphere has been applied using a power-law velocity profile, as presented in Equation (2).
where, Z
ref is the reference height equal to the building’s height (6 m) [
44], and U
ref is the reference velocity which in this paper is considered 6 m/s. α is specified based on the terrain category of the experimental study [
45] linked to the roughness of the terrain and considered as 0.16. The initial temperature and velocity of the domain are considered to be 300 K and 0 m/s, respectively.
3. Numerical Modelling
In order to solve the equations governing the problem, the FireFOAM [
46] solver of OpenFOAM, which is an open-source software, was used. FireFOAM is designed and developed for solving turbulent buoyant flows and diffusion flames and, more specifically, for simulating the dynamic of fire behavior. FireFOAM has also been shown to be an efficient tool in wildfire modelling [
18].
To simulate turbulent flows, the Large Eddy Simulation (LES) method was applied. The Favre-filtered Navier-Stokes equations governed on the dynamic of the fire are written as a set of chemical species mass fraction, energy, momentum, and conservation equations of mass.
Continuity, momentum, energy, species and state equations [
44] are presented in Equations (3) to (7).
where, “¯” and “~” shows spatial and Favre filtering, respectively.
is the static pressure,
represents the total enthalpy,
is the mass fraction of species m, g represents the gravitational acceleration.
,
,
,
,
,
,
,
and
are the turbulent Prandtl number, turbulent Schmidt number, laminar diffusion coefficient, laminar viscosity, turbulent viscosity, density, gas constant, thermal diffusion coefficient, Kronecker delta and production/sink rate of species m due to gas reactions, respectively. Coupled velocity and pressure is applied in the PIMPLE scheme which used by FireFOAM. In the current numerical model, the Large Eddy Simulation method (LES) was used. The differencing scheme of first order upwind was applied. Equation (4) can be written in the flow acceleration form as derived in Equation (8):
where,
represents acceleration of the flow, u represents the flow velocity,
is pressure gradient, and
is viscous shear stress.
4. Verification
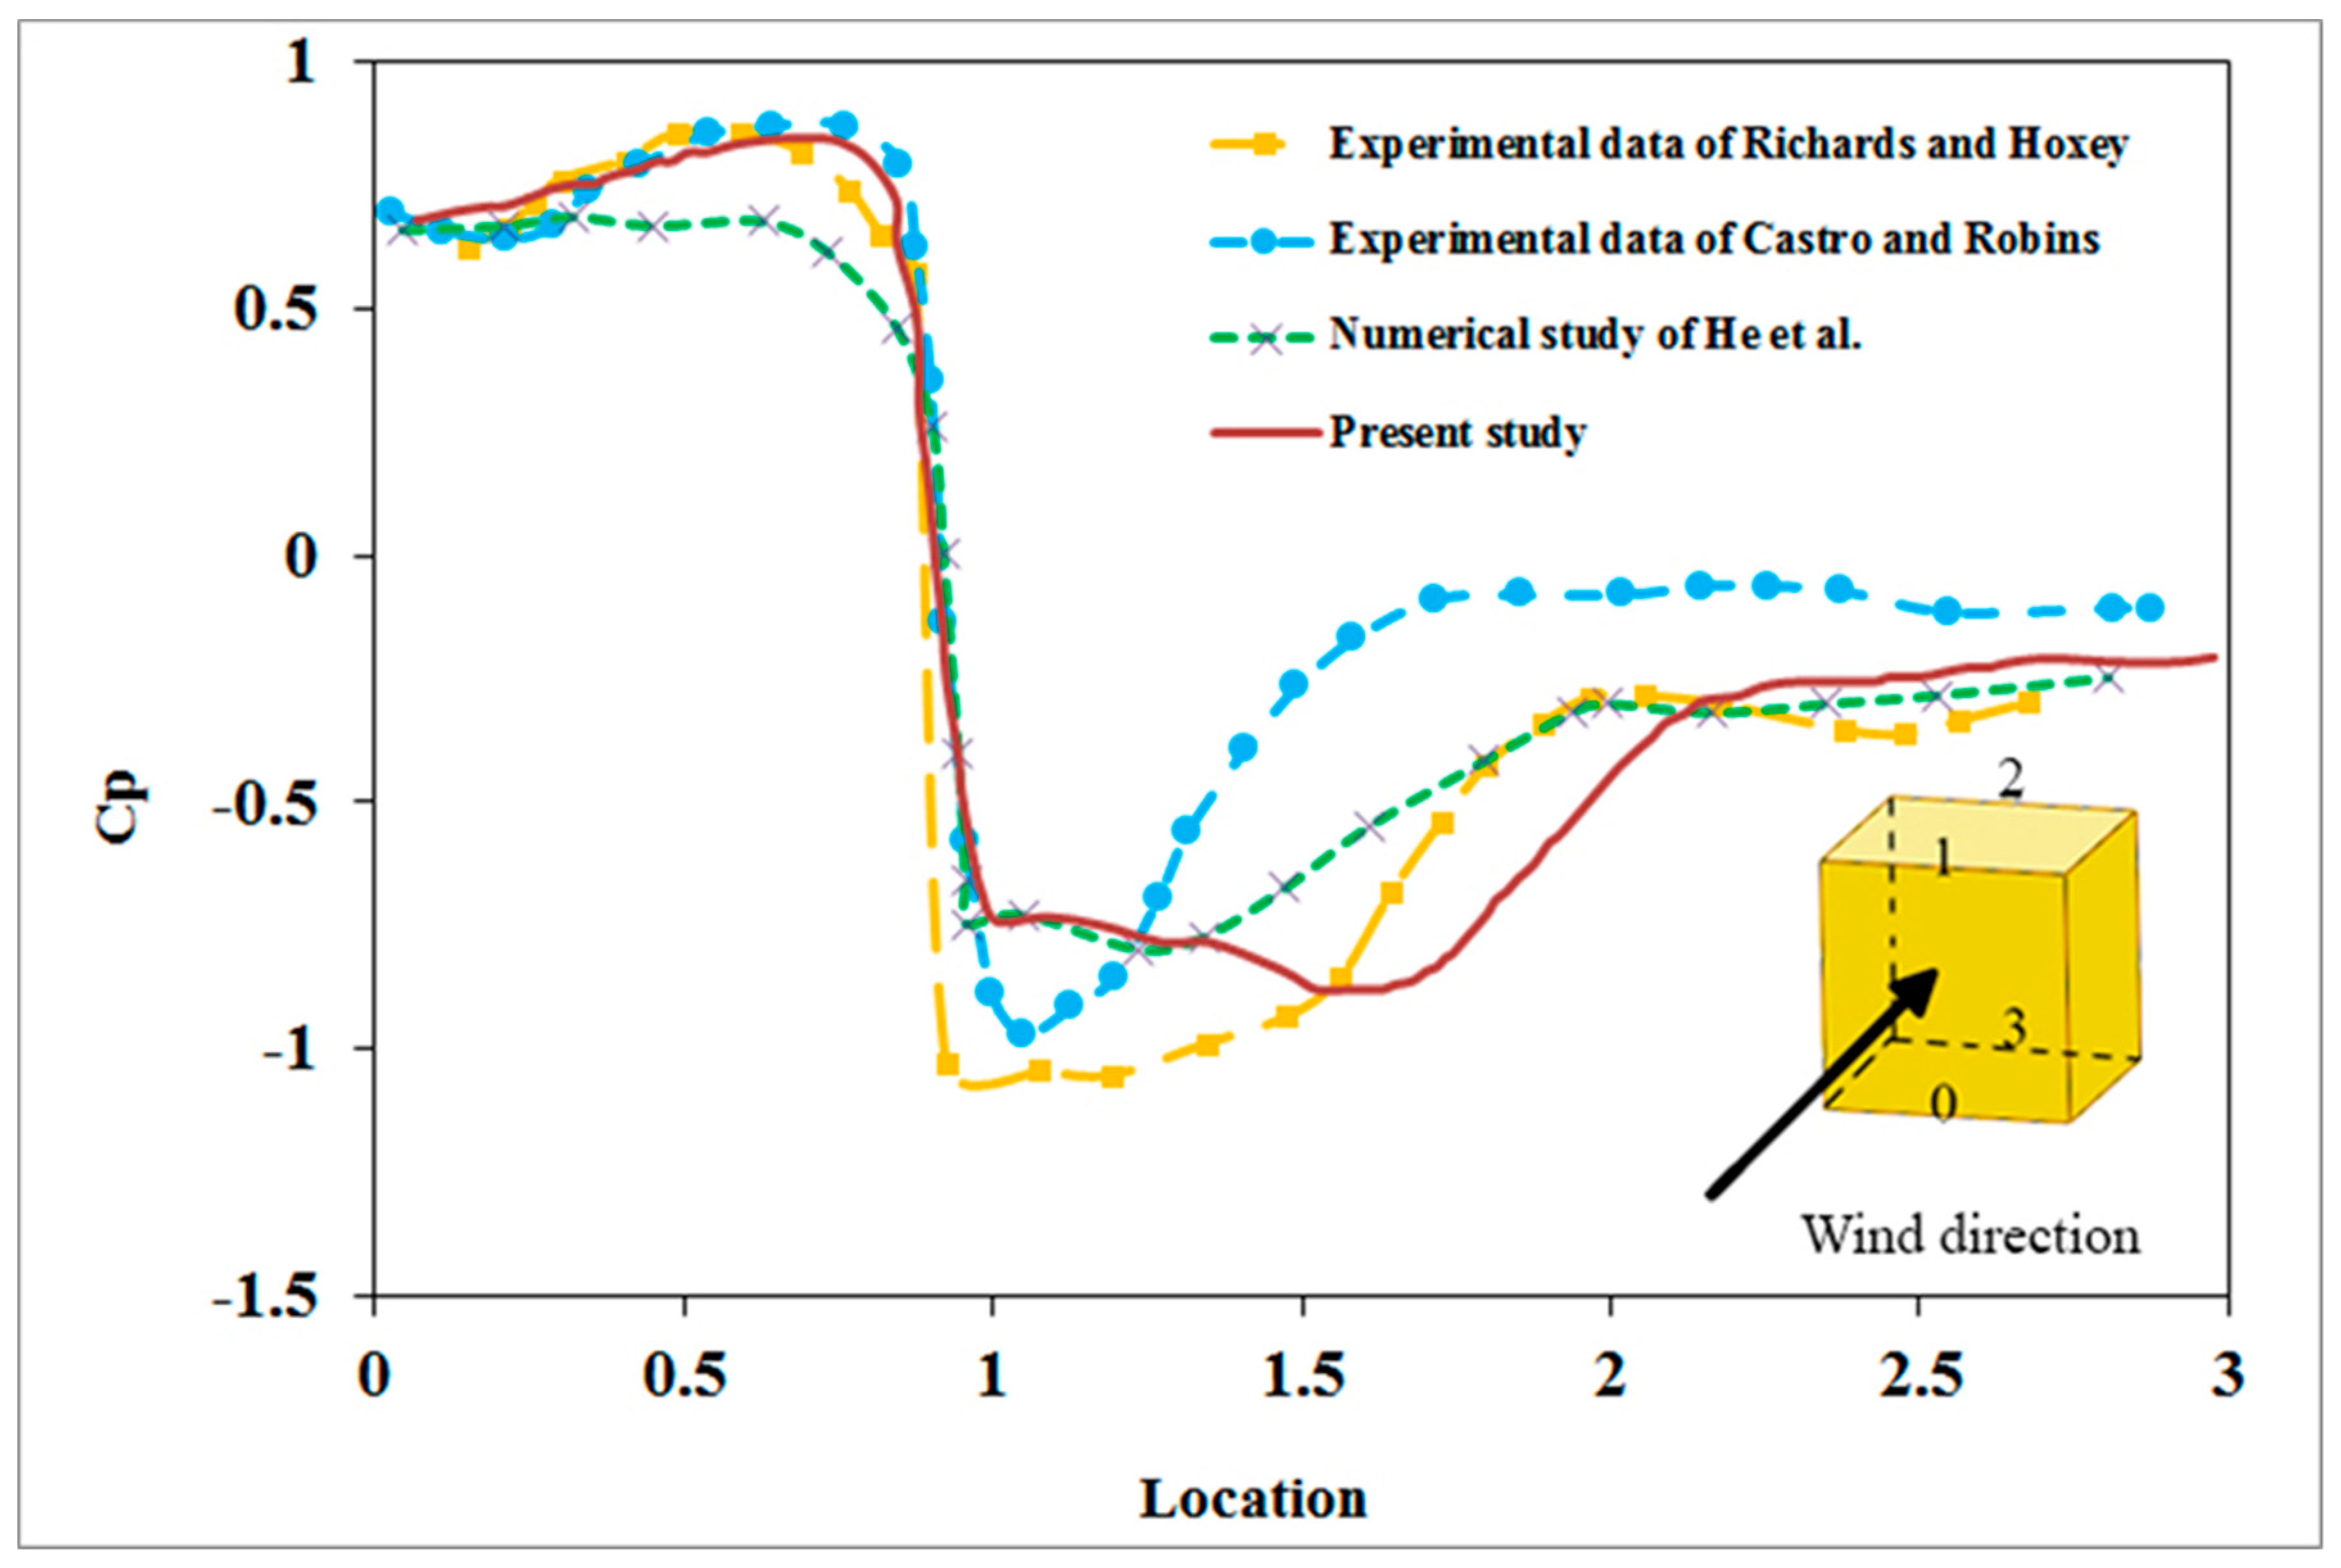
To verify the numerical model, a detailed comparison between pressure coefficients in the present study and two sets of experimental measurements of Castro and Robins [
47] and Richards and Hoxey [
5] was made. The numerical results of this study were also verified with the numerical findings of He et al. [
11] and are shown in
Figure 2. As mentioned, two sets of experimental investigations on pressure along the vertical and horizontal centrelines of the Silsoe cube of Richards and Hoxey [
5] and Castro and Robins [
47] were used to examine the irrotational and sheared turbulent flows around a cube representing an idealized building. In addition to these two experimental studies which were conducted in the absence of fire, the results of the current study were validated against the numerical study of He et al. [
11], who modelled the interactions between bushfires, wind, and building structures with the Fire Dynamic Simulation (FDS) software package.
He et al. [
11], calculated the pressure coefficient distribution around a building with the reference velocity of the wind equal to 9.52 m/s, under no-fire conditions and validated their outcomes with the other experimental studies.
It is worth mentioning that the validation of the current numerical model was also carried out in the absence of fire effect by comparing the results of full-scale Silsoe cubic building of Richards and Hoxey [
48]. Since the Eddy Dissipation Concept (EDC) is mainly regulated by turbulent mixing, the characteristics of the fire dynamic are tightly linked to the building’s aerodynamics. Therefore, the pressure distribution along the building in a no-fire scenario is an applicable gauge, indicating the accuracy and validity of the numerical findings.
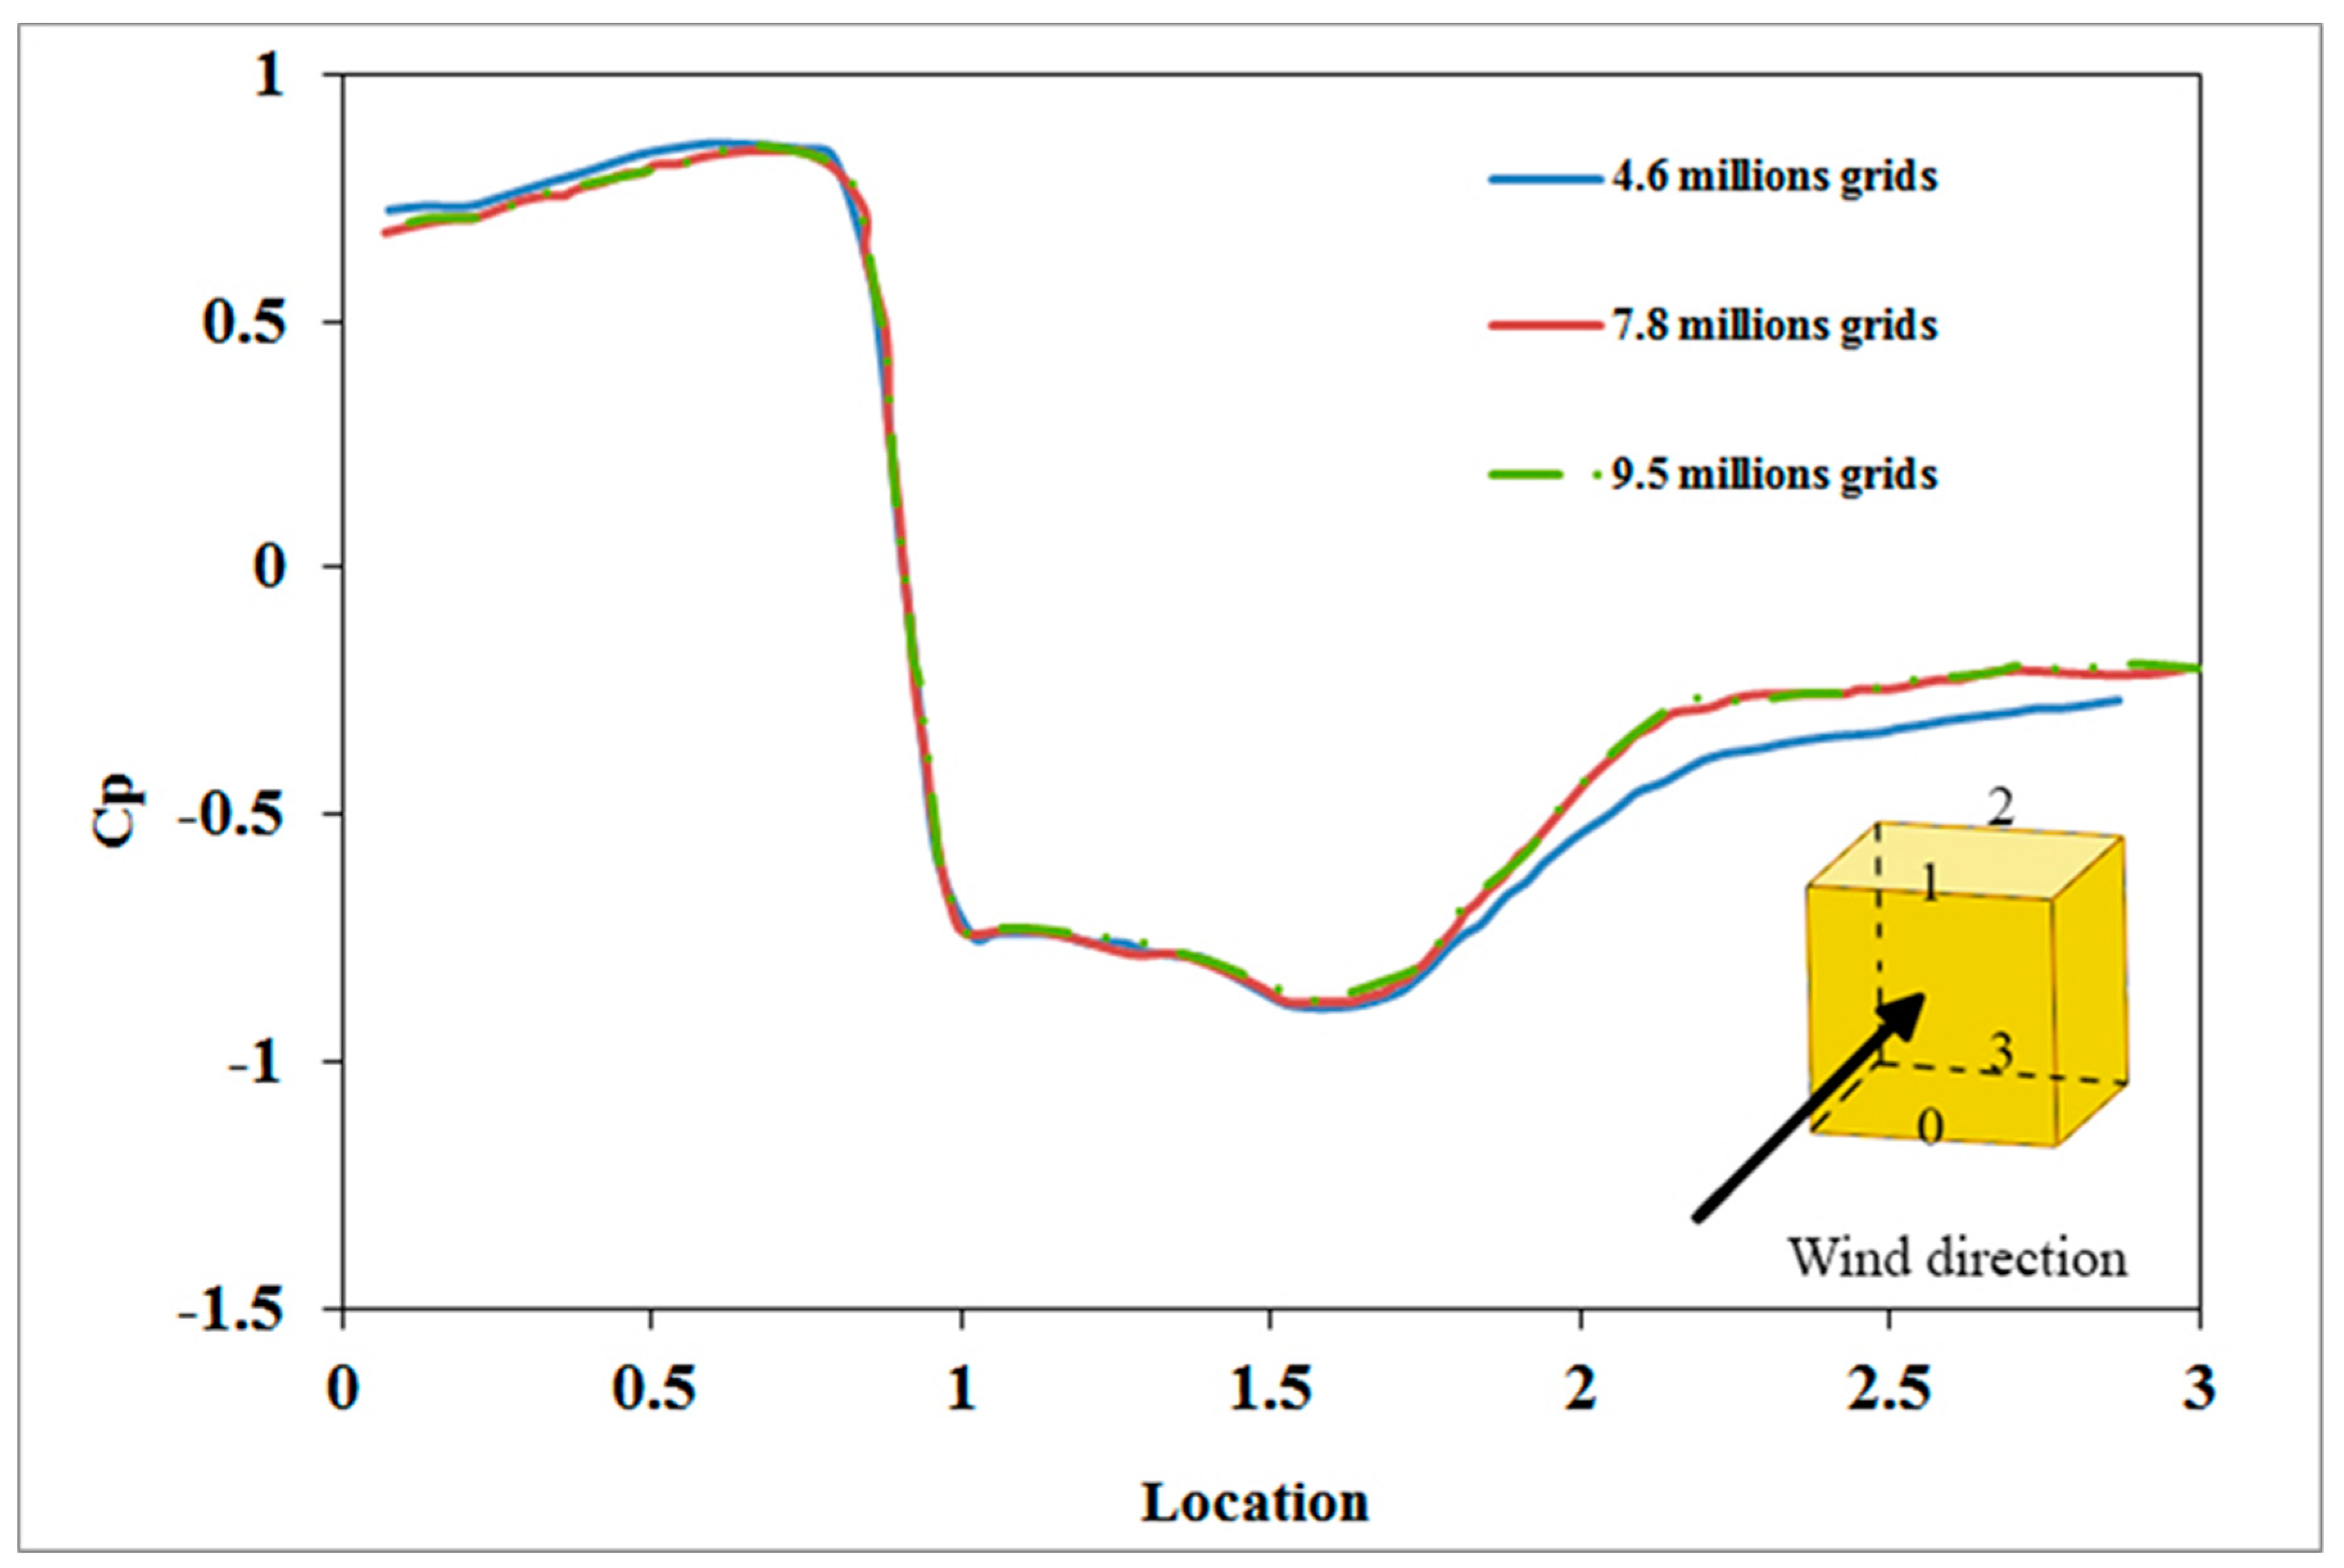
The numerical calculations of the pressure coefficient alongside the centrelines over the rear, top, and front surfaces of the building (demonstrated by the 0–1–2–3 solid lines) are plotted in
Figure 3. The results of previous numerical studies are also plotted in
Figure 3 with those computed from the various grids considered in the current study. Even though there is a good agreement between the simulated data and experimental investigation on building faces, perceptible inconsistencies still exist across the roof face of the cube (1–2 line). These inconsistencies were also observed in the other studies incorporated in
Figure 2 and can be linked to the high scatter of wind velocity in the experimental measurements and direction data. This substantially impacts the separation regions in the corners and the pressure distribution over the roof of the idealized building (the cube). In addition, as the oscillations of wind pressure on the cube are mostly due to large-scale shifts [
49], the size of the computational domain can restrict the size of the largest eddy and undesirably influence the results. The maximum error occurs at the location 1.25 and is about 18%.
In order to achieve validation in the case with fire, a comparison between the data reported in the work of Morvan [
17] and the present investigation is also made and reported in
Table 1. The flame height for various wind velocities of 4.5, 6, and 7.5 m/s is reported for the fire intensity of 10 MW/m [
50]. As can be seen, the results of the current study are significantly close to the published study [
17] with a maximum error of 8%.
To reduce numerical uncertainties, a mesh sensitivity analysis was performed with three sets of structured mesh size into the domain: 4,600,000, 7,800,000, and 9,500,000. The meshes are uniform in all directions. As mentioned previously, the subdomain mesh resolution is five time higher that the main domain which in three grid sets of (176 × 160 × 96, 210 × 191 × 114, and 224 × 204 × 122) were tested.
The results of the grid independency study indicate that increasing the number of grid cells initially leads to an increase in the mean pressure coefficient, while a further increase in the number of cells marginally affects the pressure coefficient profile.
5. Result and Discussion
The focus of this work is to develop a validated, CFD-based, numerical model for simulating the effect of wind driven wildfire intensity fire intensity at the WUI. From a modelling point of view a distinguishing feature of wildfires, when it comes to their effect on structures at the WUI, is fire intensity. The work reported here focused on the fire characteristics and the downstream aerodynamic behaviour in the presence of a building structure for various fire intensity values to shed light on the impact of the intensity of the fire line on the near built structure and the generated hazard.
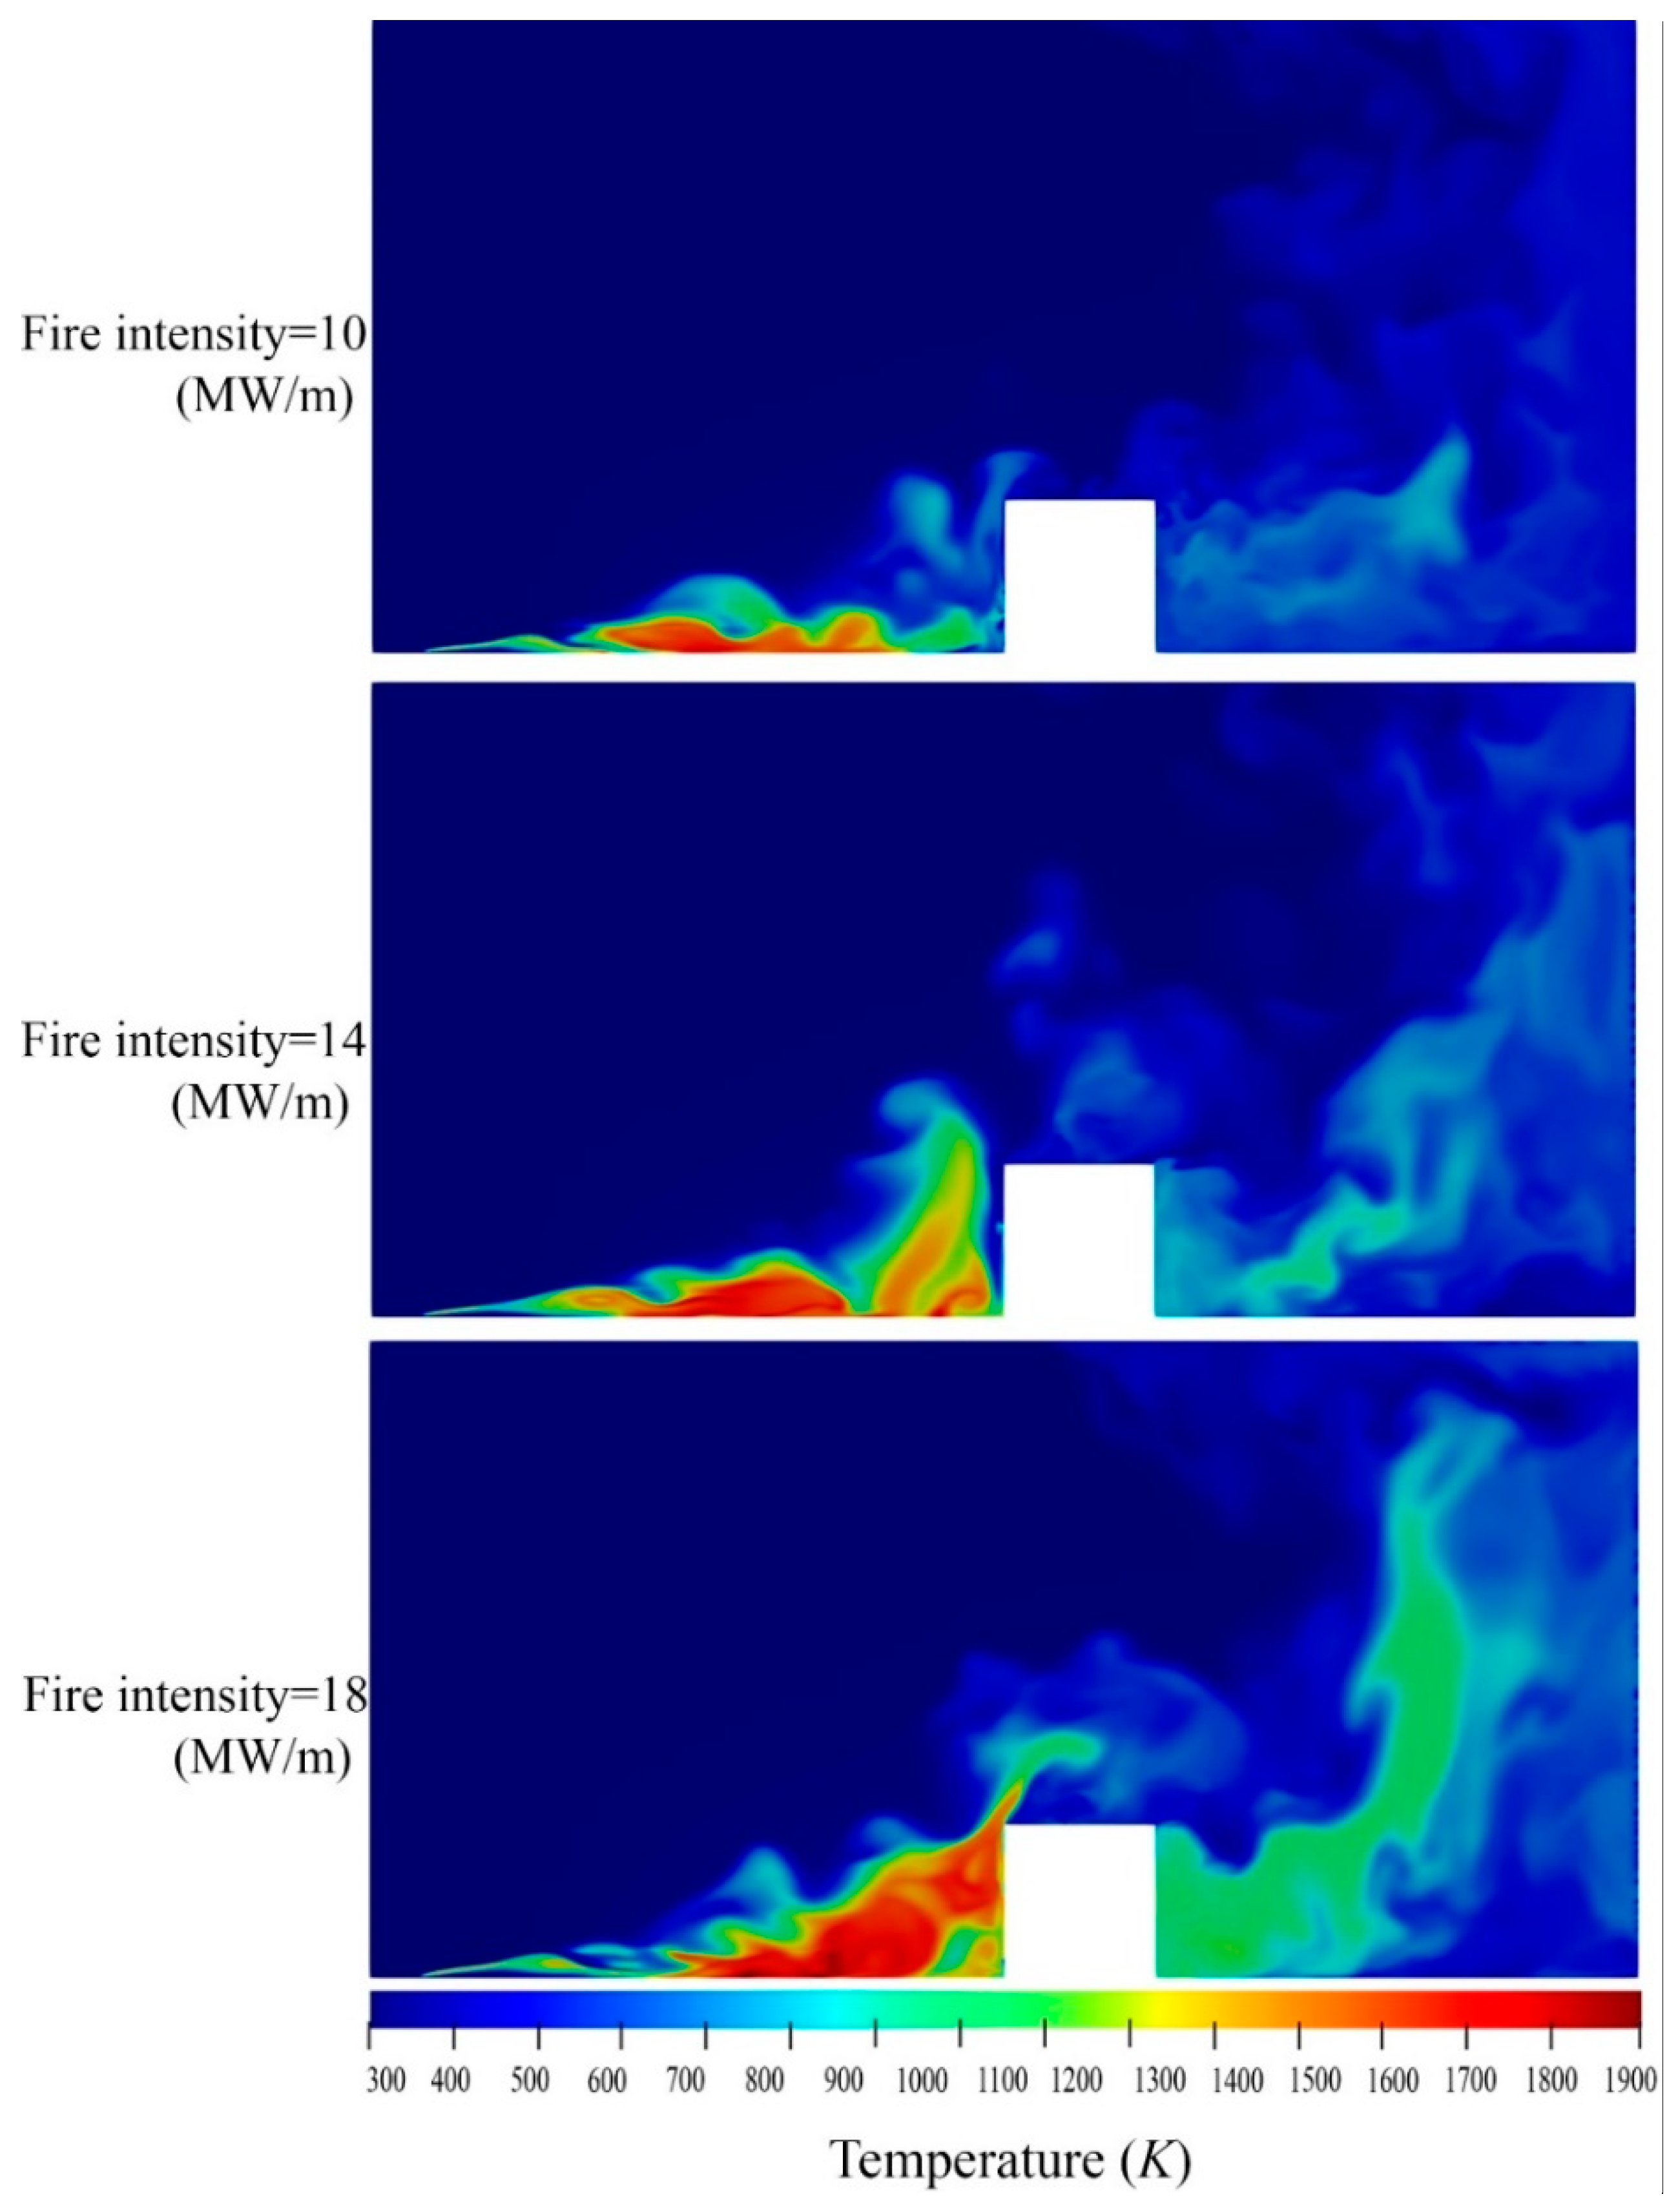
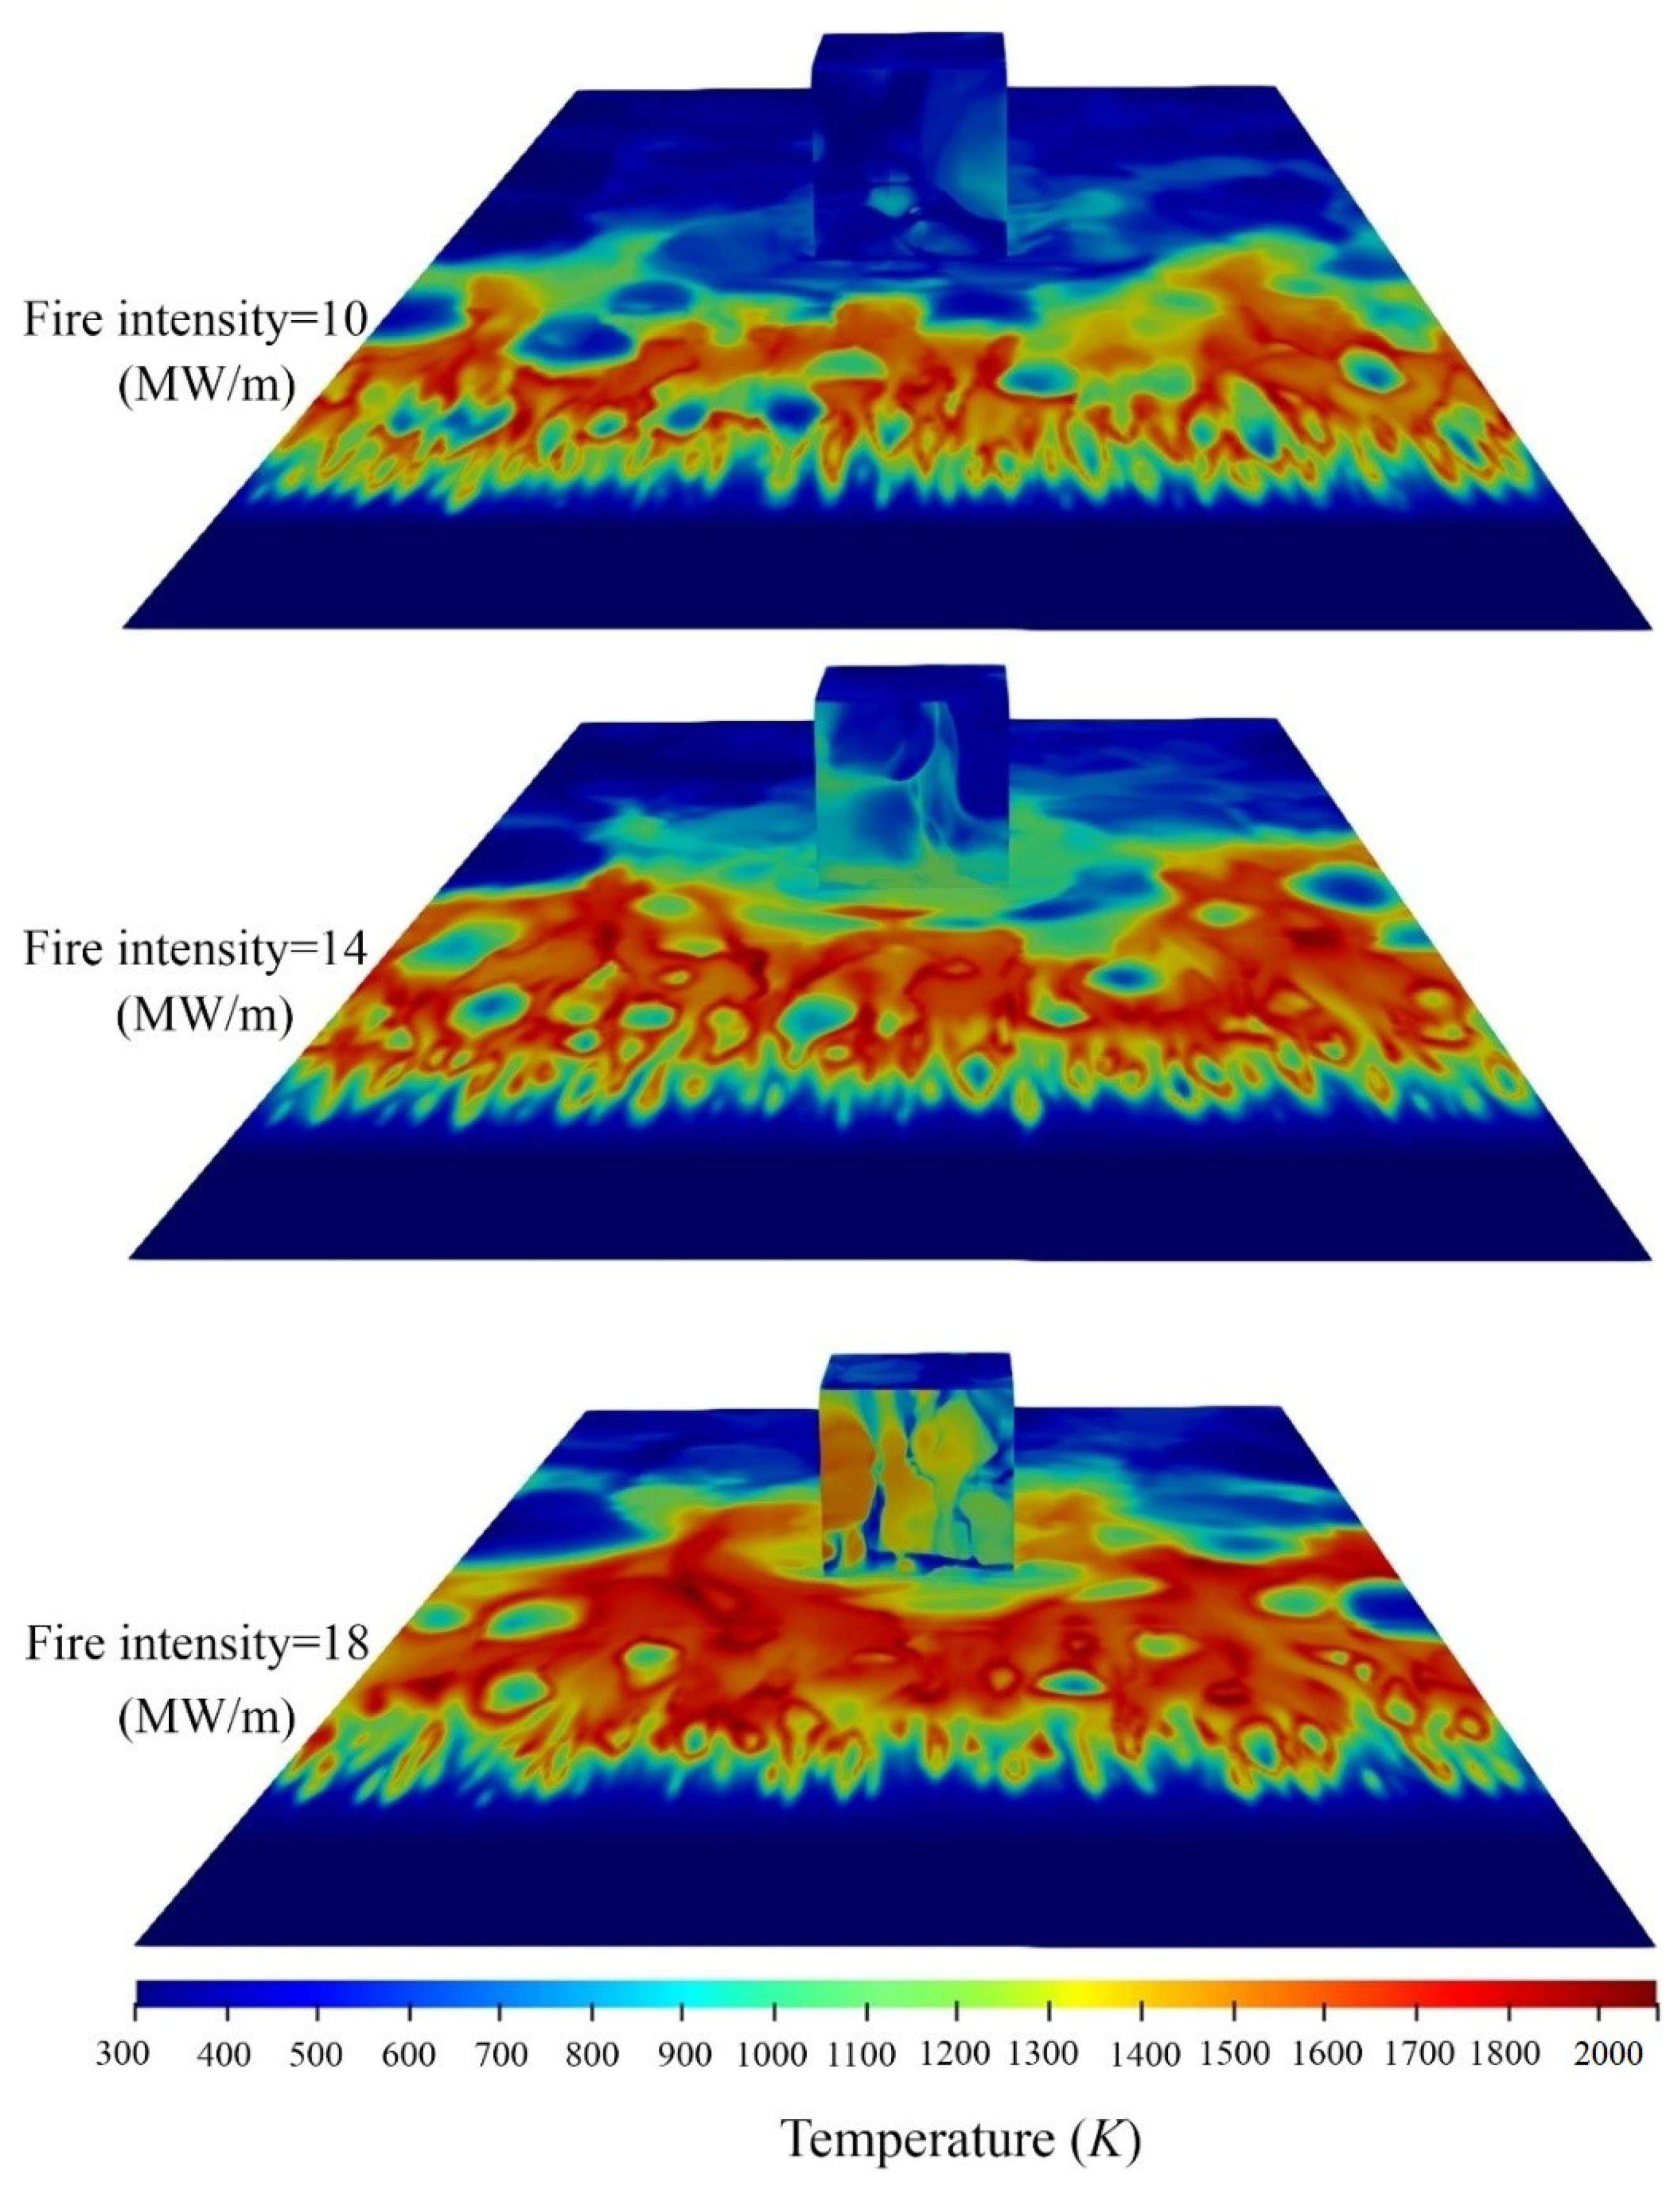
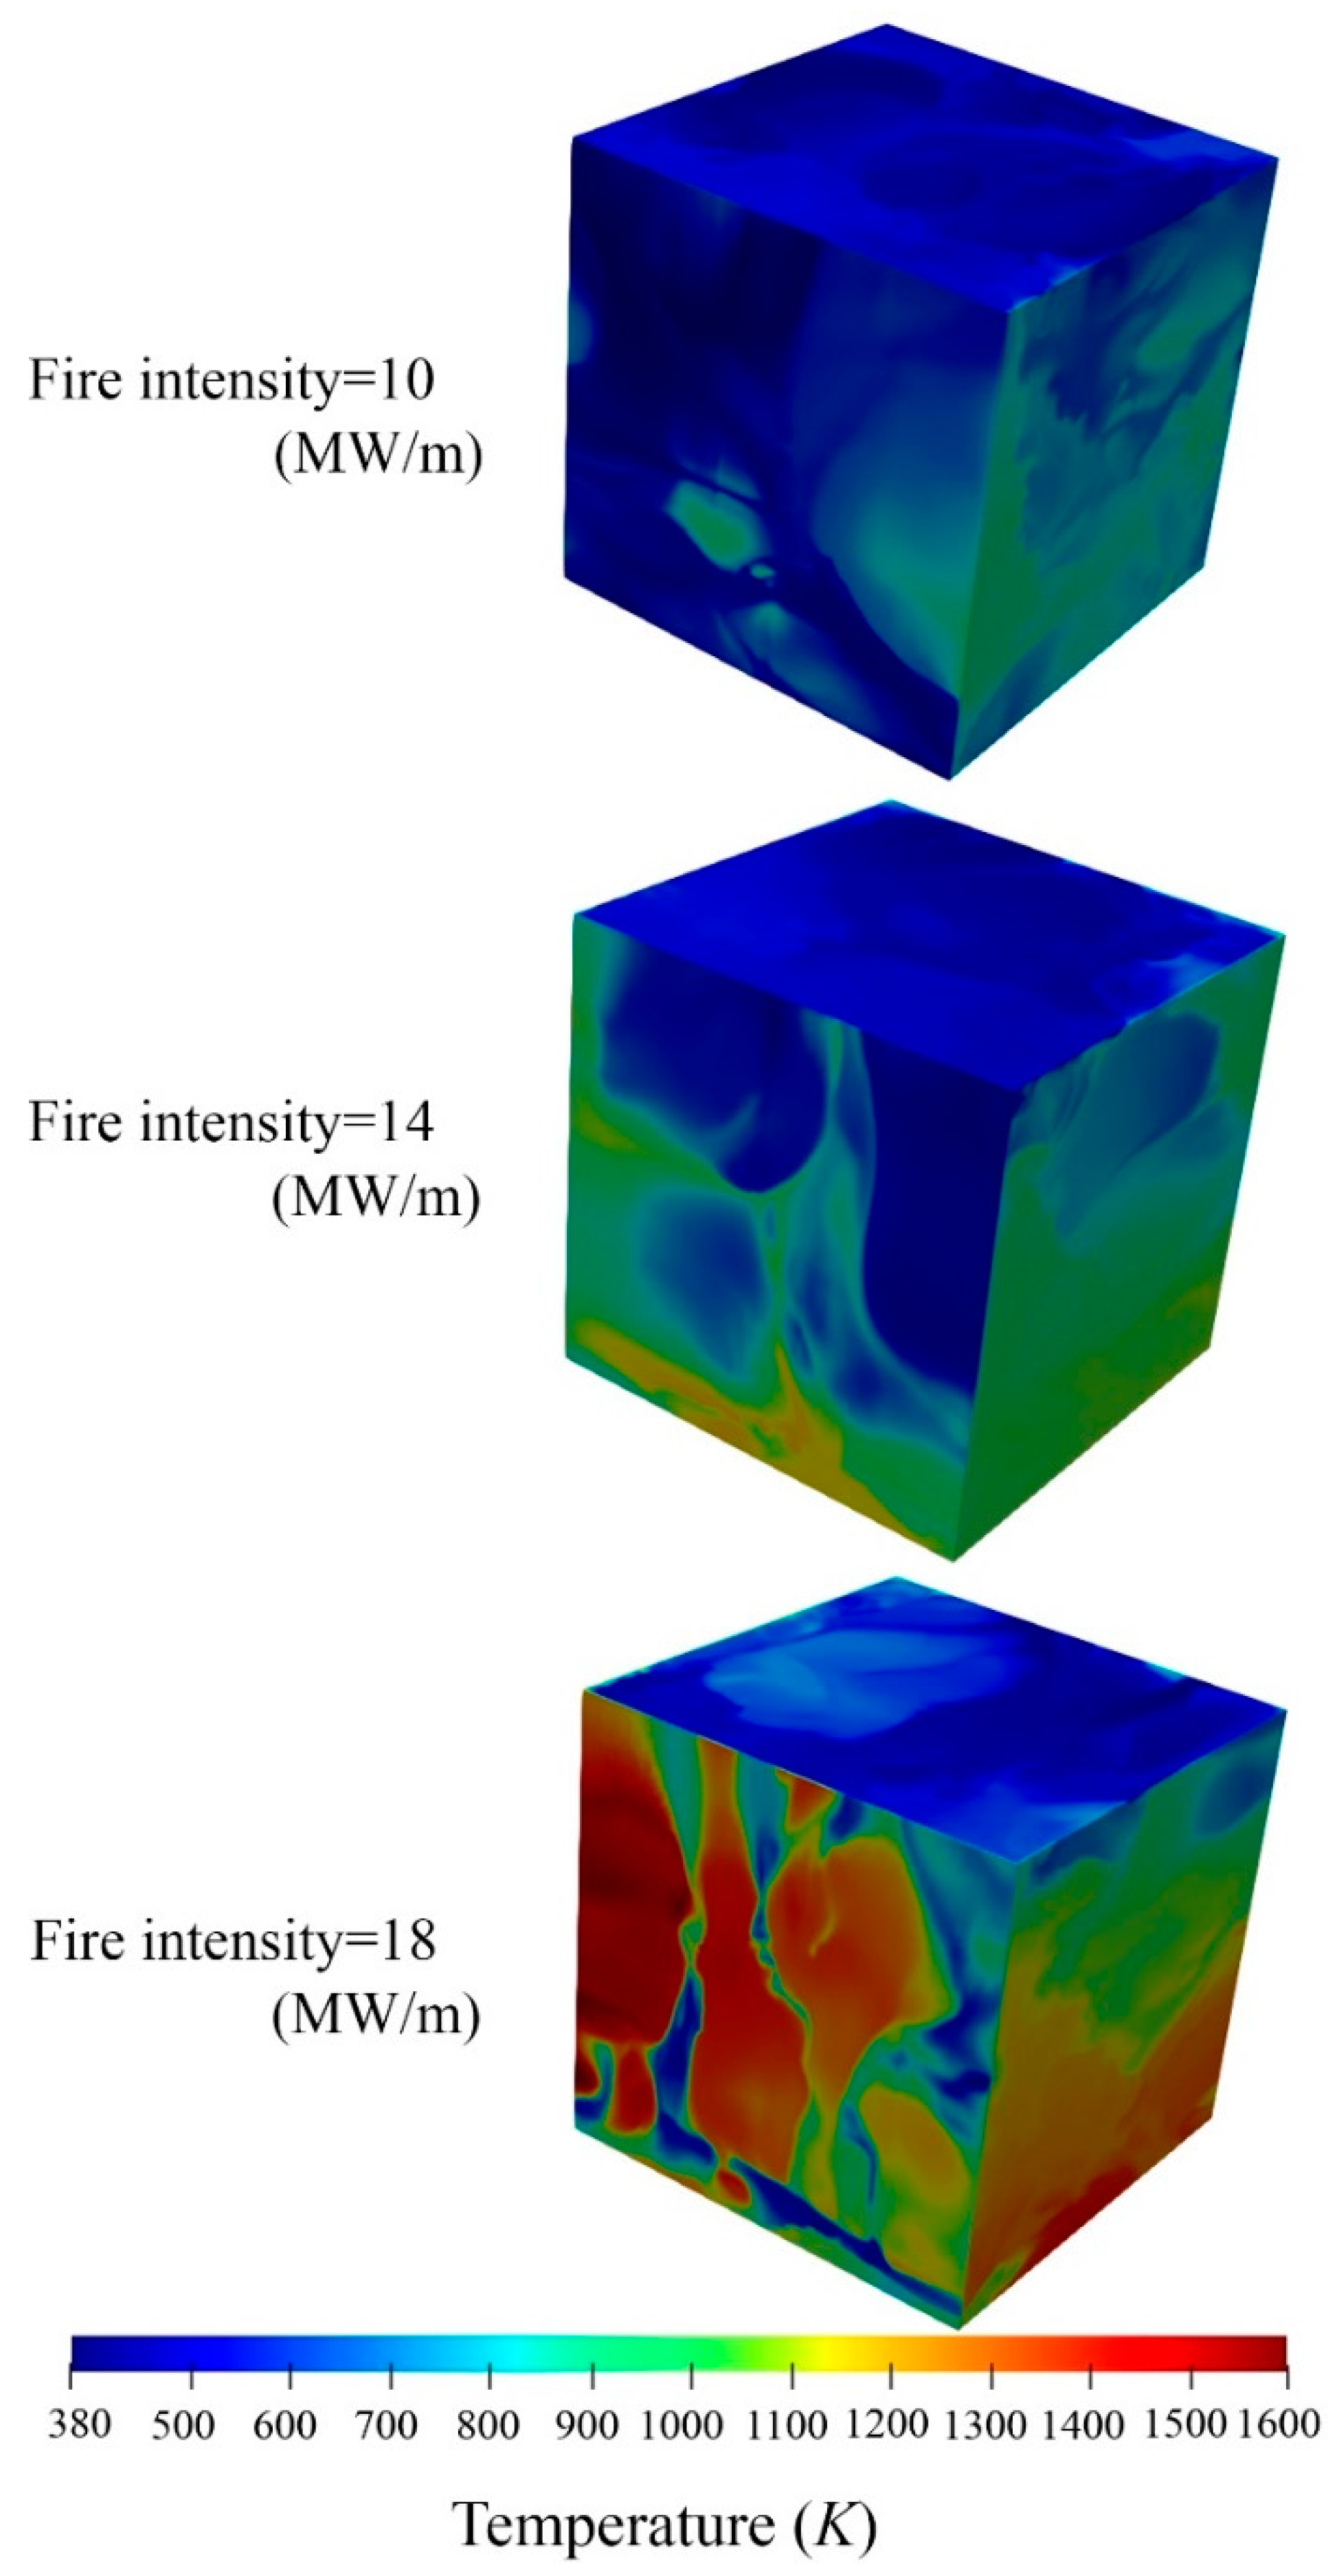
Figure 4 shows the effects of various fire intensities on the temperature distribution caused by the fire line in a domain with a constant cross wind velocity of U
ref = 6 m/s. As can be seen in this Figure, by increasing the fire intensity, the downstream temperature increases near the building. Looking at the results presented in
Figure 4 in more detail, the higher fire intensities affect the downstream temperature significantly so that at the back of the building, there is a substantially high temperature area of more than 1000 K. Comparing
Figure 4 and
Figure 5 at the case with the fire intensity of 18 MW/m, it can be is seen that a wake is created at the back of the building which results in a low pressure area at this region. Given the mentioned point, the turbulent high temperature flow is observed at the back of the building with the lack of oxygen which is consumed at the upstream.
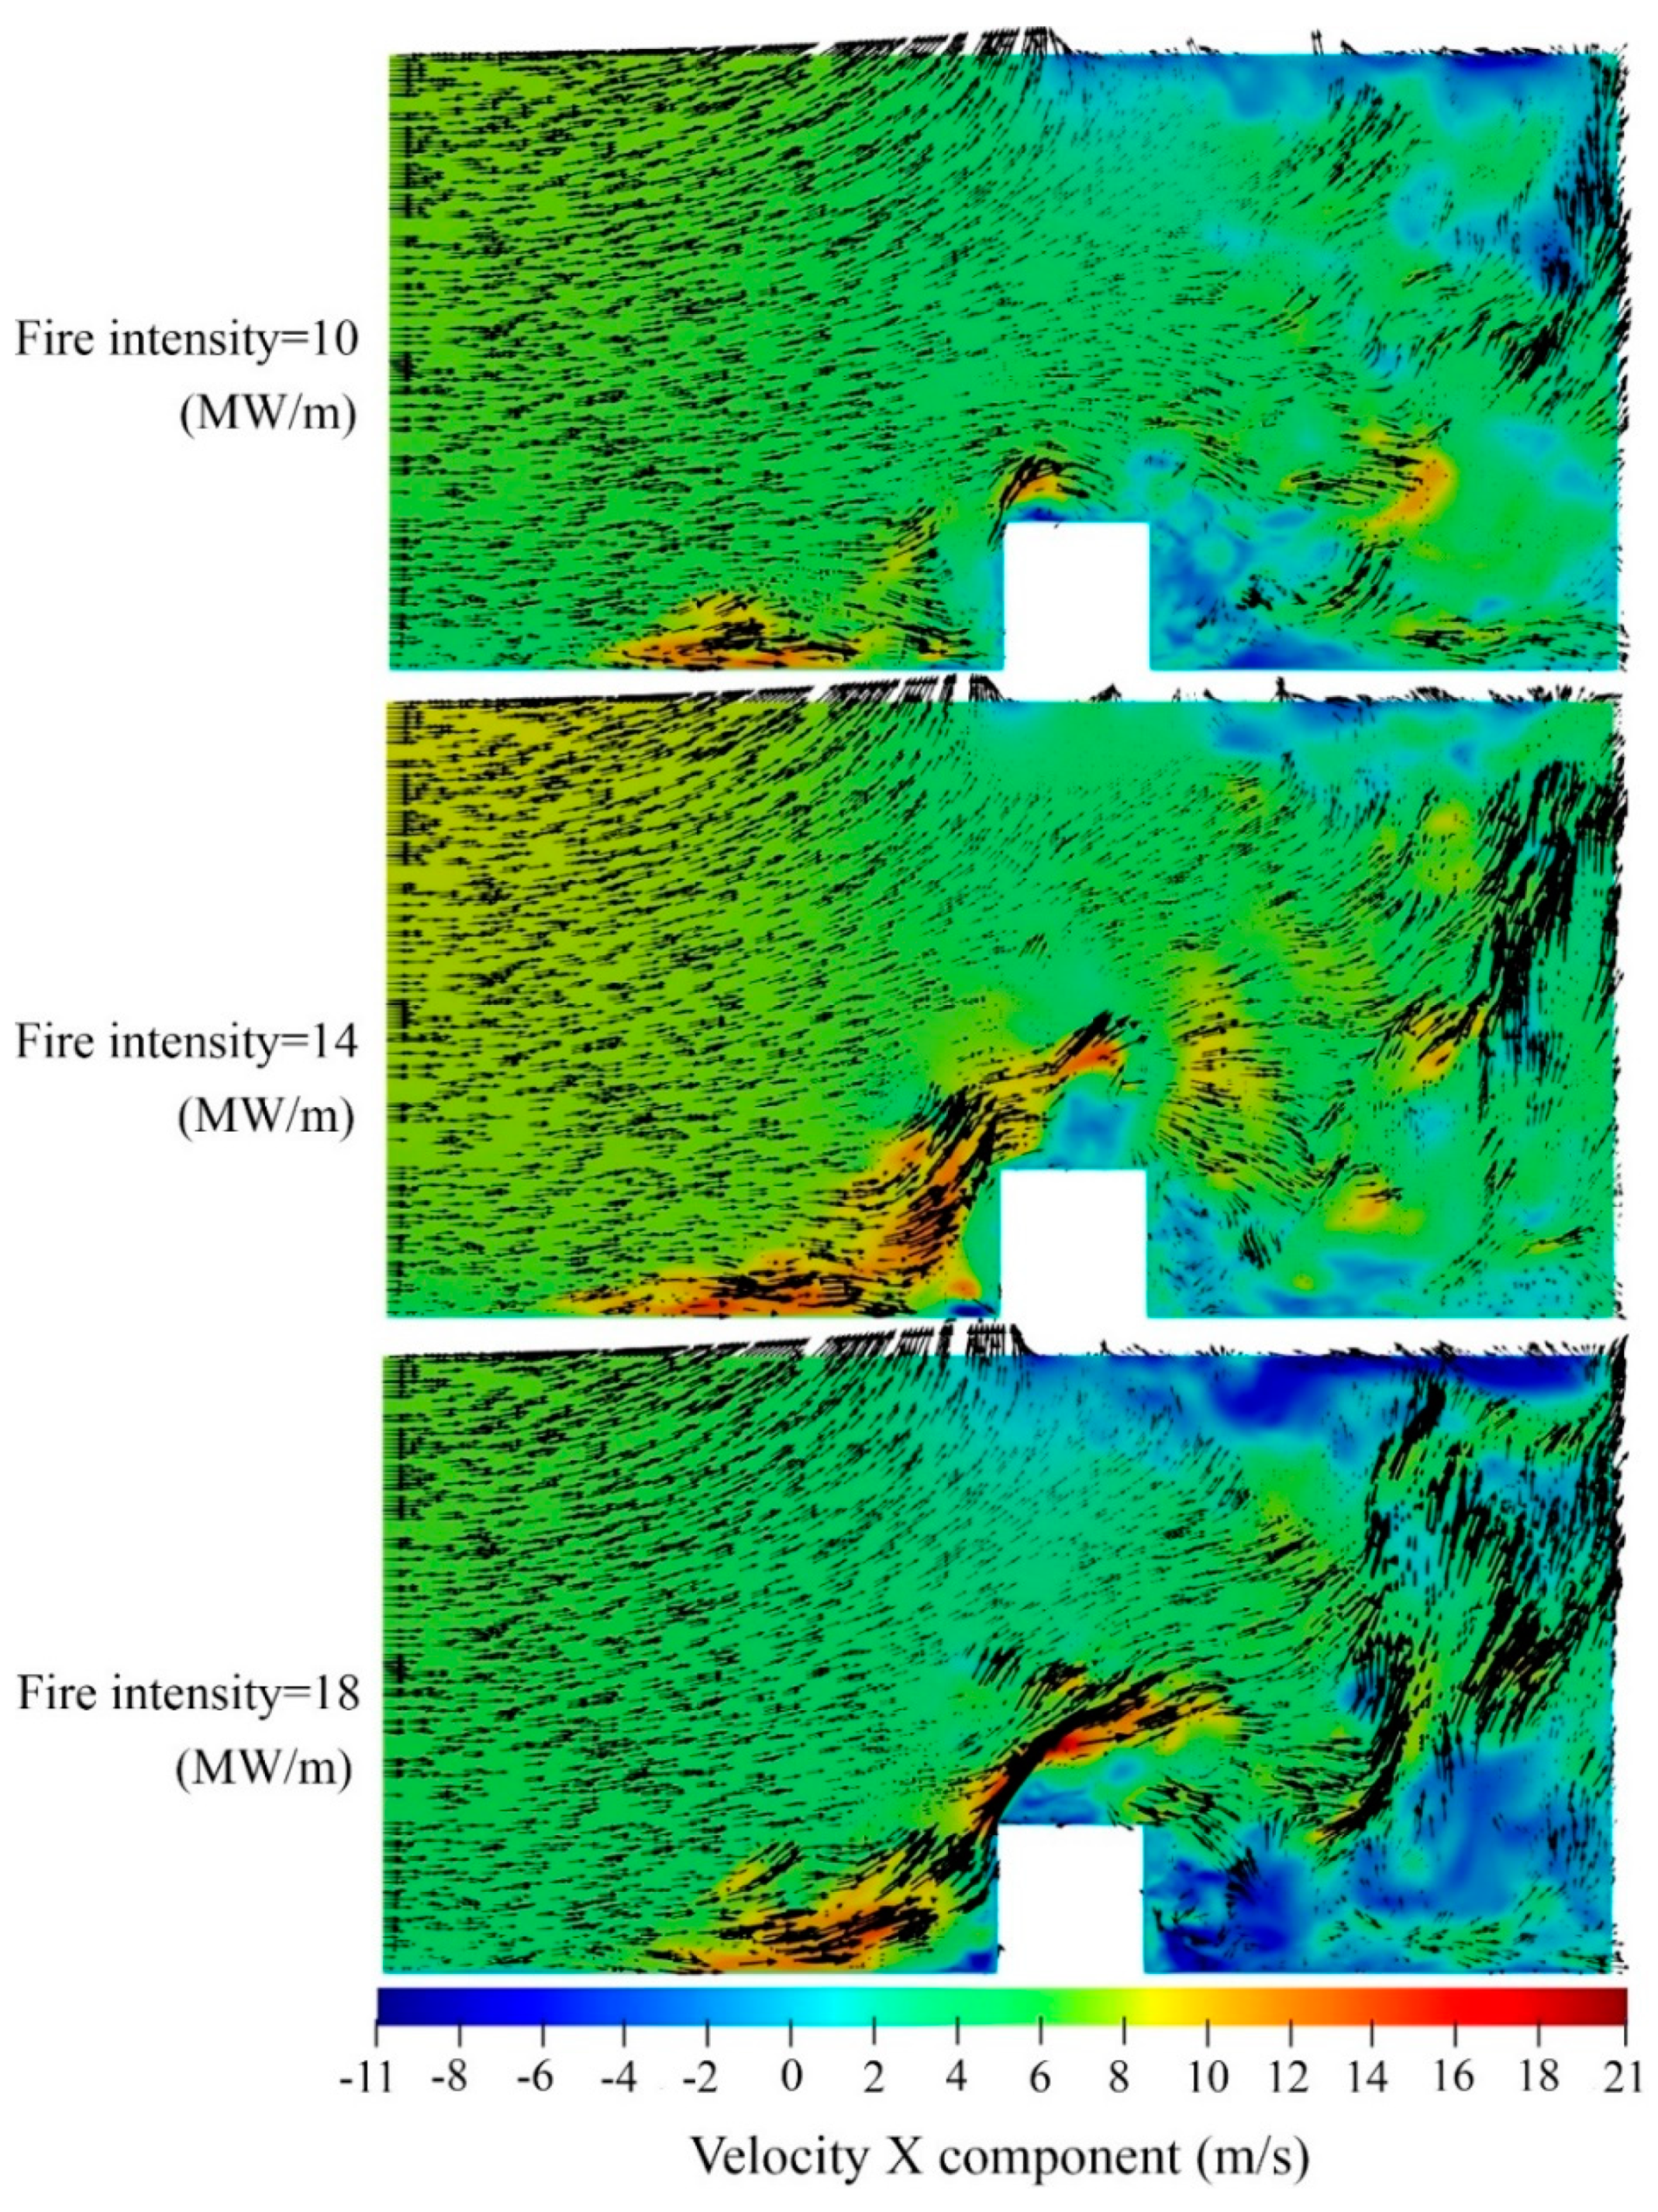
Figure 5 shows the contours of vertical transects of instantaneous streamwise velocity component (Ux = velocity component in the X direction) and corresponding velocity vectors in the flat terrain for various fire intensities of 10, 14, and 18 MW/m, in a constant cross wind reference velocity of 6 m/s. As shown in this figure, by increasing the intensity of the fire, the velocity of the hot gas plume increases. The main reason behind the observed trend is the low-pressure area behind the fire line as a result of high temperature air, which causes low-density air and makes an extra stream behind of the fire plume. This accelerates the air velocity downstream from the fire source.
Downstream from the fire, at the back of the building, a recirculation region as a result of reverse flow could be seen. This is mainly occurred due to a pressure drop and wake as well as buoyant instability [
51], which leads to the generation of a hot air region behind the building. The above phenomenon increases with an increase in fire intensities due to the increase in wind velocity, as a result of the change in the buoyancy force direction.
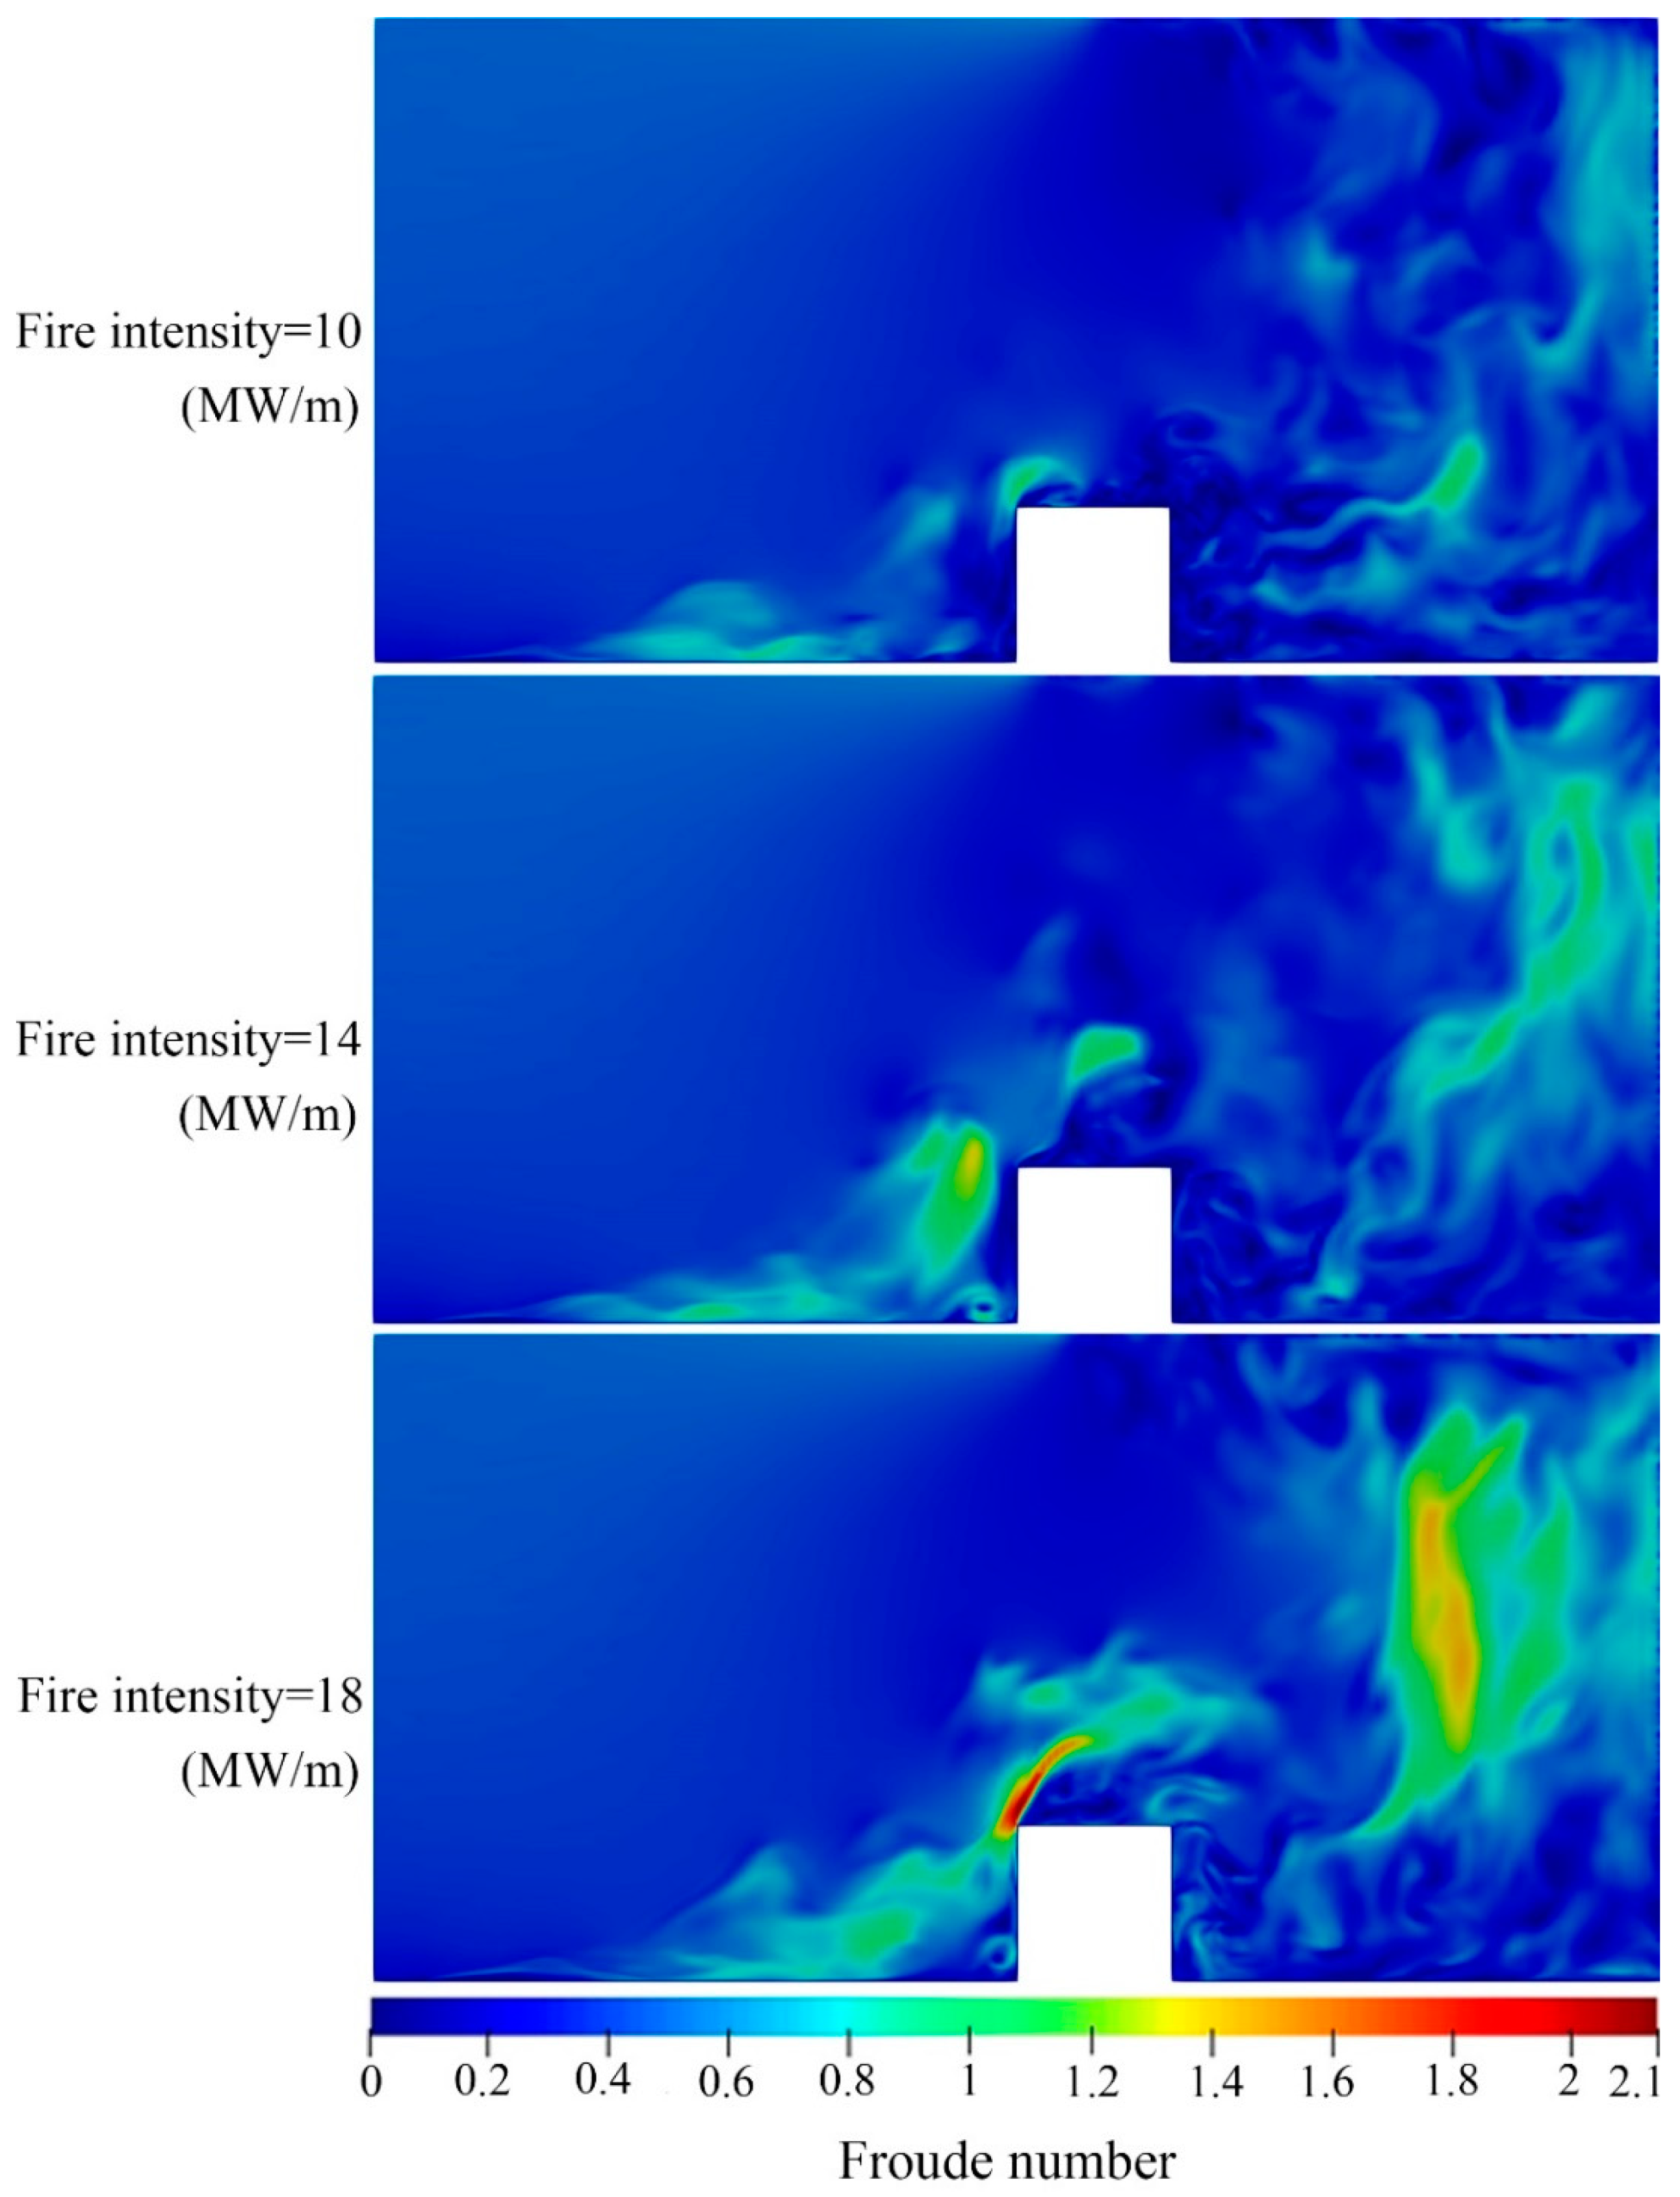
To obtain the ratio of the inertial force and thermal buoyancy in fire, the dimensionless Froude number [
52] can be used which is defined as follows [
53]:
where, U represents the velocity, g is the acceleration of gravity, and L
w is equal to the width of the fire line perpendicular to the wind. The fire intensity effects on the Froude number distribution can be seen in changing in the air flow velocities corresponded to the fire plume, which depend on the air temperature.
The Froude number distribution in the domain for the different fire intensities of 10, 14, and 18 MW/m and a constant reference velocity U
ref = 6 m/s are shown in
Figure 6. The dimensionless Froude number specifies the ratio of the inertial force and the thermal buoyancy in fire. As can be seen, increasing the intensity of the fire leads to an increase in Froude number. This is associated with the increase in air velocity, which is caused by hot temperature streams as a result of buoyancy force. The hot temperature stream has a lower density which can boost the buoyancy force, resulting in a more turbulent area and increases the flow velocity, and finally affects the ratio of the inertial force and the thermal buoyancy.
Figure 7 shows the contours of temperature distribution on the ground, in the vicinity of the building and downstream from the fire. As can be seen, increasing the fire intensity results in an increase in the area with higher temperature near the building. This is linked to the combination of two main factors: first, obviously, a higher fire intensity physically means prolonged flames and as a result, an increase in heat transfer to the ground.
The second factor is that by raising the fire intensity, the wind velocity downstream from the fire line increases, which leads to an increase in the Coanda effect [
54]. In other words, in addition to the wind force, the buoyancy force intensifies the wind velocity, and contributes to the Coanda effect, which increases the attachment of the flame to the ground.
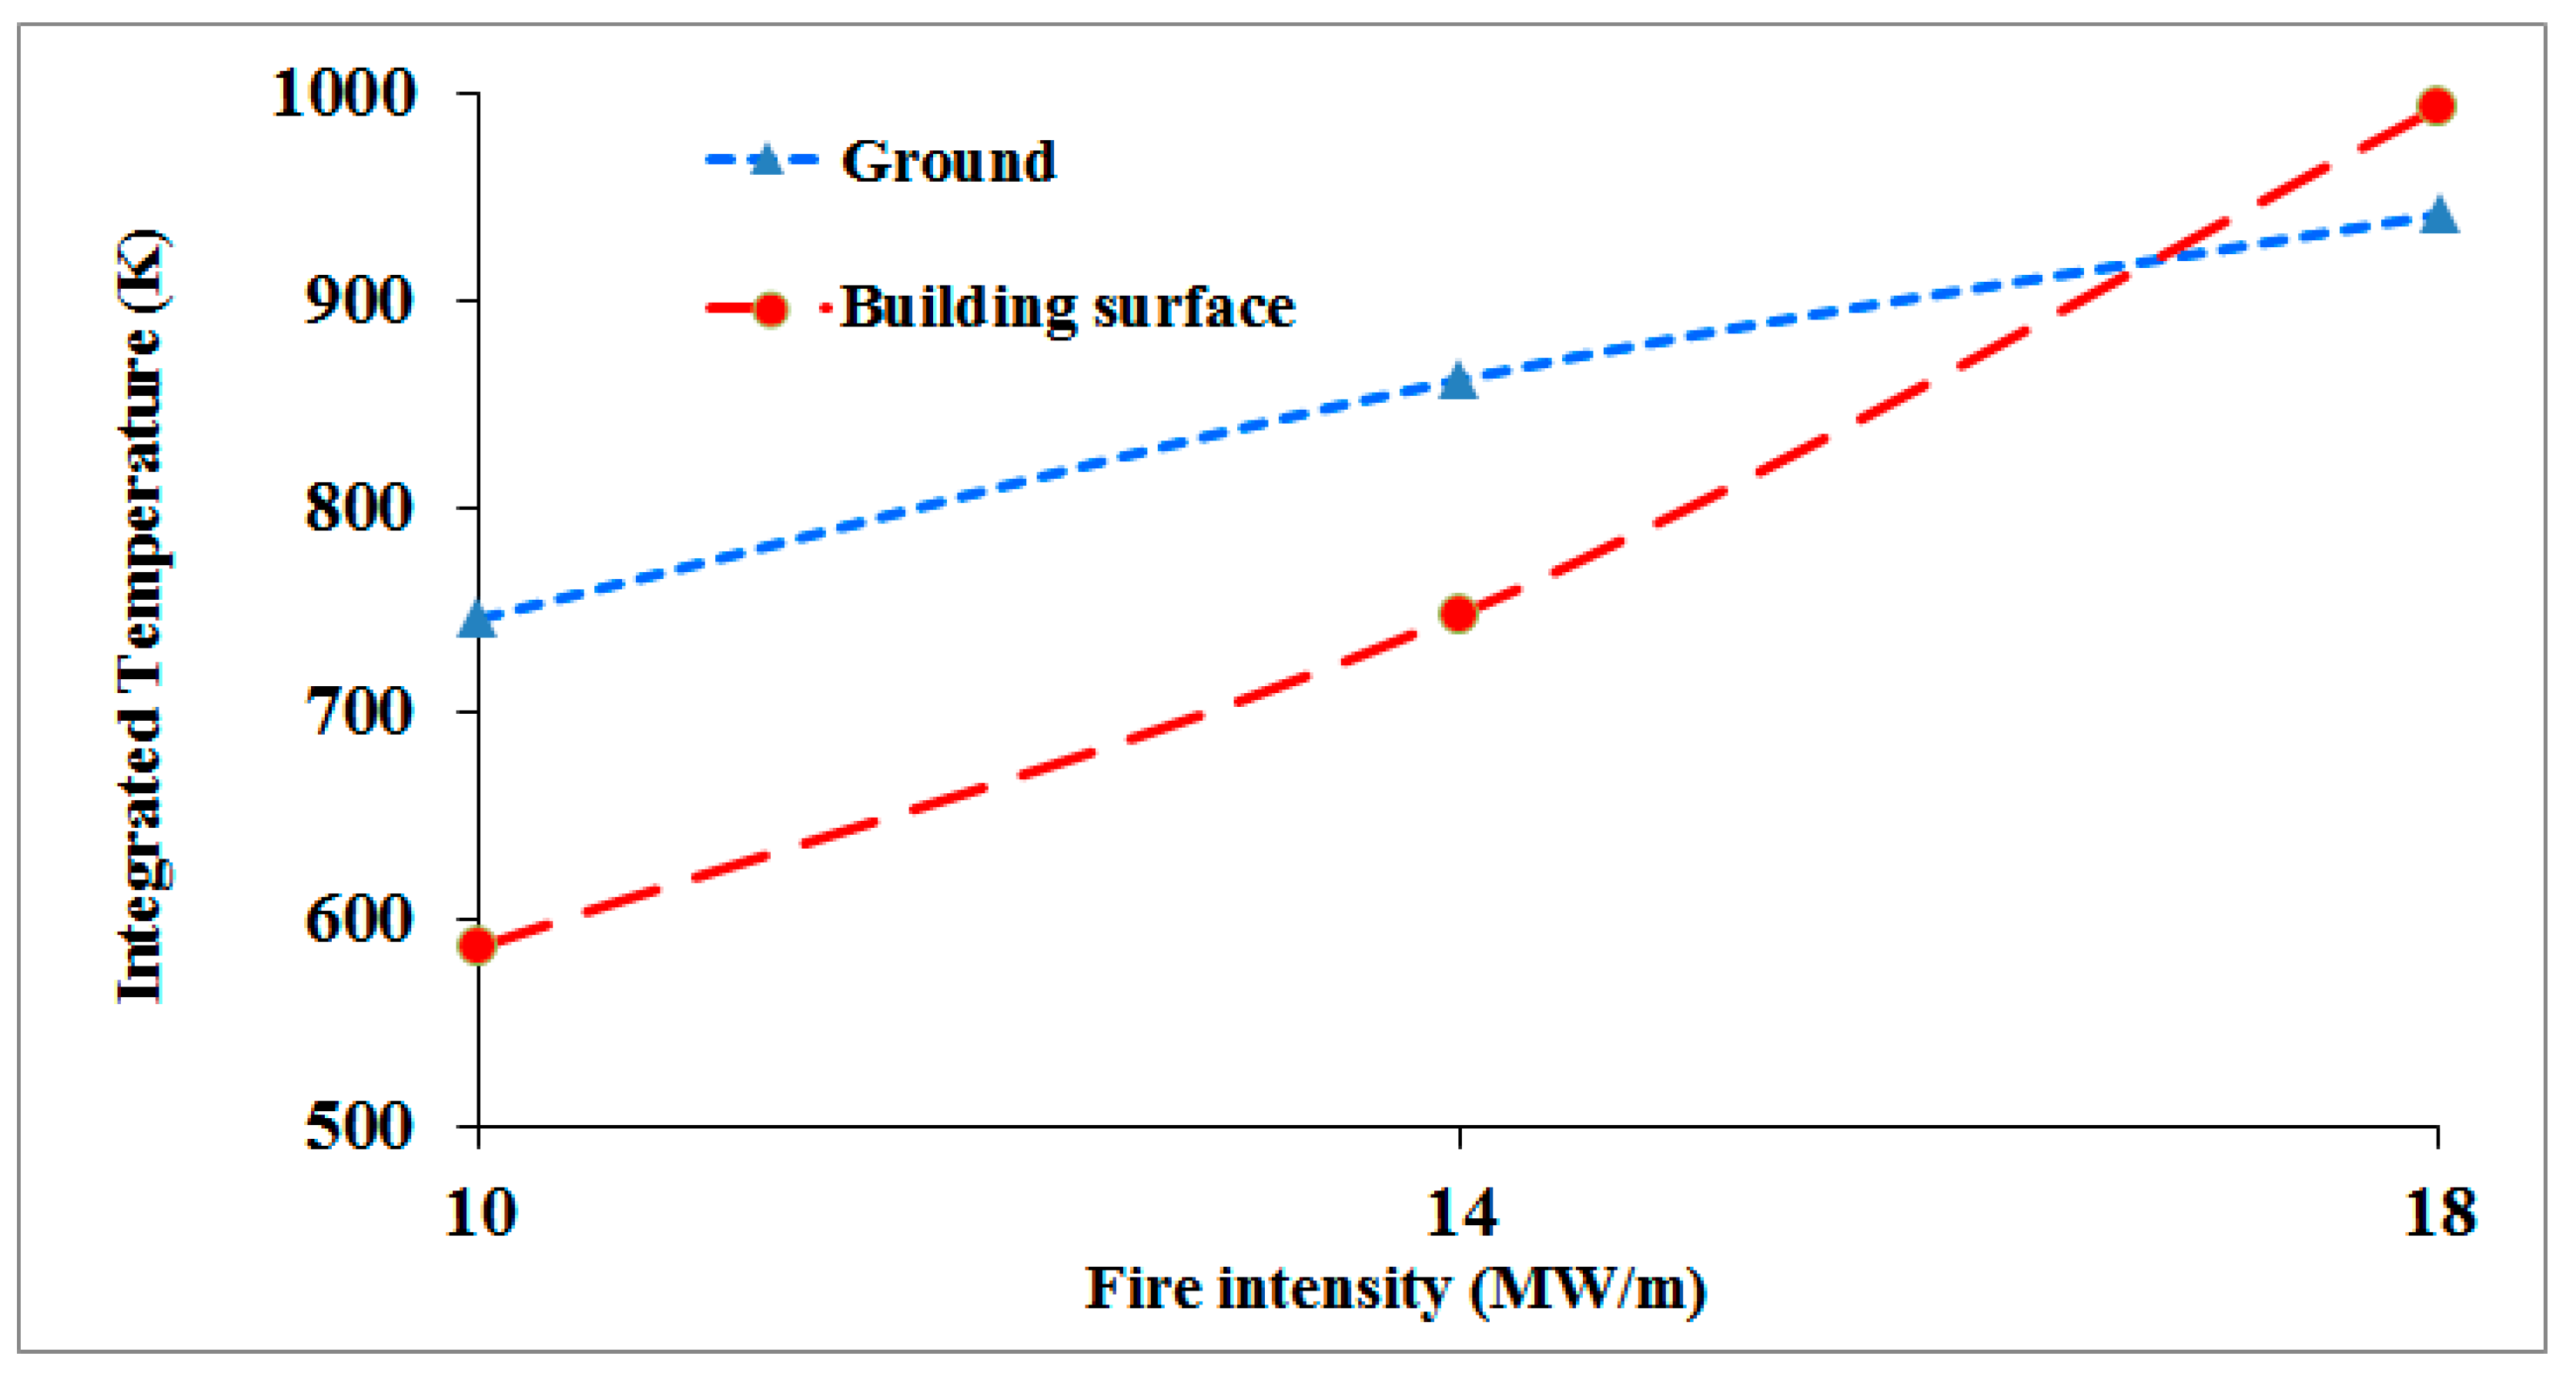
The integrated temperature is defined as the mean temperature of the whole surface. Due to the fact that each point of the surface has a different temperature, the integrated temperature is calculated in these simulations.
Figure 8 indicates the integrated temperature on the ground at the domain and the building surface for three different fire intensities. As seen, the overall trend observed in the cases shown in
Figure 8 aligns well with the description of
Figure 7, so that by increasing the fire intensity, the mean temperature of the ground and the surface temperature of the building increase. Increasing fire intensity from 10 to 18 MW/m, raises the integrated temperature on the ground and the surface of the building by 26%, and 69%, respectively. Looking at
Figure 8 in more detail, there is a sharp increase in the integrated temperature of the building surface for the higher fire intensity values. This is due to the increase in fire plume length enhanced by the wind velocity, which is carried toward the building area that is perpendicular to the ground. Generally speaking, fire intensity values and integrated temperature of the ground and the building surface are directly related.
Figure 9 shows the temperature distribution at the surface of the building for different fire intensities. Quite obviously, the front surface of the building has the highest temperature; this is due to having the highest view factor for the radiation heat transfer from the fire source. By increasing the fire intensity, the maximum temperature on the building surface increases. The random appearance of the provided contours is caused by instabilities between the buoyancy force and inertial wind flow, which create turbulent flames.
Basically, wildfire risk at the WUI (Wildland-Urban Interface) can be described as a combined function of fire probability, fire intensity, and fire effects [
49]. That is, a wildfire risk evaluation at the WUI evaluates both the likelihood and extent of wildfire-related impacts. This work is an initial attempt at understanding the impact of fire intensity of a wind driven wildfire at the WUI. The results outlined in this study bring up some inquiries on the rationality of risk management measures, such as the one in Australian Standard AS 3959, Construction of Buildings in bushfire-prone areas [
55].
In AS3959, the flames are basically represented as a hot surface inclined at a fixed angle that is obtained by the balance between wind velocity and fire intensity. In contrast, the numerical results described in this research emphasize the transient nature of wildfire spread and suggest that a wildfire can instantly generate flames that vary between being attached to the ground and more vertically positioned upwind from a structure.
Flames that are attached to the ground have a higher likelihood to suffuse a structure with convective heat transfer. A higher pulse frequency exists between attached and separated flame regimes and happens upwind from a structure, proposing that convective heating can have a substantial impact on the heat contact of building façades right in the trail of an approaching fire front. The present study proposes a practical framework for assessing the wildfire intensity effects on WUI areas.
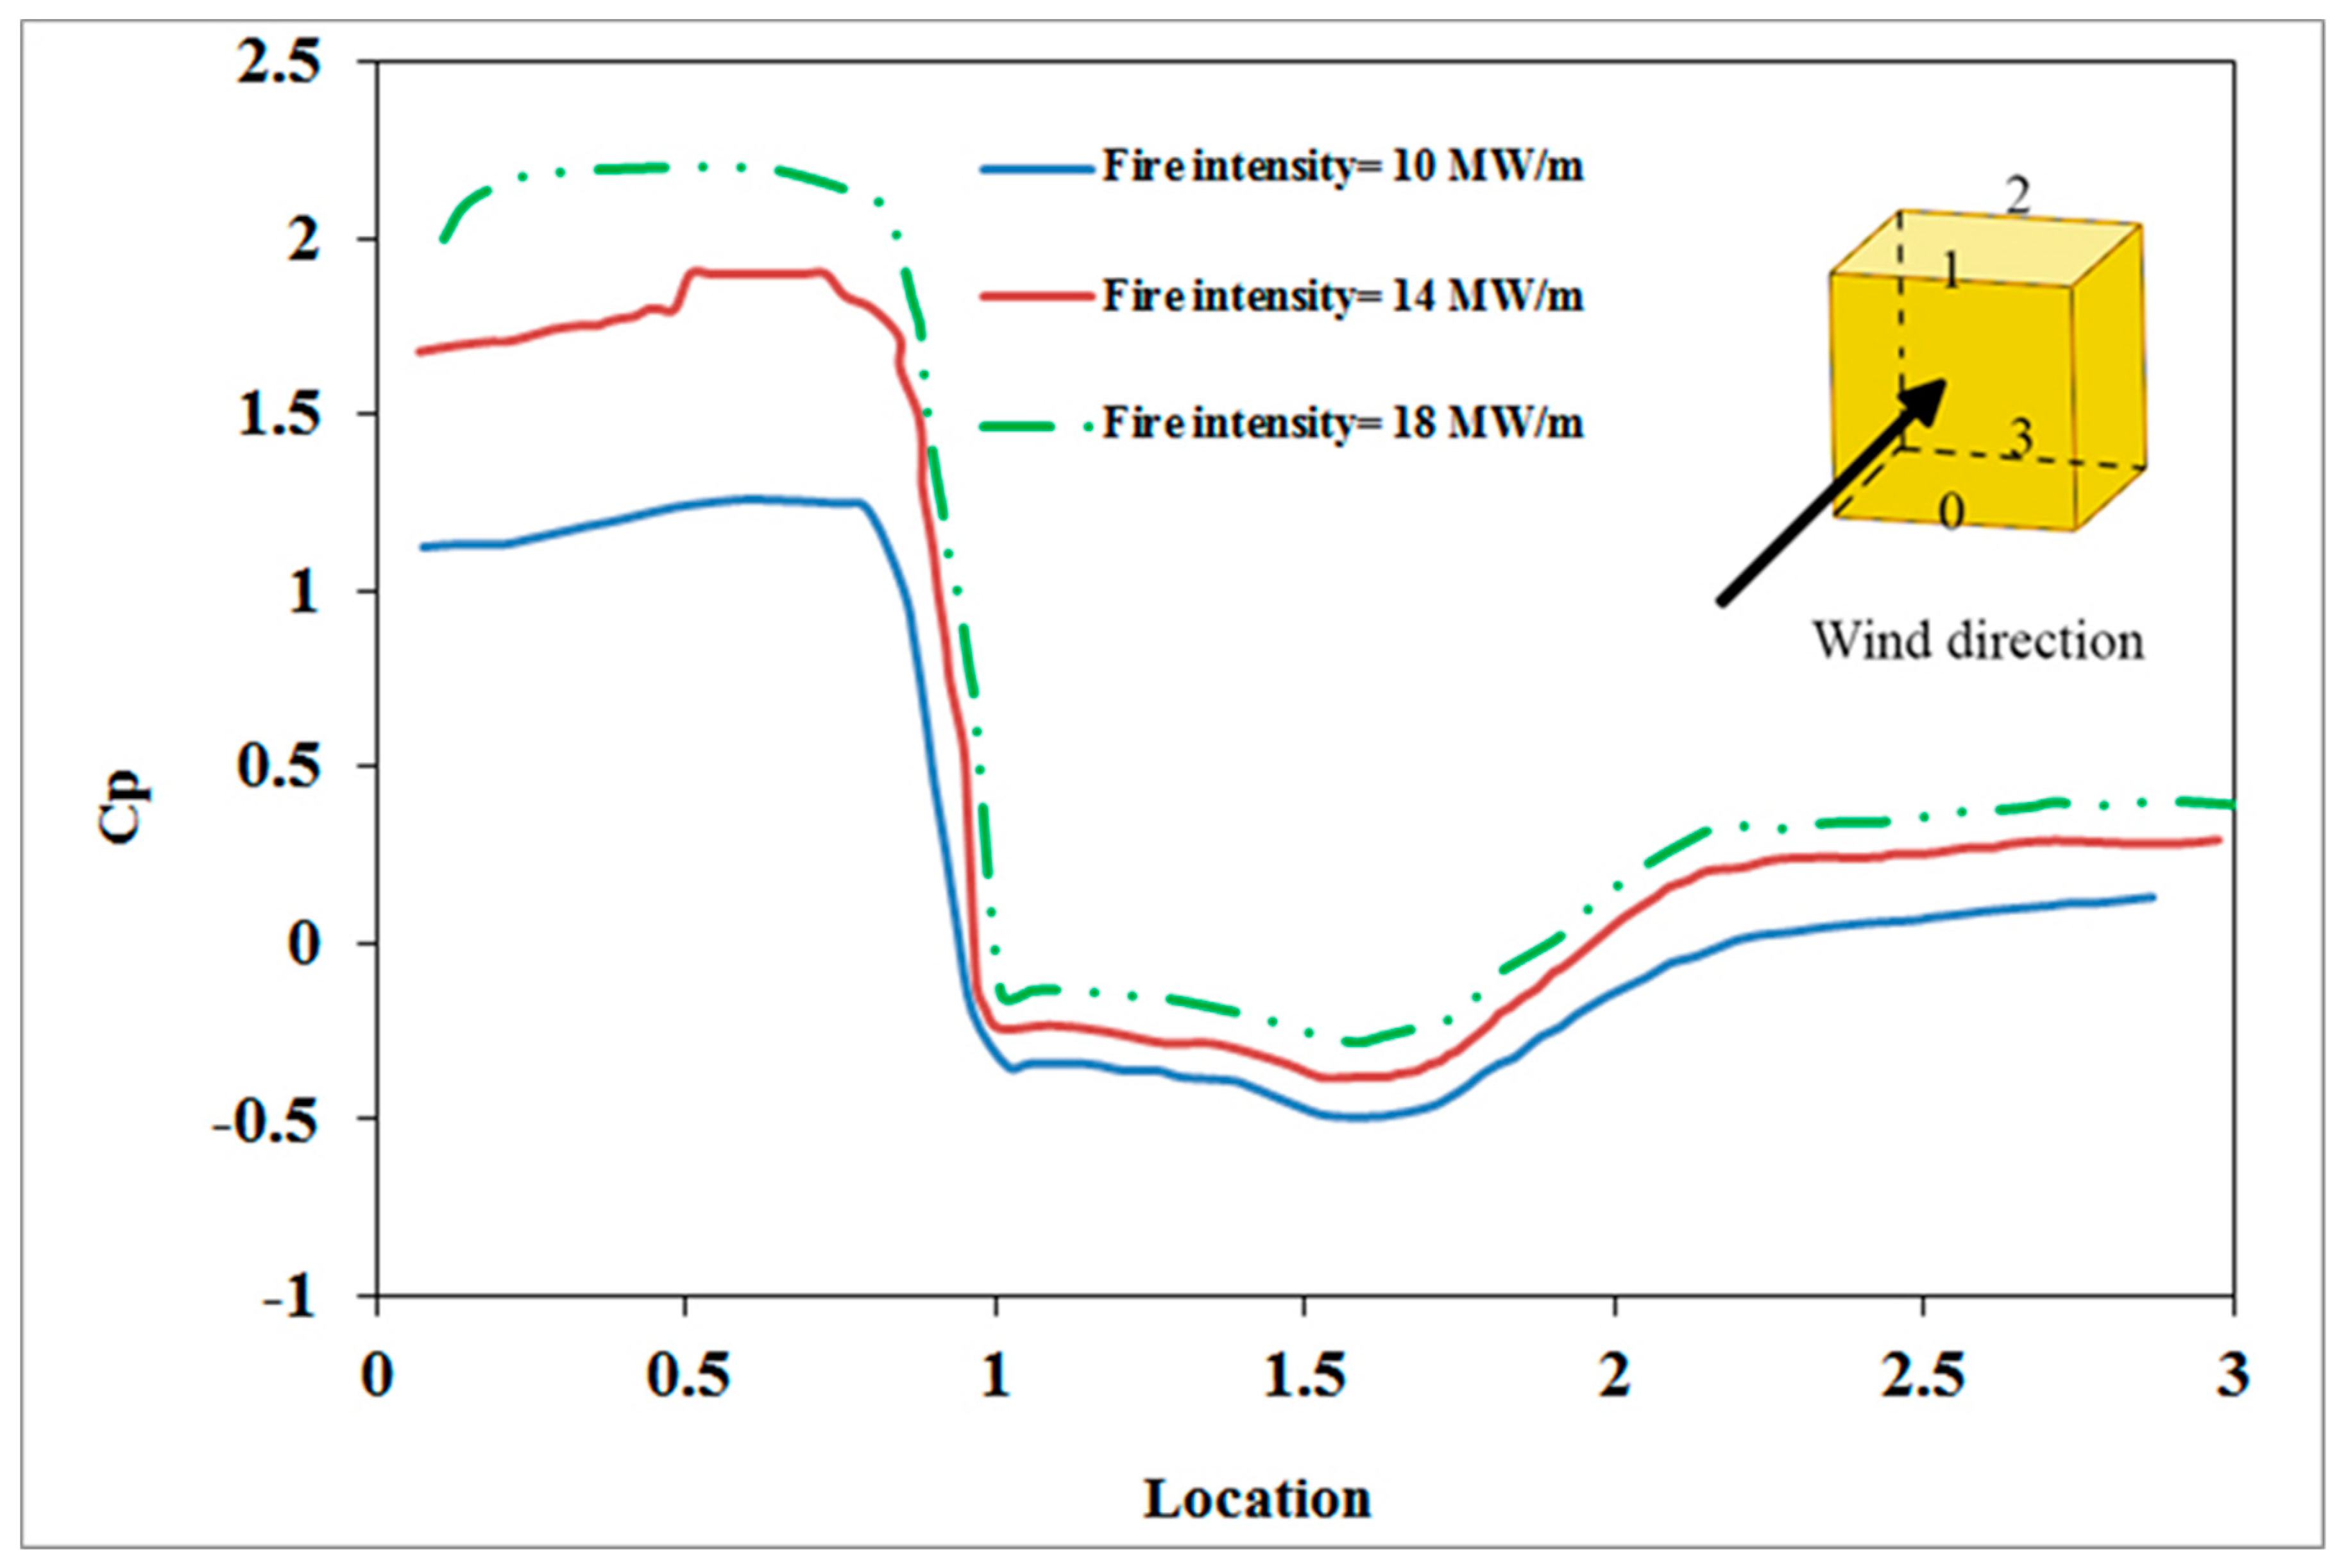
The mean pressure coefficient on the building for various fire intensity values are presented in
Figure 10. By increasing the fire intensity, the pressure coefficient is increased. This is mainly due to decrease in the air pressure around the building at the downstream from the fire. The maximum value of the mean pressure coefficient occurs in front of the building. This is due to the higher value of the local pressure.


