Article

New In-Flame Flammability Testing Method Applied to Monitor Seasonal Changes in Live Fuel

by
Oleg M. Melnik
1,2,*,
Stephen A. Paskaluk
3,
Mark Y. Ackerman
4,
Katharine O. Melnik
5,
Dan K. Thompson
6,7,
Sara S. McAllister
8 and
Mike D. Flannigan
1
1
Department of Renewable Resources, University of Alberta, Edmonton, AB T6G 2H1, Canada
2
Fire Operations, Forest Management Division, Department of Environment and Natural Resources, Government of the Northwest Territories, Fort Smith, NT X0E 0P0, Canada
3
Department of Human Ecology, University of Alberta, Edmonton, AB T6G 2N1, Canada
4
Department of Mechanical Engineering, University of Alberta, Edmonton, AB T6G 1H9, Canada
5
School of Civil and Natural Resources Engineering, University of Canterbury, Christchurch 8140, New Zealand
6
Northern Forestry Centre, Canadian Forest Service, Edmonton, AB T6H 3S5, Canada
7
Great Lakes Forestry Centre, Canadian Forest Service, Sault Ste. Marie, ON P6A 2E5, Canada
8
Fire Sciences Laboratory, Rocky Mountain Research Station, USDA Forest Service, Missoula, MT 59808, USA
*
Author to whom correspondence should be addressed.
Submission received: 13 November 2021 / Revised: 18 December 2021 / Accepted: 20 December 2021 / Published: 23 December 2021
(This article belongs to the Special Issue Advances in the Measurement of Fuels and Fuel Properties)

Abstract

:
Improving the accuracy of fire behavior prediction requires better understanding of live fuel, the dominant component of tree crowns, which dictates the consumption and energy release of the crown fire flame-front. Live fuel flammability is not well represented by existing evaluation methods. High-flammability live fuel, e.g., in conifers, may maintain or increase the energy release of the advancing crown fire flame-front, while low-flammability live fuel, e.g., in boreal deciduous stands, may reduce or eventually suppress flame-front energy release. To better characterize these fuel–flame-front interactions, we propose a method for quantifying flammability as the fuel’s net effect on (contribution to) the frontal flame energy release, in which the frontal flame is simulated using a methane diffusion flame. The fuel’s energy release contribution to the methane flame was measured using oxygen consumption calorimetry as the difference in energy release between the methane flame interacting with live fuel and the methane flame alone. In-flame testing resulted in fuel ignition and consumption comparable to those in wildfires. The energy release contribution of live fuel was significantly lower than its energy content measured using standard methods, suggesting better sensitivity of the proposed metric to water content- and oxygen deficiency-associated energy release reductions within the combustion zone.

1. Introduction

The efficiency of wildland fire management in protecting values at risk and addressing emerging climate change-related environmental challenges depends on the ability to predict wildfire behavior, which is controlled by the fire environment [1]. Increasing the understanding of the fuel component of the fire environment, in particular, the flammability of live plant material available for combustion (i.e., live fuel) can improve the accuracy of fire behavior predictions [2,3]. As a dominant component of crown fuel consumption, live fuel drives crown fires, which are difficult to predict and control, and which make up the largest part of the area burned in the North American boreal forest [4]. Ever since the development of the first operational fire models in the 1970s, it was thought that the consumption of live fuel by a flame-front and the resulting effects on the wildfire behavior were minor compared to those of dead fuel. However, by analyzing the consumption data from Stocks [5] and considering only the flaming front [6], it was shown that live fuel constituted at least 48–60% of the mass consumed in a crown fire [7] or likely even more, because the data analyzed only accounted for green foliage and did not include the fresh branchwood also consumed in the flame-front [8]. The flammability and overall proportion of available live fuel and its effects on crown fire behavior will likely also increase in the future with increased drought [9] and wildfire intensities [10].
The flammability of live fuel has been measured via numerous metrics, including time-to-ignition (ignitibility), combustion rate (combustibility), duration (sustainability) [11], and completeness (consumability) [12]. None of the above metrics are considered in the Canadian Forest Fire Behavior Prediction (FBP) System; instead, foliar moisture content (FMC) is used. The actual use of FMC is largely limited to determining the initiation of crowning because FMC is used for predicting the rate of crown fire spread only in the conifer plantation fuel type (C-6) where sufficient data are available. FMC is seasonally adjusted for conifer bud burst phenology, but it does not account for drought-induced increases in live fuel flammability and crown fire behavior. Along with extreme weather, drought is a primary driver of the occurrence, intensity, and difficulty of suppression of wildfires [13]. Both drought-induced relative plant water content loss, as a measure of physiological drought [14,15], and the associated increase in flammable volatiles [16] raise live fuel flammability [17,18,19,20]. However, the seasonal pattern of FMC in the FBP model is static year-to-year and, therefore, is insensitive to the level of drought and the drought-induced changes in live fuel flammability during a particular fire season. While the level of drought is accounted for by using the Drought Code from the Fire Weather Index System, which represents water content in the organic forest floor soil layer 10–20 cm deep [21], for live vegetation it should be evaluated by using the water availability in the soil layer penetrated by roots—on average 2 m deep for boreal forest tree species [22]. In the American National Fire Danger Rating System (NFDRS), FMC is sensitive to drought and used for predicting the flammability of herbaceous material and shrubs, but not tree species [23].
FMC only accounts for the water content and flammability of foliage, while crown fire also consumes fresh branchwood [8,24] that has different flammability [25] due to differences in water content [26], chemical composition, and spatial structure. FMC only partially represents live fuel flammability, while dry matter content, density, and chemical composition are equally important [19,20,27,28,29,30]. Therefore, FMC alone can only partially explain live fuel flammability, as well as the initiation, type [31,32], and spread rate of crown fires [33]. While the effect of live fuel moisture content or FMC on fire rate of spread is considered to be underestimated [3], FMC has not shown a statistically significant relationship with the rate of fire spread in field-scale experimental fires [34,35]. Considering these issues and given the complexities of chemical and physiological measurements across the multiple interacting drivers of flammability such as moisture (e.g., FMC), density, and chemical composition, a simple experimental method for monitoring live fuel flammability directly is needed to provide more adequate input into fire behavior and flame propagation modelling.
Flame propagation is a chain of events where already burning fuel elements preheat and ignite subsequent elements. The propagation rate can be calculated as the ratio of the distance to the next fuel element to its time-to-ignition [36]. However, time-to-ignition alone does not provide a complete characterization of fuel flammability or flame propagation. Greater energy release results in more available energy to ignite the next fuel element, a shorter time-to-ignition [12], and a potentially higher rate of spread. If the energy release is less than that required to ignite the next fuel element, the fire will not spread. To represent the mass-energy transfer processes during flame propagation, flammability should consider the fuel’s capacity to release energy. Babrauskas et al. [37] considered the heat (energy) release rate to be the most important variable in determining fire hazard. The available energy release per unit area within the flaming front (energy release component) is an important output of the NFDRS [38]. The energy release from burning fuel into the unburned fuel ahead (horizontal propagating flux) has been linked with the rate of fire spread, the preheat ignition energy, and the fuel bulk density in the heat balance equation [39]. This relationship is used for calculating the rate of spread in the Rothermel surface fire spread model within the NFDRS [40], predicting the initiation of crowning [31], and modifying crown fire rate of spread [33] within the FBP. A fire-front’s energy release rate, or fire intensity, directly affects firefighter safety [41], the probability of initial attack success [42], and the range of adequate strategies and tactics for wildfire control [32]. Fire intensity in Byram’s [43] formula is calculated as a product of the dry mass of fuel consumed per unit area in the active flaming zone, the rate of fire spread, and heat of combustion (H) as a measure of fuel flammability.
Heat of combustion has been traditionally measured using oxygen bomb calorimetry as the gross (“high”) heat of combustion (Hgross, kJ g−1). By testing oven-dry plant material in a pure oxygen environment (e.g., [25]), Hgross overestimates potential energy release. To evaluate a more realistic “lower” heat of combustion, or “heat yield”, Hgross requires adjustment for losses and reductions in energy release that occur within real flame-fronts and are related to the significant and variable water content of live plants [43]. For instance, the FMC of white spruce ranges from 75% to 480% [44,45] or even 500% (as measured in this study) of dry mass. The combustion of live fuel occurs simultaneously with the evaporation of water present in substantial quantities [46,47] because high internal leaf pressure during burning allows live plant tissue to retain water within the temperature range of 160 °C to 220 °C, which is substantially higher than the normal boiling point (100 °C) of water [48]. Additionally, the high heating rates of a typical fire often create temperature gradients within the fuel, with surfaces reaching ignition temperatures while water is still being evaporating from the much cooler internal regions [27]. High energy losses for fuel preheating as well as for evaporation of water of the reaction and water contained in the fuel [43] in turn result in a reduction in reaction temperature and energy release. When compared with rehydrated dead foliage of similar moisture content, live foliage reaches a lower temperature during preheating and drying within an incoming flame (175 °C versus 200 °C), exhibits a noticeably slower temperature increase, and takes longer to ignite (10 s versus 5 s) [48]. Further reductions in energy release are caused by the dilution of the gaseous products of pyrolysis and oxygen by water vapor [43,47,49], the oxygen deficiency due to increased oxygen consumption [47,50], and the flow dynamic alteration of interacting flames [50] resulting in an incomplete combustion and a substantial release of unburned hydrocarbons from high-intensity fires [43]. The FBP System does not take all these factors into account, and instead applies a heat of combustion of 18 kJ g−1 [51] estimated as Hgross with a single 5–10% deduction for energy lost via the evaporation of only water of the reaction but not water contained in the fuel [52]. This can lead to a substantial error in fire intensity estimation.
The effective heat of combustion (Heff, kJ g−1) [18] measured using oxygen consumption calorimetry better accounts for reductions associated with oxygen deficiency and water content by testing fresh plant material in an open-air environment (instead of pure oxygen). It also produces an “effective” value that accounts for incomplete char oxidation, which is observed in real wildfires due to the short duration of flaming combustion during fire front passage. Within the 80–170% range of moisture content typical for live conifers, Babrauskas’ method produced values of Heff at 7–12 kJ g−1 (fresh mass basis), or approximately 19 kJ g−1 dry mass basis (at an average of 100% shoot water content) for live fuel [18], which is close to that measured as Hgross or assumed by the FBP model at 18 kJ g−1. The method only partially represents real fires because it utilizes radiative-only heating, while fuels in a wildfire setting are exposed to both radiative and convective heat transfer. Convective heating has been considered [31,53,54] and has been shown to be the dominant energy transfer mechanism in many cases [55], especially in the mid-upper portion of the canopy [56].
Additionally, Heff, as measured by Babrauskas [18], is insensitive to additional reductions in energy release resulting from the interaction of the live fuel flame (reacting flammable gases emitted by the recently ignited live fuel element) with the incoming frontal flame (the combined flame comprised of reacting flammable gases emitted by the already burning fuel elements) (Figure 1, left) within the flames interaction zone (FIZ). This interaction of the flames results in the creation of an oxygen-deficient gaseous mixture caused by the increased oxygen consumption and flow dynamic alteration for the live fuel flame. Therefore, the energy release of the live fuel flame within the FIZ (Figure 1, left) is most likely lower than the energy release of the live fuel flame alone, tested traditionally as Heff using oxygen consumption calorimetry, in which oxygen deficiency is nearly absent because the fuel is surrounded by air due to the use of radiant only heating (Figure 1, right). Moreover, the energy release of the incoming frontal flame itself (Figure 1, left) in the FIZ may also be reduced—both by oxygen deficiency and by the high water content of the live fuel. These reductions are not accounted for by the existing techniques due to the complexity of the multiple factors involved such as fuel water content, dry matter content, the rates of heating, pyrolysis, and water evaporation, as well as the concentrations of oxygen, pyrolysates, and water vapor. Thus, the net change in the energy release of the incoming frontal flame resulting from its interaction with the live fuel element burning within the flame, or the fuel’s net contribution to the frontal flame energy release, may be substantially smaller than Hgross or Heff.
Figure 1. A conceptual diagram of the combustion environment. Left: combustion of a live fuel element in a real wildfire where the live fuel flame interacts with the incoming frontal flame. The region where these flames interact—the flames interaction zone (FIZ)—includes energy release reductions that are unaccounted for by current methods. The vertical direction of flame propagation on the diagram, from bottom to top instead of forward-upward as in real crown fire flame-fronts, represents the experimental setup and apparatus. Right: combustion of a live fuel element in traditional tests out of a frontal flame where the live fuel flame is surrounded by atmospheric air as performed, for example, when measuring effective heat of combustion using standard oxygen consumption calorimetry test setup, e.g., [57].
Fire 05 00001 g001
Considering these issues, the main objective of this study was to introduce a new experimental methodology, developed by Melnik et al. [58] and Paskaluk et al. [59], which utilizes in-flame flammability testing (1) to better represent ignition heat transfer within wildfires and (2) to physically represent and account for the additional energy release reductions resulting from the interaction of flames within the FIZ discussed above. Instead of separately estimating the energy release reductions that exist in real flame-fronts and subtracting them from the gross heat of combustion to evaluate “heat yield” [43], the proposed methodology directly measures the heat yield added to the flame-front by the fuel element as the fuel element’s energy release contribution to the incoming frontal flame.

2. Materials and Methods

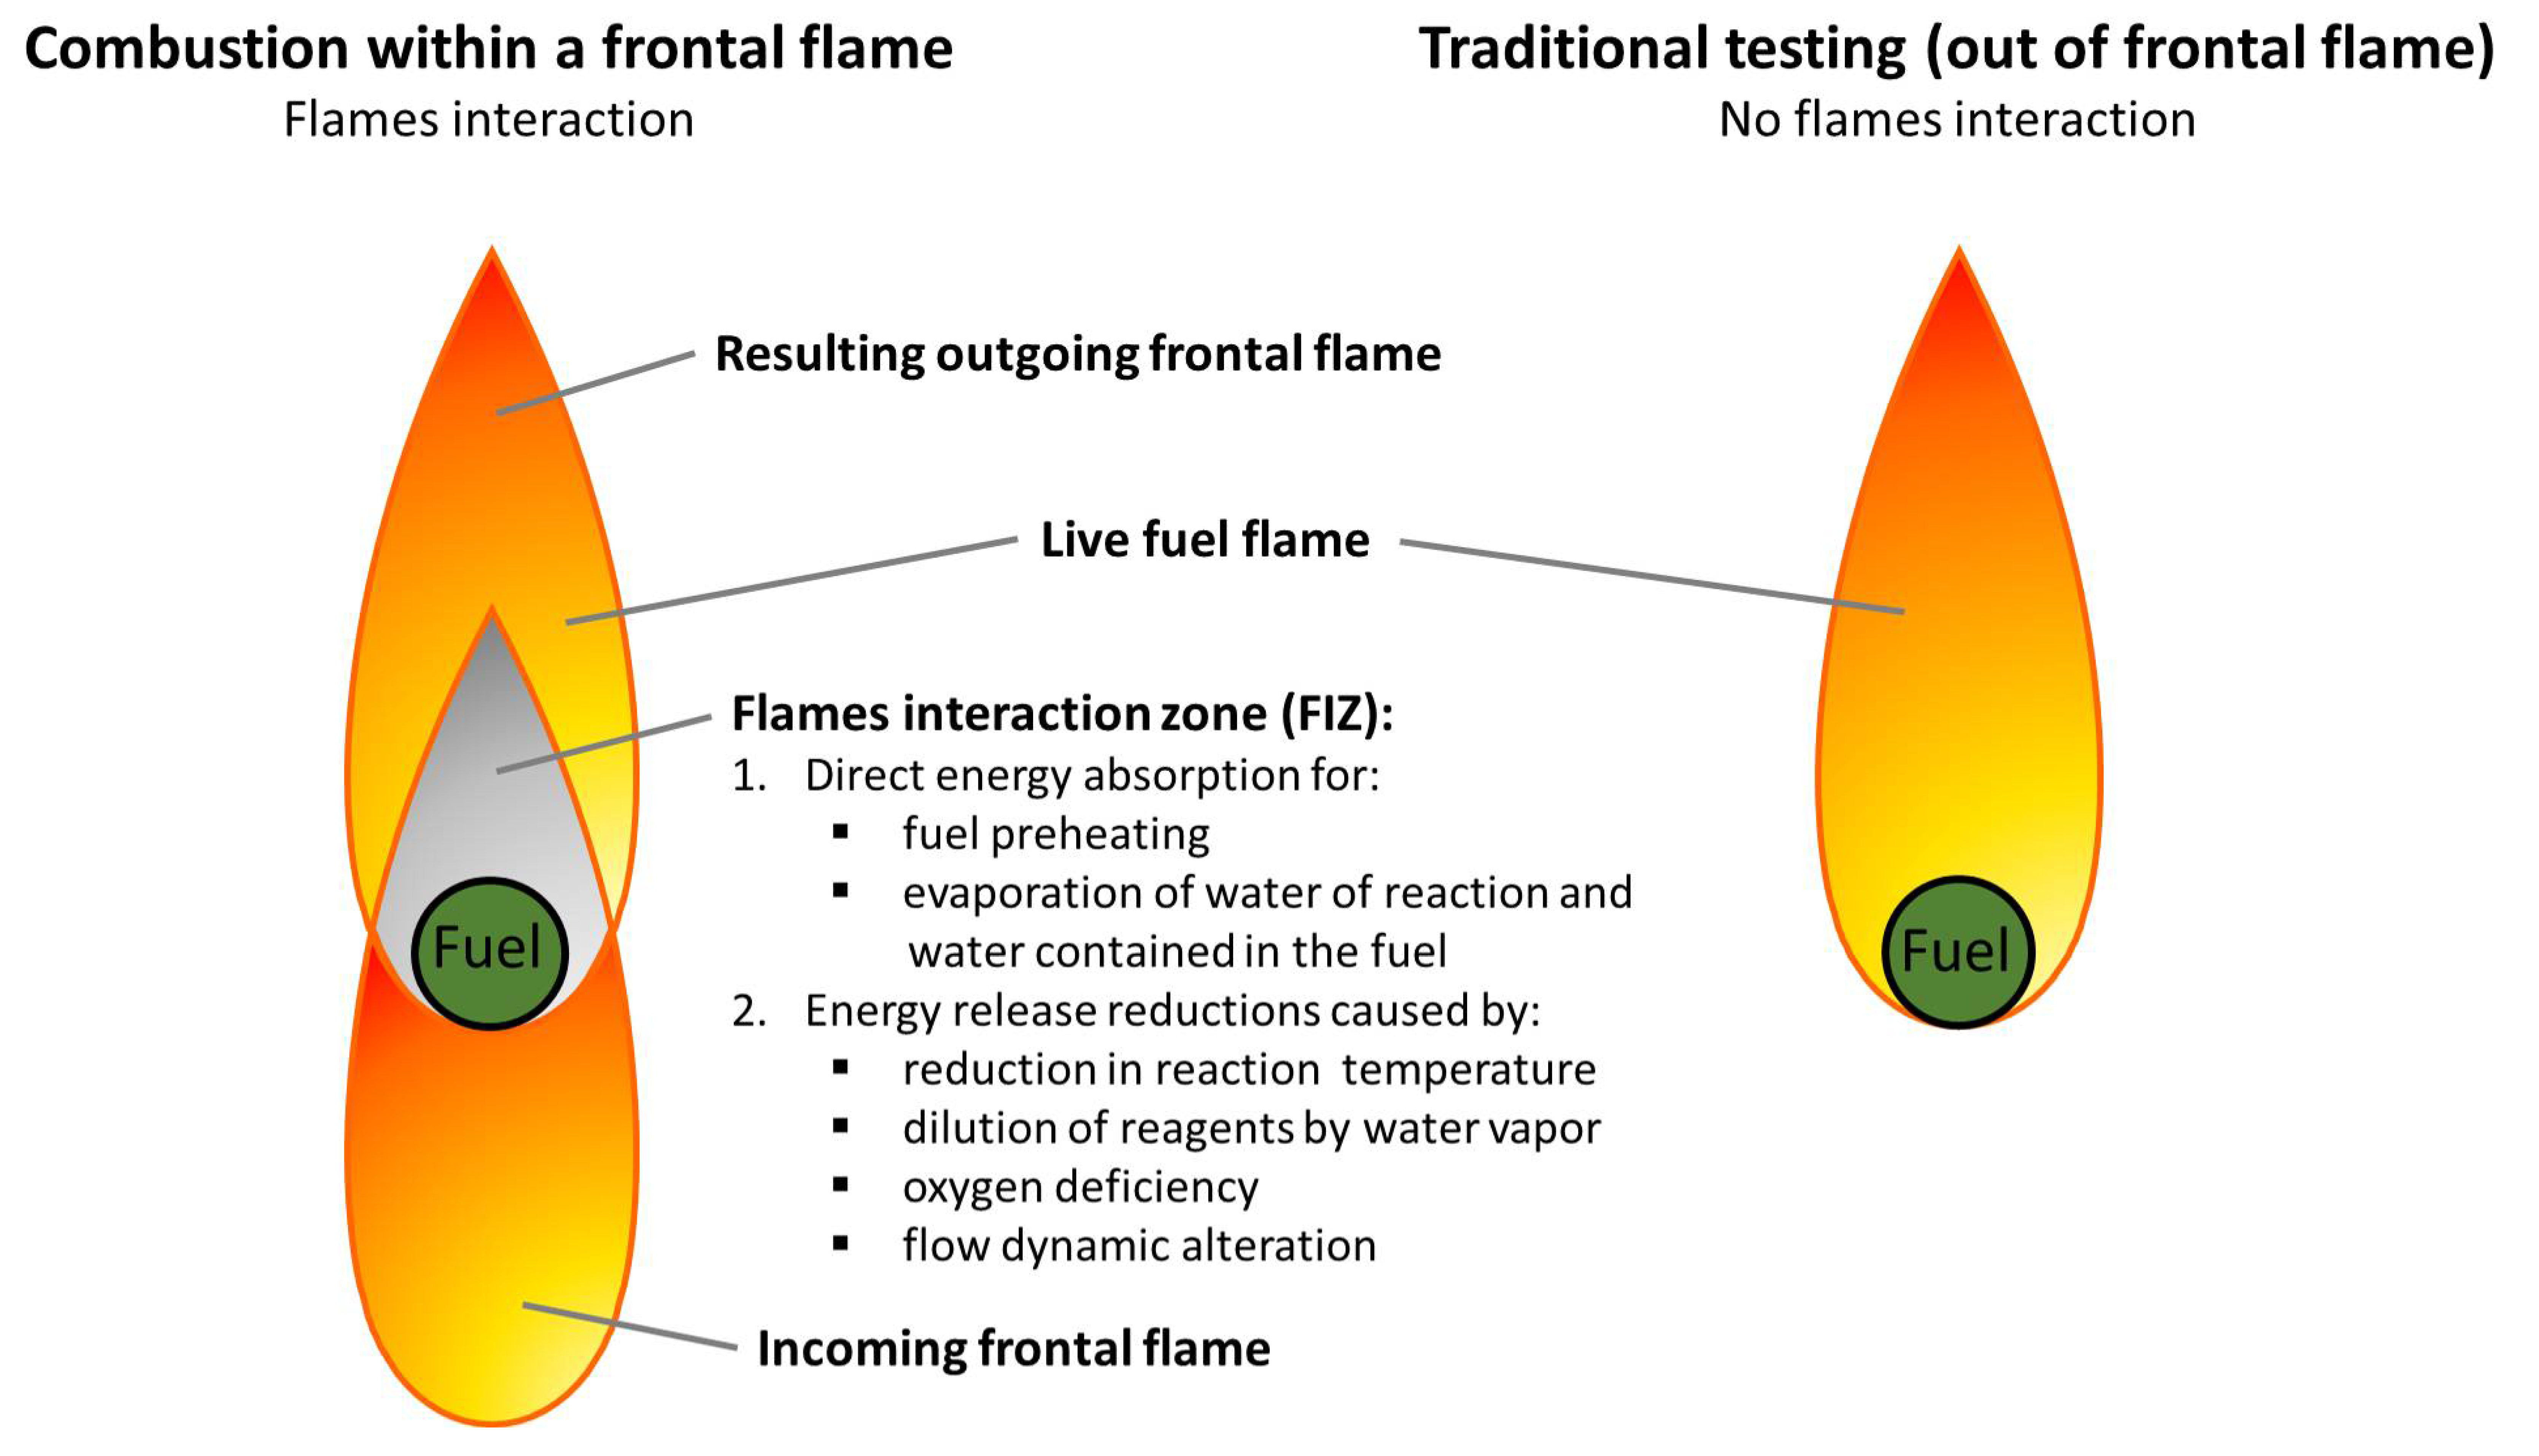
2.1. Fuel Element’s Energy Release Contribution to the Incoming Frontal Flame

The incoming frontal flame was simulated using a non-premixed methane diffusion flame. Although methane is one of the combustible gases released by wildland fuels, methane was used in the tests primarily due to being a readily available laboratory gas with a well-known and consistent composition and heat of combustion. The known flow rate of methane in the tests allows to calculate its energy release potential to verify HRR values measured with oxygen consumption calorimetry. Importantly, using a non-premixed diffusion methane flame facilitates the creation of exposure conditions similar in temperature and oxygen concentration to those encountered in the diffusion rate-limited wildfire flame with a temperature typically around 1000 °C. The flame was produced by a 10 × 10 cm open burner that provided approximately 40 kW m−2 total heat flux measured at the bottom-center of the sample holder with radiative heating comprising about 35% of this value, which is higher than the 15–20% radiative heat fraction reported in the literature for smaller methane flames [60,61]. The fuel element was represented in the tests by a live fuel sample. Therefore, the fuel element’s contribution to the energy release of the incoming frontal flame ∆e+ was measured using oxygen consumption calorimetry [57] as the net difference in energy release between the methane flame interacting with the live fuel sample (Figure 2a) and the methane flame alone (Figure 2b), as in Equation (1) below.
∆e+ = Q (incoming flame + fuel) − Q (incoming flame alone)
where: ∆e+ is the fuel element’s/sample’s contribution to the energy release of the incoming flame (kJ), Q(incoming flame + fuel) is the total energy release of the methane flame interacting with the live fuel sample burning within it (kJ), and Q (incoming flame alone) is the total energy release from the methane flame alone (kJ).
In a wildfire, live fuel interacts with the passing flame-front and contributes to its energy release, propagation, and behavior only during the time in which the flame-front is present and the fuel is exposed to it. This flame-front exposure time includes fuel preheating/ignition time and flame-front residence (flaming combustion) time. By analyzing existing literature and fire-front video recordings [56,62,63], the flame-front exposure time is estimated to be on average 61 s, including 29 s of fuel preheating/ignition time and 32 s of flame-front residence time (Table 1). The relevance of this analysis for the particular fuel type used in the present study (conifers) was confirmed by our preliminary experimental results [59] showing that burning fuel contributes significantly to the heat release rate (HRR) of the incoming methane flame for only a short period (55–65 s). Therefore, to adequately represent the fuel element’s contribution to the energy release of the passing flame-front, the duration of 60 s was chosen for the evaluation of the total energy release of the incoming methane flame with the fuel sample burning within the flame (Equation (1)) by integrating its HRR measured with oxygen consumption calorimetry [57]. This 60-s integration window ensured that fuel ignition, flaming combustion, and, partially, char oxidation phases were included in the evaluation. The total energy release of the methane flame alone passing an empty sample holder was determined by integrating its measured HRR over the same time period. Methane-only tests were conducted both at the beginning and at the end of each day of testing, and these two results were averaged to provide a reference HRR over the 60 s period. This measurement was compared to the theoretical value calculated from the measured methane flow rate to confirm the result.
HRR calculations were performed as specified for oxygen consumption cone calorimeter tests in [57], based on O2 and CO2 measurements using a Fire Testing Technology (East Grinstead, West Sussex, UK) bench scale mass loss calorimeter instrumented with a Model 300 analyzer from California Analytical Instruments (Orange, CA, USA) with IR CO and CO2 detectors. The exhaust was sampled at 0.017 L s−1 through the paramagnetic oxygen analyzer. Data were collected at 10 Hz per channel with a USB-2416 data acquisition device (Measurement Computing Corporation, Norton, MA, USA) and a PC using DASYLab 11 data acquisition software (Hoskin Scientific, Burnaby, BC, Canada). The mass loss of the fuel samples during the tests was measured using a 600 g load cell with a custom-made lightweight methane burner mounted on top. Methane flow to the burner at 0.15 L s−1 during testing was controlled with a rotameter to provide a diffusion flame with a nominal heat release rate of 5.5 kW. During each test, after a wire-mesh sample holder containing a pre-weighed sample was placed on the methane burner, data acquisition was initiated, and the methane flow was started and ignited using a gas lighter. Since data acquisition continued for four minutes, the approximately 15 s delay between the start of data acquisition, ignition, and the gas analyzer sampling resulted in 225 s of test data. The measurement uncertainty for standard oxygen consumption calorimetry in an open system, where the products of combustion are diluted with ambient air, includes the uncertainty associated with oxygen concentration measurements (oxygen analyzer accuracy), the assumed heat of combustion (calorimetric coefficient E), measurements of the mass flow rate of the exhaust products, and the assumed combustion expansion factor, which depends on oxygen depletion [64]. The total range of uncertainties in the measured heat release rate could be as high as 20% primarily due to analyzer uncertainty at low oxygen depletion levels, which decreases with moderate oxygen depletion and increases again from 12% to 15% with growth in oxygen depletion, ambient air dilution, and higher contribution of the assumed expansion factor [64]. The uncertainty of CO and soot corrections is lower when the composition of the fuel is known [64] and is expected to be ±5% or lower for conventional organic fuels when the 13.1 kJ/g constant, widely accepted for oxygen-consumption calorimetry, is used [65]. Instead of focusing on measuring the heat release rate directly, this study rated the heat release rate of the combined flame (methane plus forest fuels) relative to a methane flame alone. Since most of the measurement uncertainties are the same for both measurements and are negated in the relative measurement, the uncertainty in this study can be expected to be even smaller than reported by Huggett [65]. More details on the apparatus, procedure, as well as data acquisition and analysis can be found in Paskaluk et al. [59].
The energy release contribution ∆e+ in Equation (1) measures the difference in energy release for the incoming flame that resulted from the interaction with the fuel element and, similarly to the effective heat of combustion Heff in [18], considers an “effective” value that accounts for incomplete char oxidation. Therefore, the fuel element’s/sample’s energy release contribution ∆e+ (kJ) in Equation (1) will be referred to as the fuel’s differential effective heat of combustion (∂Heff, kJ g−1) when expressed either on a mass loss basis or a fresh mass basis. Both of these metrics were compared to determine which one better represented and predicted the flammability of live fuel. However, in the rest of the study, only fresh mass basis ∂Heff was considered and used to investigate the differences in flammability attributable to the age of the plant material, seasonal changes in live fuel flammability, and factors affecting these changes, as well as to evaluate the substantiality of the energy release reductions within the flames interaction zone.

2.2. Fuel Samples

Previous studies varied in terms of what was consumed during the flame-front passage in crown fires in coniferous forests—fresh foliage alone or with some fresh branchwood [31], or fresh foliage with fresh branchwood of varying diameters (0–3 mm [66], 0–10 mm [24], and 0–30 mm [8]). The plant material tested in this study consisted of fresh twigs/branchwood 0–9 mm thick with the attached foliage, collectively referred to as shoots. The flow of combustion gases around and through thin, sparsely distributed fuels, such as the live coniferous shoots consumed in a crown fire, significantly differs from the flow above surface fuels such as the layer of needles/foliage on the forest floor. The arrangement of needles removed from branches and laid flat in the sample holder is more representative of surface fuels than fuels consumed in a crown fire, potentially resulting in very different preheating, ignition, and burning behavior. Consequently, it is important to preserve the fuel structure in tests as much as possible, as was achieved in this study by testing the flammability and biophysical properties of the exact same live plant material as is consumed by crown fire—fresh shoots rather than foliage alone. To emphasize the focus on shoots, the terms shoot flammability and shoot water content (SWC) will be used in this study rather than the more traditional terms foliar flammability and foliar moisture content (FMC) or fuel flammability and fuel moisture content.
To adequately represent the spatial structure and flammability at a tree branch scale but to avoid variation in the results due to the irregular spatial distribution of shoots within the branch, fuel samples were standardized for fuel mass, spatial arrangement, and bulk density using the concept of “flatfuel sample of defined bulk density introduced in this study. A plant canopy is a porous fuel where a fuel element of given mass burns within the average per fuel element combustion space of given volume, which determines fuel porosity and bulk density. The volume of the roughly 30 × 30 × 30 cm combustion/testing space was 0.027 m3, which included an approximately 10 × 10 × 30 cm combined burner and sample flame with some surrounding air space since the flame is non-premixed (Figure 2). To standardize and represent in tests the typical canopy bulk density of full-density conifers at 0.2 kg m−3 [31,66,67], the fuel sample mass within the 0.027 m−3 space should be 0.0054 kg dry mass, or 0.011 kg fresh mass (at an average 100% shoot water content on a dry mass basis; see Section 2.5 below). These 11 g (mean value) samples were further used for flammability testing. To prepare a flat fuel sample of defined bulk density, approximately 9–13 g of shoots were arranged in a single layer (instead of many layers as on an actual tree branch) and placed into a sample basket, ensuring that the spatial arrangement of plant material resembled that in a real tree branch of white spruce (Figure 3a) and was as consistent as possible from test to test. The design of the wire-mesh sample holder allowed for a constant distance (5 cm) from plant material to the base of the methane flame and its unrestricted flow through the sample (Figure 3b).

2.3. Field Sampling

Sampling was performed in a 50 to 70-year-old mixed stand of white spruce (Picea glauca (Moench) Voss) and trembling aspen (Populus tremuloides Michx.) located in the ecological reserve of the University of Alberta Botanic Garden, 15 km SW of Edmonton, Canada. Eighteen white spruce trees 15–20 m tall were selected across the site to represent a variety of local soil moisture conditions. Sampling occurred between 12:00 and 16:00 during 11 sampling days without precipitation or visible moisture on the surface of the plants from May to October 2014. Each sampling day, three to five trees out of the 18 identified were randomly selected and one tree branch from each tree within lower-one-third outer south-facing part of the crown was harvested using a pole pruner (Figure A1). Tree branches were stored in resealable plastic bags in a refrigerator at 4 °C before flammability tests were performed. Full sampling protocols are described in [7].

2.4. Test Sequence

Each fresh tree branch was separated into shoots of different ages, and their respective mass proportions in the branch composition were measured. Four sample types were considered: new shoots (if present, N = 42), 1-year-old shoots (N = 48), 2+ year-old shoots (N = 48), and tree branch (made up of new, 1-year-old and 2+ year-old shoots according to their respective mass proportions in the composition of a given branch, N = 47). For each sample type, one fuel sample was prepared, and its differential effective heat of combustion (∂Heff) was tested (185 fuel samples in total). The remaining shoots of a given age were subsampled to determine water content, dry matter content, and fresh mass basis energy content. For the tree branch sample, these biophysical characteristics were estimated as a weighted average of new, 1 year, and 2+ year shoots from the same branch according to their proportions in the branch composition. Since three to five branches (one from each selected tree) were harvested on each sampling day, three to five individual measurements of ∂Heff and biophysical characteristics were performed for each of the four sample types for any given sampling day. Daily average results were used for calculating the data points in the seasonal time series.

2.5. Biophysical Characteristics

Considering the fact that substantial seasonal variation in dry matter content can lead to the misrepresentation of water content when measured on a dry mass basis [2] (e.g., FMC), shoot water content SWC was calculated on a dry mass basis [68], fresh mass basis, and volume basis [7] (see Nomenclature). Dry matter content was calculated on a fresh mass basis. Gross heat of combustion Hgross on a dry mass basis was measured using a model 1341 Plain Jacket Bomb Calorimeter (Parr Instrument Company, Moline, IL, USA) and the standard oxygen bomb calorimetry test method [69]. The Hgross, when expressed on a fresh mass basis [19] is referred to in our study as fresh mass basis energy content (EC) because, assuming that water content is an inert diluent [18], this metric represents the theoretical maximum amount of energy that can be released by a unit of live fuel’s fresh mass with combustion in pure oxygen after it has been oven dried.

3. Results and Discussion

3.1. Heat Transfer

In existing oxygen consumption calorimetry methods, a heat flux of 25–50 kW m−2 is within the range observed in wildland fires: 13–140 kW m−2 peak convective and 20–132 kW m−2 peak radiative heat fluxes for surface and mixed (surface/crown) fires and 32–42 kW m−2 peak convective and 120–300 kW m−2 peak radiative heat fluxes in crown fires, with noticeably lower time-averaged values [55] (Table 2). In wildfires, heat transfer is both radiative and convective [55], and the direction of convective heating coincides with the direction of flame propagation (tilted sideways-upward in crown fire flame-fronts). In contrast, in traditional oxygen consumption/cone calorimetry, heat transfer is practically radiative-only. Unlike in real fires, the flame in cone calorimetry tests propagates downward through the fuel sample because energy is emitted by a radiant source above the sample and is directly received only by the upward-facing outer portion of the sample, which ignites first. The opposite direction of the upward flow of hot combustion products from the already burning fuel results in only a slight contact with the unburned fuel in the lower portion of the sample and a negligible element of convective heat transfer. These test conditions result in the partial and variable consumption of fresh plant material due to inconsistent delayed ignition at 52–555 s versus 1–50 s in wildfire flame-fronts [56,63,70]. The prolonged ignition leads to variability in test results largely driven by water evaporation and pyrolysis rather than combustion and, unlike within real flame-fronts [46], substantially reduces fuel water content before ignition, therefore masking water content-related energy release reductions when the fuel finally ignites. In our study, these issues were resolved by using combined radiative and convective heating from the methane flame where the direction of convective flux coincided with the direction of flame propagation (upward: the sample was ignited from below/sides). This is similar to real conditions in crown fires where the direction of heat transfer and flame propagation also coincides (though it is sideways-upward rather than upward, as in the tests). Although the heat flux of 40 kW m−2 we used was comparable to that of existing methods, the changes listed above resulted in rapid and consistent ignition times of 10–30 s and near-complete consumption (on average 87.1%) of tested fresh 0–9 mm thick branchwood with the attached foliage, which closely represents the live fuel consumed within real flame-fronts [8,24,31,66]. Prince and Fletcher [48] achieved a similarly fast (~10 s) and consistent ignition of fresh live leaves by using a similar upward convective heating test setup.
Table 2. Convective and radiative heat transfer in wildland fires for different fuel and fire types. It is important to note that convective heat flux is usually inferred from measurements of a total heat flux gauge, the geometry of which is not representative of wildland fuels, so these values must be considered with caution.
Figure 2Fire TypeFlame Length
(m)
Flame-
Front Residence Time (s)
Total Heat Transfer
(kW m−2)
Peak Convective Heat TransferPeak
Radiative
Heat Transfer
Location, Fire NameSource
kW m−2%kW m−2%
Needle castSurface 3037 [71]
Mixed grasses, needle castSurface0.8342 22 20 Rombo 1[55]
Surface0.394 13 24 Eglin 2[55]
Surface1.5912 107 115 Ichauway 1[55]
Surface0829 100 105 Ichauway 2[55]
Surface0.8422 140 90 Ichauway 3[55]
Surface1.2511 82 59 Ichauway 4[55]
Shrubs, scrubs 30–120 40–50 Mediterranean[71]
112 51 [72]
Mixed6.521113 5145Experiment 1[73]
Mixed6.831120 6252Experiment 2[73]
Mixed8.427110 5045Experiment 3[73]
Mixed5.12583 3643Experiment 4[73]
Mixed6.126101 3434Experiment 5[73]
Needle cast, grass, shrubs, brush, or sagebrushSurface1.2517 60 75 Eglin 1[55]
Brush2.440 94 130 Rombo 2[55]
Brush1.4410 26 120 Leadore 1[55]
Brush1.4410 19 132 Leadore 2[55]
105–120 30–60 [71]
32–42100–120 25–50 [71]
ForestCrown30 42 300 Rat Creek[55]
Crown2050 32 189 Mill Creek[55]
Crown 37 120–300 [71]

3.2. Energy Release Reductions

The test method presented in this paper quantifies flammability as the differential effective heat of combustion (∂Heff), which is an “effective” value that accounts for reduced energy release with incomplete char oxidation during the flame-front passage. Due to the in-flame testing setup, ∂Heff directly accounts for the energy release reductions caused by fuel water content [49] and oxygen deficiency [50] with the interaction of flames in the flames interaction zone as discussed in the last paragraph of the Introduction. The described method produced a considerably lower and broader range of values for live fuel flammability compared with traditional methods, suggesting that the energy release reductions within the flames interaction zone are substantial. The mean ∂Heff for new shoots measured with our method was 0.23 kJ g−1 (Table 3), showing a 97% reduction in energy release compared to the more traditional fresh mass basis energy content (EC) measured here with a bomb calorimeter at 7.55 kJ g−1. With a 65% reduction in energy release compared to the EC of 9.70 kJ g−1, the combined mean ∂Heff for all ages of shoots measured with our method was 3.38 kJ g−1 (on a fresh mass basis), or approximately 6.8 kJ g−1 on a dry mass basis (at average 100% shoot water content). In contrast, the FBP model uses a constant of 18 kJg−1 [51] for the “lower” heat of combustion [52], which is almost three times higher and likely substantially over-predicts fire intensity and the resulting spotting distance in live fuels where convective energy is directly calculated [74], while also missing seasonal variation in live fuel conditions.
When measured as effective heat of combustion using oxygen consumption calorimetry in the open air with radiant-only heating [18], live fuel flammability ranged from 7 kJ g−1 to 12 kJ g−1, depending on water content within the 80–170% (dry mass basis) range typical for most live conifers. In contrast, the differential effective heat of combustion (∂Heff), measured in our study using the same oxygen consumption calorimetry equipment, but with the added in-flame testing setup, showed values for all ages of shoots that were on average lower by 9 kJ g−1 and ranged from a positive 7.10 kJ g−1 to a negative −6.33 kJ g−1, depending on water content. For new shoots, ∂Heff similarly varied from a positive 6.48 kJ g−1 to a negative value of −6.33 kJ g−1. In some cases, the ∂Heff was negative for the whole tree branch (Table 3). Since the ∂Heff represents the energy release contribution of the fuel to the incoming flame, its negative values indicated a reduction in the energy release of the incoming methane flame resulting from the interaction with the live fuel sample of high water content and the associated substantial energy release reductions within the flames interaction zone. New shoots had substantial negative ∂Heff at the beginning of the season in Figure 4a and suppressed the energy release of the methane flame (Figure 5a), in contrast to the 1-year-old shoots (Figure 5b). Traditional measurements of energy content using oxygen bomb or radiant heating oxygen consumption calorimetry cannot be negative because they represent the fuel’s potential energy release and are insensitive to energy release reductions within the flames interaction zone.

3.3. Flammability Definition and Numerical Fuel Classification
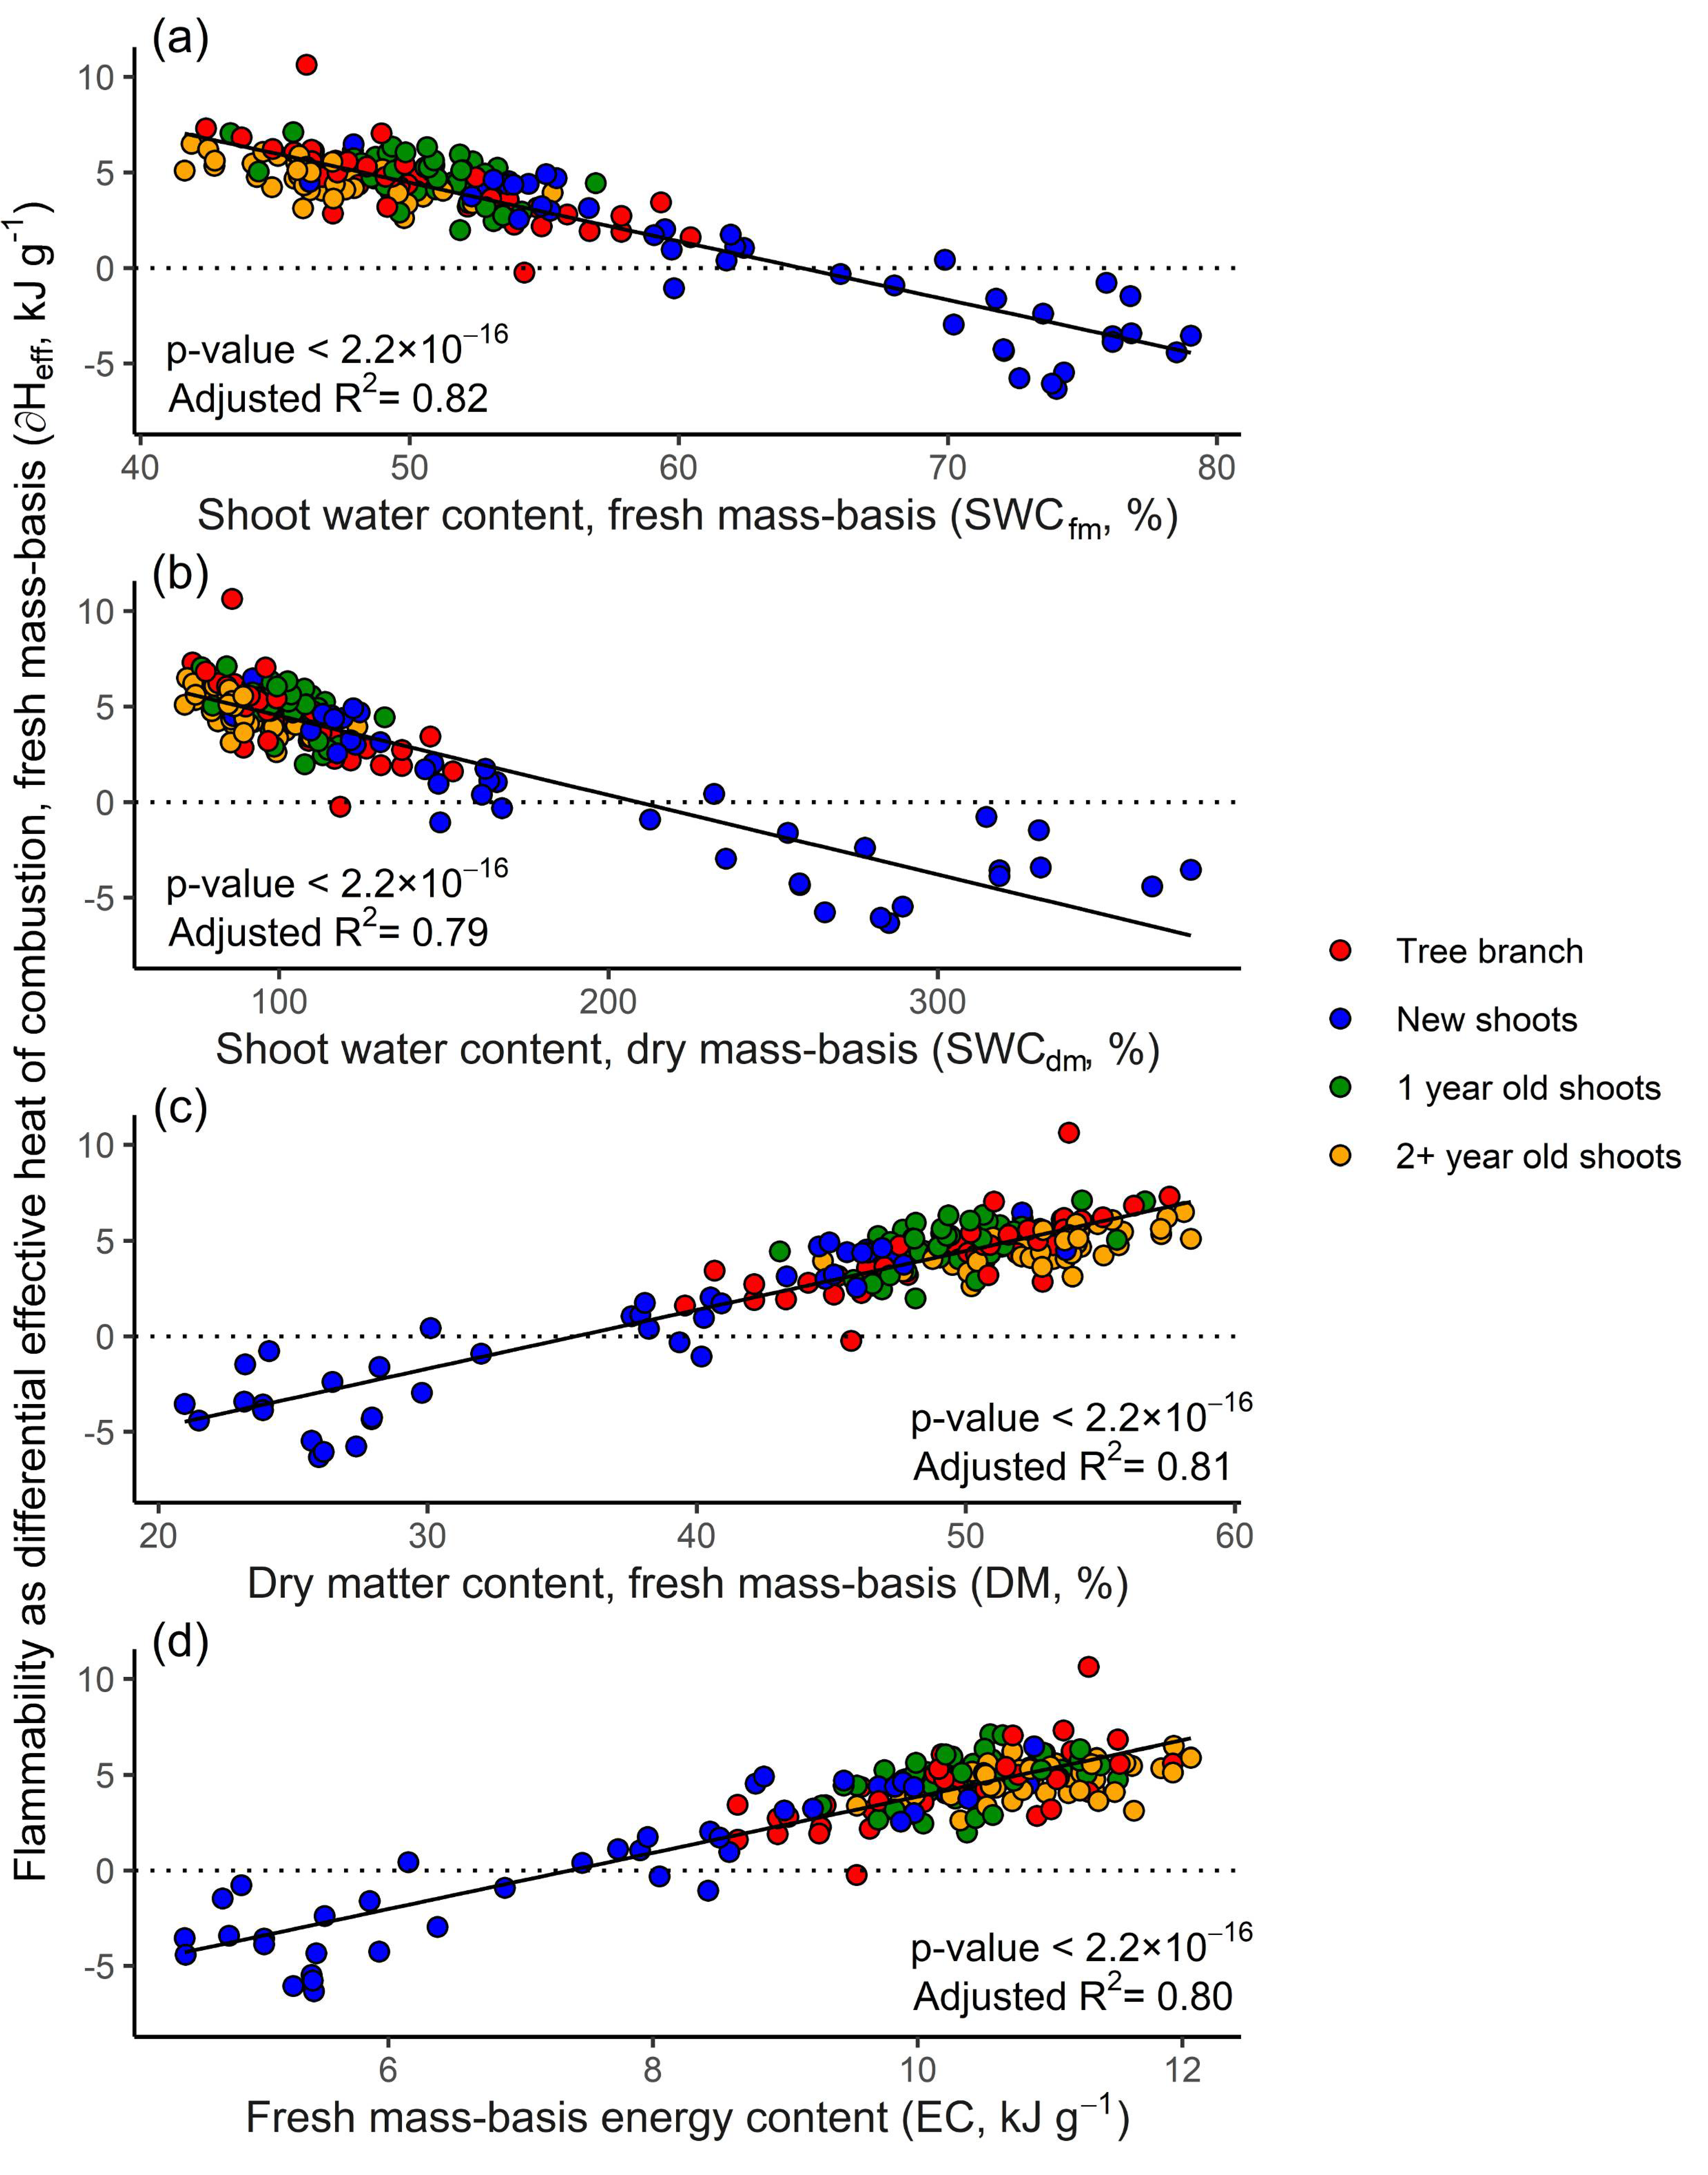
Traditionally, flammability is always a positive quantity because it is defined as the fuel’s ability to burn as represented by the ease/time of ignition (ignitibility), as well as combustion rate (combustibility), duration (sustainability) [11], and completeness (consumability) [12]. As a contribution to this broad mostly time/mass-based set, we introduce an energy release-based criterion. Flammability in our study is defined as the ability of a fuel or material to sustain flame propagation, or a fuel element’s energy release contribution to the incoming flame ∆e+ expressed on a mass loss basis or fresh mass basis as the differential effective heat of combustion (∂Heff). Therefore, the observed variation from a positive value of 7.10 kJ g−1 to a negative −6.33 kJ g−1 in ∂Heff clearly indicates that the contribution of the burning live fuel element to the incoming flame energy release can vary from high-positive to low-negative. The sensitivity of the ∂Heff to these positive or negative effects allows for the development of a numerical classification of materials and substances. Rather than arbitrarily classifying them into fuels, non-fuels, and suppressants, their flammability can be directly measured using ∂Heff as the positive, neutral, or negative value of their contribution to the energy release of the incoming flame. This is especially important for evaluating suppressants and fire chemicals as well as fuel-to-suppressant transitioning materials such as live fuel. Live plant tissue substantially changes the proportions of “combustibles” (dry matter) and “suppressants” (water) in its composition during the season depending on the phenophase and the level of physiological drought. During June, new shoots of white spruce showed the highest seasonal water content and the lowest fresh mass basis energy content (Figure 6) resulting in negative values of ∂Heff (Figure 4a) and actually suppressing the energy release of the incoming methane flame (Figure 5a), in contrast to late summer, when the new shoots’ flammability is similar to that of older growth (Figure 4a).

3.4. Energy Balance

Through in-flame testing, the fuel’s energy release contribution expressed as ∆e+ (per fuel element) and the differential effective heat of combustion ∂Heff (per unit of fuel element’s fresh mass) better represent the processes and conditions within a flame-front including fuel ignition and the interaction of flames within the flames interaction zone. By measuring the fuel element’s contribution to the energy release of the incoming flame, ∆e+ directly quantifies the gain or reduction in energy release at a given fuel element, which may or may not be sufficient to compensate for the energy losses from that fuel element (∆e) into the environment and into the horizontal propagation flux for preheating the next fuel elements. Higher, similar, or lower values of ∆e+ relative to /∆e/ indicate increases, no effect, or declines in the horizontal propagation flux for the preheating of the next fuel elements and, hence, the growth, steady propagation, or decline of the incoming flame (see Figure 7 for details). Therefore, ∆e+ and ∂Heff more accurately represent the energy generation component of the energy balance of the incoming flame at a fuel element scale and can be used as a more adequate flammability input for flame propagation and fire behavior modelling based on energy balance rather than FMC or time-to-ignition.
The characteristics of the spatial structure of live fuel can alter the complex boundary layer flow of hot combustion gases around and through thin fuels such as fresh live shoots, thus affecting the heat transfer coefficients from combustion gases to the fuel element. This can shift the energy balance (ΔE, shown in Figure 7, by affecting energy generation defined in our study as the fuel’s energy release contribution ∆e+ as well as energy losses from a fuel element ∆e and the proportions of its two components—losses to the environment and energy used for preheating the next fuel elements. The positive or negative shift in energy balance will affect the propagation of flame from one fuel element to the next and the resulting fire behavior. In addition, live fuels “burst” and shoot jets of gases [48] and burning needles (observed in our study) during combustion due to high internal leaf pressures [48], which potentially also changes the boundary layer flow and may or may not contribute to the ignition of the neighbouring fuel elements and flame propagation. Since no in-depth analysis of boundary layer fluid motion was undertaken, and consequently the effects of fuel properties on heat transfer coefficients are not known, live fuel flammability testing should be phenology- and species-specific with a special attention to preserving the spatial structure of the fuel.

3.5. Stand-Scale Flammability

Although energy release is directly related to the fuel mass loss [11] and, theoretically, the traditional mass loss basis approach should have an obvious advantage, the fresh mass basis approach introduced in this study was equally successful in predicting variation in flammability measured as ∂Heff (Table 4).Therefore, the species-specific ∂Heff for live fuel can be predicted at the forest stand scale using remote sensing-derived predictor variables such as shoot water content and others in Table 4 (see also Figure 8). With further research on the effects of heat transfer intensity, this will allow for operationally predicting the potential energy release of live fuel for the forest stand. It can be calculated as the fresh mass of live fuel in the forest stand available for high-intensity crown fire (typically fresh 0–9 mm thick branchwood with the attached foliage [8,24,31,66]) multiplied by its potential energy output—the fresh mass basis ∂Heff of the same live plant material determined using our method. The amount of live fuel available for crown fire can be measured using standard fuel inventory protocols. This approach, when applied for live and dead fuel, allows for the operational calculations of a maximum possible energy release under extreme fire-weather conditions or the potential net heat content (PNHC) of the forest stand. As a numerical measure of the potential forest stand flammability, the PNHC can be further used in the development of a new numerical stand characteristics-based fuel classification within a new generation of crown fire models. The PNHC, when reduced from potential to actual value depending on the severity of fire-weather conditions, represents the actual net heat content (ANHC) of the forest stand that can be further used as a numerical input of the actual forest stand flammability for energy release-based fire behavior modelling.

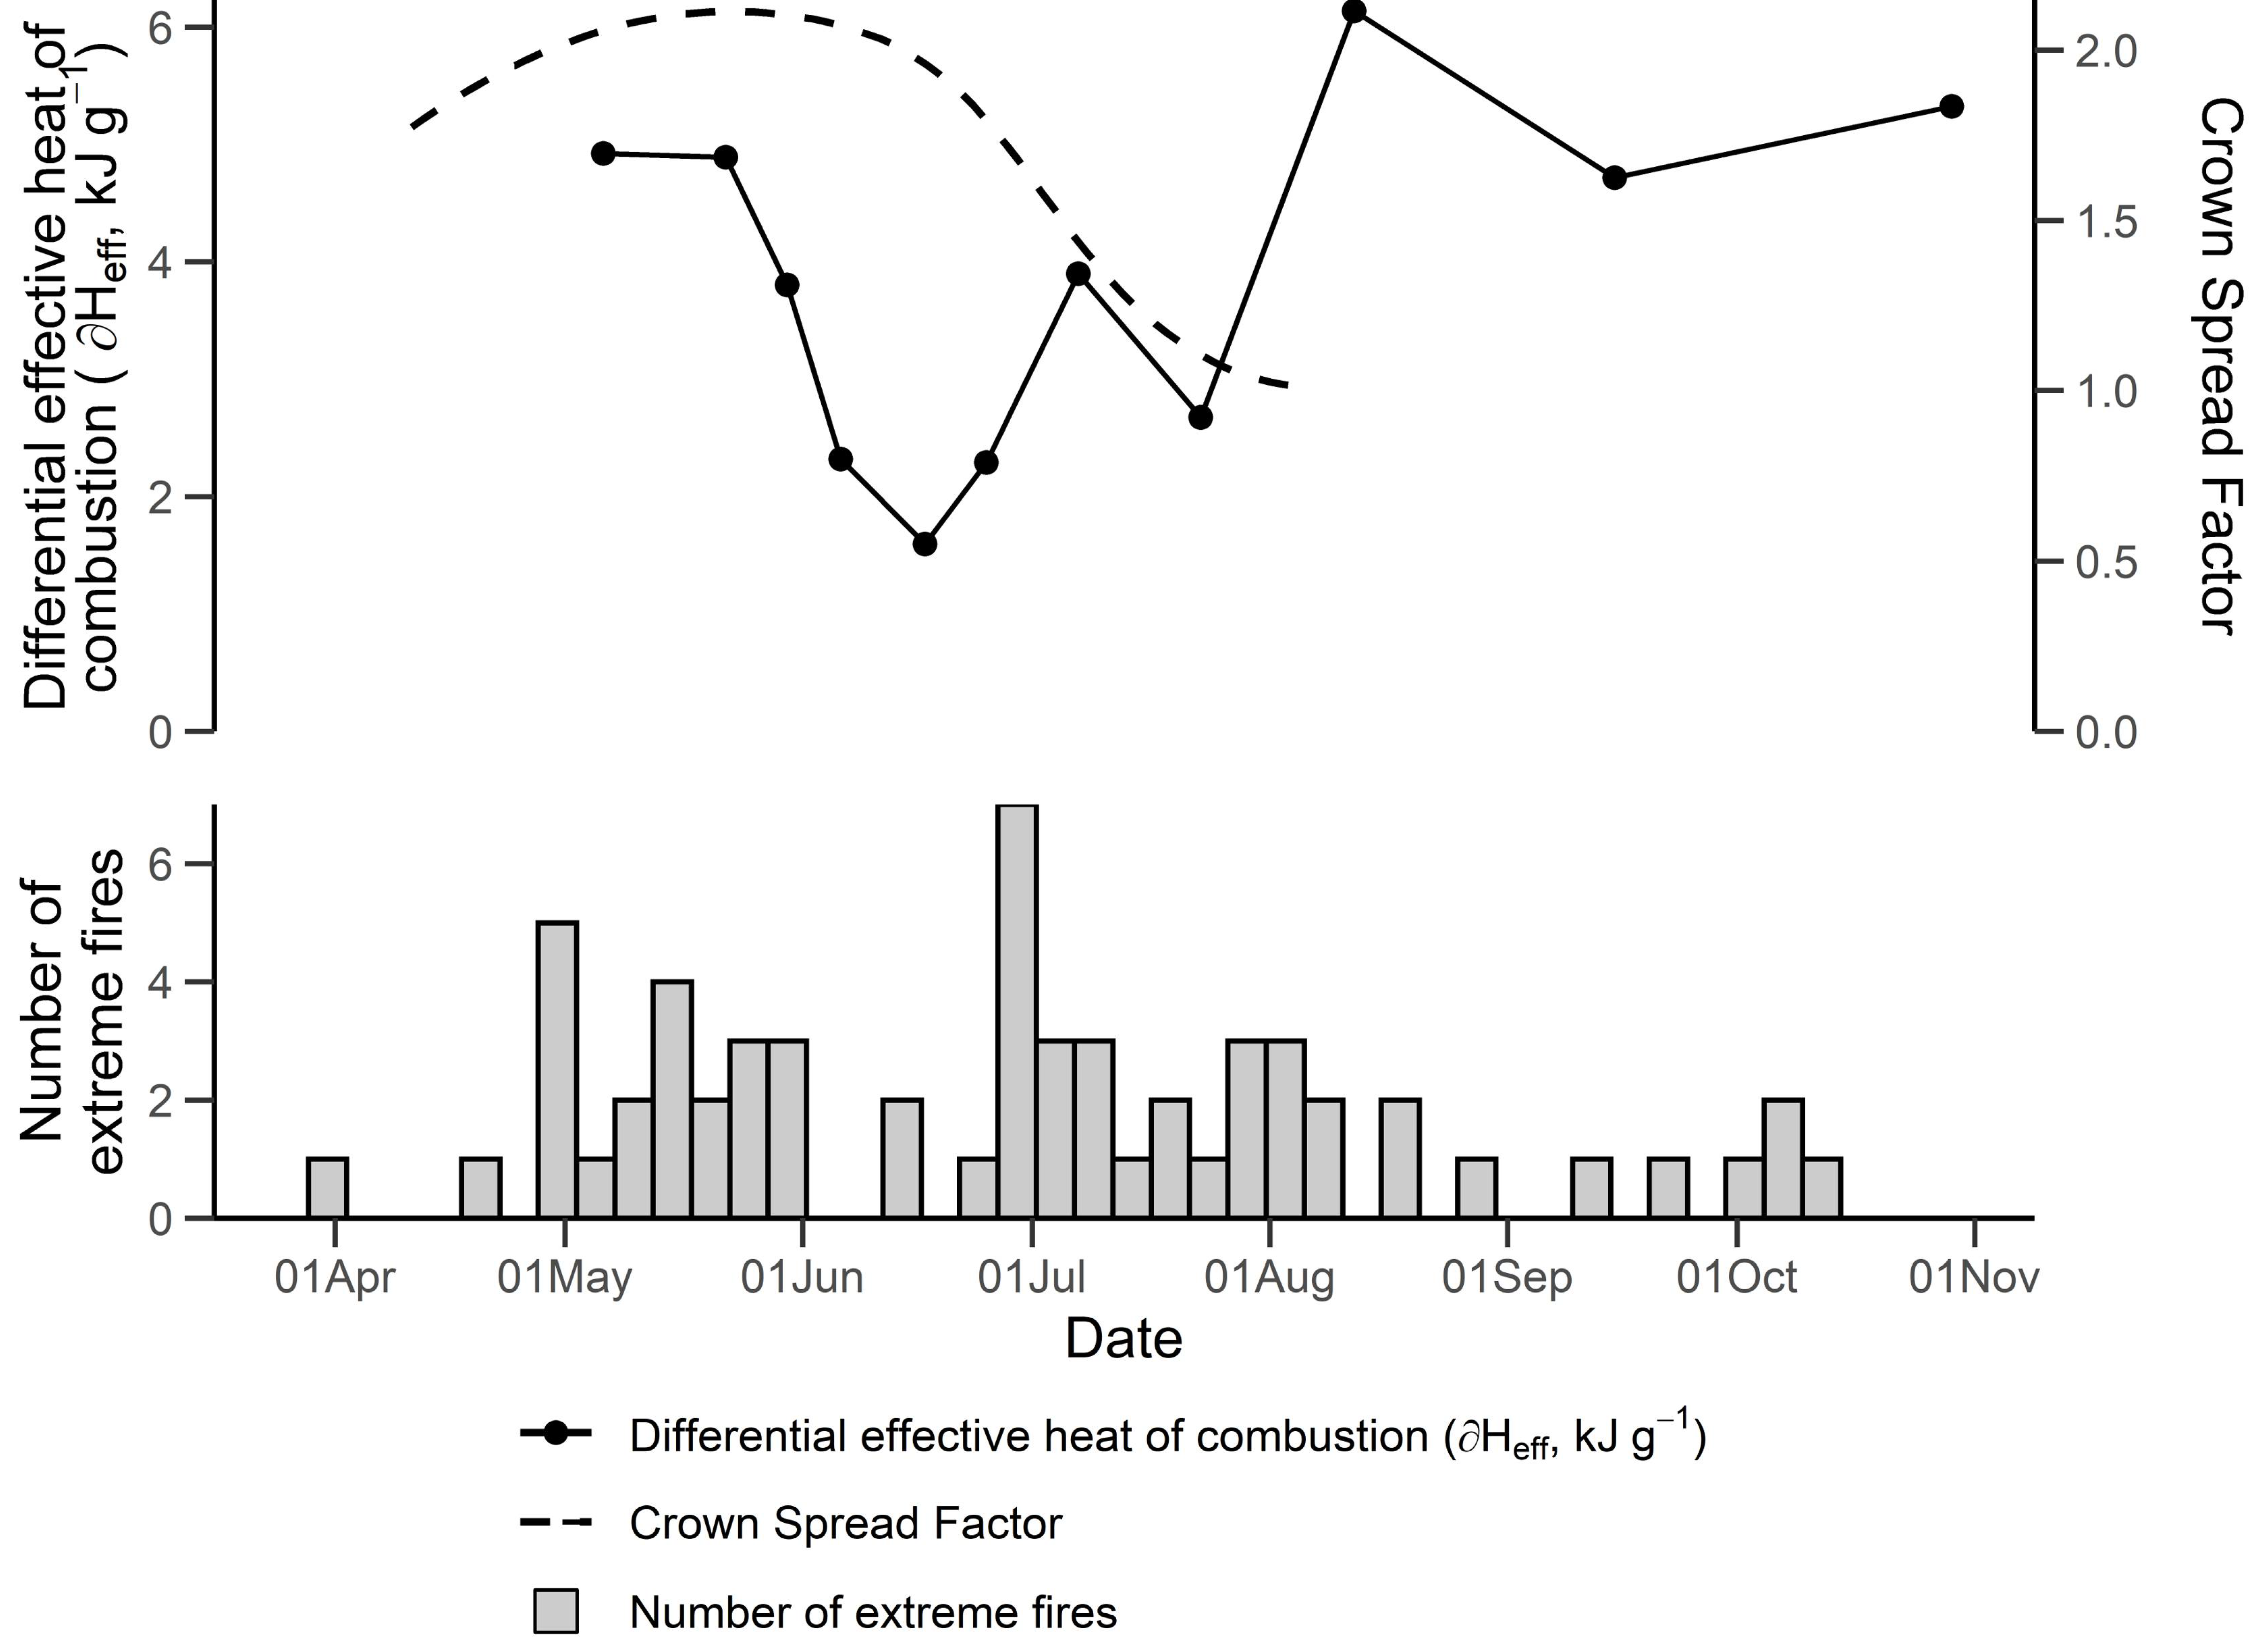
3.6. Seasonal Variation and Drivers of Flammability

The seasonal trend of live fuel flammability for white spruce observed in 2014 differs substantially from that assumed by the FBP model (Figure 9) and better matches the historical seasonality of extreme wildfire in Canada (see Figure A2 and data set in Table A1). According to the FBP, extreme crown fire behavior can be expected around 1 June, during the “spring dip”, when the FMC is assumed to be the lowest [75] and the corresponding live fuel flammability represented by FMC-derived Crown Spread Factor is the highest [33,76]. However, most extreme wildfires in Canada since 1825 started either substantially earlier (early April to late May) or later (July-August and mid-fall). In this study, the first seasonal peak in live fuel flammability was observed in early May, three weeks earlier than was predicted by the FBP (Figure 9), and it closely matches the start of the 1989 Northern Manitoba, 1998 Swan Hills, 2011 Richardson Backcountry, 2011 Slave Lake, 2015 British Columbia, and 2016 Fort McMurray extreme wildfires (Table A1). The next three seasonal spikes in flammability were observed in early July, early August, and September-October, corresponding well to the timing of the 1911 Porcupine, 2015 Northern Saskatchewan, and 2014 and 2017 British Columbia wildfires (early July), as well as the 1916 Matheson, 1998 British Columbia, and 2003 Okanagan Mountain Park fires (early-mid August), and the 1825 Miramichi, 1922 Haileybury, 1938 Rainy River, and a major run of 1950 Chinchaga River extreme wildfires (September-October) (Figure A2). In contrast, at this time of the season, the FBP predicts the lowest seasonal values of live fuel flammability represented by the Crown Spread Factor [33,76] for conifer stands common in Canada.
Shoot age had a significant effect on live fuel flammability (ANOVA, p < 0.001, F = 60.081, n = 42). New shoots played an important role at the beginning of the season. Their flammability was on average lower (0.23 kJ g−1 against 4.75 kJ g−1 or 4.76 kJ g−1 for 1-year and 2+year old shoots respectively (Table 3)) and varied more widely compared with older growth (Figure 4). The timing and magnitude of the observed seasonal maximums in live fuel flammability for a tree branch (Figure 4a) were best explained by the opposite seasonal trend of the shoot water content volume basis (SWCvol, Figure 6a). The observed “early-August dip” in SWCvol and the simultaneous resulting spike in flammability were likely caused by a summer-fall drought [77]. The first seasonal maximum in flammability, observed in early May, was less accurately compared with SWCvol, indicated by the corresponding minimum in the traditional shoot water content, on a dry mass basis, (SWCdm) only in the end of June, which is almost three weeks later (Figure 6b). This suggests that SWCdm and its analog FMC alone cannot fully represent the flammability of live fuel. Moreover, since substantial seasonal variation in dry matter content is a major issue in measuring two-variable water content on a dry mass basis [2], such as SWCdm and FMC, the use of single-variable shoot water content on a fresh mass basis (SWCfm) or SWCvol may be advantageous.
As in previous studies [17,18,29,78], the flammability of live fuel was strongly inversely related to water content (SWCfm in Figure 8a and more traditional SWCdm in Figure 8b). The differential effective heat of combustion was negative for new shoots with SWCdm over 210%. Flammability was strongly directly related to dry matter content (Figure 8c). Confirming the findings of [19], the traditional gross heat of combustion (dry mass basis, Hgross) was unable to satisfactorily explain variation in live fuel flammability (adjusted R2 = −0.005 in Table 4). In contrast to their results, a non-standard fresh mass basis energy content (Figure 8d), measured in this study as Hgross on a fresh mass basis, was as successful in explaining the variation in flammability as water or dry matter content. Since fresh mass basis energy content is determined by both chemical composition and water content, this also supports the conclusions of [79] concerning the importance of these two variables in predicting live fuel flammability.

3.7. Limitations and Future Research

To improve the understanding of the effects of canopy spatial structure and fire-weather conditions on wildfire behavior, the proposed method requires further exploration of the effects of the amount, arrangement, and bulk density of the tested plant material, the intensity and duration of the methane flame exposure, and the distance from the flame base to the sample. The oxygen consumption calorimetry method [57], which was used as a part of the experimental methodology for measuring differential effective heat of combustion in our study, is insensitive to direct energy losses with fuel preheating and water desorption and evaporation (latent heat). These losses need to be accounted for in further studies. The substantial differences between the seasonal pattern of live fuel flammability assumed by the FBP model and that measured in 2014 suggest the necessity of further investigations over multiple seasons. Different regions, species, and age-classes should also be represented. The water content for some samples taken in May and early June was likely underestimated due to prolonged storage; close-to-real-time testing will improve the representation of seasonal changes in water content and flammability. A greater ability to explain seasonal changes in flammability and the higher sensitivity to drought of the shoot water content volume-basis metric, as compared with more traditional shoot water content metrics (on a dry mass basis), suggests the necessity of further studies on quantifying the flammability of live fuel using a volumetric approach.

4. Conclusions

The present study was the first to use in-flame flammability testing for quantifying energy release; previously, in-flame testing was only used for quantifying time-to-ignition, e.g., [46], and for studying increased oxygen consumption and flow dynamic alteration within the flames interaction zone of burning fuel elements [50]. An in-flame test setup with upward convective heating similar to that in our study was also used by Borujerdi et al. and Prince and Fletcher [47,48] for testing live leaves; however, only combustion temperature was monitored, rather than energy release measured in the current study. Determining energy release in conditions similar to those within a flame-front, i.e., directly in the flame, allows for more realistic conditions of heat transfer, ignition, and combustion. The samples tested were representative of live fuel consumed by crown fire flame-front, and consisted of fresh branchwood 0–9 mm thick with attached foliage. Fast and consistent ignition and almost complete consumption of tested fuel reinforces the validity of the method.
By using in-flame testing, the experimental methodology documented here directly accounts for the additional water content- and oxygen deficiency-associated energy release reductions caused by the interaction of the flames. The values of live fuel flammability measured in our study were almost three times lower compared with those currently used in the FBP System and on average 9 kJ g−1 lower than the values measured traditionally, suggesting an important effect of the energy release reductions within the flames interaction zone.
The observed seasonal trend of live fuel flammability for white spruce in 2014 substantially differs from that assumed by the FBP model and better matches the historical seasonality of extreme wildfire in Canada. At the tree branch-scale, changes in live fuel flammability were dictated by phenology-associated changes in the relative amount and flammability of new shoots during spring and by drought-induced changes in flammability of all ages of shoots throughout the season. Variation in live fuel flammability was equally well explained using water content, dry matter content, and fresh mass basis energy content (the latter is not typically used in wildfire applications). Similar models developed for main forest species should provide stand-specific input of live fuel flammability that can be directly linked with the existing FBP modules as a replacement of the fixed seasonal pattern of variation in FMC.
Using differential effective heat of combustion, flammability in this study was quantified as the fuel’s net contribution to the energy release of the incoming flame, that showed both positive and negative values. Therefore, rather than arbitrarily classifying materials and substances into fuels, non-fuels, or suppressants, their flammability can be directly measured using the proposed method as a positive, neutral, or negative energy release contribution to the incoming flame. This is especially important for characterization of suppressants, fire chemicals, and fuel-to-suppressant transitioning materials such as live fuel.
With in-flame testing, our method more accurately measures the energy-generation component of energy balance at a fuel element scale because it better represents the processes and conditions within real flame-fronts and directly quantifies changes in the energy release of the incoming flame. For instance, low and negative values for live crown fuels in leafed-out deciduous and mixedwood boreal stands will indicate a reduction in fire intensity and the eventual suppression of the incoming crown fire flame-front. High values for live crown fuels in coniferous stands (e.g., during drought) will indicate growth in the intensity of the incoming crown fire flame-front, while low and negative values will suggest crown fire weakening.
Successful modelling of energy release on a fresh mass basis instead of a traditional mass loss basis, with further research, will allow for the operational prediction of the potential energy release of a whole forest stand as a measure of its flammability. This variable, determined for extreme fire-weather conditions, can be used in the development of a new numerical stand characteristics-based fuel classification and—when reduced for the actual fire-weather conditions—can be used in energy balance-based fire behavior modelling. Using a more adequate value to represent the flammability of live fuel and forest stand will contribute to improving the accuracy of fire behavior predictions and increasing the efficiency of forest and wildfire management in the face of increasingly complex environmental challenges arising from changes in climate and fire regimes.

Author Contributions

Conceptualization, O.M.M., S.A.P., and M.Y.A.; methodology, O.M.M., S.A.P., M.Y.A., and D.K.T.; software, K.O.M., S.A.P., D.K.T., and O.M.M.; validation, M.Y.A., S.A.P., and D.K.T.; formal analysis, M.D.F., D.K.T., and S.S.M.; investigation, O.M.M., and S.A.P.; resources, M.D.F., M.Y.A., and D.K.T.; data curation, K.O.M., and O.M.M.; writing—original draft preparation, O.M.M.; writing—review and editing, O.M.M., K.O.M., M.Y.A., M.D.F., D.K.T., S.S.M., and S.A.P.; Visualization, K.O.M., and O.M.M.; Supervision, M.D.F., M.Y.A., D.K.T., and S.S.M.; project administration, M.D.F.; funding acquisition, M.D.F. All authors have read and agreed to the published version of the manuscript.

Funding

This research was funded by the Canadian Partnership for Wildland Fire Science (Canada Wildfire).

Data Availability Statement

The data presented in this study are openly available at https://doi.org/10.5281/zenodo.5687455.

Acknowledgments

The authors thank Martin Alexander, Peter Murphy, Brian Stocks, Ralph Nelson, Xianli Wang, Cordy Tymstra, Richard Olsen, and Dan Perrakis for sharing their professional expertise and advice on this study and express sincere gratitude to Stavros Sakellariou, Mihails Melniks, and Larisa Melnic for assisting with fieldwork and lab work. This study was supported by the Northern Forestry Centre of the Canadian Forest Service, Forest Management Division of the Department of Environment and Natural Resources of the Government of the Northwest Territories, and the Protective Clothing and Equipment Research Facility of the University of Alberta.

Conflicts of Interest

The authors declare no conflict of interest.

Nomenclature

Energy-related variables and definitions
HHeat of combustion, dry mass basis (kJ g−1)
HgrossGross heat of combustion, dry mass basis (calorific content) (kJ g−1)
ECEnergy content, equivalent to Hgross expressed on fresh mass basis (kJ g−1)
HeffEffective heat of combustion, mass loss basis (kJ g−1)
∆e+Flammability as fuel element’s contribution to the energy release of the incoming flame, per fuel element/sample (kJ)
∂HeffFlammability as differential effective heat of combustion, which represents ∆e+ per unit fresh mass or mass loss of fuel element/sample (kJ g−1)
Other variables and definitions
DMDry matter content, fresh mass basis (%)
FIZFlames interaction zone
FMCFoliar moisture content, dry mass basis (%)
ShootsTwigs/branchwood 0–9 mm thick with the attached foliage
SWCfmShoot water content, fresh mass basis (%)
SWCdmShoot water content, dry mass basis (analogous to FMC, but for shoots instead of foliage alone) (%)
SWCvolShoot water content, volume basis (g cm−3)

Appendix A. Additional Figures

Figure A1. Field sampling. Samples were harvested within lower-one-third outer south-facing part of the crown using a pole pruner.
Fire 05 00001 g0a1

Appendix B. Historical Seasonality of Extreme Crown Fire Behavior in Canada

The extreme wildfires (Table A1) that were used to determine timing and historical seasonality of extreme crown fire behavior in Canada for 1825–2017 in Figure A2 (as the start time for extreme wildfires) were selected from [80,81] for the period from 1825 to the early 1900s and from the Canadian Disaster Database [82] for the period from the early 1900s to 2016. The criteria for selecting extreme wildfires among the wildfire disasters listed in the sources above were any of the following: (1) multiple wildfire-related human life losses, (2) area burned 100,000 ha or more, or (3) evacuation of 2000 people or over. Additional information for some of these wildfires (if missing) was retrieved from [83,84,85,86].
All wildfires since the early 1900s documented in the literature and official web sources, which were classified by authors as extreme-intense or outstanding, but omitted from Public Safety Canada (2020), were also included in this analysis. These are the 1950 Chinchaga [87], 1968 Lesser Slave Lake [88], 1968 Inuvik [89], 1968 Vega [90], 1980 DND-4-80 and DND-3-80 Cold Lake wildfires [88], the 1981 Hay River 36 [91], 2001 Chisholm [90], 2002 House River [92], 2003 McLure [93], 2003 Okanagan Mountain Park [94], 2011 Richardson Backcountry [95], 2017 Kenow [96], and 2017 Verdant Creek wildfires [97], as well as the 2010 British Columbia, 2016 Peace Region BC, and 2017 British Columbia [86] wildfires.
Figure A2. Historical seasonality of extreme crown fire behavior in Canada for 1825–2017 compared with seasonal trend of live fuel flammability measured in 2014 and that assumed by the FBP model. The FPB model represents live fuel flammability expressed as a FMC-derived Crown Spread Factor (dashed line) at a rough temporal scale assuming only one seasonal maximum in live fuel flammability around 1 June. Live fuel flammability measured in our study as differential effective heat of combustion ∂Heff for 2014 (solid line) showed seasonal trend of higher temporal resolution with three seasonal maximums that match the maximums in historical seasonality of extreme crown fire behavior (gray histogram representing number of extreme fires started during a given 5-day period) according to the dataset in Table A1: early May (three weeks earlier compared with the assumptions of the FBP), early July, and early August. By contrast, the Crown Spread Factor by the FBP model assumes close to the lowest values for the season in early July and early August.
Fire 05 00001 g0a2
Table A1. List of extreme wildfires in Canada for 1825–2017. Data from the list were used to build a histogram of historical seasonality of extreme crown fire behavior in Canada for 1825–2017 in Figure A2. When the information differed between two referenced sources, data from both were reported, separated by a slash (/).
Wildfire Name and LocationYearStart DateEnd DateSize (ha)Human Lives LostEvacuatedReference
Great Miramichi Fire, NB18257 October-1,200,000160+
(500+ unofficially)
[80]
Saguenay–Lac-Saint-Jean Fire, QC187019 May19 May/27 May400,0007 [80,81]
The Great Fire, Ottawa Valley, ON18701 August28 August51,200+20+8000+[81]
Fernie Fire, BC19081 August1 August25,90022+ [80]
Baudette Fire/Rainy River Fire, MN and ON19107 October7 October121,50042+ [80]
Great Porcupine Fire, AB and ON191111 July11 July200,000/
804,650
73+
(in the hundreds unofficially)
200[80,82]
Great Matheson Fire, AB and ON191629 July3 August/29 July200,000223+
(as high as 400 unofficially)
8000[80,82]
Lac La Biche Fire, AB and SK191919 MayEarly June2,800,00013+ [80,83]
Great Fire of 1922 Haileybury, ON192230 September5 October168,000/
518,000
43+ (as high as 150 unofficially)11,000[80,82]
Rainy River and Dance Township Fire, ON193810 October15 October30,355/
37,230
17+155[80,82]
Gogama, ON194114 May15 June133,827 [82]
Mississagi, ON19481 May31 October261,017 [82]
Chinchaga River Fire (Wisp fire), BC and AB1950Major run 20 SeptemberOctober1,400,000 [87]
Lesser Slave Lake Fire, AB1968Major run
23 May
133,550 [98]
Vega fire, AB196823 May [90]
Inuvik Fire, NWT19688 August18 August35,000 [89]
Cold Lake Fire (DND-3-80), AB and SK19801 May [98]
Cold Lake Fire (DND-4-80) AB and SK19802 May 177,813 [98]
Hay River Fire (HY-36-81), NWT19813 July 1009 [91]
Red Lake Fire, ON19801 June 43,664 5000[82]
Fire Northeast of Vancouver, BC19851 July 240,000+ [82]
Northern Manitoba fires198911 May20 September3,280,000 25,000[82,84]
Betsiamites, Ragueneau and Baie-Comeau Fire, QC199129 June29 June 7000[82]
North Central Saskatchewan fires199529 May29 May160,000 3338[82]
Swan Hills Fire, AB19985 May21 May155,000 2030[82]
Tibbet Lake Fire, NWT199822 July31 July140,000 5[82]
British Columbia fires19981 August31 August?42,115 10,600[82]
Salmon Arm Fire, BC199810 August17 August6300 7000[82]
Chisholm fire (LWF-063), AB200123 May29 May36,690 [90]
House River Fire, AB200217 May7 June248,000/
248,243
1550[82,92]
Manitoba fires20031 April31 October918,845 665[82,85]
Southeastern BC and Southwestern AB fires20031 July31 August 48,501[82]
Okanagan Mountain Park Fire, BC200316 August12 September25,000/
25,600
27,000/
33,050
[94]/
[86]
McLure Fire, BC200330 JulyOctober26,420/
26,000
3800[86]/
[93]
Mistissini Fire, QC200616 June18 June 3200[82]
Tumbler Ridge Fire, BC20063 July5 July9100 4000[82]
South Indian Lake Fire, MB200719 July26 July147,473 963[82]
Norway House and Sherridon Fire, MB200828 May28 May 3330[82]
Halifax Fire, NS200813 June13 June 5000[82]
Northern Saskatchewan fires200830 June30 June 2500[82]
Kelowna, Kamloops and Cariboo Fire, BC20091 May31 August 120,000[82]
West Kelowna wildfires, BC200918 July31 August[82]
British Columbia fires201028 July8 September330,00021383[82]
British Columbia fires201018 August (2nd major run)Early September[86]
Richardson Backcountry Fire, AB201115 MaySeptember148,000+ [95]
Slave Lake Wildfire, AB201114 May22 May4900112,055[82]
Northern Ontario fires20116 July25 July300,000 3300+[82]
Mackenzie County Fire, AB201211 July20 July100,000 300[82,99]
Lethbridge and Coalhurst Fire, AB201210 September11 September 3000[82]
Northwest Territories fires20141 July18 September3,500,000+ 60[82]
British Columbia fires20141 July30 September360,000 4500[82]
British Columbia fires20159 May11 September300,00013432[82]
Northern Saskatchewan fires20151 July18 July1,800,000 13,000[82]
Peace Region fires, BC201618 AprilFall [86]
Wood Buffalo (Fort McMurray) Wildfire, AB and SK20161 May/30 AprilMid June/
1 June
589,000/
593,670
288,000/96,000[100]/[82]
Easterville and Chemawawin Fire, MB201623 June27 June 2070[82]
British Columbia fires20177 July15 September1,200,000+ 65,000[86]
Verdant Creek Fire, BC201715 JulyOctober18,017 [97]
Kenow Fire, AB201730 August 38,000 [96]

References

  1. Countryman, C.M. The Fire Environment Concept; USDA Forest Service, Pacific Southwest Forest and Range Experiment Station: Berkeley, CA, USA, 1972. Available online: https://www.frames.gov/catalog/8189 (accessed on 3 July 2021).
  2. Finney, M.A.; Cohen, J.D.; McAllister, S.S.; Jolly, W.M. On the need for a theory of wildland fire spread. Int. J. Wildland Fire 2012, 22, 25–36. [Google Scholar] [CrossRef] [Green Version]
  3. Pimont, F.; Ruffault, J.; Martin-StPaul, N.K.; Dupuy, J.L. Why is the effect of live fuel moisture content on fire rate of spread underestimated in field experiments in shrublands? Int. J. Wildland Fire 2019, 28, 127–137. [Google Scholar] [CrossRef]
  4. Whitman, E.; Parisien, M.A.; Thompson, D.K.; Hall, R.J.; Skakun, R.S.; Flannigan, M.D. Variability and drivers of burn severity in the northwestern Canadian boreal forest. Ecosphere 2018, 9, e02128. [Google Scholar] [CrossRef] [Green Version]
  5. Stocks, B.J. Fire behavior in immature jack pine. Can. J. For. Res. 1987, 17, 80–86. [Google Scholar] [CrossRef]
  6. Call, P.; Albini, F. Aerial and surface fuel consumption in crown fires. Int. J. Wildland Fire 1997, 7, 259–264. [Google Scholar] [CrossRef] [Green Version]
  7. Melnik, O.M. A Proposed Experimental Methodology for Assessing the Effects of Biophysical Properties and Energy Content on Live Fuel Flammability. Master’s Thesis, University of Alberta, Edmonton, AB, Canada, 2016. [Google Scholar] [CrossRef]
  8. Stocks, B.J.; Alexander, M.E.; Wotton, B.M.; Stefner, C.N.; Flannigan, M.D.; Taylor, S.W.; Lavoie, N.; Mason, J.A.; Hartley, G.R.; Maffey, M.E.; et al. Crown fire behaviour in a northern jack pine—Black spruce forest. Can. J. For. Res. 2004, 34, 1548–1560. [Google Scholar] [CrossRef] [Green Version]
  9. Flannigan, M.D.; Wotton, B.M.; Marshall, G.A.; de Groot, W.J.; Johnston, J.; Jurko, N.; Cantin, A.S. Fuel moisture sensitivity to temperature and precipitation: Climate change implications. Clim. Change 2016, 134, 59–71. [Google Scholar] [CrossRef]
  10. de Groot, W.J.; Flannigan, M.D.; Cantin, A.S. Climate change impacts on future boreal fire regimes. For. Ecol. Manag. 2013, 294, 35–44. [Google Scholar] [CrossRef]
  11. Anderson, H.E. Forest fuel ignitibility. Fire Technol. 1970, 6, 312–319. [Google Scholar] [CrossRef]
  12. Martin, R.E.; Gordon, D.A.; Gutierrez, M.E.; Lee, D.S.; Molina, D.M.; Schroeder, R.A.; Sapsis, D.B.; Stephens, S.L.; Chambers, M. Assessing the flammability of domestic and wildland vegetation. In Proceedings of the International Conference on Fire and Forest Meteorology, Jekyll Island, GA, USA, 26–28 October 1993; Volume 12, pp. 130–137. [Google Scholar]
  13. Littell, J.S.; Peterson, D.L.; Riley, K.L.; Liu, Y.; Luce, C.H. A review of the relationships between drought and forest fire in the United States. Glob. Change Biol. 2016, 22, 2353–2369. [Google Scholar] [CrossRef]
  14. Stocker, O. Das Wasserdefizit von Gefässpflanzen in verschiedenen Klimazonen. Planta 1929, 7, 382–387. [Google Scholar] [CrossRef]
  15. Weatherley, P. Studies in the water relations of the cotton plant. I. The field measurement of water deficits in leaves. New Phytol. 1950, 49, 81–97. [Google Scholar] [CrossRef]
  16. Blanch, J.S.; Peñuelas, J.; Sardans, J.; Llusià, J. Drought, warming and soil fertilization effects on leaf volatile terpene concentrations in Pinus halepensis and Quercus ilex. Acta Physiol. Plant. 2009, 31, 207–218. [Google Scholar] [CrossRef]
  17. Van Wagner, C.E. Flammability of Christmas Trees; Department of Forestry: Ottawa, ON, Canada, 1963. Available online: https://cfs.nrcan.gc.ca/pubwarehouse/pdfs/24636.pdf (accessed on 3 July 2021).
  18. Babrauskas, V. Effective heat of combustion for flaming combustion of conifers. Can. J. For. Res. 2006, 36, 659–663. [Google Scholar] [CrossRef]
  19. Owens, M.; Lin, C.; Taylor, C.; Whisenant, S. Seasonal patterns of plant flammability and monoterpenoid content in Juniperus ashei. J. Chem. Ecol. 1998, 24, 2115–2129. [Google Scholar] [CrossRef]
  20. May, N.; Ellicott, E.; Gollner, M. An examination of fuel moisture, energy release and emissions during laboratory burning of live wildland fuels. Int. J. Wildland Fire 2019, 28, 187–197. [Google Scholar] [CrossRef]
  21. de Groot, W.J. Interpreting the Canadian forest fire weather index (FWI) system. In Proceedings of the Fourth Central Regional Fire Weather Committee Scientific and Technical Seminar; Canadian Forest Service: Edmonton, AB, Canada, 1987; pp. 3–14. [Google Scholar]
  22. Canadell, J.; Jackson, R.B.; Ehleringer, J.B.; Mooney, H.A.; Sala, O.E.; Schulze, E.D. Maximum rooting depth of vegetation types at the global scale. Oecologia 1996, 108, 583–595. [Google Scholar] [CrossRef] [PubMed]
  23. NFDRS. Appendix E. NFDRS Technical Reference. In WIMS User Guide; U.S. Department of Agriculture, Forest Service: Ogden, UT, USA, 2011. Available online: https://famit.nwcg.gov/sites/default/files/Appx_E_NFDRS_Technical_Reference.pdf (accessed on 3 July 2021).
  24. Johnston, D.C.; Turetsky, M.R.; Benscoter, B.W.; Wotton, B.M. Fuel load, structure, and potential fire behaviour in black spruce bogs. Can. J. For. Res. 2015, 45, 888–899. [Google Scholar] [CrossRef]
  25. Rivera, J.D.; Davies, G.M.; Jahn, W. Flammability and the Heat of Combustion of Natural Fuels: A Review. Combust. Sci. Technol. 2012, 184, 224–242. [Google Scholar] [CrossRef]
  26. Philpot, C.W. The Moisture Content of Ponderosa Pine and Whiteleaf Manzanita Foliage in the Central Sierra Nevada; Res. Note PSW-RN-039; Department of Agriculture, Forest Service, Pacific Southwest Forest and Range Experiment Station: Berkeley, CA, USA, 1963; Volume 39, 7p.
  27. McAllister, S.; Grenfell, I.; Hadlow, A.; Jolly, W.M.; Finney, M.; Cohen, J. Piloted ignition of live forest fuels. Fire Saf. J. 2012, 51, 133–142. [Google Scholar] [CrossRef]
  28. Page, W.G.; Jenkins, M.J.; Runyon, J.B. Mountain pine beetle attack alters the chemistry and flammability of lodgepole pine foliage. Can. J. For. Res. 2012, 42, 1631–1647. [Google Scholar] [CrossRef] [Green Version]
  29. Jolly, W.M.; Hintz, J.; Kropp, R.C.; Conrad, E.T. Physiological drivers of the live foliar moisture content ‘spring dip’ in Pinus resinosa and Pinus banksiana and their relationship to foliar flammability. In Proceedings of the VII International Conference on Forest Fire Research, Coimbra, Portugal, 17–20 November 2014; pp. 1–9. Available online: http://www.lakestatesfiresci.net/docs/Jolly_et_al_Spring_Dip_Physiology_15Jul2014.pdf (accessed on 3 July 2021).
  30. Pausas, J.G.; Alessio, G.A.; Moreira, B.; Segarra-Moragues, J.G. Secondary compounds enhance flammability in a Mediterranean plant. Oecologia 2016, 180, 103–110. [Google Scholar] [CrossRef] [Green Version]
  31. Van Wagner, C.E. Conditions for the start and spread of crown fire. Can. J. For. Res. 1977, 7, 23–34. [Google Scholar] [CrossRef]
  32. Beck, J.A.; Parminter, J.; Alexander, M.E.; MacDermid, E.; Van Nest, T.A.; Beaver, A.K.; Grimaldi, S. Fire ecology and management. In Forestry Handbook for British Columbia; University of British Columbia: Vancouver, BC, Canada, 2005; pp. 489–525. Available online: https://cfs.nrcan.gc.ca/publications?id=25580 (accessed on 3 July 2021).
  33. Van Wagner, C.E. A Spread Index for Crown Fires in Spring; Canadian Forestry Service, Petawa Forest Experiment Station: Chalk River, ON, Canada, 1974. Available online: https://cfs.nrcan.gc.ca/pubwarehouse/pdfs/23603.pdf (accessed on 3 July 2021).
  34. Alexander, M.E.; Cruz, M.G. Assessing the effect of foliar moisture on the spread rate of crown fires. Int. J. Wildland Fire 2013, 22, 415–427. [Google Scholar] [CrossRef]
  35. Rossa, C.G.; Fernandes, P.M. Live Fuel Moisture Content: The ‘Pea Under the Mattress’ of Fire Spread Rate Modeling? Fire 2018, 1, 43. [Google Scholar] [CrossRef] [Green Version]
  36. Fons, W.L. Analysis of fire spread in light fuels. J. Agric. Res. 1946, 72, 93–121. [Google Scholar]
  37. Babrauskas, V.; Peacock, R.D. Heat release rate: The single most important variable in fire hazard. Fire Saf. J. 1992, 18, 255–272. [Google Scholar] [CrossRef]
  38. Hall, B.L.; Brown, T.G.; Bradshaw, L.S.; Jolly, W.M.; Nemani, R.R. National Standardized Energy Release Component (ERC) Forecasts. 2003. Available online: https://www.frames.gov/catalog/41597 (accessed on 3 July 2021).
  39. Thomas, P.H.; Simms, D.L.; Wraight, H.G. Fire Spread in Wooden Cribs; Joint Fire Research Organization: Boreham Wood, UK, 1964; Forest Research Note 537.
  40. Andrews, P.L. The Rothermel Surface Fire Spread Model and Associated Developments: A Comprehensive Explanation; Gen. Tech. Rep. RMRS-GTR-371; U.S. Department of Agriculture, Forest Service, Rocky Mountain Research Station: Fort Collins, CO, USA, 2018; pp. 121–371. Available online: https://www.fs.usda.gov/treesearch/pubs/55928 (accessed on 3 July 2021).
  41. Alexander, M.E.; Taylor, S.W.; Page, W.G. Wildland firefighter safety and fire behavior prediction on the fireline. In Proceedings of the 13th International Wildland Fire Safety Summit & 4th Human Dimensions of Wildland Fire Conference, Boise, ID, USA, 20–24 April 2015; International Association of Wildland Fire: Boise, ID, USA, 2015; pp. 44–58. [Google Scholar]
  42. Hirsch, K.G.; Corey, P.N.; Martell, D.L. Using expert judgment to model initial attack fire crew effectiveness. For. Sci. 1998, 44, 539–549. [Google Scholar]
  43. Byram, G.M. Combustion of forest fuels. In Forest Fire: Control and Use; McGraw-Hill: New York, NY, USA, 1959; pp. 61–89. [Google Scholar]
  44. Chrosciewicz, Z. Foliar moisture content variations in four coniferous tree species of central Alberta. Can. J. For. Res. 1986, 16, 157–162. [Google Scholar] [CrossRef]
  45. Keyes, C.R. Foliar Moisture Contents of North American Conifers; USDA Forest Service Proceedings RMRS-P-4; U.S. Department of Agriculture, Forest Service, Rocky Mountain Research Station: Fort Collins, CO, USA, 2006; pp. 395–399. Available online: http://www.fs.fed.us/rm/pubs/rmrs_p041/rmrs_p041_395_399.pdf (accessed on 3 July 2021).
  46. Jolly, M.; Butler, B.W. Linking Photosynthesis and Combustion Characteristics in Live Fuels: The Role of Soluble Carbohydrates in Fuel Preheating; Fire Sciences Laboratory Final Report No. 10-1-08-6; USFS, RMRS: Missoula, MT, USA, 2013. Available online: https://www.firescience.gov/projects/10-1-08-6/project/10-1-08-6_final_report.pdf (accessed on 3 July 2021).
  47. Borujerdi, P.R.; Shotorban, B.; Mahalingam, S. A computational study of burning of vertically oriented leaves with various fuel moisture contents by upward convective heating. Fuel 2020, 276, 118030. [Google Scholar] [CrossRef]
  48. Prince, D.R.; Fletcher, T.H. Differences in Burning Behavior of Live and Dead Leaves, Part 1: Measurements. Combust. Sci. Technol. 2014, 186, 1844–1857. [Google Scholar] [CrossRef]
  49. Ferguson, S.C.; Dahale, A.; Shotorban, B.; Mahalingam, S.; Weise, D.R. The role of moisture on combustion of pyrolysis gases in wildland fires. Combust. Sci. Technol. 2013, 185, 435–453. [Google Scholar] [CrossRef]
  50. Pickett, B.M.; Isackson, C.; Wunder, R.; Fletcher, T.H.; Butler, B.W.; Weise, D.R. Flame interactions and burning characteristics of two live leaf samples. Int. J. Wildland Fire 2009, 18, 865–874. [Google Scholar] [CrossRef]
  51. Hirsch, K.G. Canadian Forest Fire Behavior Prediction (FBP) System: User’s Guide; Natural Resources Canada, Canadian Forest Service, Northern Forestry Centre: Edmonton, AB, Canada, 1996; Special Report 7; 122p. Available online: https://cfs.nrcan.gc.ca/publications?id=11792 (accessed on 3 July 2021).
  52. Alexander, M.E. Calculating and interpreting forest fire intensities. Can. J. Bot. 1982, 60, 349–357. [Google Scholar] [CrossRef]
  53. Anderson, H.E. Heat Transfer and Fire Spread; Intermountain Forest and Range Experiment Station Research Paper INT-69; USDA Forest Service: Ogden, UT, USA, 1969. Available online: http://www.fs.fed.us/rm/pubs_int/int_rp069.pdf (accessed on 3 July 2021).
  54. Beer, T. The interaction of wind and fire. Bound.-Layer Meteorol. 1991, 54, 287–308. [Google Scholar] [CrossRef]
  55. Frankman, D.; Webb, B.W.; Butler, B.W.; Jimenez, D.; Forthofer, J.M.; Sopko, P.; Shannon, K.S.; Hiers, J.K.; Ottmar, R.D. Measurements of convective and radiative heating in wildland fires. Int. J. Wildland Fire 2013, 22, 157–167. [Google Scholar] [CrossRef]
  56. Butler, B.W.; Cohen, J.; Latham, D.J.; Schuette, R.D.; Sopko, P.; Shannon, K.S.; Jimenez, D.M.; Bradshaw, L.S. Measurements of radiant emissive power and temperatures in crown fires. Can. J. For. Res. 2004, 34, 1577–1587. [Google Scholar] [CrossRef]
  57. Babrauskas, V. Development of the cone calorimeter—A bench-scale heat release rate apparatus based on oxygen consumption. Fire Mater. 1984, 8, 81–95. [Google Scholar] [CrossRef]
  58. Melnik, O.M.; Paskaluk, S.A.; Flannigan, M.D.; Ackerman, M.Y. A proposed experimental methodology for assessing the effects of water and dry matter content on live fuel flammability. In Proceedings of the 13th International Wildland Fire Safety Summit & 4th Human Dimensions of Wildland Fire Conference, Boise, ID, USA, 20–24 April 2015; International Association of Wildland Fire: Boise, ID, USA, 2015; pp. 86–91. Available online: http://www.iawfonline.org/wp-content/uploads/2018/02/Safety_Summit_2015_Proceedings-updated-5.23.2016.pdf (accessed on 3 July 2021).
  59. Paskaluk, S.; Ackerman, M.; Melnik, O. A modified method to evaluate flammability of forest fuels using oxygen consumption calorimetry. In Proceedings of the Combustion Institute—Canadian Section (Spring Technical Meeting University of Saskatchewan); University of Saskatchewan: Saskatoon, SK, Canada, 2015. [Google Scholar]
  60. Zhou, K.; Qin, X.; Wang, Z.; Pan, X.; Jiang, J. Generalization of the radiative fraction correlation for hydrogen and hydrocarbon jet fires in subsonic and chocked flow regimes. Int. J. Hydrogen Energy 2018, 43, 9870–9876. [Google Scholar] [CrossRef]
  61. Machado, I.; Pagot, P.; Pereira, F. Experimental study of radiative heat transfer from laminar non-premixed methane flames diluted with CO2 and N2. Int. J. Heat Mass Transf. 2020, 158, 119984. [Google Scholar] [CrossRef]
  62. ICFME NWT-73CDN. Inside the Fire: International Crown Fire Modeling Experiments in the Northwest Territories (Plot 3 Part II). 2000. Available online: https://www.youtube.com/watch?v=zvPa_yEEd4E (accessed on 3 July 2021).
  63. Walkinshaw, S.; Ault, R. Use of sprinklers and aqueous gel for structure protection from wildfire. Advantage 2008, 9, 1–9. [Google Scholar]
  64. Brohez, S. Uncertainty analysis of heat release rate measurement from oxygen consumption calorimetry. Fire Mater. 2005, 29, 383–394. [Google Scholar] [CrossRef]
  65. Huggett, C. Estimation of rate of heat release by means of oxygen consumption measurements. Fire Mater. 1980, 4, 61–65. [Google Scholar] [CrossRef]
  66. Reinhardt, E.; Scott, J.; Gray, K.; Keane, R. Estimating canopy fuel characteristics in five conifer stands in the western United States using tree and stand measurements. Can. J. For. Res. 2006, 36, 2803–2814. [Google Scholar] [CrossRef]
  67. Cruz, M.G.; Alexander, M.E.; Wakimoto, R.H. Assessing canopy fuel stratum characteristics in crown fire prone fuel types of western North America. Int. J. Wildland Fire 2003, 12, 39–50. [Google Scholar] [CrossRef] [Green Version]
  68. Norum, R.A.; Miller, M. Measuring Fuel Moisture Content in Alaska: Standard Methods and Procedures; Pacific Northwest Forest and Range Experiment Station General Technical Report PNW-171; U.S. Department of Agriculture, Forest Service, Pacific Northwest Forest and Range Experiment Station: Portland, OR, USA, 1984; 34p. Available online: http://www.treesearch.fs.fed.us/pubs/7574 (accessed on 3 July 2021).
  69. Chrosciewicz, Z. Foliar heat content variations in four coniferous tree species of central Alberta. Can. J. For. Res. 1986, 16, 152–157. [Google Scholar] [CrossRef]
  70. Weise, D.R.; White, R.H.; Beall, F.C.; Etlinger, M. Use of the cone calorimeter to detect seasonal differences in selected combustion characteristics of ornamental vegetation. Int. J. Wildland Fire 2005, 14, 321–338. [Google Scholar] [CrossRef] [Green Version]
  71. Lattimer, B.Y. Heat Transfer from Fires. In Encyclopedia of Wildfires and Wildland-Urban Interface (WUI) Fires; Manzello, S.L., Ed.; Springer International Publishing: Cham, Switzerland, 2020; pp. 610–619. [Google Scholar] [CrossRef]
  72. Silvani, X.; Morandini, F. Fire spread experiments in the field: Temperature and heat fluxes measurements. Fire Saf. J. 2009, 44, 279–285. [Google Scholar] [CrossRef]
  73. Morandini, F.; Silvani, X. Experimental investigation of the physical mechanisms governing the spread of wildfires. Int. J. Wildland Fire 2010, 19, 570–582. [Google Scholar] [CrossRef] [Green Version]
  74. Albini, F.A. Spot Fire Distance from Burning Trees—A Predictive Model. FRAMES. 1979. Available online: https://www.frames.gov/catalog/8153 (accessed on 3 July 2021).
  75. Forestry Canada Fire Danger Group. Development and Structure of the Canadian Forest Fire Behavior Prediction System; Information Report No. ST-X-3; Forestry Canada, Science and Sustainable Development Directorate: Ottawa, ON, Canada, 1992. Available online: https://cfs.nrcan.gc.ca/publications?id=10068 (accessed on 3 July 2021).
  76. Turner, J.A.; Lawson, B.D. Weather in the Canadian Forest Fire Danger Rating System. A User Guide to National Standards and Practices; Pacific Forest Research Centre Information Report BC-X-177; Fisheries and Environment Canada, Canadian Forest Service: Victoria, BC, Canada, 1978. Available online: https://cfs.nrcan.gc.ca/publications?id=1843 (accessed on 3 July 2021).
  77. Agriculture and Agri-Food Canada. Agroclimate—Map Archive [Geospatial Material]. 2018. Available online: http://www.agr.gc.ca/DW-GS/historical-historiques.jspx?lang=eng&jsEnabled=true (accessed on 3 July 2021).
  78. Dickinson, K.J.M.; Kirkpatrick, J.B. The flammability and energy content of some important plant species and fuel components in the forests of southeastern Tasmania. J. Biogeogr. 1985, 12, 121–134. [Google Scholar] [CrossRef]
  79. Jolly, W.M.; Parsons, R.A.; Hadlow, A.M.; Cohn, G.M.; McAllister, S.S.; Popp, J.B.; Hubbard, R.M.; Negron, J.F. Relationships between moisture, chemistry, and ignition of Pinus contorta needles during the early stages of mountain pine beetle attack. For. Ecol. Manag. 2012, 269, 52–59. [Google Scholar] [CrossRef]
  80. Alexander, M.E. ‘Lest we forget’: Canada’s major wildland fire disasters of the past, 1825–1938. In Proceedings of the 3rd Fire Behavior and Fuels Conference, Spokane, WA, USA, 25–29 October 2010; International Association of Wildland Fire: Birmingham, UK, 2010; Available online: https://firesmartcanada.ca/wp-content/uploads/2019/10/Alexander-Lest-We-Forget.pdf (accessed on 3 July 2021).
  81. Currie, T.M. The Ottawa Valley’s Great Fire of 1870: The Nineteenth Century Press and the Reality of a Great Disaster; Creative Bound International: Carp, ON, Canada, 2009. [Google Scholar]
  82. Public Safety Canada. Canadian Disaster Database. 2020. Available online: http://cdd.publicsafety.gc.ca/srchpg-eng.aspx?dynamic=false (accessed on 3 July 2021).
  83. Murphy, P.J.; Tymstra, C.; Massie, M. The Great Fire of 1919: People and a Shared Firestorm in Alberta and Saskatchewan, Canada. Forest History Today. 2015. Available online: https://foresthistory.org/wp-content/uploads/2016/12/2015GreatFireof1919.pdf (accessed on 3 July 2021).
  84. Hirsch, K.G. A chronological overview of the 1989 fire season in Manitoba. For. Chron. 1991, 67, 358–365. [Google Scholar] [CrossRef] [Green Version]
  85. Government of Manitoba, Sustainable Development. Manitoba Forest Fires: 1914–2020. 2020. Available online: http://www.gov.mb.ca/sd/fire/Fire-Historical/firestatistic.html (accessed on 3 July 2021).
  86. Government of British Columbia. Wildfire Season Summary—Province of British Columbia. 2020. Available online: https://www2.gov.bc.ca/gov/content/safety/wildfire-status/about-bcws/wildfire-history/wildfire-season-summary (accessed on 3 July 2021).
  87. Tymstra, C.; Flannigan, M. The Chinchaga Firestorm: When the Moon and Sun Turned Blue; The University of Alberta Press: Edmonton, AB, Canada, 2015. [Google Scholar]
  88. Alexander, M.E. Analysis of the Canadian Forest Fire Weather Index for the 1968 Lesser Slave Lake Fire; Forestry Report No. 28; Northern Forest Research Centre: Edmonton, AB, Canada, 1983. [Google Scholar]
  89. Wein, R.W. Forest Fires and Northern Communities. Lessons from the 1968 Inuvik Fire; Aurora Research Institute Scientific Report No. 8.; Aurora College: Inuvik, NT, Canada, 2002. [Google Scholar]
  90. Alberta Government. Final Documentation Report Chisholm Fire (LWF-063). 2018. Available online: https://open.alberta.ca/publications/0778518418 (accessed on 3 July 2021).
  91. Alexander, M.E.; Lanoville, R.A. Wildfires as a source of fire behaviour data: A case study from Northwest Territories, Canada. In Postprint Volume Ninth Conference on Fire and Forest Meteorology, San Diego, CA, USA, 21–24 April 1987; American Meteorology Society: Boston, MA, USA, 1987; pp. 86–93. [Google Scholar]
  92. Tymstra, C.; MacGregor, B.; Mayer, B. The 2002 House River Fire. Fire Manag. Today 2005, 65, 16–18. [Google Scholar]
  93. Kulig, J.C.; Kimmel, A.; Gullacher, A.; Reimer, B.; Townshend, I.; Edge, D.S.; Lightfoot, N.; McKay, M.; Barnett, M.; Clague, J.; et al. McLure Fire: Lessons Learned. 2010. Available online: http://www.ruralwildfire.ca/sites/ruralwildfire/files/The%20Mclure%20Fire%202003%20(Barriere,%20BC)%20-%20Lessons%20Learned%20booklet.pdf (accessed on 3 July 2021).
  94. City of Kelowna. Okanagan Mountain Park Fire. 2003. Available online: https://www.kelowna.ca/city-services/emergency-services/fire-department/okanagan-mountain-park-fire (accessed on 3 July 2021).
  95. Government of Alberta. Status Update on Wildfires. 2011. Available online: https://www.alberta.ca/release.cfm?xID=305091A5D064D-D055-0AA8-28E88A385BB34788 (accessed on 3 July 2021).
  96. Parks Canada. Kenow Wildfire. 2021. Available online: https://www.pc.gc.ca/en/pn-np/ab/waterton/nature/environment/feu-fire/feu-fire-kenow (accessed on 3 July 2021).
  97. Parks Canada. Verdant Creek Wildfire—2017. 2018. Available online: https://www.pc.gc.ca/en/pn-np/ab/banff/securite-safety/feu-fire-verdant (accessed on 3 July 2021).
  98. Alexander, M.E.; Janz, B.; Quintilio, D. Analysis of extreme wildfire behaviour in east-central Alberta: A case study. In Preprint Volume Seventh Conference on Fire and Forest Meteorology, Fort Collins, CO, USA, 25–28 April 1983; American Meteorology Society: Boston, MA, USA, 1983; pp. 38–46. [Google Scholar]
  99. Government of Alberta. Update on Wildfire and Evacuations in Mackenzie County. 2012. Available online: https://www.alberta.ca/release.cfm?xID=326527791B16B-BC78-3827-80205BBF93D2E7C8 (accessed on 3 July 2021).
  100. KPMG LLP. May 2016 Wood Buffalo Wildfire Post-Incident Assessment Report. 2017. Available online: https://www.alberta.ca/assets/documents/Wildfire-KPMG-Report.pdf (accessed on 3 July 2021).
Figure 2. The proposed test set-up for measuring the energy release contribution of the sample to the incoming flame using an oxygen consumption cone calorimeter. The energy release of (a) the incoming methane flame interacting with live fuel was greater (even when only judged visually by the volume of flames), compared with (b) the energy release of the methane flame alone. This difference in energy release represents the fuel element’s/sample’s contribution to the energy release of the incoming methane flame ∆e+ (kJ) in Equation (1). From bottom to top in (a): load cell, a methane burner, incoming methane flame, wire-mesh sample holder containing a live fuel sample burning within incoming methane flame, and outgoing flame (methane flame mixed with the flame of the burning live fuel sample). Vertical (upward) direction of flame propagation represented by the experimental setup of the apparatus is slightly different from that occurring in real crown fire flame-fronts, where it is forward-upward.
Fire 05 00001 g002
Figure 3. (a) Fuel sample (new shoots) in a 10 × 10 × 1 cm wire mesh sample holder placed on the weight scale. (b) Side view of the empty sample holder. The design of the sample holder provided a constant distance from the shoots to the ignition source and spatial uniformity (constant dimensions and controlled density) of the fuel sample.
Fire 05 00001 g003
Figure 4. Seasonal variation in live fuel flammability expressed as differential effective heat of combustion (∂Heff): (a) Time series. Red, blue, green, and orange lines represent tree branch, new, 1 year−, and 2+ year-old shoots respectively. Standard error is shown as same-color shadow around each line. Flammability of new shoots stayed substantially negative from late-May until late-June; (b) Box plot of seasonal variation in ∂Heff for tree branch, new, 1 year−, and 2+ year-old shoots. A horizontal line within the box (the interquartile range, IQR) indicates the median. Whiskers are shown at 1.5 IQR. Circles indicate observed values outside of the 1.5 IQR.
Fire 05 00001 g004
Figure 5. Variation in energy release contribution depending on fuel properties. For (a) new shoots with high water content, the combined energy release of the incoming methane flame interacting with burning live fuel was lower (both when measured and when judged visually by the volume of flames) compared with the initial energy release of the incoming methane flame alone (indicated by white dashed line). Therefore, the live fuel sample’s contribution to the energy release of the incoming methane flame expressed as ∂Heff was negative. In the case of (b) highly flammable 1 year-old shoots, the ∂Heff was positive, where the combined volume (and hence energy release) of the incoming methane flame interacting with burning live fuel was larger compared to that of the incoming methane flame alone (indicated by white dashed line).
Fire 05 00001 g005
Figure 6. Seasonal variation in shoot properties for white spruce in 2014: (a) shoot water content on a volume basis (SWCvol); (b) shoot water content on a dry mass basis (SWCdm); and (c) fresh mass basis energy content (EC). Solid red, blue, green, and orange lines represent tree branch, new, 1 year-, and 2+ year-old shoots, respectively. Standard error is shown as a same-color shadow around each line.
Fire 05 00001 g006
Figure 7. The figure shows the energy balance and the state of the frontal flame determined by the energy balance at each separate fuel element (ΔE), which is the sum of energy generation (∆e+) and energy losses (∆e). Flame propagates from fuel element F1 to fuel element F4; flame from each previous element represents incoming frontal flame. Vertical direction of flame propagation, from the bottom to the top (instead of tilted sideways-upward as in real crown fire flame-fronts) represents the experimental setup and the apparatus. Depending on the weather conditions, and the physical, chemical, and spatial properties of the particular fuel bed, the value of ∆e+ may or may not be sufficient to compensate for the energy losses from a fuel element ∆e to the environment and into the horizontal propagation flux for preheating the next fuel elements. The frontal flame propagates steadily (middle image, equilibrium state) when ∆e+ = |∆e| because the horizontal propagation flux for the preheating of the next fuel elements (which is the “useful” part of ∆e) is compensated by the sufficient part of energy generation ∆e+. The frontal flame declines (left image) if ∆e+ < |∆e| because lower values of ∆e+ relative to |∆e| indicate declines in the horizontal propagation flux for the preheating of the next fuel elements, which is now insufficiently compensated by ∆e+. The frontal flame grows (right image) when ∆e+ > |∆e| because higher values of ∆e+ relative to |∆e| indicate increases in the horizontal propagation flux for the preheating of the next fuel elements.
Fire 05 00001 g007
Figure 8. Factors affecting live fuel flammability. Flammability as differential effective heat of combustion on a fresh mass basis (∂Heff) for tree branch, new, 1 year-, and 2+ year-old shoots of white spruce in relation to (a) shoot water content on a fresh mass basis (SWCfm), (b) shoot water content on a dry mass basis (SWCdm) as analog of FMC, (c) dry matter content, (DM), and (d) fresh mass basis energy content (EC). Red, blue, green, and orange dots represent tree branch, new, 1 year-, and 2+ year-old shoots, respectively.
Fire 05 00001 g008
Figure 9. Seasonal changes in live fuel flammability as measured in our study as differential effective heat of combustion (∂Heff) for 2014 (solid line) and as assumed by the FBP model when expressed as an FMC-derived Crown Spread Factor (dashed line). The FPB model assumes only one seasonal maximum in live fuel flammability around 1 June. Flammability measured in this study indicates the first seasonal maximum three weeks earlier, in early May, which closely matches the historical seasonality of extreme crown fire behavior in Canada (Figure A2 and Table A1). In agreement with the historical seasonality of extreme crown fire behavior, flammability measured in this study indicates the second and the third seasonal maximums around 1 July and 1 August when the FBP model assumes lowest values of the season.
Fire 05 00001 g009
Table 1. Flame-front exposure time documented for high-intensity wildland crown fire-fronts during International Crown Fire Modeling Experiment in the Northwest Territories, Canada.
Recording IDPreheating Start Timestamp
(h:min:s or s)
Preheating/Ignition Delay Time (s)Flame-Front Residence Time (s)Flame-Front Exposure Time (s)Source
Plot 3 Part II03:10:40195372[62] (video)
Video 304:32:47233558[63] (video)
Video 404:32:58182947[63] (video)
Video 504:32:53212950[63] (video)
Video 604:32:51133851[63] (video)
Video 704:32:36243862[63] (video)
Sensor height 13.8 m530353065[56]
Sensor height 12.3 m520502575[56]
Sensor height 9.2 m535352055[56]
Sensor height 6.2 m540353065[56]
Sensor height 3.1 m535502575[56]
Average 293261
Table 3. Seasonal variation in energy content and flammability. Minimum, maximum, mean, and standard deviations of fresh mass basis energy content (EC, kJ g−1) and flammability measured as differential effective heat of combustion (∂Heff, kJ g−1).
Plant Tissue TypeMinimumMaximumRangeMean (Standard Deviation)Sample Size
EC∂HeffEC∂HeffEC∂HeffEC∂Heff
Tree branch (mixed shoot)8.64−0.2411.9310.633.2910.8710.27 (0.81)4.39 (1.79)47
New shoots4.46−6.3310.886.486.4212.817.55 (2.07)0.23 (3.68)42
1 year shoots9.271.9811.517.102.245.1210.37 (0.52)4.75 (1.19)48
2+ year shoots9.542.6112.066.492.523.8810.92 (0.57)4.76 (0.86)48
All ages of shoots combined4.46−6.3312.067.107.6013.439.70 (1.89)3.38 (3.03)138
Table 4. Adjusted R-squared values for the predictor variables in modelling flammability as differential effective heat of combustion on a fresh mass basis (∂Heff) using traditional and proposed approaches. The proposed fresh mass basis approach introduced in this study showed same or better results in predicting flammability compared with the traditional mass loss basis approach.
PredictorR2 for Flammability (Predictand) as Fresh Mass Basis ∂Heff, New ApproachR2 for Flammability (Predictand) as Mass Loss Basis ∂Heff, Old Approach
Shoot water content, fresh mass basis (SWCfm)0.820.80
Shoot water content dry mass basis (SWCdm) as analog of FMC, but for shoots instead of just foliage0.790.78
Shoot dry matter content, fresh mass basis (DM)0.810.80
Shoot fresh mass basis energy content, (EC)0.800.77
Shoot gross heat of combustion dry mass basis (Hgross), or calorific content−0.005−0.002
Publisher’s Note: MDPI stays neutral with regard to jurisdictional claims in published maps and institutional affiliations.

