Article

Revealing the Individual Effects of Firing Temperature and Chemical Composition on Raman Parameters of Celadon Glaze

1
Department of Conservation Science, The Palace Museum, Beijing 100009, China
2
Center for Statistical Science, Peking University, Beijing 100191, China
3
Department of Biostatistics, Peking University, Beijing 100191, China
*
Author to whom correspondence should be addressed.
Ceramics 2023, 6(2), 1263-1276; https://doi.org/10.3390/ceramics6020077
Submission received: 12 May 2023 / Revised: 5 June 2023 / Accepted: 9 June 2023 / Published: 14 June 2023

Abstract

:
The Raman polymerization index (or IP value) is often used as a positive indicator of the firing temperature of the glazes of ancient ceramics. Previous studies have also reported that the IP value was negatively correlated with the chemical composition of the glaze. However, these findings were derived from data on the potential integrative effects of temperature and composition. To explore their individual effects, we prepared celadon glaze samples with controlled composition and firing temperatures. Particularly, according to the typical content of K2O and CaO in celadon glaze, four categories, or, in total, fifteen compositional formulations, were designed, and each formulation was fired at multiple temperatures (from 1180 to 1250 °C by 10 °C). The chemical compositions and the glassy matrix of samples were analyzed by an energy-dispersive X-ray fluorescence spectrometer and Raman spectroscopy, respectively. A positive correlation between firing temperature and IP value (correlation coefficient = 0.56) was detected only in the samples with low contents of K2O and CaO. However, no significant correlation was found when combining the samples with broad variation in chemical composition. Additionally, both the K2O content and CaO content were negatively related to the IP value, with regression coefficients of −9.645 and −5.332, respectively. Our results help to clarify the technology of ancient ceramic production and to improve its preservation.

1. Introduction

Raman spectroscopy, being an optical method, offers a great opportunity to non-destructively detect the nanomaterials and nanostructures within cultural heritage objects, especially those made of glass [1,2,3,4]. For example, Raman spectroscopy can detect molecular and lattice vibrations of glassy silicates within the glazes, enamels, and pigments of ancient ceramic samples, and can provide valuable information about their provenance, production process, and even their preservation conditions [1,5,6,7,8]. Therefore, Raman spectroscopy has drawn increasing interest in the study of ancient ceramics [5,6,7,8,9,10].
Using the Raman data of ceramic samples, research has revealed Raman features and their association with the characteristics of chemical composition as well as the parameters of production technology (i.e., firing temperature). The classical spectral decomposition of the Si-O bending (~500 cm−1) and stretching (i.e., ~1000 cm−1) envelopes was firstly proposed to approximate the distribution of the [SiO4]4− tetrahedral structure units, which contained different amounts of bridging oxygen. This provided an indication of the nature and quantity of fluxing oxides used in the manufacturing process [11,12].
In 2003, Philippe introduced the polymerization index (denoted as IP value), which was defined as the peak area ratio of the Si-O bending and stretching envelopes, to quantify the connectivity of the glassy structures within the glaze or enamels of ceramic samples [10]. Since then, some research has employed IP values to study ancient Western or Chinese ceramic samples, and a positive relationship between the IP value and the firing temperature has been reported [3,4,5,6]. Meanwhile, researchers also found a negative relationship between the contents of fluxing oxides (such as Na, K, Ca, and/or Pb oxides) and IP value. These contents could influence the connectivity of the tetrahedral units, de-polymerize the glass network, and consequently lead to changes in the Raman spectrum and IP value [3,13].
However, when it was used in previous studies, the IP value was calculated based on samples from different categories of glassy silicates featured by different melting/processing temperatures and varied chemical compositions [3,14]. Hence, when these previous studies drew conclusions regarding the individual effects of firing temperature or chemical composition on the IP value, they might have been using data on the integrative effects of temperature and composition, indicating the possibility of inaccuracy in their findings. Additionally, with certain types of ceramics for which the firing temperature varies relatively little, it is still inconclusive whether there is a positive correlation between the IP value and the firing temperature. For example, a recent study of real celadon samples (which are an important category of ancient Chinese ceramics) with significant variations in their composition provided inconsistent evidence that the IP value did not show a positive relation with the firing temperature [6,11].
According to these conflicting facts, we systematically analyzed the individual effects of firing temperature and chemical composition on the IP value and other Raman parameters based on celadon glaze samples. Our results may enhance the application of Raman spectroscopy in the analysis of ancient ceramics. To conduct the study, we prepared glazes by designing a series of compositional formulations and firing at different temperatures. The chemical compositions and the glassy matrix of glazes were analyzed by an energy-dispersive X-ray fluorescence spectrometer (ED-XRF) and Raman spectroscopy, respectively.

2. Materials and Methods

2.1. Preparation of Samples

Celadon has been developed for hundreds of years in China, undergoing considerable changes in chemical composition and firing temperature and having a major impact on the manufacturing of other types of ancient Chinese ceramics. Recently, some inconsistent evidence has emerged regarding the relationship between firing temperature and Raman polymerization index (IP value) for ancient celadon samples. To resolve this contradiction and to fully explore the effects of firing temperature and chemical composition on the Raman parameters, we prepared celadon glaze samples with different firing temperatures and different chemical compositions.
A series of formulations were determined in order to reproduce the celadon glaze reported in the literature. It was shown in previous studies [5,15] that the major materials forming the glassy network within the celadon glaze were SiO2 and Al2O3, with contents of 60–72% and 10–16%, respectively. In addition, two categories of flux composition were used for the real samples: one with high K2O content and low CaO content (denoted as HKLC), and the other with low K2O content and high CaO content (denoted as LKHC). The thresholds between the high and low K2O and CaO contents were estimated to be 3.4% and 9.5%, respectively [15]. Therefore, we defined the HKLC and LKHC formulations to mimic the chemical composition of real celadon samples. Furthermore, we added formulations of both high/low contents of K2O and CaO (denoted as HKHC and LKLC, respectively) to cover the known compositional range of celadon glaze. In summary, four categories and a total of fifteen formulations were determined as follows (Table S1).

2.2. Celadon Glaze Synthesis

Rock powders of feldspars, calcite, talc, kaolin, and quartz were employed as base glaze compositions, with the addition of iron oxide in the form of chemical materials to obtain glazes with a certain performance. For each formulation, several replications (5 g each) were placed into mullite crucibles and fired using an electric furnace at 1180 , 1190 , 1200 , 1220 , 1230 , 1240 , and 1250 , respectively. The firing procedure was as follows: (1) increasing from room temperature to target temperature in 3 h by a heating rate of about 6.67 °C/min; (2) parking for 1 h at the target temperature; and then (3) natural cooling to room temperature.

2.3. Analytical Methods

2.3.1. XRF Analyses

For each sample, the chemical composition of the glaze surface was analyzed by using X-ray fluorescence (XRF) spectroscopy (EAGLE II XXL, EDAX Company, Mahwah, NJ, USA). The unit was equipped with a rhodium X-ray tube and a Si (Li) detector with an energy resolution of 145 eV at 5.9 keV for Mn–Ka. The equipment was calibrated using a copper sheet. For XRF measurements, the incident X-ray tube voltage was 25 kV, the current was 600 µA, and the micro-beam size was 0.3 mm.

2.3.2. Raman Spectroscopy Analyses

Raman spectra were obtained with the 532nmNd: YAG laser using a Jobin–Yvon HR 800 LabRam Spectrometer (focal length 800 mm, Olympus microscope, 50 × long working distance objective lens, spectral range 150–1500 cm−1 with ~2 cm−1 resolution). Each spectrum was collected for 600 s.
Firstly, the collected spectra were processed using Labspec software to remove the background. We placed linear segments at the same locations and used minimal reference points (between 6 and 8) and spectral windows as recommended in the literature [3,4].
Secondly, the curve fitting was carried out using Gaussian functions to deconvolute the Si–O stretching, and bending ranges were used for the identification of the spectral components. As recommended in [13], we added three components for stretching ranges from 850~1250 cm−1 and initiated the peak positions of 950 cm−1, 1050 cm−1, and 1150 cm−1 for the Q1, Q2, and Q3–4, respectively. The compound component of Q3–4 could be attributed to the indistinguishable wavenumber shift, which was induced by the small connection of the last nonbridging oxygen and was affected by neighboring ions [13].
To perform curve fitting for a batch of Raman spectra, we used the open-sourced Python package lmfit [16] to extract the components. All the codes for this study are available online: https://github.com/yunPKU/Raman_curve_fitting (accessed on 1 May 2023).
Thirdly, the integral areas under the Si-O bending (~500 cm−1) and stretching (i.e., ~1000 cm−1) envelopes were calculated and denoted as A500 and A1000, respectively. The polymerization index IP was consequently calculated as the ratio of the bending and the stretching envelopes (i.e., A500/A1000). Additionally, the area ratios of the spectral components (i.e., Q1, Q2, and Q3–4) versus the total area of the stretching envelope were calculated and abbreviated as A1, A2, and A34, respectively.
Due to the incomplete melting of some crystals, such as quartz, microcline, and wollastonite, some spectra of the samples showed obvious peaks of quartz (e.g., at 127, 204, and 464 cm−1), of microcline (e.g., at 154, 264, 286, 402, and 511 cm−1), or of wollastonite (e.g., at 637 and 968 cm−1), which would incur significant bias in the calculation of the IP value and the extraction of the spectral components. We therefore excluded these samples from the following analysis. The Raman parameters of the selected spectra are summarized in Table 1.

2.3.3. Statistical Analysis

We used some multivariate statistical models to explore the individual effects of firing temperature and chemical composition on the Raman spectrum. Firstly, we used the partial correlation coefficient to quantify the individual effect of a specific flux oxide by adjusting the firing temperature and/or the contents of other flux oxides. Secondly, we used the Pearson correlation coefficient to investigate the association of IP value with the firing temperature within a particular category of formulations. A p-value < 0.05 was considered statistically significant. All of the calculations were performed using the open-source software JASP [17].

3. Results

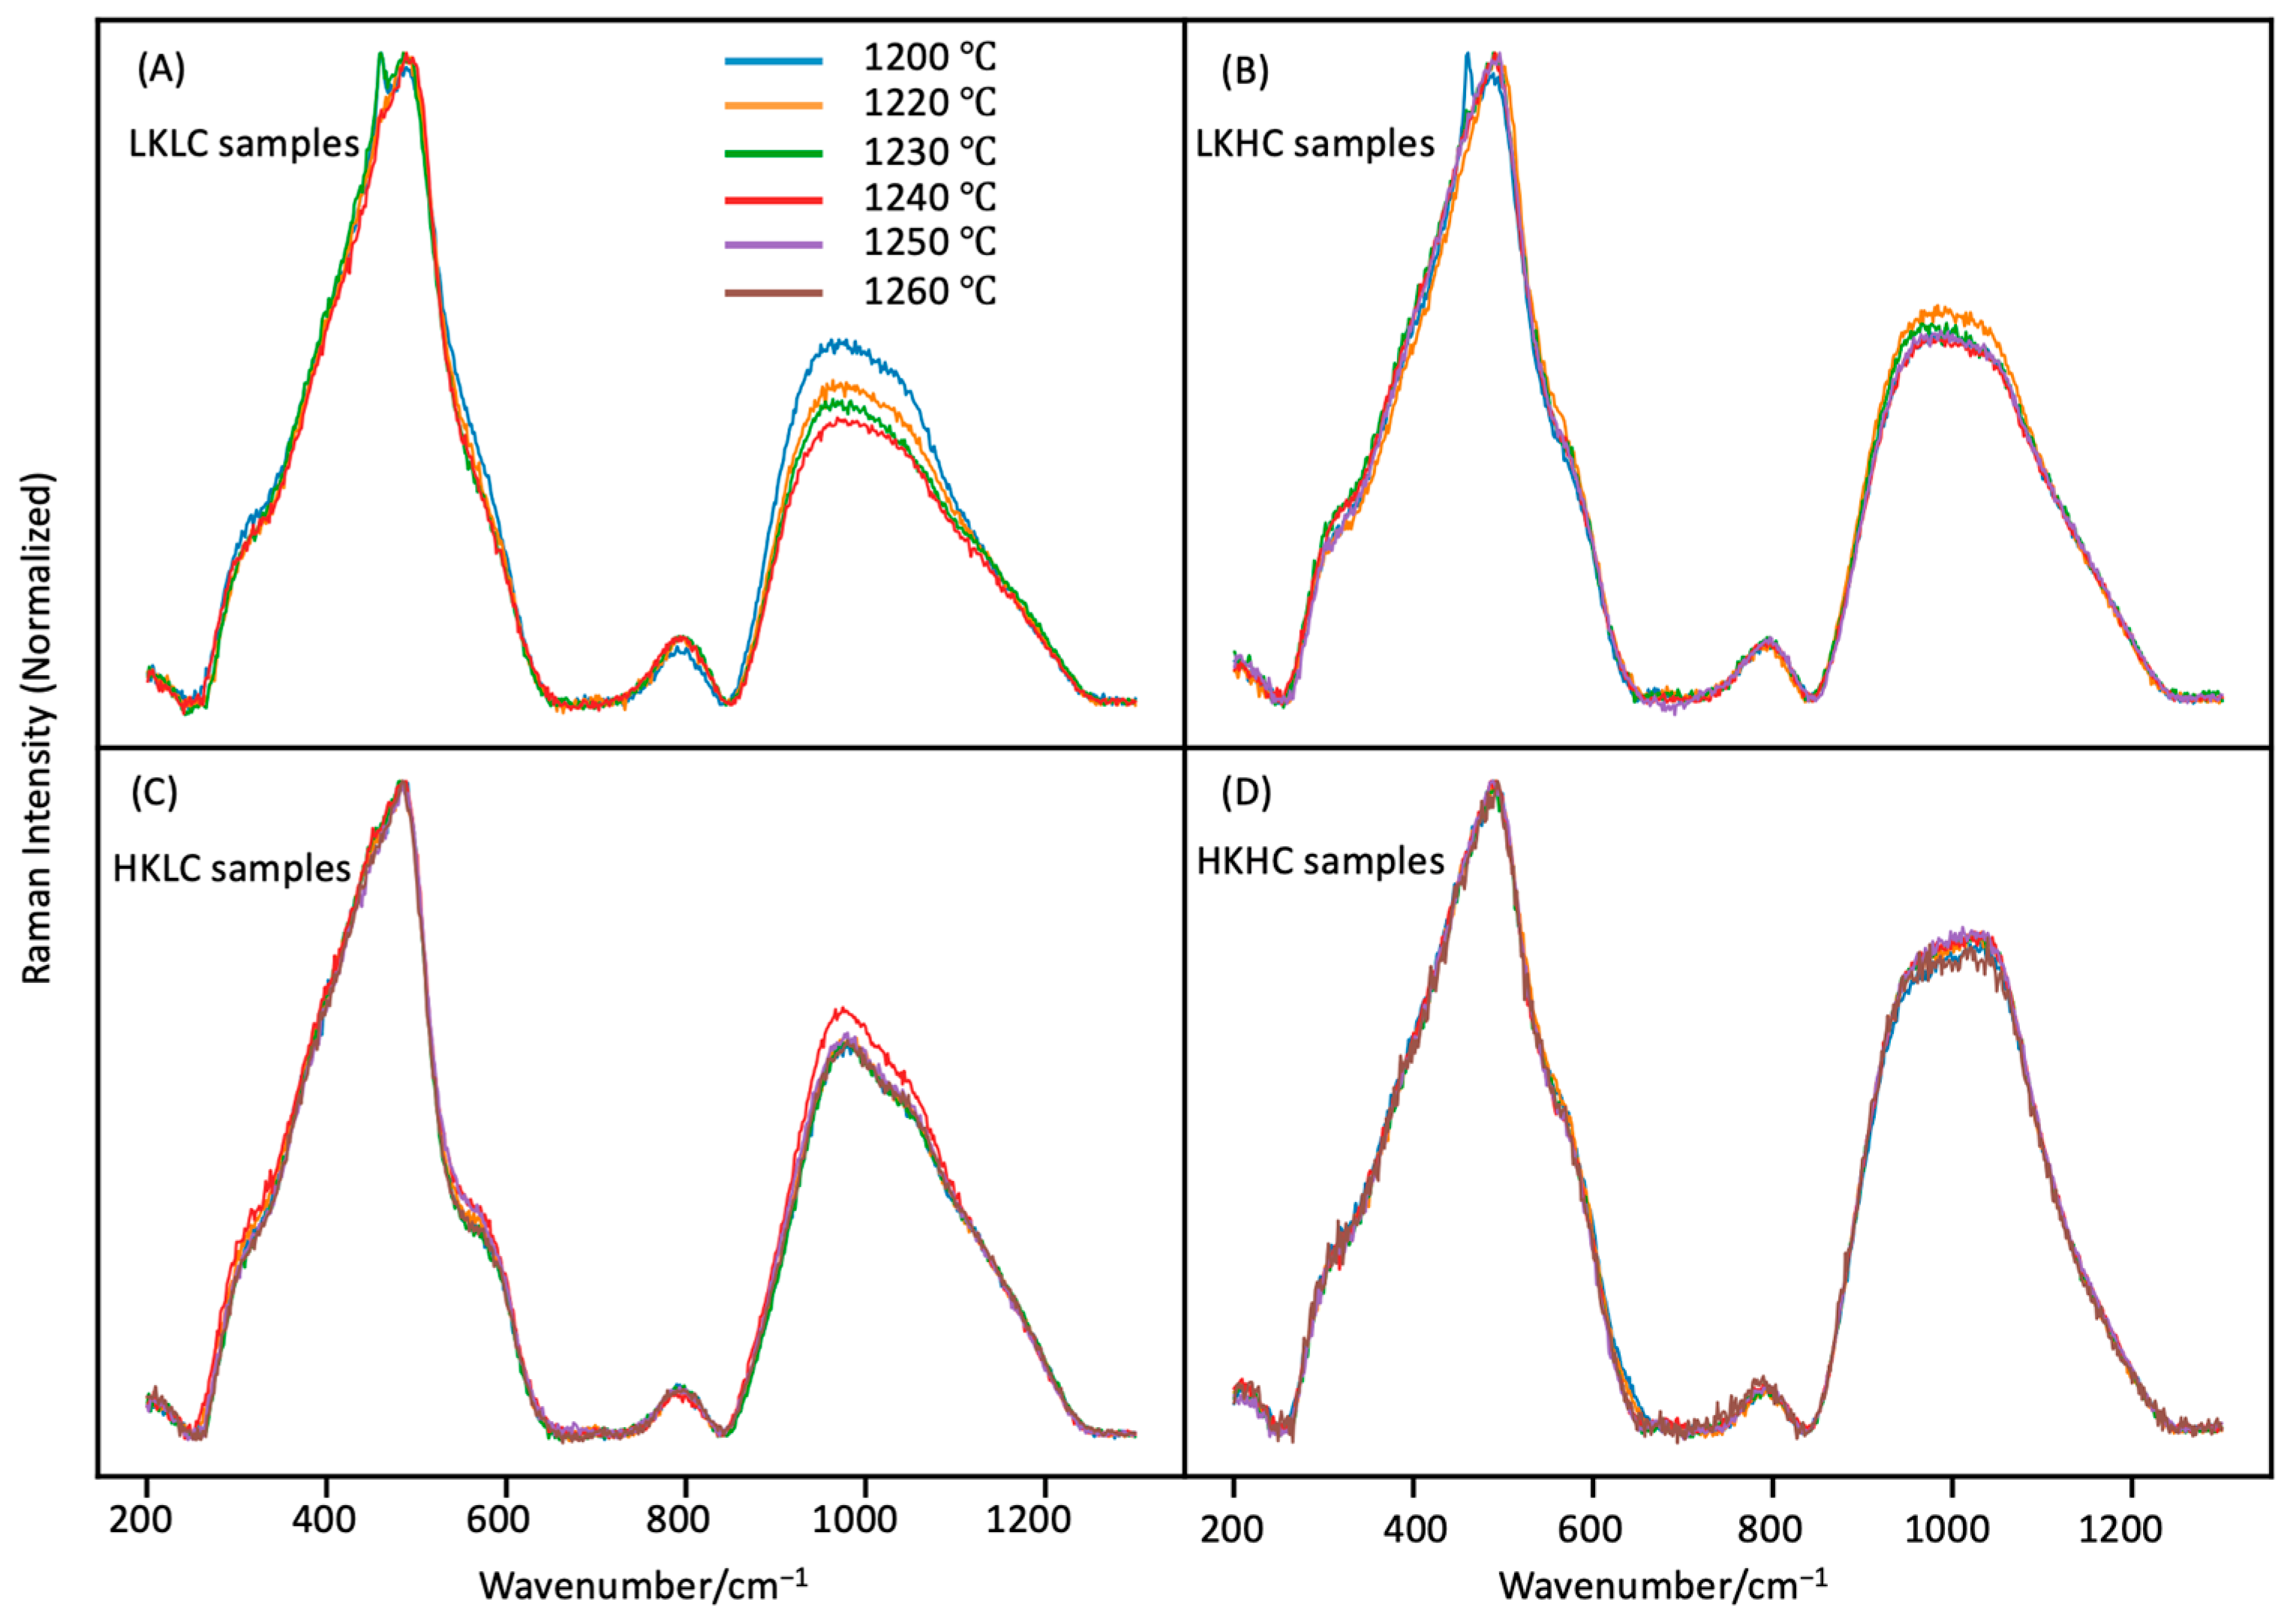
3.1. Influence of Firing Temperature on Raman Spectrum

For the spectra of typical samples (Figure 1), they each had two peaks within the range of 300–1350 cm−1: one was centered near 500 cm−1 and the other near 1000 cm−1, corresponding to the bending and asymmetric stretching vibration of the [SiO4]4− tetrahedral Si-O bond in the glass [3].
We found that the amplitude of the stretching envelope was more affected by the firing temperature than that of the bending envelope. Particularly, for the LKLC sample, the amplitude of the stretching peak decreased strictly with the increase in firing temperature (Figure 1A). For the HKHC sample, however, the amplitude of its spectra was the least affected by the firing temperature among the samples from the four categories.
We calculated the Pearson correlation between the IP value and the firing temperature for these spectra to quantify how the amplitude of the stretching peak changed with the firing temperature. Firstly, by combining the samples of all four of the categories, we found a positive, but non-significant, correlation between IP and the firing temperature with a correlation coefficient of 0.173 (p-value = 0.133), suggesting that no evidence for the correlation between IP value and firing temperature exists without controlling the chemical composition.
Secondly, we explored the correlation between firing temperature and IP value for samples within each category (Figure 2). For the LKLC samples, we observed a positive correlation between the firing temperature and the IP value, with a correlation coefficient of 0.56 (p value = 0.03), suggesting that the firing temperature played a considerable role in shaping the stretching peaks of these samples. However, for the other three categories, namely, HKLC, LKHC, and HKHC, no significant correlations were found, that is, the correlation coefficients were −0.07 (p-value = 0.78), −0.02 (p-value = 0.92), and 0.02 (p-value = 0.95), respectively (Figure 2).

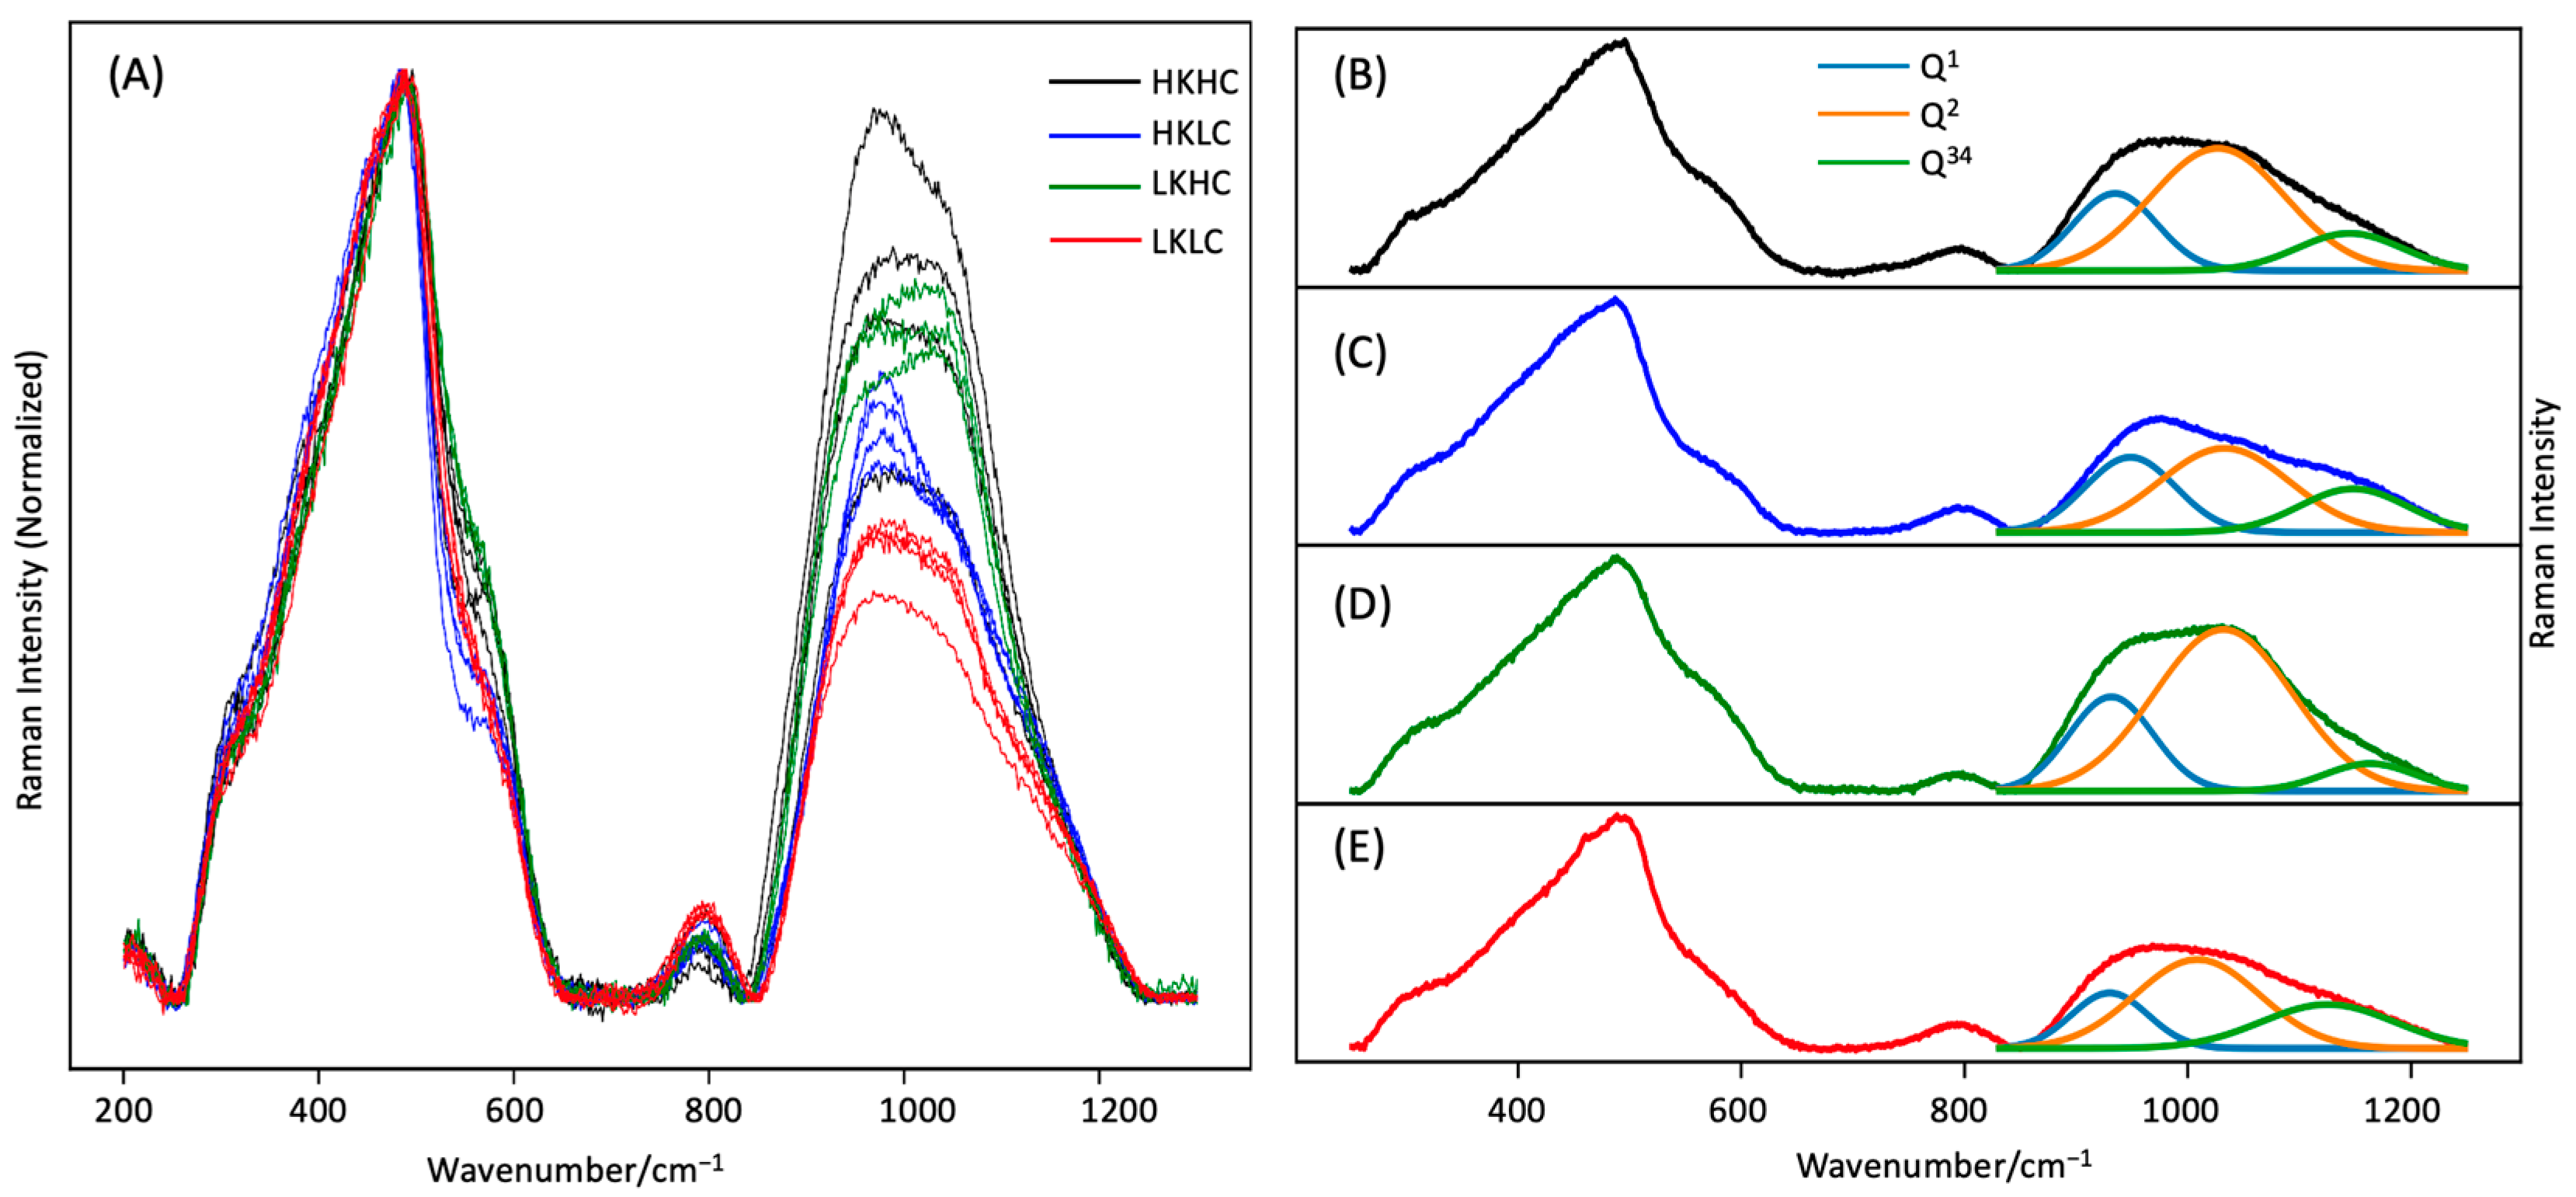
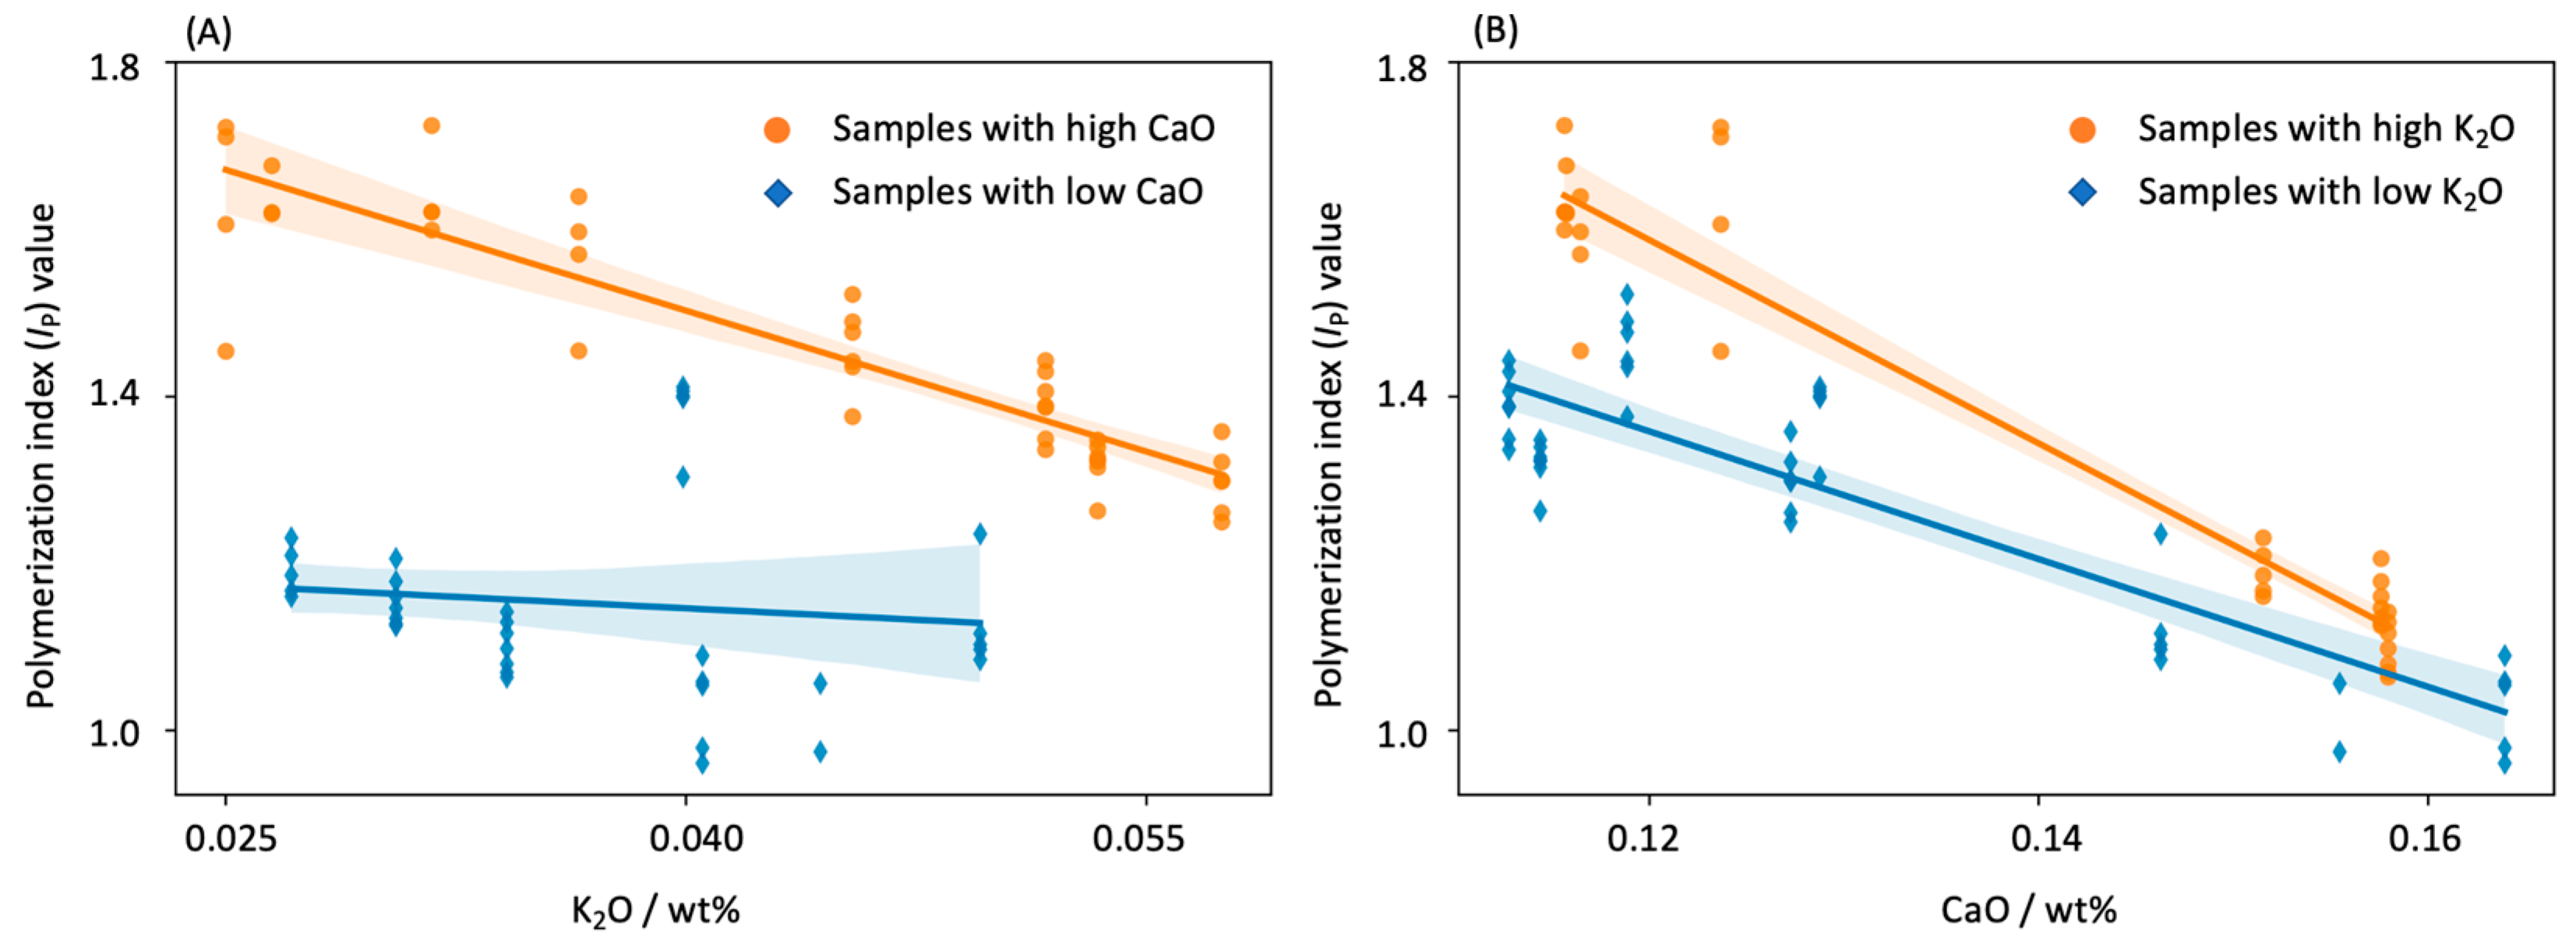
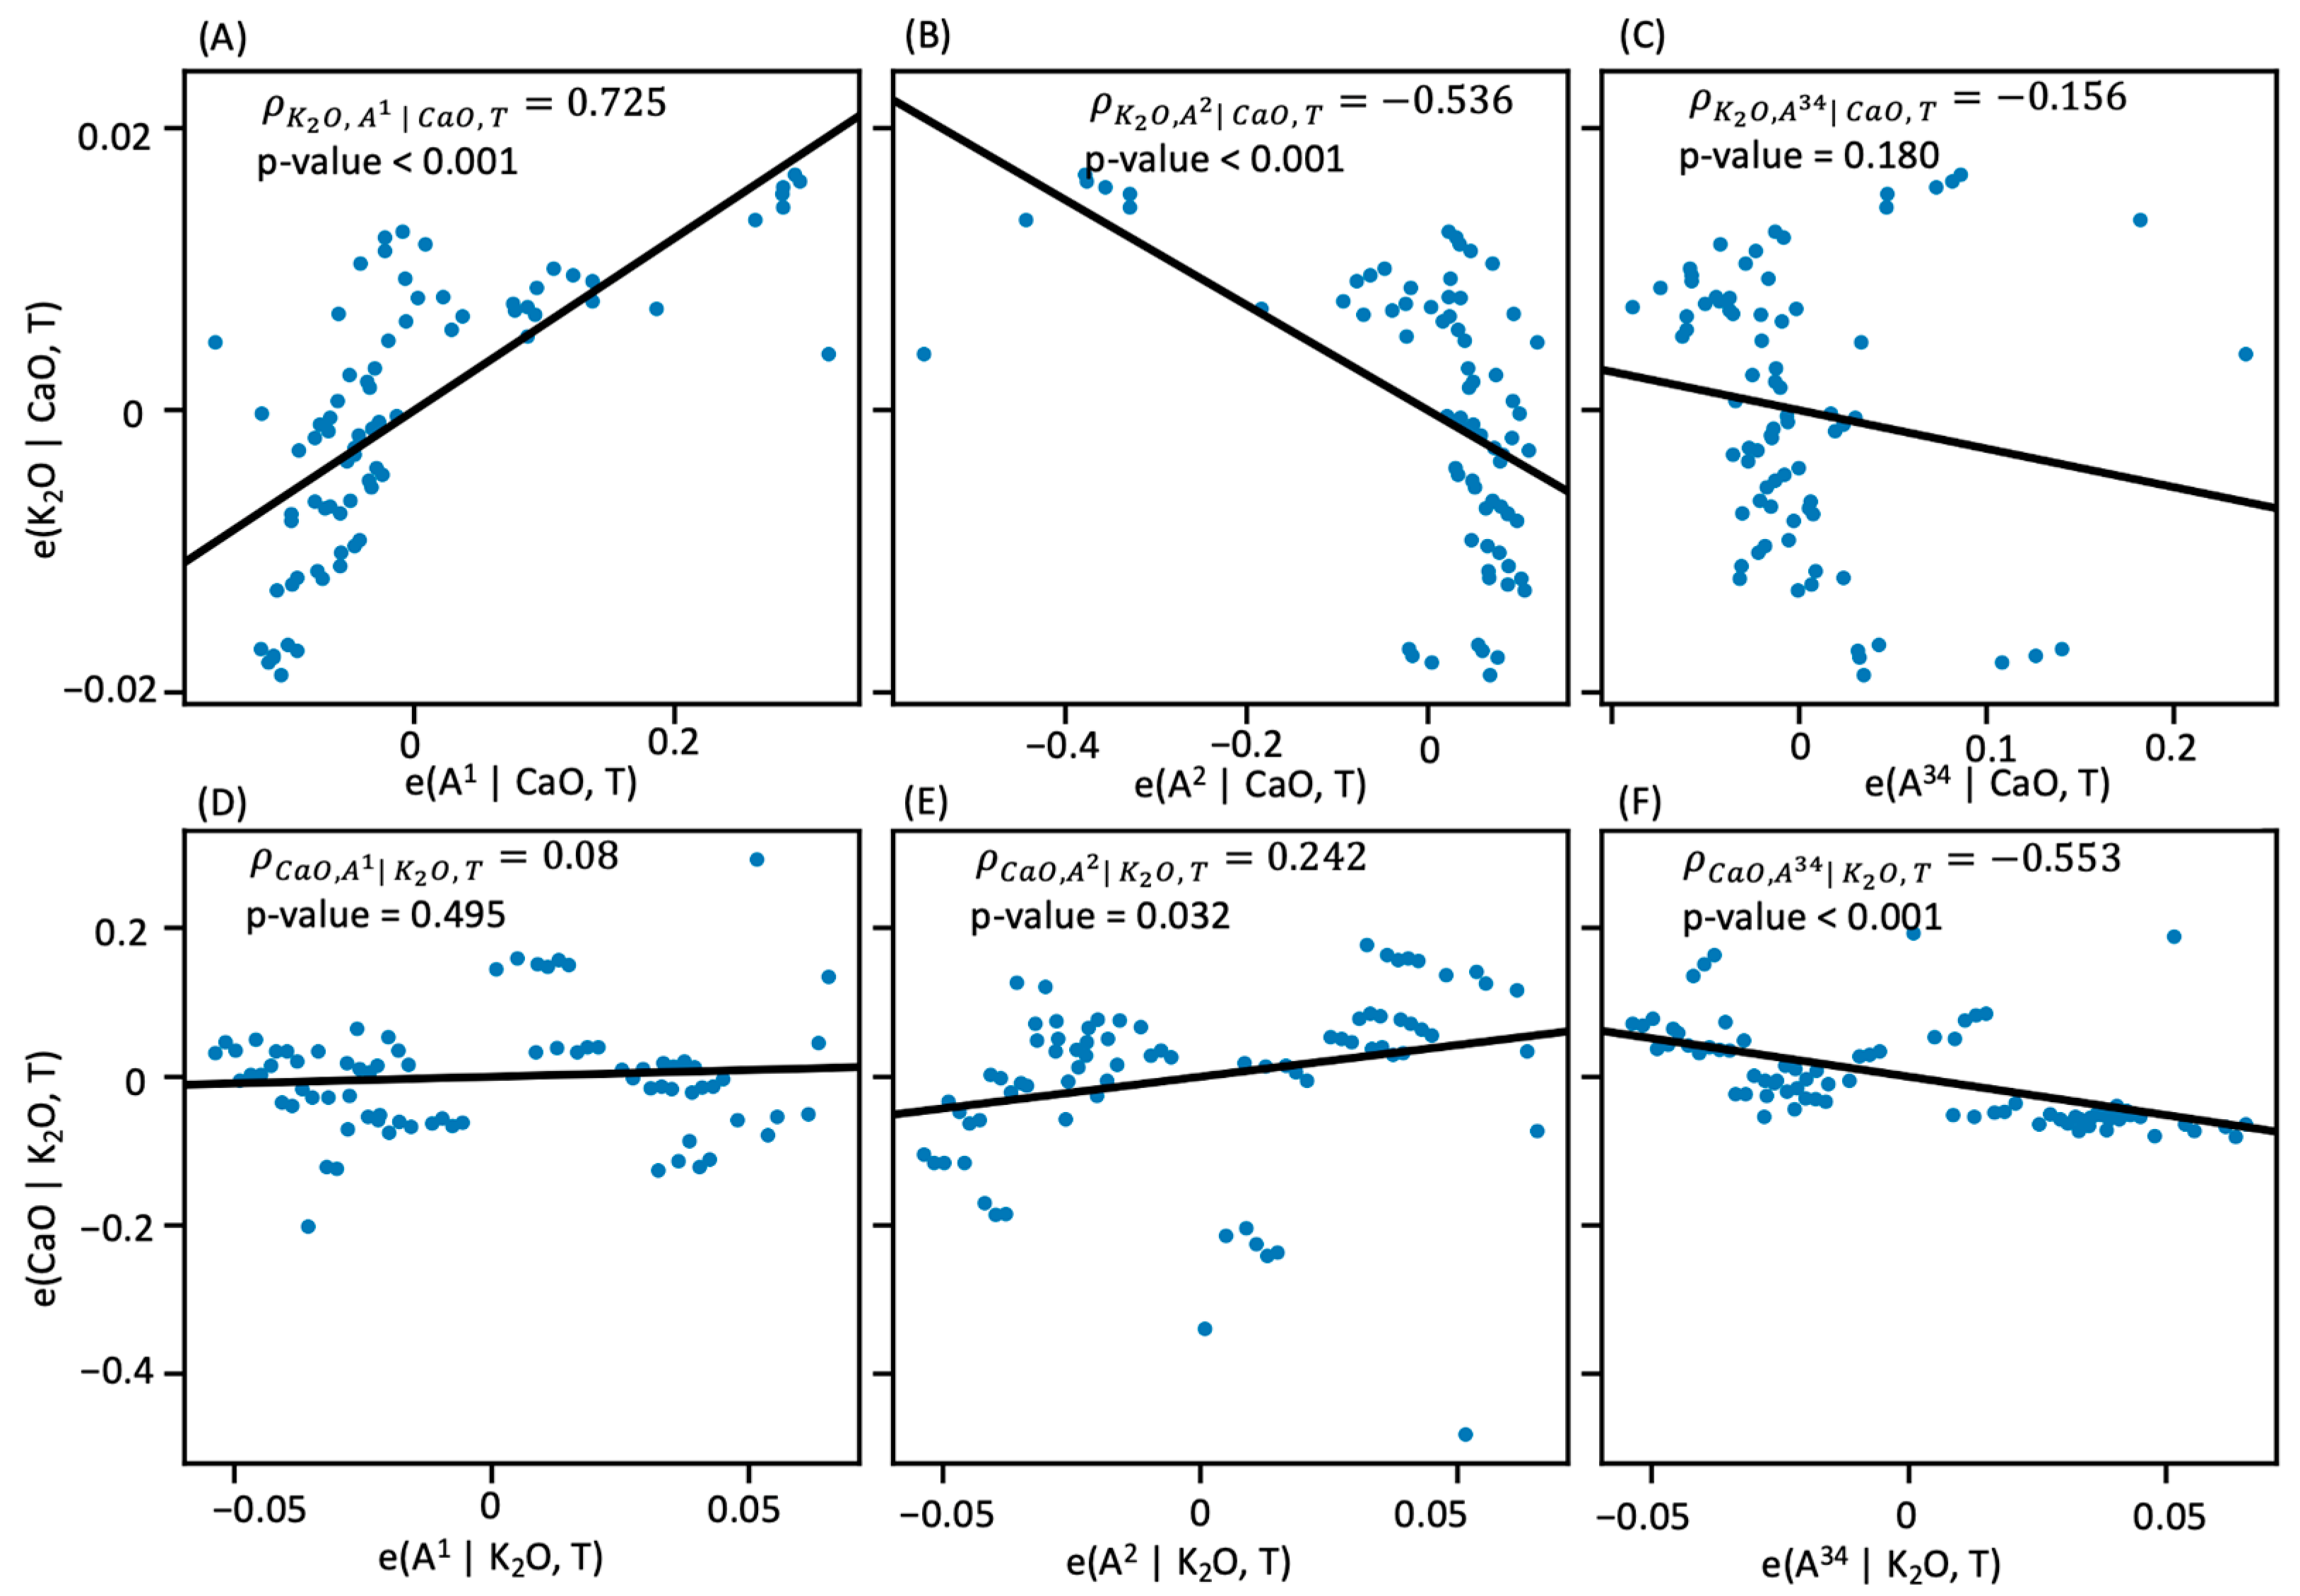
3.2. Influence of Chemical Composition on Raman Spectrum

When fixed at a typical firing temperature, i.e., 1250 , the stretching peaks of these spectra were more affected by the chemical composition than those of the bending peaks were (Figure 3A). Particularly, for the samples with higher CaO concentrations (Figure 1A, black and green curves), the amplitudes of their stretching peaks were higher those of the samples with lower contents of CaO (Figure 3A, blue and red curves). Similarly, due to the difference in the K2O contents, the black curves and the blue curves (i.e., spectra with high K2O content) had higher stretching peaks than the green and red curves did (i.e., spectra with low K2O content), respectively. These findings suggest that both K2O and CaO have a negative effect on the amplitude of the stretching peak.
We used partial correlation coefficients to quantify how the amplitude of the stretching peak changed with a particular fluxing oxide content (Figure 4). We estimated the partial correlation (conditioned on the temperature and CaO content) between K2O content and IP value to be −0.82 (p-value < 0.001). We also estimated the partial correlation (conditioned on the temperature and K2O content) between CaO content and IP value as −0.945 (p-value < 0.001). These results were consistent with the observations of the heights of the spectra and their relationships in Figure 3.
Furthermore, we built a multivariate regression model of the effect of CaO and K2O content (in mol%) on the IP value. Note that we ignored the firing temperature, as it did not show any correlation with the IP value conditioned on the chemical composition (Figure 4C). We found that the model fitted to the data very well, as 89.7% of the variation in IP value could be explained (Figure 5). Furthermore, we found that increasing each mole in the K2O content and CaO content was associated with −9.645 and −5.332 units of change in the IP value, respectively (Table 2), suggesting that K2O has a greater influence on the IP value and the degree of polymerization of the glaze than CaO does.
In addition, we explored the effect of chemical composition on the IP value for different classes of samples (Figure 6). We firstly divided the samples into two groups according to their CaO content, i.e., one class had high CaO content (i.e., both LKHC category and LKHC category), while the other had low CaO content (i.e., both LKLC category and HKLC category). We found that the regression slopes of IP on the K2O content (in mol%) for the samples of these two groups were −1.83 (p-value = −0.505) and −11.24 (p value < 0.001), respectively (Figure 6A), suggesting that K2O only exerted its effect on IP value for the samples with low CaO contents. Similarly, we estimated the effects of CaO content on IP value for the low-K2O samples (i.e., both HKLC category and LKLC category) and high-K2O samples (i.e., both HKHC category and HKLC category), and found values of −6.08 (p value < 0.0001) and −3.82 (p value < 0.0001), respectively (Figure 6B), suggesting that CaO content continued to have a considerable effect on the IP value regardless of the K2O content.
We also observed considerable differences in the shapes of the stretching peaks across the four sample categories (Figure 3A). For the spectra of the samples with higher K2O contents (i.e., the HKHC and HKLC samples), the stretching envelopes peaked around 950~980 cm−1 (Figure 3A, black and blue curves). For the LKHC samples, their stretching envelopes peaked around 1050 cm−1 (Figure 3A, green curves). For the bending peaks, there were no considerable differences in shape between the samples, indicating that the bending peak was less affected by the chemical composition.
To accurately explore the quantitative relationship between chemical content and spectral shape, we correlated the content of K2O and CaO with the area ratios of the spatial components (i.e., Qn units) of the stretching peaks (Figure 7). By adjusting the firing temperature and CaO content, we found that the area ratios of A1 showed strong positive correlations with the content of K2O, with partial correlation coefficients of 0.725 (p-value < 0.001) (Figure 7A). The observed correlation was consistent with the increasing trend of Q1 components with potassium content in medieval-like glass samples [14]. Furthermore, when adjusting the firing temperature and the K2O content, we found that the area ratio of A34 was negatively related to the CaO content, with a coefficient of −0.553 (p-value < 0.001) (Figure 7F). This was consistent with the findings of other studies on celadon samples [7,13].
The component of Q2, which was jointly affected by the intensity of both Q1 and Q34, with correlation coefficients of −0.912 (p-value < 0.001) and −0.683 (p-value < 0.001), respectively, showed contrary correlations with both K2O ( ρ K 2 O , A 2 | C a O , T = −0.536, p-value < 0.001) and CaO ( ρ C a O , A 2 | K 2 O , T = 0.242, p-value = 0.032).

4. Discussion

In this systematic analysis of celadon glaze samples using Raman spectroscopy, we revealed that the firing temperature and chemical composition had individual effects on the Raman polymerization index (IP value) and other parameters of celadon glaze. On the one hand, the firing temperature was positively related with the IP value (correlation coefficient = 0.56, p value < 0.001), but only in samples with low contents of K2O and CaO (LKLC). However, no significant correlation was found when combining the samples which had wide variation in their chemical compositions. On the other hand, with regard to the chemical composition, both the K2O content and the CaO content were negatively related to the IP value, with regression coefficients of −9.645 and −5.332, respectively. In addition, K2O content was positively related with the area ratio of the spectral component centered around 950 cm−1 (Q1 component), and the CaO content was negatively related with the area ratio of the spectral component centered around 1150 cm−1 (Q34 component); these observations were made according to the partial correlation coefficients of 0.725 (p value < 0.001) and −0.553 (p value < 0.001), respectively.
During the preparation of the celadon glaze samples, we allowed for independent variations, both in firing temperature and in chemical composition, to reveal their individual effects when Raman spectroscopy was applied. In most previous studies, Raman has been applied in real ceramic samples to analyze the effect of firing temperature or composition on the IP value without controlling either. Thus, the deduced dependence of IP value on the firing temperature or on the composition is susceptible to bias [14]. One recent study used celadon fragments made of one formulation, with variation only in the firing temperature, to deduce its relationship with the IP value [13]. This experiment obviously achieved more precise control of the temperature, but was limited by its formulation to discussing the relation between composition and IP value. In addition, the composition of the celadon may have varied under different temperatures due to diffusion, evaporation, and other complex chemical reactions during the firing process. Therefore, the interaction effect of temperature and composition could not be completely isolated; hence, the estimation based on these samples could be vulnerable to inaccuracy. Compared with these studies, the current study provided a good opportunity to reveal the individual effects of firing temperature and composition on Raman parameters.
Contrary to previous studies that reported conflicting evidence on the positive relation between the firing temperature and the IP value of celadon glaze [13], we found that the positive correlation was only valid for samples with low contents of K2O and CaO, while it was invalid for the other groups and for the overall samples. This inconsistency could be due to failure to control the interference of the composition with the effect of the temperature, which was the case for most previous studies [3,4,6]. Pu’s study [13] attempted to clarify this issue in samples with uniform compositions. Specifically, the contents of K2O and CaO were about 3.37% and 9.22%, on average, respectively. This formulation fell into the category of LKLC in our study, making his finding of a positive relation consistent with ours. For the overall samples with large variations in composition, the insignificant relation between the IP value and the firing temperature is supported by Bo’s study [6], in which the authors applied the IP value to a set of samples with large variations in composition.
A negative relation was detected between the contents of CaO and K2O and the IP value. Theoretically, this could be explained by the fact that the introduction of alkaline or alkaline-earth cations to silica induces depolymerization of the silicon–oxygen network to a certain extent [18]. As reported previously, the atoms of Ca and K have different effects during the fluxing process [19]. We found that the regression coefficients of the IP value on the K2O content and the CaO content were −9.645 and −5.332, respectively, suggesting that the K2O has greater strength in terms of modifying the glassy network.
We also identified the individual effects of K2O and CaO on the shaping of the stretching peaks of celadon glaze samples. Particularly, the K2O content was shown to be positively related with the area ratio of the spectral component centered at ~950 cm−1, which was consistent with previous study based on medieval-like glass samples [14]. This could be explained by the fact that adding K2O to a glassy silica network would increase the O:Si ratio and would cause the remaining silica tetrahedra to form chains, rings, or compounds [20]. As is consistent with the previous study [13], we also found that the CaO content was negatively related with the area ratio of the spectral component centered at ~1150 cm−1. The theoretical reason could be that introducing CaO allowed free oxygen to destroy the Si–O linkages, which dissociated sheet-like entities to form chain entities during the melting process.
On the Raman spectrum, the bending peaks were not significantly affected by either the firing temperature or the chemical compositions, which was consistent with previous studies on ancient ceramics. It is noteworthy that our analysis was conducted with simulated samples of ancient Chinese celadon, characterized by a CaO content of 6%–~15% (in wt%), a K2O content of ~2%–6% (in wt%), and a firing temperature range of 1180–1250 . Applications of our results beyond these scopes should be carried out cautiously.

5. Conclusions

In summary, we revealed that a positive effect of firing temperature on IP value exists in celadon with low K2O and low CaO contents. In addition, both K2O and CaO are negatively related to the Raman polymerization index in celadon glaze samples. Our finds could help to non-destructively clarify the fabrication techniques of ancient ceramics, determine their provenance and classification, recognize their authenticity, and even improve their preservation.

Supplementary Materials

The following supporting information can be downloaded at: https://www.mdpi.com/article/10.3390/ceramics6020077/s1, Table S1. Determined compositions and XRF chemical measured compositions (wt%) of the reproduced glaze varieties (oxide wt.%).

Author Contributions

Conceptualization, L.Z.; methodology, L.Z. and Y.Z.; software, L.Z. and Y.Z.; validation, L.Z. and Y.Z.; formal analysis, L.Z.; investigation, L.Z. and Y.Z.; writing—original draft preparation, L.Z. and Y.Z.; writing—review and editing, L.Z. and Y.Z.; visualization, Y.Z.; supervision, L.Z. All authors have read and agreed to the published version of the manuscript.

Funding

This work was supported by the National Natural Science Foundation of China (Grant number: 51172048, U1932203). However, the funder had no role in the study design, data collection, analysis, decision to publish, or manuscript preparation.

Institutional Review Board Statement

Not applicable.

Informed Consent Statement

Not applicable.

Data Availability Statement

All of the analyzed data are available within the article. The raw spectral data of Raman spectroscopy are available upon request.

Acknowledgments

The authors are grateful to Lifeng Miao of Jingdezhen Ceramic University, He Li of The Palace Museum, and Jian Zhang of Peking University for the production of the celadon glaze samples, for the analysis of chemical composition with ED-XRF, and for the careful examination of the manuscript, respectively.

Conflicts of Interest

The authors declare no conflict of interest.

References

  1. Colomban, P.; Slodczyk, A. Raman intensity: An important tool in the study οf nanomaterials and nanostructures. Acta Phys. Pol. A 2009, 116, 7–12. [Google Scholar] [CrossRef]
  2. Francesca, C.; Daher, C.; Bellot-Gurlet, L. Raman spectroscopy of cultural heritage materials: Overview of applications and new frontiers in instrumentation, sampling modalities, and data processing. In Analytical Chemistry for Cultural Heritage; Springer: Cham, Swizerland, 2017; pp. 161–211. [Google Scholar]
  3. Philippe, C.; Tournie, A.; Bellot-Gurlet, L. Raman identification of glassy silicates used in ceramics, glass and jewellery: A tentative differentiation guide. J. Raman Spectrosc. 2006, 37, 841–852. [Google Scholar]
  4. Philippe, C. On-site Raman identification and dating of ancient glasses: A review of procedures and tools. J. Cult. Herit. 2008, 9, e55–e60. [Google Scholar]
  5. Zhao, L.; Miao, J.; Yang, B.; Li, H. Non-destructive Raman study on the provenance and firing temperature of Guan Wares in the Song Dynasty. MRS Online Proc. Libr. OPL 2011, 1319, 801. [Google Scholar] [CrossRef]
  6. Wu, B.; Zhao, W.; Zhao, H.; Ren, X.; Liu, X.; Zhang, B.; Li, B.; Zhao, D. Inheritance relationship between Zhanggongxiang kiln celadon and Ru Guan celadon: Comments on the rationality of Raman Ip value evaluating firing temperature. Archaeometry 2023, 65, 247–258. [Google Scholar] [CrossRef]
  7. Wang, T.; Chen, P.; Wang, M.; Sang, Z.; Zhang, P.; Wang, F.; Sciau, P. Micro-structural study of Yaozhou celadons (Tang to Yuan Dynasty): Probing crystalline and glassy phases. J. Eur. Ceram. Soc. 2020, 40, 4676–4683. [Google Scholar] [CrossRef]
  8. Pamela, B.V. Ancient glazes. Sci. Am. 1990, 262, 106–113. [Google Scholar]
  9. Nayak, M.T.; Desa, J.E. Roles of iron and lithium in silicate glasses by Raman spectroscopy. J. Raman Spectrosc. 2018, 49, 1507–1513. [Google Scholar] [CrossRef]
  10. Philippe, C. Polymerization degree and Raman identification of ancient glasses used for jewelry, ceramic enamels and mosaics. J. Non-Cryst. Solids 2003, 323, 180–187. [Google Scholar]
  11. Steven, A.B.; White, W.B. Raman spectroscopic investigation of the structure of silicate glasses (II). Soda-alkaline earth-alumina ternary and quaternary glasses. J. Non-Cryst. Solids 1977, 23, 261–278. [Google Scholar]
  12. Bjørn, O.M. The structure of silicate melts. Annu. Rev. Earth Planet. Sci. 1983, 11, 75–97. [Google Scholar]
  13. Chen, P.; Wang, F.; Luo, H.; Zhu, J.; Shi, P.; Wang, T. Nondestructive study of glassy matrix of celadons prepared in different firing temperatures. J. Raman Spectrosc. 2021, 52, 1360–1370. [Google Scholar] [CrossRef]
  14. Lavinia, D.F.; Danilo, B.; Andrea, L.; Paolo, L.P.; Giovanna, V.; Guilhem, S. Structural and vibrational characterization of medieval like glass samples. J. Non-Cryst. Solids 2012, 358, 814–819. [Google Scholar]
  15. Li, H.; Ding, Y.Z.; Lv, C.L.; Miao, J.M.; Chen, T.M.; Tang, J.J.; Shen, Y.M.; Deng, H.Y. A Supplement to the Non-Destructive Analysis of Guan Wares from the Palace Museum (Beijing) Collection, Based on Their Body Compositions. Archaeometry 2015, 57, 90–109. [Google Scholar] [CrossRef]
  16. Newville, M.; Stensitzki, T.; Allen, D.B.; Ingargiola, A. LMFIT: Non-linear least-square minimization and curve-fitting for Python. Astrophys. Source Code Libr. 2016, Ascl-1606. [Google Scholar]
  17. JASP Team. JASP (Version 0.17.2) [Computer Software]. 2023. Available online: https://jasp-stats.org/ (accessed on 1 January 2023).
  18. Vanessa, L.; Colomban, P. Vibrational properties of silicates: A cluster model able to reproduce the effect of SiO4 polymerization on Raman intensities. J. Non-Cryst. Solids 2013, 370, 10–17. [Google Scholar]
  19. Ma, T.; Miu, S.L.; Lin, S.X.; Zhu, Z.F. Ceramics Technology; China Light Industry Press: Beijing, China, 2018. [Google Scholar]
  20. Donald, R.A.; Wright, W.J. Essentials of Materials Science and Engineering; Cengage Learning: Belmont, CA, USA, 2018. [Google Scholar]
Figure 1. Representative Raman spectra of the celadon glaze sample fired at different temperatures. The spectra were normalized to have the same maximum intensity. The spectra with different colors in each subplot were obtained from samples which had a uniform formulation, but were fired at different temperatures. (A) Example from the category of low K2O and low CaO (LKLC); (B) example from the category of low K2O and high CaO (LKHC); (C) example from the category of high K2O and low CaO (HKLC); (D) example from the category of high K2O and high CaO (HKHC).
Ceramics 06 00077 g001
Figure 2. Scatter plot of polymerization index (IP value) and firing temperature for four categories of samples. Colored dots represent samples from different categories (black: LKLC samples; green: HKLC samples; red: HKHC samples; blue: LKHC samples). Solid lines represent the linear fit for all categories, and shaded areas show the 95% confidence limits for the corresponding fits. Correlation coefficients ( ρ ) and p-values are reported as insets.
Ceramics 06 00077 g002
Figure 3. Representative Raman spectra of the celadon glaze samples and the extraction of the spectral components. (A) Raman spectra of the celadon glazes firing at 1250 after minimum baseline subtraction. The spectra were normalized to the same maximum intensity. Spectra with different colors were obtained from samples belonging to different composition categories. (BE) Example of the extraction of spectral components with Gaussian shape functions for four categories of samples.
Ceramics 06 00077 g003
Figure 4. (A) Partial regression plots between IP value and K2O content, conditioned on CaO content and firing temperature. (B) Partial regression plots between IP value and CaO content, conditioned on K2O content and firing temperature. (C) Partial regression plots between IP value and firing temperature, conditioned on K2O and CaO content. “e” stands for the partial residual and “|” stands for condition. Partial correlation coefficients ( ρ ) and p-values are reported as insets.
Ceramics 06 00077 g004
Figure 5. Performance of the model in terms of predicting polymerization index according to the K2O and CaO content. Plots of polymerization index residuals (A) and predicted polymerization indices (B) versus the actual polymerization indices. The coefficient of determination (R2) was reported as an inset.
Ceramics 06 00077 g005
Figure 6. Correlation between polymerization index (IP value) and the content of K2O (A) or CaO (B). Colored dots represent samples from different categories. Solid lines represent the linear fits, and shaded areas show the 95% confidence limits for the corresponding fits.
Ceramics 06 00077 g006
Figure 7. Partial regression plots between K2O content and area ratios of Qn units (AC) conditioned on the CaO content and firing temperature (denoted as T), and between CaO content and area ratios of Qn units (DF) conditioned on the K2O content and firing temperature, for all the analyzed samples. “e” stands for the partial residual and “|” stands for condition. Partial correlation coefficients ( ρ ) and p-values are reported as insets.
Ceramics 06 00077 g007
Table 1. Main Raman parameters of imitated glaze samples. Ip, index of polymerization; vQn: center of gravity wavenumber (cm−1) of the Si-O stretching Qn component; An, component area (% of the peak area) and ratio.
CategoryIDFiring Temperature
( )
IPvQ1vQ2vQ34A1A2A34
HKHC112001.402936.2171030.9491152.1970.2470.6390.115
12201.304933.3881027.7121147.4340.2480.6370.114
12301.399935.4551027.4461144.9710.2530.6020.144
12401.411934.9871027.2311145.4390.2420.6130.145
12501.407935.0491027.2121144.9660.2450.6080.147
HKHC212001.085933.6001031.5851150.6640.2700.6550.075
12201.097934.3281032.6701151.7620.2780.6490.073
12301.235935.7921035.5941150.1580.3040.6460.050
12401.117934.0871031.8761149.8280.2680.6520.080
12501.103936.0131034.7441154.3470.2760.6520.072
HKHC311801.090965.5501054.0331100.0000.6150.0670.317
12001.059933.3201033.5481161.1370.2660.6830.051
12301.055933.2281033.9881162.8030.2650.6860.050
12400.961942.3721042.4571169.3540.3590.6070.035
12500.979948.6881050.4541165.0430.4470.5040.049
HKHC412200.975931.5231031.0171160.7270.2910.6680.042
12501.057933.1681033.6391161.1560.2650.6840.051
HKLC511801.389937.6581018.1561134.4640.2150.5770.208
11901.336956.2191053.9711158.7820.4490.4420.109
12001.443955.6401050.7361161.6130.3860.5070.107
12201.406954.6991050.2731161.6080.3840.5170.099
12301.430958.0131054.0131160.4240.4190.4630.118
12401.349953.7021050.3301159.8170.4120.4860.101
12501.387950.3381045.1271158.7800.3530.5430.103
HKLC611801.358971.6481055.9241115.1970.6100.0600.330
12001.250972.9451066.6641140.4680.6210.1930.186
12201.261973.3681067.8261143.7200.6100.2110.179
12301.299973.9741066.2461140.4890.6050.1930.202
12401.300973.5911065.1261137.6860.6130.1810.206
12501.322973.5241064.9541139.1660.6040.1890.207
HKLC711801.263945.6351032.5321145.5510.3070.5560.136
11901.323958.9711057.6471162.9400.4470.4740.079
12001.348962.5151062.2221156.7700.4920.3860.121
12201.327956.9231057.1881160.8080.4390.4790.082
12301.315959.4531059.9891160.2640.4760.4290.095
12401.340959.1331060.0001161.1400.4560.4530.091
12501.324957.0651057.1991160.4990.4360.4780.086
HKLC811801.490942.6671026.1981145.5470.2420.5770.180
12001.442943.6561035.9071154.9740.2900.5880.122
12201.522948.3861039.3891157.1640.3040.5580.138
12301.477945.6331037.9951156.2460.2970.5720.131
12401.376941.1621035.0751154.6350.2790.6060.115
12501.436944.4151037.4631156.1410.2920.5840.124
LKHC911801.210932.3781032.1441163.5540.2440.6860.070
12001.168931.5031032.6141164.8470.2470.6900.063
12201.186930.5751030.8101163.3170.2370.6980.064
12301.161930.6671030.6001163.0070.2420.6940.064
12401.231931.6161031.6801162.4640.2410.6860.073
LKHC1011801.179931.8391032.6391163.0330.2490.6910.060
11901.206932.0931032.0471160.8070.2360.6930.071
12001.161931.5231032.5581163.1130.2460.6920.062
12201.135931.1521032.5661162.7650.2520.6910.058
12301.126931.1281032.0021163.1630.2450.6970.058
12401.147932.1121033.0291163.2310.2500.6900.059
12501.128931.2961031.4571161.7490.2400.6970.063
LKHC1111801.117932.7061032.7211159.4220.2540.6840.062
11901.064931.5331032.9821163.0180.2540.6950.050
12001.070931.3391032.2071161.6280.2490.6960.055
12201.098931.9151032.3811160.9460.2420.6990.059
12301.080931.7741032.4751161.9330.2470.6960.057
12401.130932.7351033.5631161.0980.2470.6920.060
12501.142932.6731033.3101160.3660.2550.6890.056
LKLC1212301.619933.6961021.9001145.4000.2290.5880.182
12401.676935.3771023.1971147.9350.2420.5800.177
12501.621934.6601022.0681145.6170.2300.5850.185
LKLC1312201.621938.2671029.5441154.7870.2380.6090.153
12301.599937.8931028.4601153.1840.2440.6000.156
12401.724940.3021029.1731154.4700.2430.5880.170
12501.621938.6631029.5771154.9630.2530.5960.151
LKLC1412201.455939.4581030.6781153.5380.2480.6030.149
12301.597941.5891032.0811155.9060.2420.6020.156
12401.640940.8501031.4771155.2820.2630.5870.150
12501.570938.5771029.7941153.4130.2500.6040.147
LKLC1512001.454929.7451015.8841135.5350.2400.5790.181
12201.606930.9651011.7611128.2580.2200.5320.247
12301.711932.0351010.1621130.1530.2190.5200.261
12401.722930.2391008.8901125.7210.2040.5250.271
Table 2. Regression coefficients of the model, obtained for the prediction of the polymerization index (IP) using the K2O and CaO content (in mol%).
Variable *Linear Regression Coefficients #tSignificance
β Standard ErrorStandardized Coefficients
(Constant)2.4950.053 47.473<0.001
K2O−9.6450.778−0.497−12.400<0.001
CaO−5.3320.213−1.005−25.068<0.001
* Predictors: Constant: K2O, and CaO; dependent variable: polymerization index (IP). # The fitted model is IP = 2.495 − 9.645 × K2O − 5.332 × CaO.
Disclaimer/Publisher’s Note: The statements, opinions and data contained in all publications are solely those of the individual author(s) and contributor(s) and not of MDPI and/or the editor(s). MDPI and/or the editor(s) disclaim responsibility for any injury to people or property resulting from any ideas, methods, instructions or products referred to in the content.

