
New Interpretation of X-ray Diffraction Pattern of Vitreous Silica


Molecular Foundry of Lawrence Berkeley National Laboratory, Berkeley, CA 94720, USA
Ceramics 2021, 4(1), 83-96; https://doi.org/10.3390/ceramics4010008
Submission received: 29 January 2021
/
Revised: 3 March 2021
/
Accepted: 9 March 2021
/
Published: 13 March 2021
(This article belongs to the Special Issue What Do We Still Want to Know 90 Years After the Continuous Random Network (CRN) Theory?)
Abstract
:The striking feature of X-ray diffraction pattern of vitreous silica is that the center of its intense but broad ring is located at nearly the same position as the strongest diffraction ring of β-cristobalite. Two fundamentally different explanations to the diffraction patterns were appeared about 90 years ago, one based on the smallest crystals of β-cristobalite and the other based on the non-crystalline continuous random network. This work briefly outlines the facts supporting and objecting these two hypotheses, and aims to present a new interpretation based on a medium-range ordering structure on the facets of clusters formed in the glass transition process. It will be shown that the new interpretation provides a more satisfactory explanation of the diffraction pattern and physical properties of silica glass, and offers considerable valuable information regarding the nature of glass and glass transition.
1. Introduction
When X-ray or electron beams encounter a crystalline material, they are diffracted by the planes of the atoms within the crystal. The narrow, sharp peaks of diffraction patterns let us decipher crystal structures with a high degree of accuracy. The diffraction technique is appropriately the first choice for determining the structure of crystalline materials. Any viable model of the crystal structure must be able to explain these diffraction patterns. Although the intensity profile of the diffraction pattern of vitreous silica has no sharp peaks and contains only one broadband, this band’s position and breadth are still crucial for studying the glass structures. Figure 1a shows the X-ray diffraction patterns of vitreous silica [1]. Identifying the internal structures that generate the diffraction pattern and using this structural information to reveal the nature of the glass and glass transition has challenged several generations of scientists. A convenient way to interpret the vitreous silica diffraction patterns is to compare them with that of β-cristobalite. On one hand, silica glass might be comparable to β-cristobalite in the internal structures, since β-cristobalite is the stable form of SiO2 in the temperature range through which the silica glass solidifies. On the other hand, the structural differences between silica glass and β-cristobalite, caused by different cooling rate, have to be identified.
Figure 1b shows the X-ray diffraction patterns of β-cristobalite [1]. The similarity and difference between Figure 1a,b are apparent. Both diffraction patterns are ring-shaped, and the center of the diffraction ring of vitreous silica in Figure 1a and the strongest ring of β-cristobalite in Figure 1b are located at nearly the same position. However, Figure 1a has only one defused broad ring, while Figure 1b has several sharp rings. The interpretations of these diffraction patterns in Figure 1a,b can be tracked back to many years ago.
In the 1930s, there were two most influential theories for interpreting these diffraction pattern: the crystallite hypothesis of Randall et al. [2,3,4] and the continuous random network hypothesis of Warren [1,5,6,7,8]. These two hypotheses represent fundamentally different views of glass diffraction pattern and the nature of the glass state. The details of the augments that lead to these theories and the exciting debate regarding these theories as well as several later related models can be found in the literature [9,10,11,12,13,14]. This work will briefly outline Randall’s crystallite hypothesis and Warren’s continuous random network hypothesis. This serves as background and contrast to a new interpretation of the silica glass diffraction pattern based on the formation of nanoflakes, which are the medium-range ordering structures in vitreous silica.
2. Previous Interpretations from the Crystallite Hypothesis and the Continuous Random Network Hypothesis
In the 1930s Randall published several papers, which claimed that tiny β-cristobalite crystals with an average size of 1.5 nm cause the main features of the diffraction pattern of vitreous silica [2,3,4]. Randall recognized that the intensity line of the strongest ring of β-cristobalite (111) in Figure 2a locates at almost the same position as that of the center of the diffraction ring of vitreous silica [2]. Additionally, the diffraction rings of crystals become broader as the sizes of the crystals become smaller. Figure 2b,c show the size effect on the intensity profiles of diffraction patterns. In Figure 2c, the observed intensity profile is almost the same as the simulated profile of the β-cristobalite powder with a size of 1.5 nm, shown in Figure 2b. Under Randall’s interpretation, the difference between the glass state and crystalline state is one of degree, not of kind.
However, there are several difficulties with the crystallite theory. First of all, the assumption leads to a discrepancy between the observed and calculated density of silica. The spacing of (111) planes obtained from the vitreous silica ring is 4.3 Å, while that from large β-cristobalite crystals is 4.1 Å. Such discrepancy is too large to match the density calculation. Secondly, the β-cristobalite undergoes a marked volume change in the temperature range of 200–300 °C, but vitreous silica shows no such change. Thirdly, if samples of vitreous silica are held at high temperatures, such as 1500 °C, one would expect that the tiny β-cristobalite crystals would grow larger gradually, and the broad diffraction peak become narrow gradually. This is found not to be the case—the broad ring of vitreous silica goes over abruptly into the sharp displaced rings of β-cristobalite. These difficulties of the crystallite theory are sufficiently severe that alternative interpretations were deemed necessary.
Among these, Warren’s hypothesis is more widely accepted. It is based on non-crystalline continuous random network theory [5,6,7,8]. It assumes no difference between the vitreous and crystal forms of silica in the near range. Four oxygens tetrahedrally surround each silicon with a silicon-oxygen distance of about 1.60 Å, and each oxygen is shared between two silicon atoms. Although the distance between neighboring tetrahedra is defined, two tetrahedra orientations around the common direction of bonding are completely random. Warren found that the calculated intensity profiles based on the random network hypothesis match the experimental ones well. Warren also reexamined the full width at half maximum (FWHM) of the broad vitreous silica diffraction peak using the Scherrer equation and calculated the size of particles in silica glass to be only about 0.77 nm [6]. This is less than the size of the unit cell of a β-cristobalite crystal, and hence, there is no unit of structure to repeat itself at regular intervals in a 3-dimensional glass network. Warren et al. therefore concluded that the interpretation of the diffraction pattern of vitreous silica is in complete agreement with the conclusions of Zachariasen’s continuous random network (CRN) theory illustrated in Figure 3 [8].
Although the CRN theory is the most popular glass structural model up to now and is presented in many textbooks, it has to be regarded as a first-order approximation of the glass structure. While the CRN theory is hardly challenged for its description of the short-range structure as a SiO4 tetrahedron and the long range as a random network, many experimental data have to be explained by medium-range orderings of SiO4 tetrahedra rather than random connected in silica glass [15,16,17,18,19]. Since Warren’s hypothesis does not identify the medium-range ordering structure in silica glass, a new interpretation based on the ordering structure formation in the medium-range is needed.
3. New Interpretation from the Nanoflake Model
3.1. Cluster Formation in Vitreous Silica
Cooling rate is the crucial factor in the formation of silica glass or β-cristobalite from the liquid silica above the melting temperature. This is shown in Figure 4, the schematic illustration of a time-temperature-transformation (T-T-T) curve [14,20]. The dashed line E, which is a tangent line to the “nose” of the T-T-T curve, represents the critical process with the minimum cooling rate to avoids crystallization. The cooling rates of processes A and B are above the critical line and yield silica glass. While the cooling rates of processes C and D are below the critical line and produce crystalline silica.
Usually, the crystals are polycrystal, and only a particular procedure with crystal seeds can make a large single crystal. The size distribution and the average size of the polycrystal silica are also cooling rate dependent. In Figure 4, the cooling rate of process C is higher than that of process D. It is expected that the average size of crystals obtained from process C is smaller than that from process D. As the cooling rates of processes increase and approach to the critical one from the right site of the T-T-T curve in Figure 4, the crystals’ average size gradually reaches the minimum value and the full width at half maximum (FWHM) of each diffraction ring increases. The formed crystal with the minimum size (crystalline nuclear) has the same 3-dimensional ordering structure as the large crystal. The shapes of crystals nucleated from liquids are materials dependent. The smallest β-cristobalite crystal has a 3-D ordering structure with an octahedral shape, as shown in Figure 5 [15,21]. Each facet of the octahedra is formed by two layers of SiO4 tetrahedra with a thickness of about 0.8 nm and lateral extension of about 2 nm. Figure 6a,b are the image of cross-section of the layers and the image from the perpendicular direction of the layers. Figure 6b shows that all Si-O bonds form 6-membered ring structure on the (111) plane of β-cristobalite. As long as the nuclei have formed in the cooling process, the crystal sizes increase quickly and result in sharp diffraction rings.
In contrast to processes C and D, the cooling rates of processes A and B are higher than the critical one, and only the embryonic clusters are formed in the processes. The embryos need more time to grow into a crystalline nuclear, and thus are less ordered than the crystal. The image from the perpendicular direction of the facet layers of the embryonic clusters is formed by the various-membered rings, shown in Figure 3, which need more time to organize to the six-membered rings. However, the cross-section of the layer structure on the facets is similar to that of the smallest crystal, shown in Figure 6a. Therefore, the facets of embryonic clusters have a one-dimension ordering structure, as the same as the smallest β-cristobalite crystal in the [111] direction, and the embryos generate only a broad ring corresponding to the (111) reflection without other reflections in their X-ray diffraction patterns.
Using the embryonic structure to interpret the silica glass diffraction patterns is only suitable for the high-temperature range. Experimental results show that when the silica glass is kept at 1500 °C for more than an hour, its broad diffraction pattern quickly transforms to a sharp ring pattern of β-cristobalite crystal [4]. However, if the silica glass is kept at a temperature lower than 1500 °C, such as 950 °C or 900 °C, for a long time (2000 h), the broad diffraction pattern does not change at all [22,23]. This temperature dependence reveals that a stabilized structural transformation of the embryos occurred in the cooling process from 1500 °C to 950 °C. Hence, it is necessary to identify the critical temperature at which the embryos start to convert to stabilized structure.
3.2. The Critical Temperature for Silica Glass
The sequence chart of silica polymorphic inversions shows that 1470 °C is the temperature of phase transformation between β-cristobalite crystal and β-tridymite crystal. This suggests that the structure of the β-cristobalite crystal is not stable at 1470 °C [24]. Thus, the growing path to the β-cristobalite for the formed embryos is terminated at the temperature of 1470 °C, and the embryonic clusters have to transfer to a different form to reduce the system’s free energy. The temperature of 1470 °C might be the critical temperature for vitreous silica, and there are analytical data to support this assumption. Figure 7 shows the experimental data of silica glass obtained from advanced measurements using a combination of aerodynamic levitation, laser heating, and synchrotron X-ray techniques [25]. It is believed that the origin of the first sharp diffraction peak (FSDP) in the X-ray scattering experiments of silica glass is caused by the medium-range ordering structure, although the exact form of the ordering structure is still being debated [25]. Figure 7 exhibits several parameters associated with the FSDP in the structure factor Sx(Q) of silica. The FWHM, area, height, and position of FSDP as a function of temperature are plotted in Figure 7a–d, respectively. There are three datasets corresponding to three different setups for different samples, plotted as open circles, solid circles, and triangles. The inset of Figure 7e shows an example peak fitted to Sx(Q) data. The vertical grey dotted line in the figures indicates that all peak parameters show a kink around 1750 K (1477 °C) with an error bar of 50 K. The distinct kinks at around 1477 °C for all peak parameters show structure change starting at 1477 °C. The increase in FSDP height and decrease in FSDP width and area upon cooling indicates that the extent of ordering increases as temperature decreases. These results are consistent with the hypothesis that the embryos start to transfer to stabilized form at 1470 °C, and the population of the transformed embryos increases as the temperature decreases below 1470 °C.
The structural changes at 1470 °C are not only detected by the structural analytical technique, but are also reflected in vitreous silica’s physical properties. The classical experimental data of the volume of vitreous silica as a function of temperature in the range between 1100 °C and 1800 °C were published half a century ago by Bruckner [26]. Figure 8a is a graph reproduced from Bruckner’s data, which shows the abnormal volume-temperature relation of silica glass. In Figure 8a, there is a volume minimum near 1500 °C. Above this point the volume increases with the temperature. However, from this point down to about 1100 °C, it anomalously increases as the temperature decreases. Using the data shown in Figure 8a, the thermal expansion coefficient is calculated as a function of the temperatures and shown in Figure 8b, which is seen to exhibit a step change, jumping from negative to positive at around 1470 °C. Such discontinuity in the thermal expansion coefficient is another indication that the embryonic clusters formed at high temperature start to change to a stabilized structure at 1470 °C and the changes continue below 1470 °C.
3.3. The Stabilized Structure—Nanoflakes
The structure of two parallel layers, illustrated by Figure 3 and Figure 6a, is not stable by itself. To form a stabilized two-layer-structure, all SiO4 tetrahedra in the top layer must be face-to-face bonded to SiO4 tetrahedra in the bottom layer. As shown in Figure 6c, an O layer is in the middle of this structure as a mirror plane for both top and bottom layers. Additionally, all rings formed by Si-O bonds connecting the top and the bottom layers are 4-membered rings with the same orientation. This stabilized structure is a one-dimensional ordering structure in the medium-range, shaped like a “nanoflake”.
The layer structures in silica glass have been studied previously by a transmission electron microscope (TEM) observation [15,27]. Figure 9 shows the TEM image of a fused silica specimen, from which the fringes with 0.4 nm spacing and 2 nm in length can be seen. The results are useful for confirming the layer formation in the glass but do not distinguish between structures shown in Figure 6a,c.
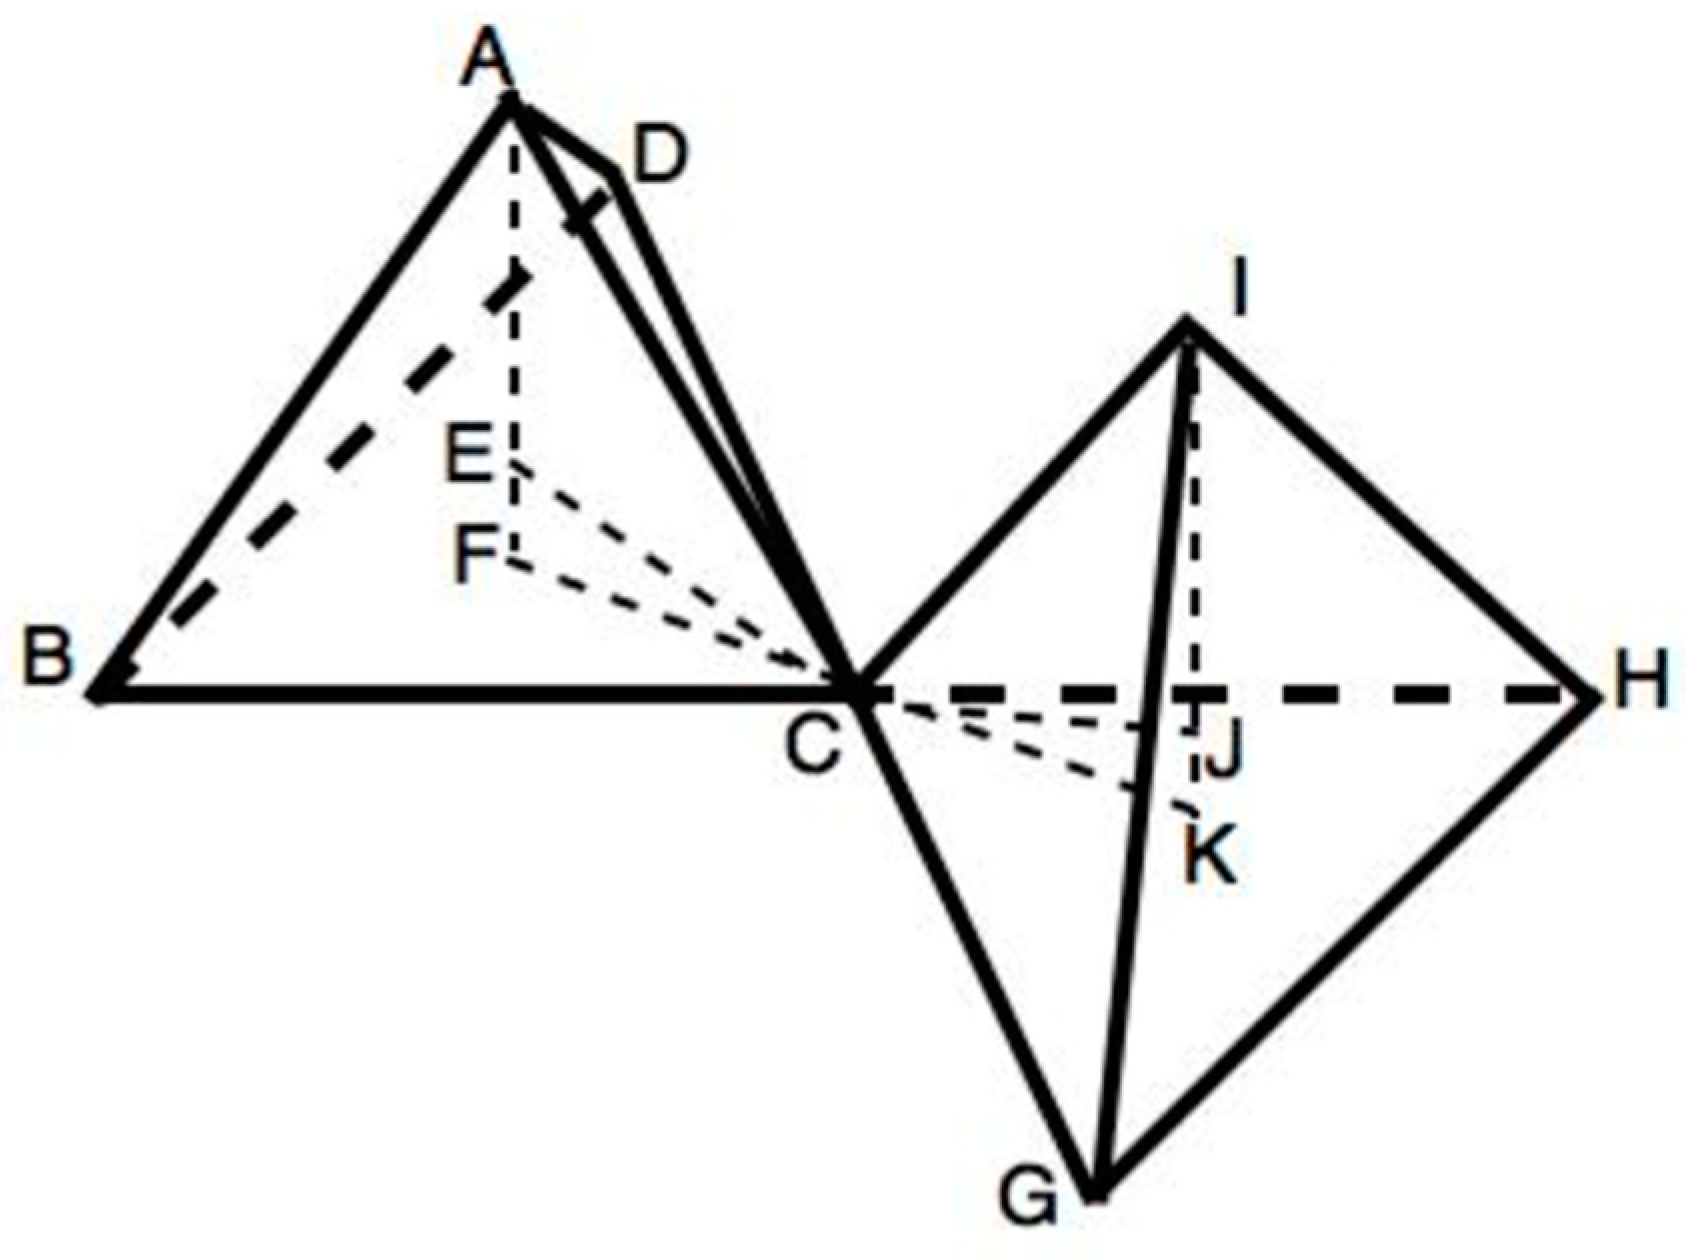
The evidence that the two-layer structure shown in Figure 6c exists in vitreous silica is the characterized distribution of the Si-O-Si bond angle determined from the famous X-ray scattering data by Warren et al. [7]. From Figure 3 and Figure 6c, the Si-O-Si bond angles in the nanoflake structures are not all the same and depend on the locations of O atoms. Obviously, the Si-O-Si bond angle related to O atoms in the central mirror plane is 180°. The bond angle related to O atoms located in the top and bottom layers can be calculated from the bond length data, 0.162 nm between Si and O and 0.265 nm between O and O in the SiO4 tetrahedron, and the geometry of the relative orientation of two corner-shared tetrahedra in the ring structures. Figure 10 shows this geometry in a 6-membered ring. Point C is the position of the O atom connecting the two SiO4 tetrahedra, points E and J are the positions of Si atoms located in the centers of the SiO4 tetrahedra, and points F and K are the intersections of the extended lines AE and IJ with the planes BCD and CGH, respectively. Since in Figure 10 points E, F, C, J, and K are located on the same plane, the Si-O-Si bond angle ∠ECJ is equal to 180° minus the angles ∠FCE and ∠JCK. Both angles ∠FCE and ∠JCK are calculated to be 19.2°; thus, the Si-O-Si bond angle is 142°. For 5- or 7-membered rings, the relative orientations of SiO4 tetrahedra are slightly different from that shown in Figure 10; the calculated Si-O-Si bond angle is 135° and 138°, respectively. Except the few O atoms located on the edges of the structure which form random Si-O-Si bond angles, the majority of O atoms are located within the layers and are not influenced by the edge effect. Since the ratio of O atoms located on the two layers to that located on the central mirror plane is 3, the most popular Si-O-Si bond angle in the structure is near 140°. The actual distribution depends on the ring distribution of the SiO4 tetrahedra, which is influenced by the annealing/cooling processes. Overall, the Si-O-Si bond angle distribution characteristics is very close to that obtained from X-ray scattering by Warren et al. They found that the Si-O-Si bond angle distribution is not symmetrical, ranging from 120° to 180° with a maximum at 144° [7]. The measured most popular Si-O-Si bond angle matches that of the stabilized two-layer structure, the nanoflakes. Therefore, the broad ring of the diffraction pattern of silica glass is generated by the nanoflakes, described by Figure 3 and Figure 6c.
4. Discussions
The above interpretation of the diffraction pattern indicates a critical temperature of 1470 °C in the silica glass transition. At this critical temperature, a one-dimension ordering structure, nanoflake, starts to form. Additionally, some physical properties, such as the thermal expansion coefficient as a function of temperature, exhibit a step change, jumping from negative to positive at the critical temperature. Such discontinuity in the thermal expansion coefficient, a second-order derivative of Gibbs energy, is the defining feature of the second-order phase transition [28,29].
Therefore, the new interpretation of the diffraction pattern of silica glass not only reveals the evolution of the glass’s internal structure but also the nature of the transition. The nature of the glass and the glass transition is a hotly debated topic for many decades. This work could provide considerable valuable information on the debate.
More than 70 years ago, Walter Kauzmann proposed his eponymous paradox, and since that time, it has remained an intriguing curiosity in understanding the nature of the glass transition [30,31,32]. Generally, the entropy of the supercooled liquid decreases more rapidly than that of the crystal. Thus, if we extrapolate the entropy of liquid smoothly below the glass-transition temperature Tg, as shown by the heavy dashed line in Figure 11a, it becomes equal to the entropy of crystal at the so-called Kauzmann temperature Tk. This is a “paradox”, because it is difficult to visualize a liquid with the same entropy as the underlying crystal. The phenomenon becomes even more overwhelming if one carries the extrapolation to a still lower temperature. The extrapolated entropy of the liquid may become negative; this would correspond to an apparent violation of the third law of thermodynamics, which is denoted as the “Kauzmann catastrophe”.
Crystallization is a typical mechanism for preventing such a paradoxical situation [30]. Kauzmann himself and several other research groups suggested that intensive crystallization takes place slightly above the Kauzmann temperature, preventing realization of such states. Thus, the entropy crisis at TK is naturally avoided by crystallization. Another mechanism is to introduce the concept of the ideal glass transition. The ideal glass has the same entropy and heat capacity as the crystal. At TK the equilibrium liquid transforms into an ideal glass, so that the paradox can be avoided. However, the existence of such an ideal glass transition itself is still a matter of debate. There are more proposed models and arguments about entropy in supercooled liquids and glasses [31,32]. The essential controversy has to do with our lack of understanding of entropy change in the glass transition process.
The structural evolution uncovered from the new interpretation of the diffraction pattern described in Section 3 can be used to analyze the entropy changes of silica in the glass transition. Based on Section 3, the entropy of silica glass as a function of the temperature may be predicted as shown in Figure 11b. In the temperature range from Tm to Tc the glass is in the super-liquid state. For a cooling process along the solid curve in Figure 11b, the sizes and numbers of the embryonic clusters increase as the temperature decreases, and this results in a lower configurational entropy for the system [14]. For a slower cooling process along the heavy dashed line in Figure 11b, more clusters form and configurational entropy of system decreases more in this high temperature region. At the critical temperature Tc, regardless the cooling rate, the clusters stop to grow, and the system starts the second-order phase transition. The continuous decrease in the configurational entropy of system in the temperature region lower than Tc is due to the formation of the nanoflakes, the one-dimensional ordering structure on the clusters’ facets. The configurational entropy reduction resulting from one-dimensional ordering structure in the low temperature region is much slower than that in the high temperature region. Thus, for all processes with various cooling rates, the entropy vs. temperature curve bends at Tc, as illustrated in Figure 11b. More detailed study indicates that the second-order phase transition of silica glass ends at the temperature near 950 °C, and the entropy function should bend once more at 950 °C [28]. Therefore, the entropy function can never cross with the underline for the crystals, and the Kauzmann catastrophe can never take place.
5. Concluding Remarks
The strong but broad ring in the diffraction pattern of vitreous silica is generated from its one-dimensional ordering structure. The structure is formed by two layers of SiO4 tetrahedra spaced 0.4 nm apart, and bonded by O atoms located in the middle. The structure is similar to that of reported two-dimensional, amorphous silica film deposited on graphene [33]. However, the size is much smaller than that of the reported film. The two-layer structure has the shape of a “nano-flake” and could be called nanoflake for convenience. Adjacent nanoflakes are not parallel, but intersect each other to form a cluster with a shape that is approximately octahedral. The clusters are about 2 nm in size and are randomly orientated and distributed in the system such that bulk isotropy is preserved. The nanoflakes start to form at the critical temperature of 1470 °C. The valuable insights obtained from the new interpretation of the diffraction pattern might provide a new approach to explain the physical properties of the glasses, such as the viscosity-temperature relation of silica glass, anomalous mechanical properties, etc. [34,35,36,37]. The new interpretation has revealed that silica glass is structurally heterogeneous in the nanoscale. It is expected that multiple component silicate glasses, which include other oxides, such as Na2O and CaO, with the silica glass network, would also be structurally heterogeneous. The prediction agrees with the modified random network (MRN) model [38]. Structural model for more complicated silicate glasses based on the medium-range ordering structure will be developed soon.
Moreover, the new interpretation appears to lead to fundamental changes in the basic concepts regarding the nature of glass transition. The vitreous silica is related to but fundamentally different from both crystal and liquid silica. The silica glass transition can be recognized as a second-order phase transition after an incomplete first-order phase transition.
Funding
This research received no external funding.
Institutional Review Board Statement
Not applicable.
Informed Consent Statement
Not applicable.
Data Availability Statement
Not applicable.
Acknowledgments
Work at the Molecular Foundry, Lawrence Berkeley Lab was supported by the Office of Science, Office of Basic Energy Sciences, of the U.S. Department of Energy under Contract No. DE-AC02-05CH11231.
Conflicts of Interest
The author declares no conflict of interest.
References
- Warren, B.E. X-ray Determination of the Structure of Glass. J. Am. Ceram. Soc. 1934, 17, 249–254. [Google Scholar] [CrossRef]
- Randall, J.T.; Rooksby, H.P.; Cooper, B.S. The Structure of Glass; The Evidence of X-ray Diffraction. J. Soc. Glas. Technol. Trans. 1930, 14, T219. [Google Scholar]
- Randall, J.T.; Rooksby, H.P.; Cooper, B.S. X-ray Diffraction and the Structure of Vitreous Solids–1. Z. Kristallogr. 1930, 75, 196–214. [Google Scholar]
- Randall, J.T. The Diffraction of X-rays and Electrons by Amorphous Solids, Liquids, and Gases; Chapman & Hall, Ltd.: London, UK, 1934. [Google Scholar]
- Warren, B.E.; Biscoe, J. The Structure of Silica Glass by X-ray Diffraction Studies. J. Am. Ceram. Soc. 1938, 2, 49–54. [Google Scholar] [CrossRef]
- Warren, B.E. X-ray Determination of the Structure of Liquids and Glass. J. Appl. Phys. 1937, 8, 645–654. [Google Scholar] [CrossRef]
- Mozzi, R.L.; Warren, B.E. The Structure of Vitreous Silica. J. Appl. Cryst. 1969, 2, 164–172. [Google Scholar] [CrossRef]
- Zachariasen, W.H. The Atomic Arrangement in Glass. J. Am. Chem. Soc. 1932, 54, 3841–3851. [Google Scholar] [CrossRef]
- Wright, A.C. The Great Crystallite Versus Random Network Controversy: A Personal Perspective. Int. J. Appl. Glass Sci. 2014, 5, 31–56. [Google Scholar] [CrossRef]
- Porai-koshits, E.A. Genesis of Concepts on Structure of Inorganic Glasses. J. Non-Cryst. Solids 1990, 123, 1–13. [Google Scholar] [CrossRef]
- Gaskell, P.H. Medium-range structure in glasses and low-Q structure in neutron and X-ray scattering data. J. Non Cryst. Solids 2005, 351, 1003–1013. [Google Scholar] [CrossRef]
- Zarzycki, J. Glass Structure. J. Non-Cryst. Solids 1982, 52, 31–43. [Google Scholar] [CrossRef]
- Gutzow, I.S.; Schmelzer, J.W.P. The Vitreous State, 2nd ed.; Springer: Berlin/Heidelberg, Germany, 2013. [Google Scholar]
- Varsheneya, A.K.; Mauro, J.C. Fundamentals of Inorganic Glasses, 3rd ed.; Elsevier Inc.: Amsterdam, The Netherlands, 2019. [Google Scholar]
- Cheng, S. A nanoflake model for the medium range structure in vitreous silica. Phys. Chem. Glasses: Eur. J. Glass Sci. Technol. B 2017, 58, 33–40. [Google Scholar]
- Wright, A.C. The Cheng nanoflake model for the structure of vitreous silica: A critical appraisal. Phys. Chem. Glasses Eur. J. Glass Sci. Technol. B 2017, 58, 226–228. [Google Scholar] [CrossRef]
- Cheng, S. Comments on The Cheng nanoflake model for the structure of vitreous silica: A critical appraisal. Phys. Chem. Glasses Eur. J. Glass Sci. Technol. B 2018, 59, 114–117. [Google Scholar] [CrossRef]
- Wright, A.C. Further Comments on the Cheng nano-flake Model for the Structure of Vitreous Silica. Phys. Chem. Glasses Eur. J. Glass Sci. Technol. B 2018, 59, 251–252. [Google Scholar] [CrossRef]
- Cheng, S. Response to the letter ‘Further comments on the Cheng nano-flake model for the structure of vitreous silica’. Phys. Chem. Glasses Eur. J. Glass Sci. Technol. B 2019, 60, 125–127. [Google Scholar] [CrossRef]
- Uhlmann, D.R. A Kinetic Treatment of Glass Formation. J. Non Cryst. Solids 1972, 7, 337–348. [Google Scholar] [CrossRef]
- The Mineral Cristobalite. Available online: http://www.galleries.com/cristobalite (accessed on 29 January 2021).
- Cheng, S.; Schiefelbein, S.; Moore, L.L.; Pierson-Stull, M.; Sen, S.; Smith, C. Use of EELS to Study the Absorption Edge of Fused Silica. J. Non-Cryst. Solids 2006, 352, 3140–3146. [Google Scholar] [CrossRef]
- Cheng, S. The Measurements of Frozen-in Disorder and Thermal Disorder of Fused Silica by EELS. Phys. Chem. Glasses Eur. J. Glass Sci. Technol. B 2009, 50, 329–331. [Google Scholar]
- Hlavac, J. The Technology of Glass and Ceramics: An Introduction; Elsevier Scientific Publishing Company: Amsterdam, The Netherlands, 1983; p. 12. [Google Scholar]
- Skinner, L.B.; Benmore, C.J.; Weber, J.K.R.; Wilding, M.C.; Tumber, S.K.; Parise, J.B. A time resolved high energy X-ray diffraction study of cooling liquid SiO2. Phys. Chem. Chem. Phys. 2013, 15, 8566–8572. [Google Scholar] [CrossRef]
- Bruckner, R. Properties and structure of vitreous silica I. J. Non-Cryst. Solids 1970, 5, 123–175. [Google Scholar] [CrossRef]
- Krivanek, O.L.; Gaskell, P.H.; Howie, A. Seeing Order in Amorphous Materials. Nature 1976, 262, 454–457. [Google Scholar] [CrossRef]
- Cheng, S. Medium Range Ordering Structure and Silica Glass Transition. Glass Phys. Chem. 2019, 45, 91–97. [Google Scholar] [CrossRef]
- Kalogeras, I.M.; Lobland, H.H. The nature of the glassy state: Structure and glass transitions. J. Mater. Educ. 2012, 34, 69–94. [Google Scholar]
- Kauzmann, W. The Nature of the Glass and the Behavior of Liquids at Low Temperature. Chem. Rev. 1948, 43, 219. [Google Scholar] [CrossRef]
- Stillinger, F.H.; Debenedetti, P.G.; Truskett, T.M. The Kauzmann Paradox Revisited. J. Phys. Chem. B 2001, 105, 11809–11816. [Google Scholar] [CrossRef]
- Schmelzer, J.P.; Abyzov, A.S.; Fokin, V.M.; Schick, C. Kauzmann Paradox and the crystallization of glass-forming Melts. J. Non-Cryst. Solids 2018, 501, 21–35. [Google Scholar] [CrossRef]
- Huang, P.Y.; Kurasch, S.; Srivastava, A.; Skakalova, V.; Kotakoski, J.; Krasheninnikov, A.V.; Hovden, R.; Mao, Q.; Meyer, J.C.; Smet, J.; et al. Direct imaging of two-dimensional silica glass on graphene. Nano Lett. 2012, 12, 1081–1086. [Google Scholar] [CrossRef] [PubMed]
- Ojovan, M.I.; Lee, W.I. Viscosity of network liquids within Doremus approach. J. Appl. Phys. 2004, 95, 3803–3810. [Google Scholar] [CrossRef]
- Yue, Y. Anomalous enthalpy relaxation in vitreous silica. Front. Mater. 2015, 2, 54. [Google Scholar] [CrossRef] [Green Version]
- Cheng, S. Viscosity-temperature Relation Based on the Evolution of Medium-range Structure of Silica. J. Non-Cryst. Solids 2021, 557, 120582. [Google Scholar] [CrossRef]
- Cheng, S.; Song, C.; Ercius, P. Electron Energy Loss Spectra from Silica Glass Optical Fibers. J. Am Ceram Soc. 2020, 103, 4983–4988. [Google Scholar] [CrossRef]
- Greaves, G.N. EXAFS and the structure of glass. J. Non-Cryst. Solids 1985, 71, 203–217. [Google Scholar] [CrossRef]
Figure 1.
X-ray diffraction patterns. (a) Vitreous silica, (b) β-cristobalite. Reproduced from [1].
Figure 1.
X-ray diffraction patterns. (a) Vitreous silica, (b) β-cristobalite. Reproduced from [1].

Figure 2.
The microphotometer curves of the diffraction patterns for (a) cristobalite (b) simulated profile of vitreous silica (c) observed profile of vitreous silica. Reproduced from [2].
Figure 2.
The microphotometer curves of the diffraction patterns for (a) cristobalite (b) simulated profile of vitreous silica (c) observed profile of vitreous silica. Reproduced from [2].

Figure 3.
Two-dimensional schematic diagram of the atomic structure of silica glass by Zachariasen’s CRN theory. Reproduced from [8].
Figure 3.
Two-dimensional schematic diagram of the atomic structure of silica glass by Zachariasen’s CRN theory. Reproduced from [8].

Figure 4.
The schematic illustration of a time-temperature-transformation curve.

Figure 5.
Schematic figure of octahedral and isometric β-cristobalite crystal.

Figure 6.
Two-layer structures (a) Side view from the [−110] direction of a β-cristobalite crystal. (b) Top view from [111] direction of a β-cristobalite crystal. (c) Side view of the nanoflakes.
Figure 6.
Two-layer structures (a) Side view from the [−110] direction of a β-cristobalite crystal. (b) Top view from [111] direction of a β-cristobalite crystal. (c) Side view of the nanoflakes.

Figure 7.
Experimental data associated with FSDP in the structure factor Sx(Q) of silica. FWHM, Area, Height and Position of FSDP are plotted as function of temperature in (a–d), respectively. There are three data sets corresponding to three different setups on different samples. The inset (e) shows the results of Lorentzian peak fits the FSDP in Sx(Q). Reproduced from [25].

Figure 8.
(a) The specific volume of vitreous silica and (b) the thermal expansion coefficient of vitreous silica as function of temperature.
Figure 8.
(a) The specific volume of vitreous silica and (b) the thermal expansion coefficient of vitreous silica as function of temperature.

Figure 9.
TEM image of vitreous silica specimen. There are nearly parallel fringes about 1 to 2 nm long spread over the image. The spacing of these fringes is about 0.4 nm.
Figure 9.
TEM image of vitreous silica specimen. There are nearly parallel fringes about 1 to 2 nm long spread over the image. The spacing of these fringes is about 0.4 nm.

Figure 10.
Geometry and relative orientation of two corner-shared tetrahedra in a 6-membered ring of SiO4 tetrahedra located in a nanoflake.
Figure 10.
Geometry and relative orientation of two corner-shared tetrahedra in a 6-membered ring of SiO4 tetrahedra located in a nanoflake.

Figure 11.
The entropy-temperature relation in the glass transition. (a) Illustrating the Kauzmann “paradox”, at temperature Tk the liquid and underlying crystal have the same entropy. (b) Based on the new interpretation of diffraction pattern of silica glass, the entropy function bent at the critical temperature, and the Kauzmann catastrophe will never happened.

Publisher’s Note: MDPI stays neutral with regard to jurisdictional claims in published maps and institutional affiliations. |
© 2021 by the author. Licensee MDPI, Basel, Switzerland. This article is an open access article distributed under the terms and conditions of the Creative Commons Attribution (CC BY) license (http://creativecommons.org/licenses/by/4.0/).
Share and Cite
MDPI and ACS Style
Cheng, S. New Interpretation of X-ray Diffraction Pattern of Vitreous Silica. Ceramics 2021, 4, 83-96. https://doi.org/10.3390/ceramics4010008
AMA Style
Cheng S. New Interpretation of X-ray Diffraction Pattern of Vitreous Silica. Ceramics. 2021; 4(1):83-96. https://doi.org/10.3390/ceramics4010008
Chicago/Turabian StyleCheng, Shangcong. 2021. "New Interpretation of X-ray Diffraction Pattern of Vitreous Silica" Ceramics 4, no. 1: 83-96. https://doi.org/10.3390/ceramics4010008