On the Enlargement of the Emission Spectra from the 4I13/2 Level of Er3+ in Silica-Based Optical Fibers through Lanthanum or Magnesium Co-Doping


Abstract
:
1. Introduction
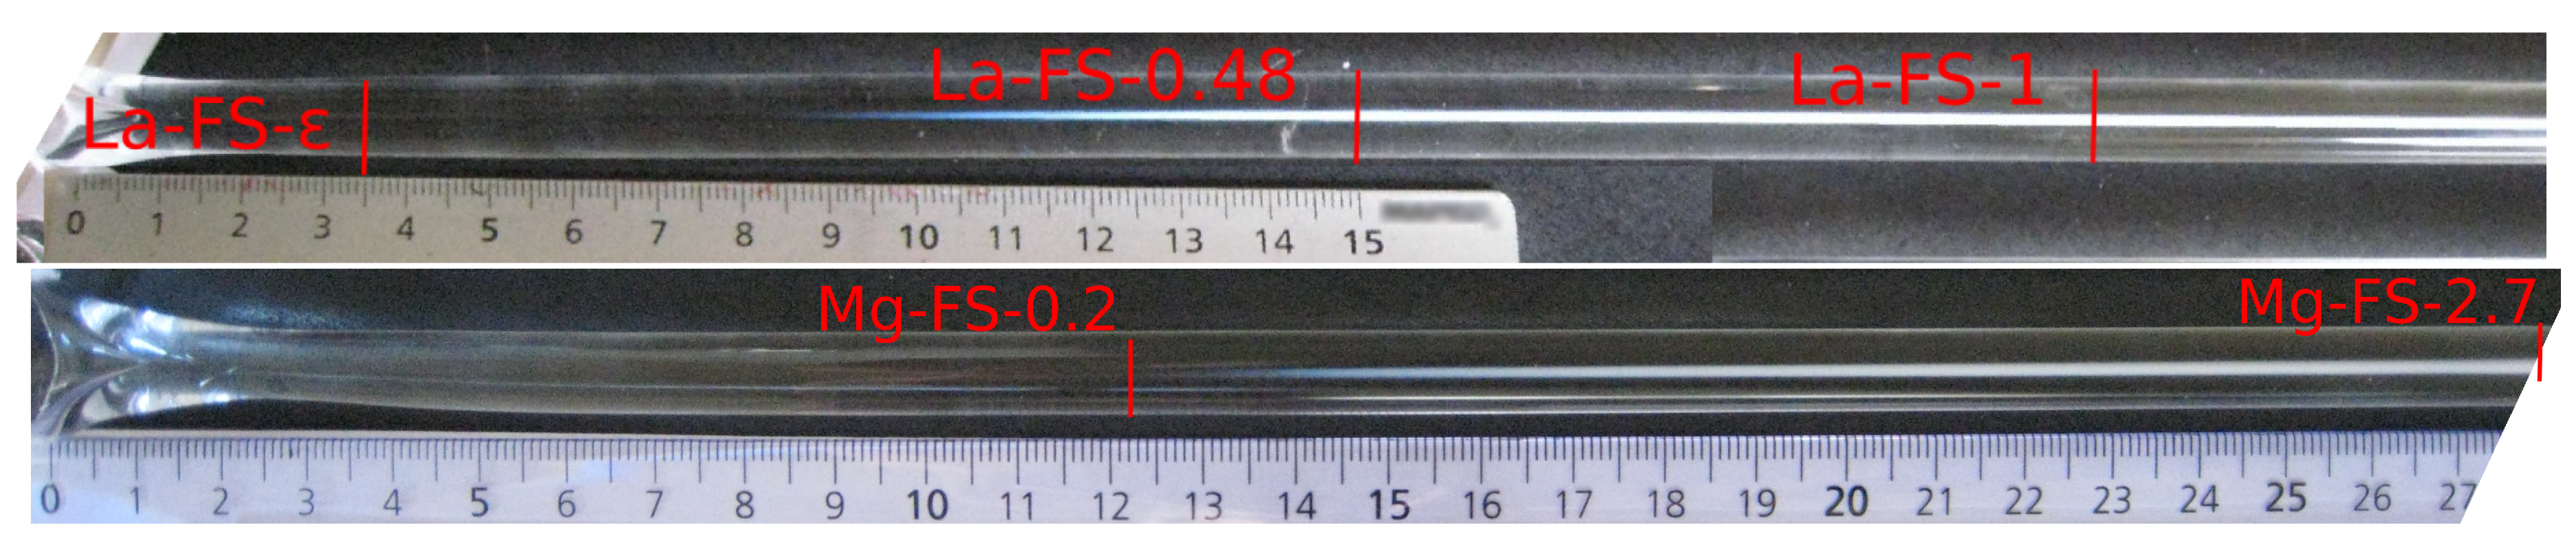
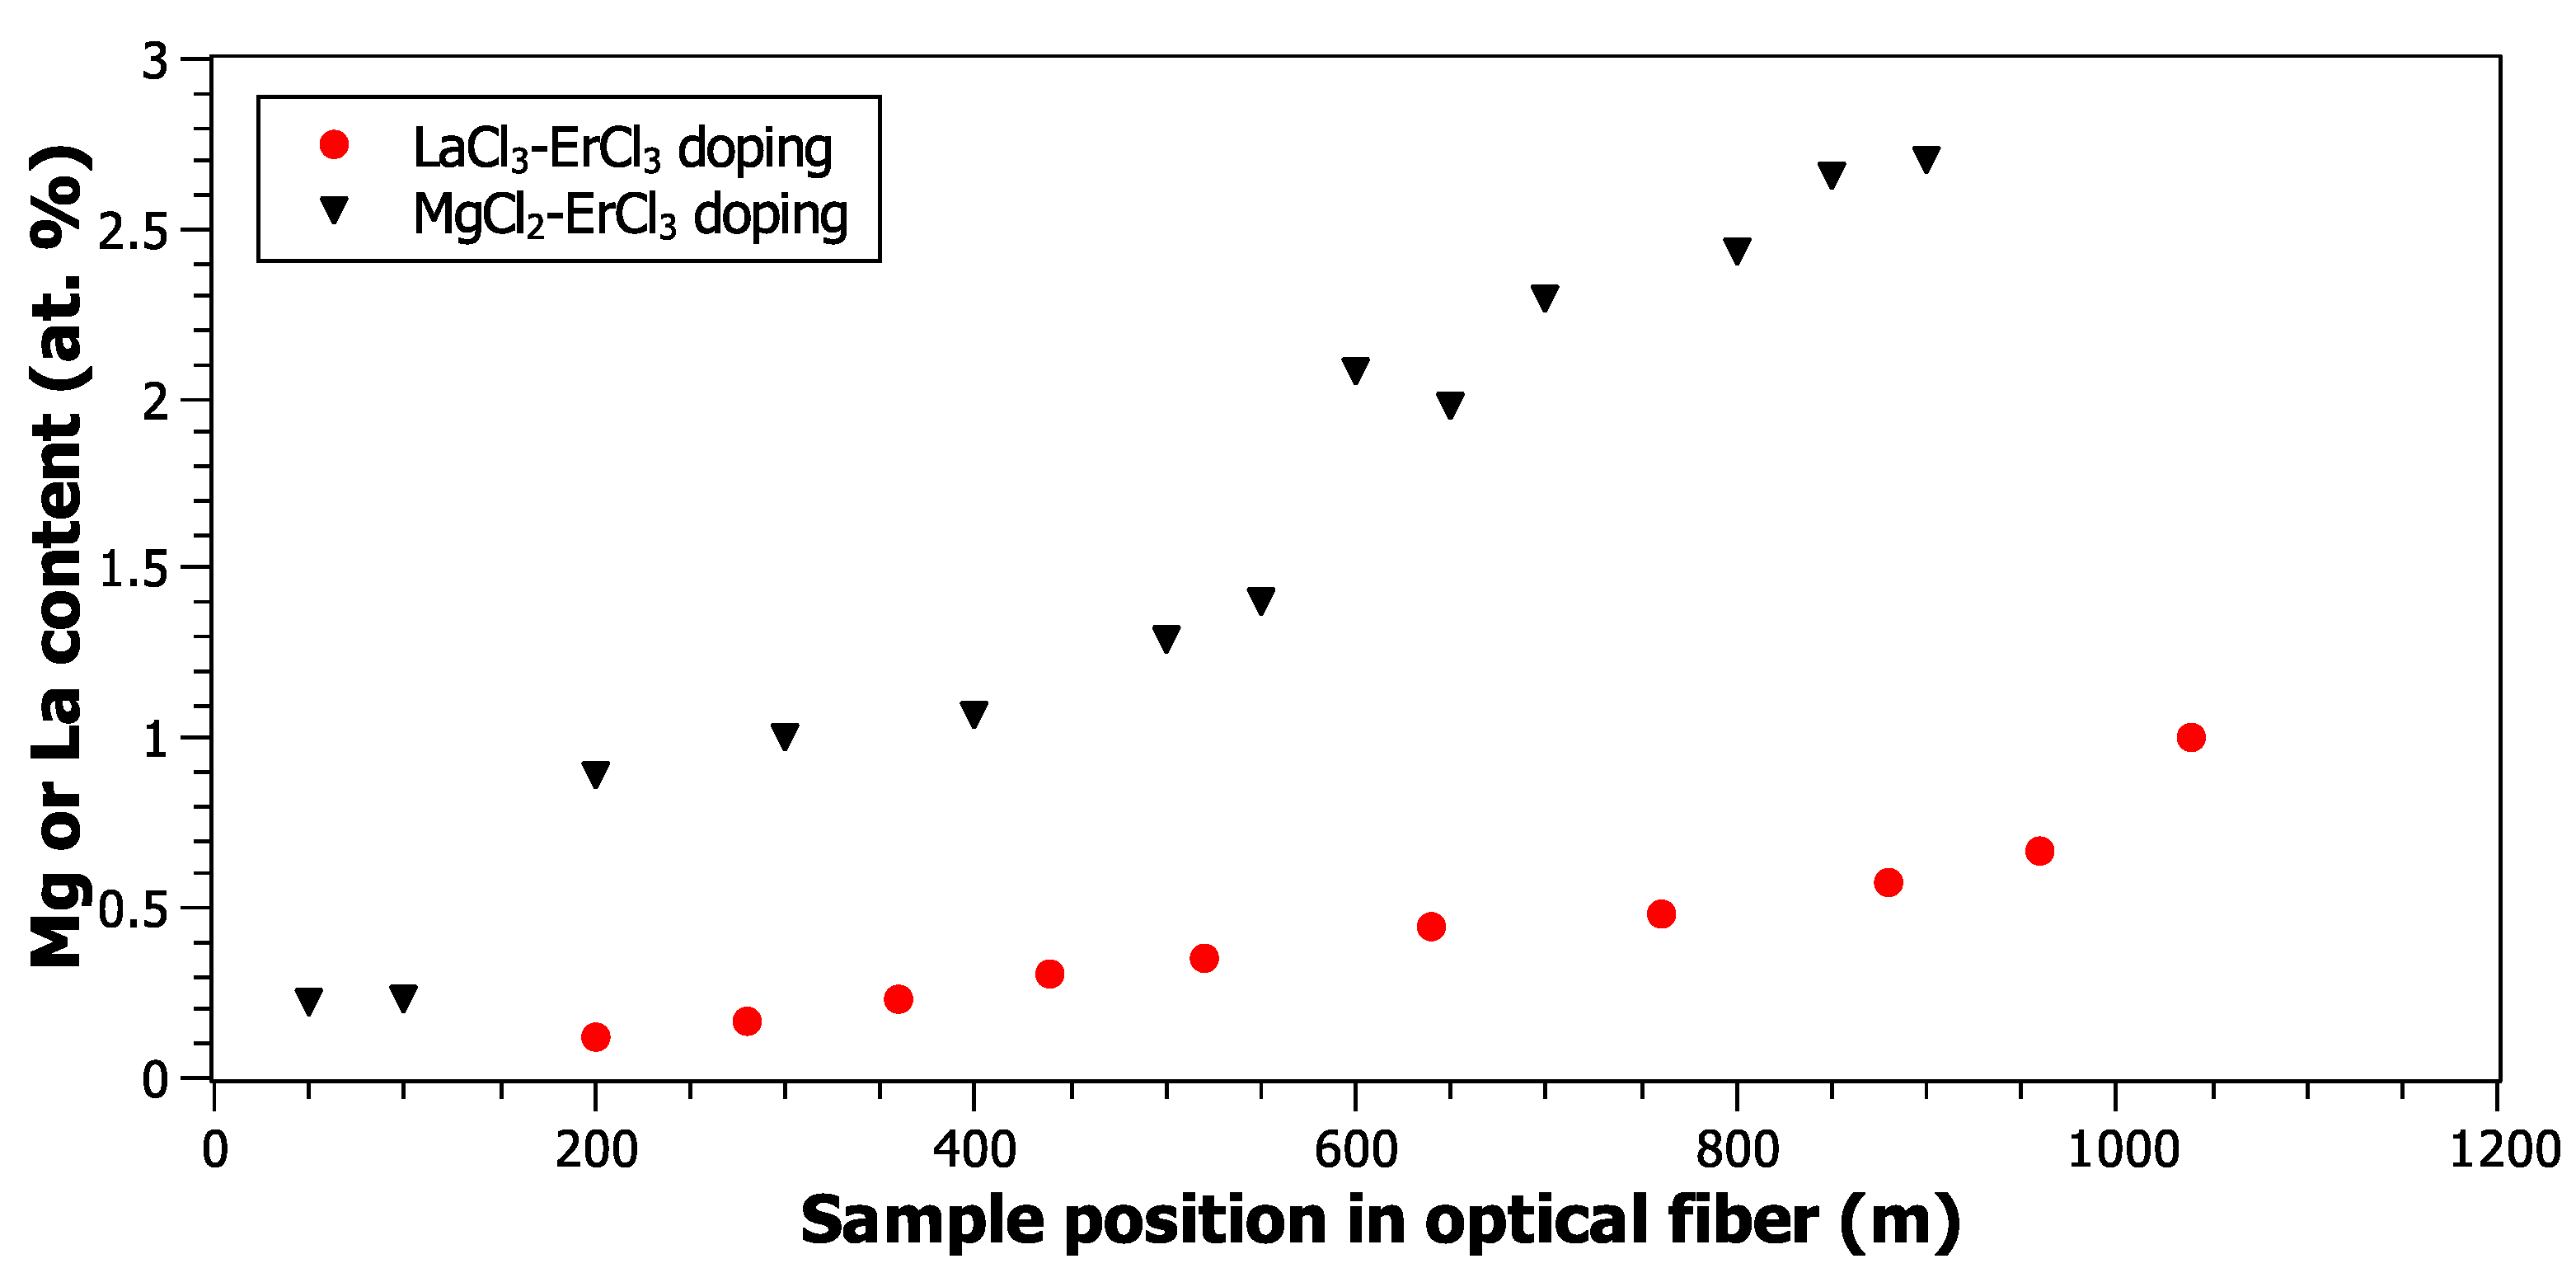
2. Experimental
3. Results and Discussions
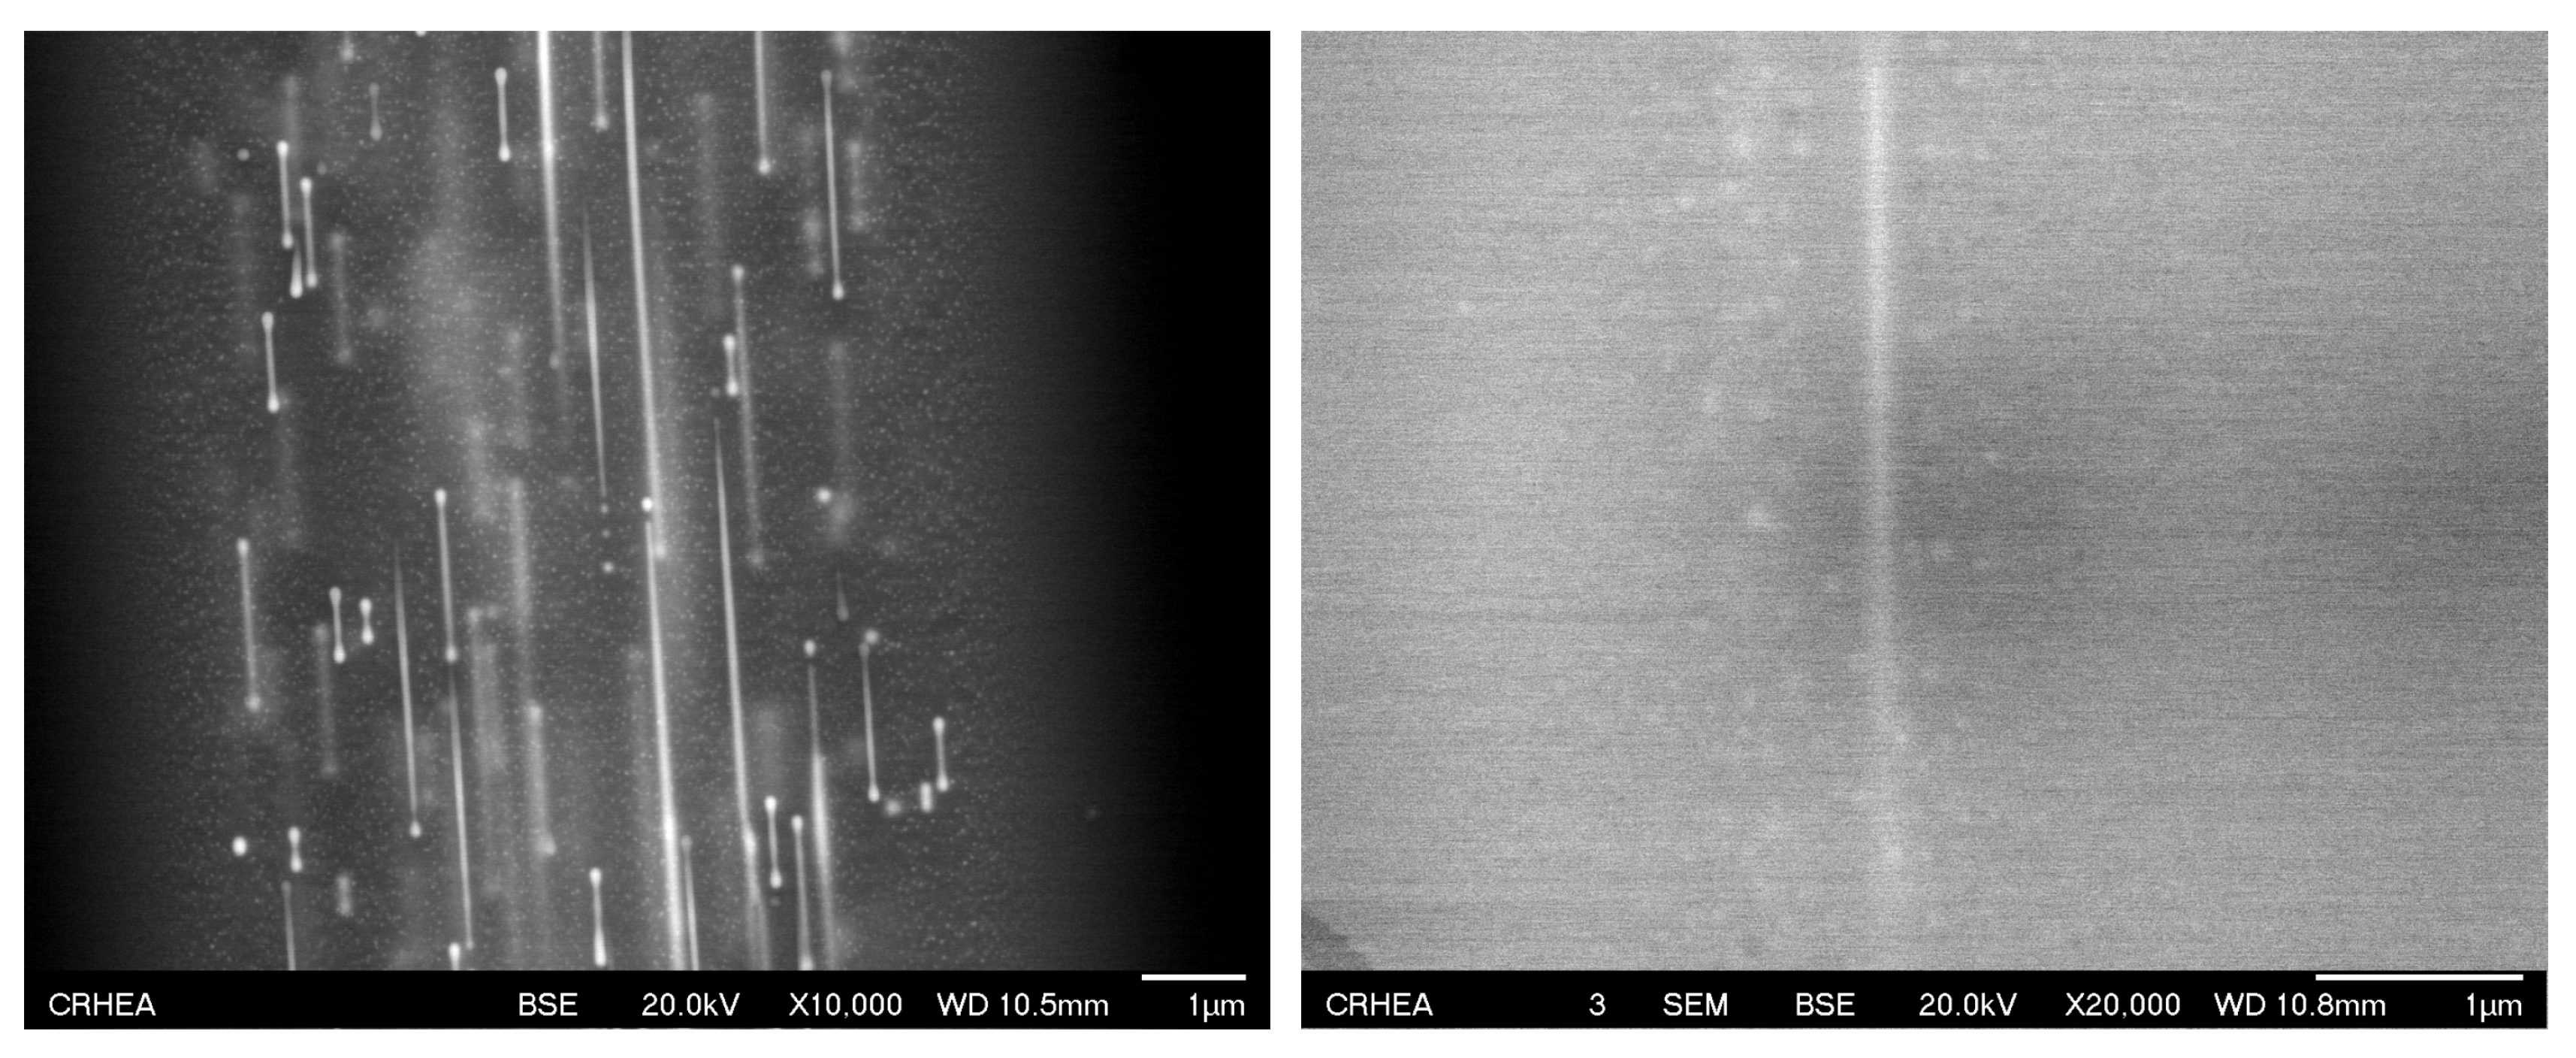
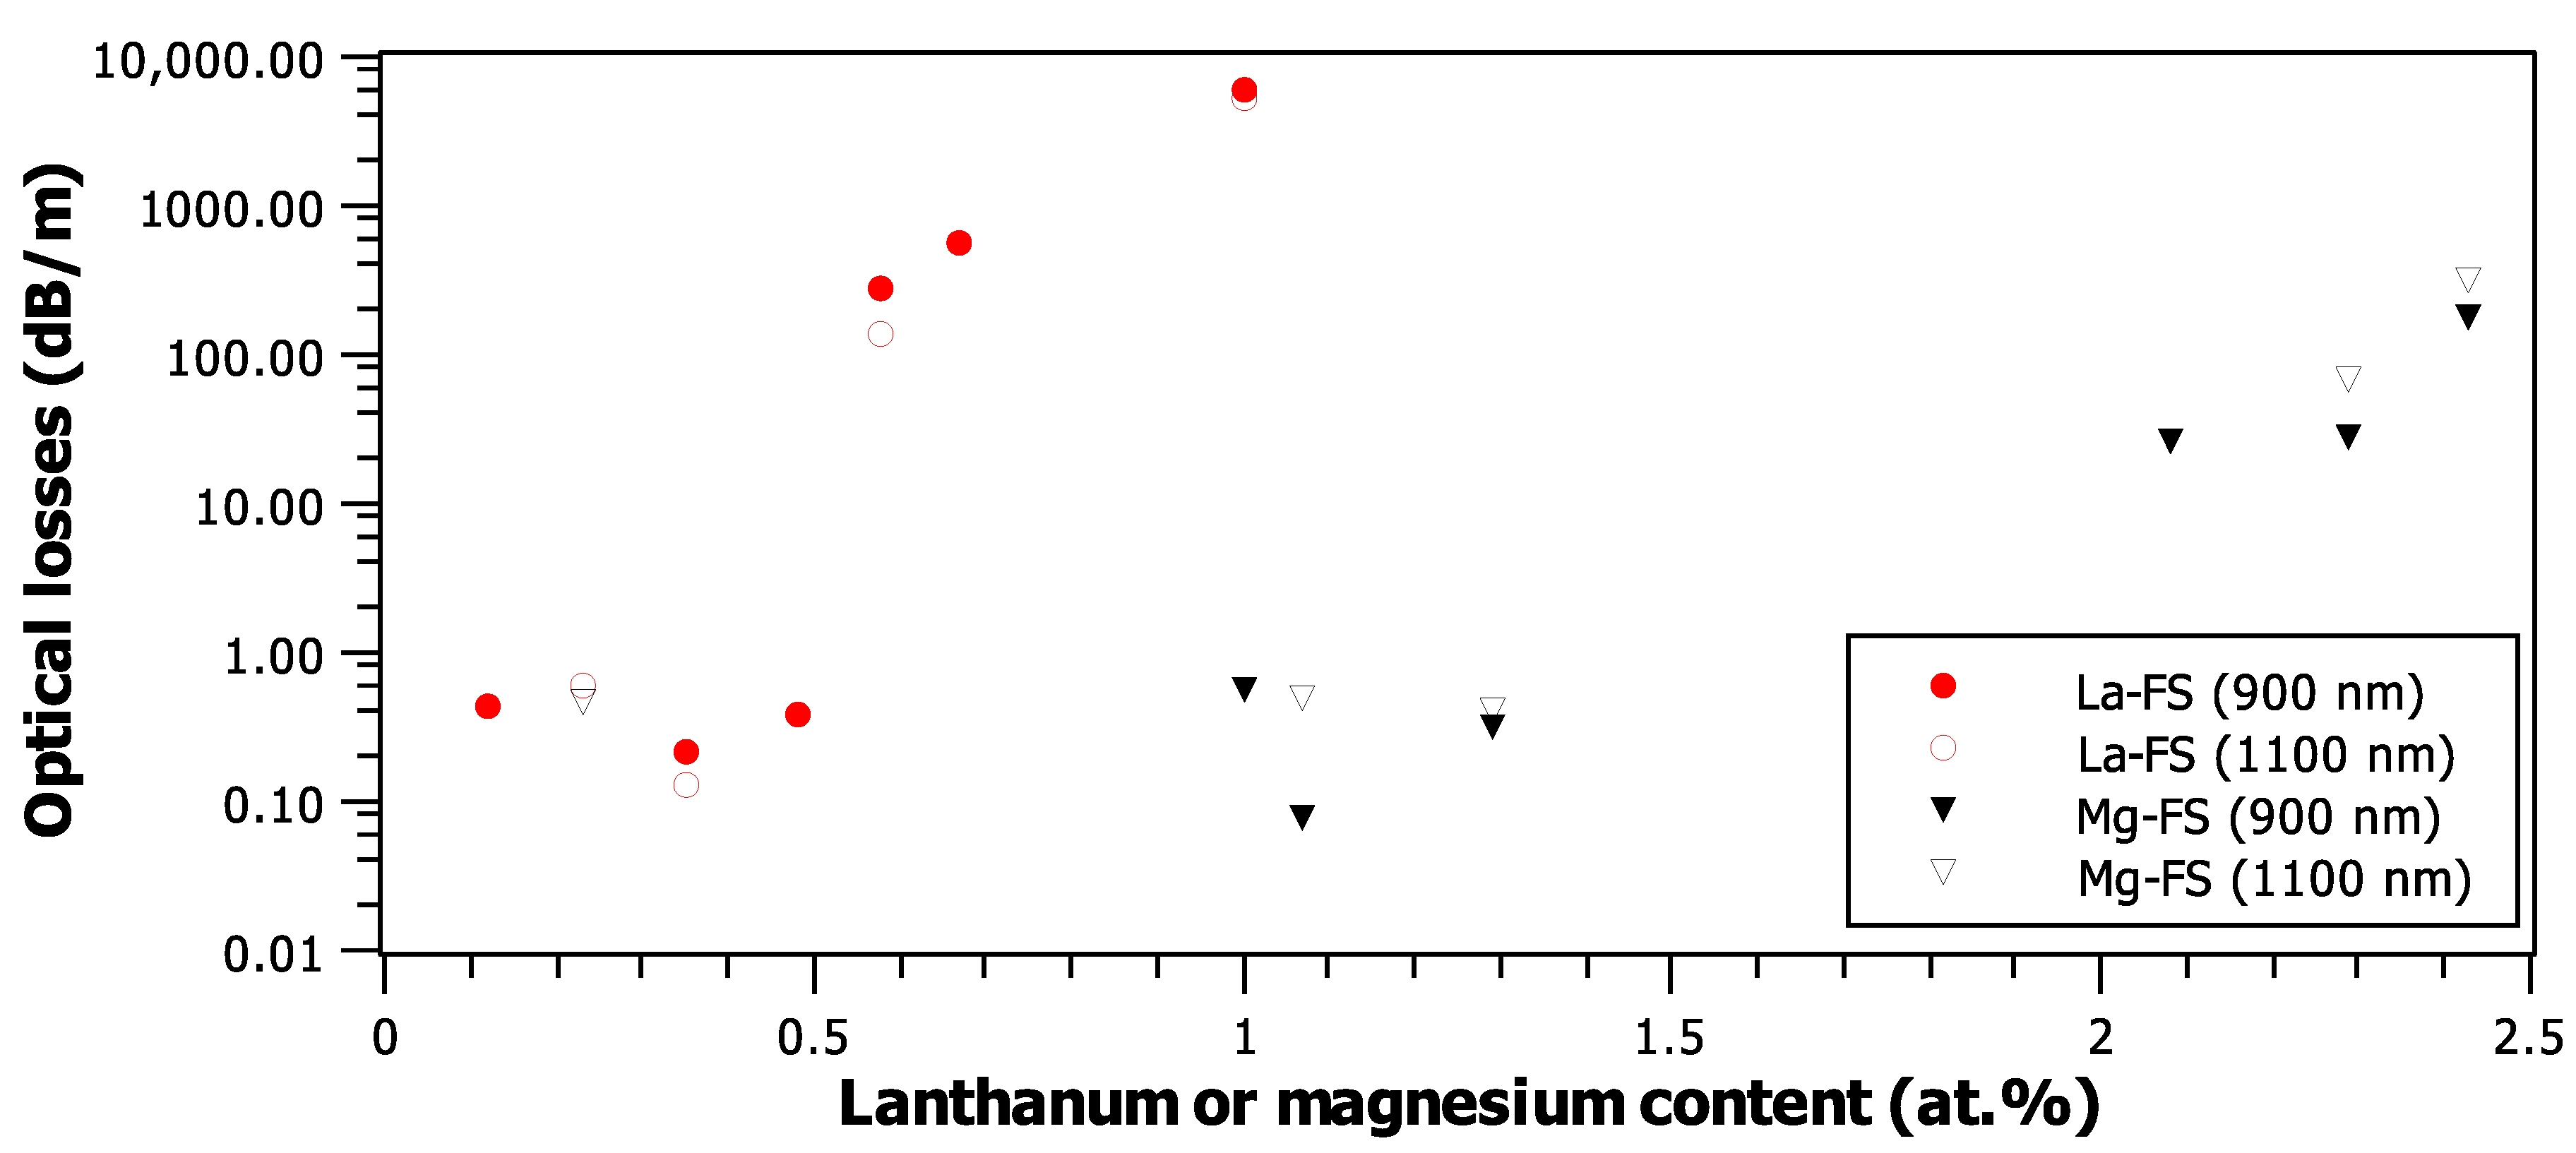
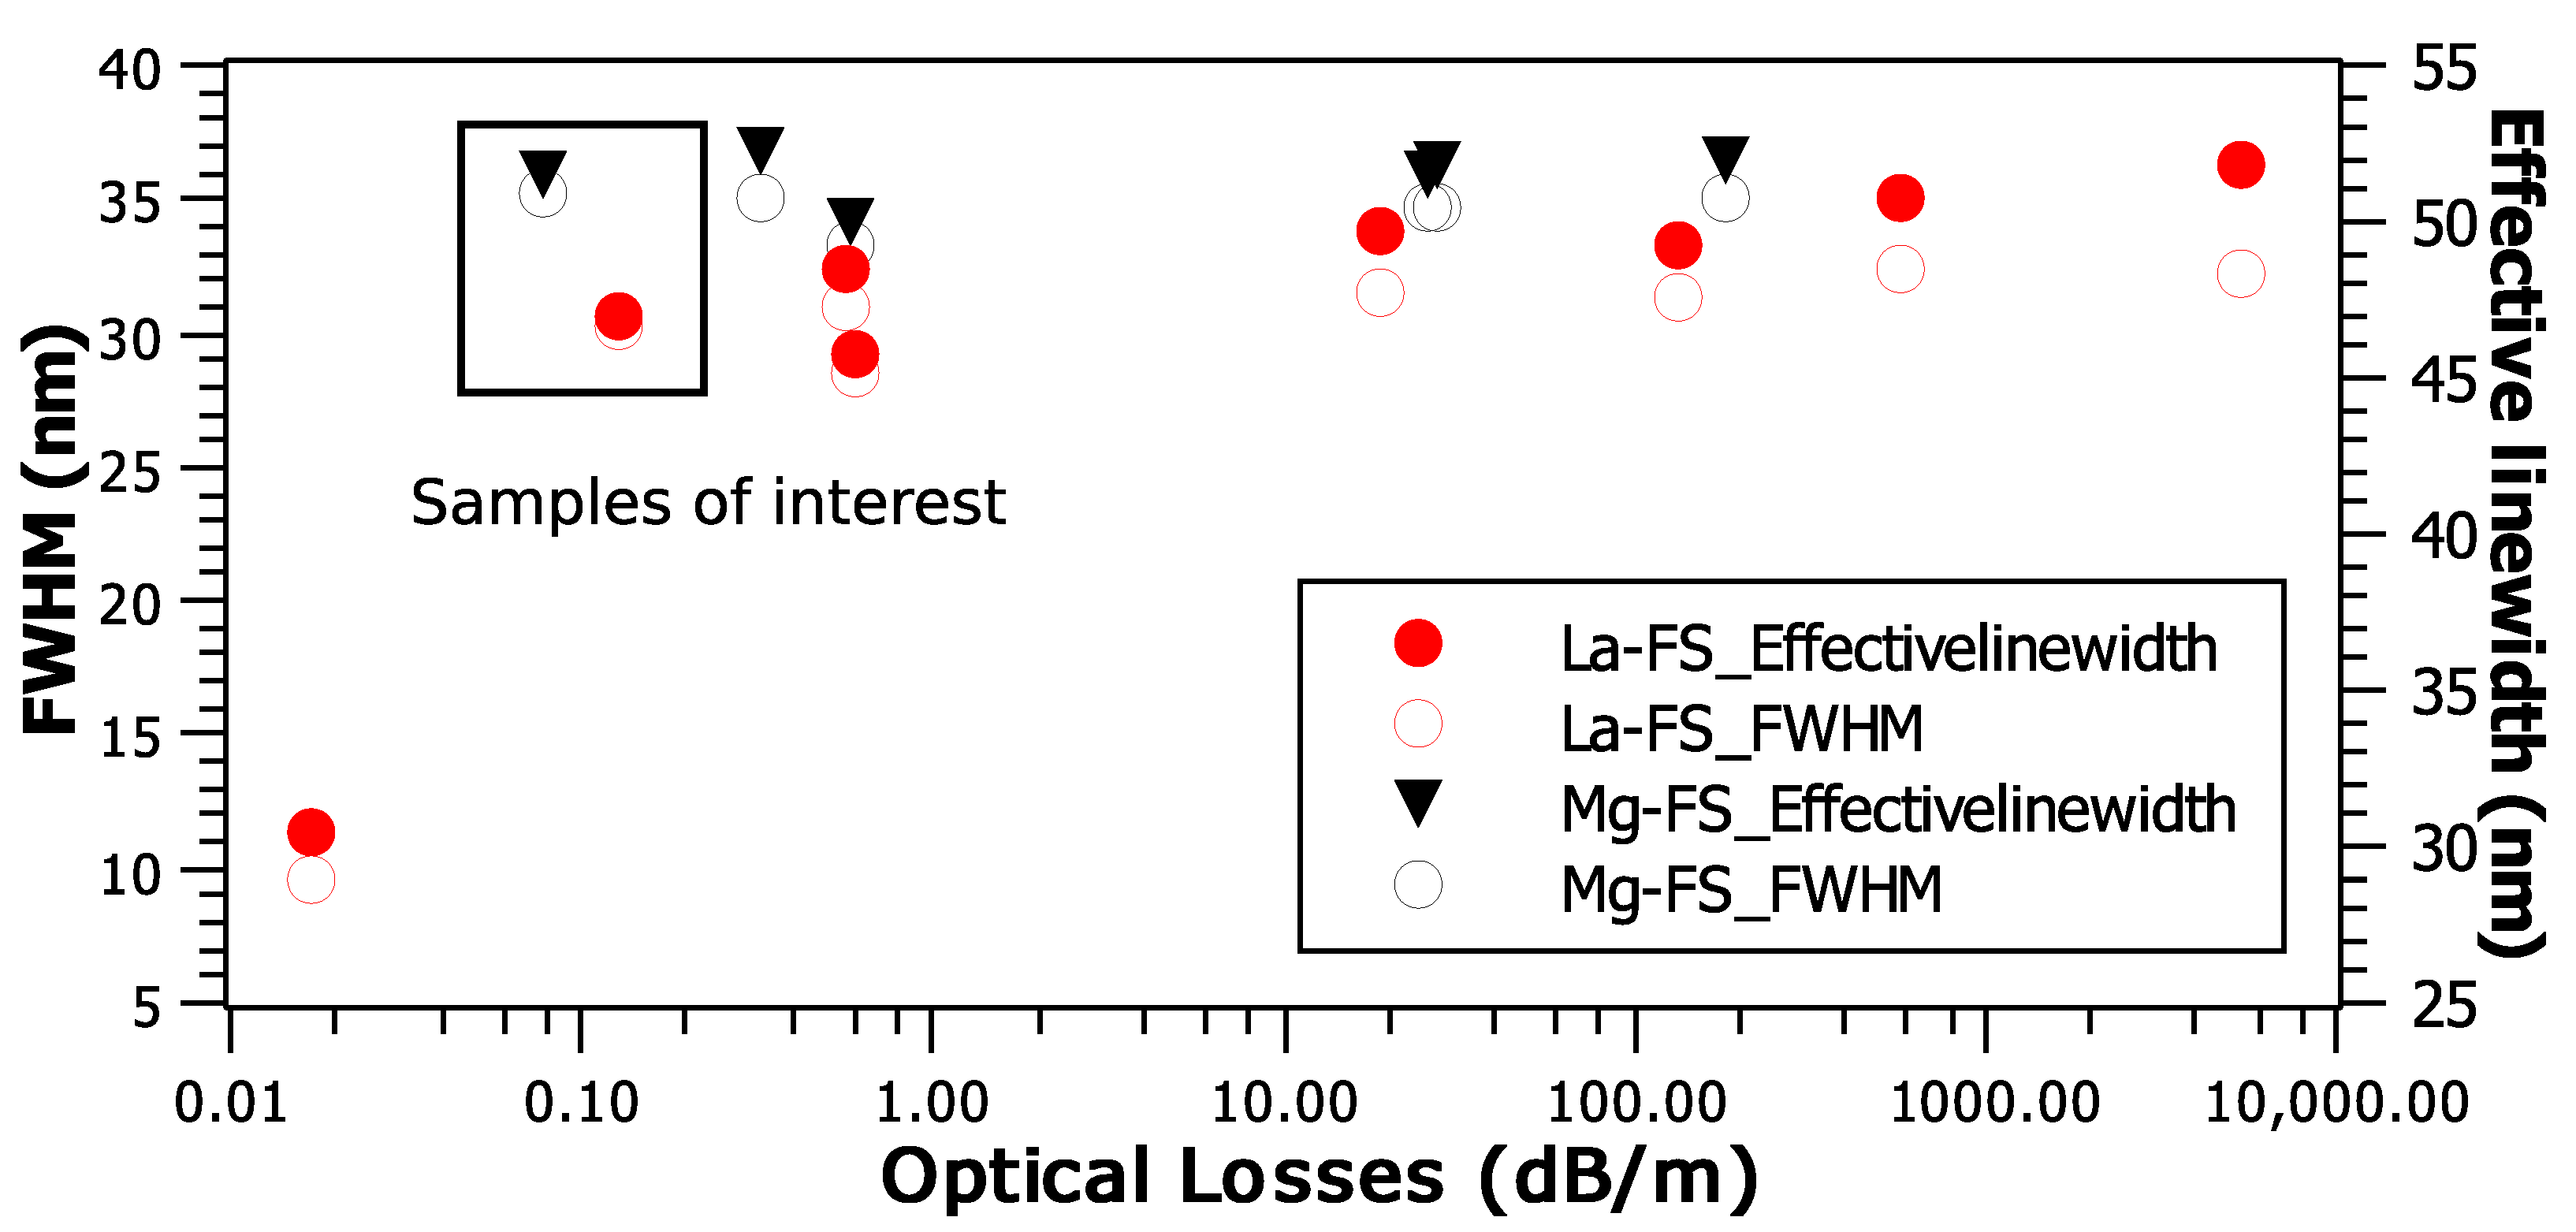
3.1. Optical Losses
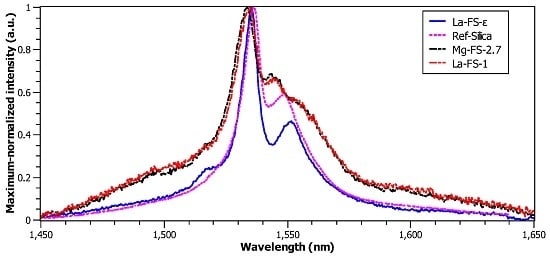
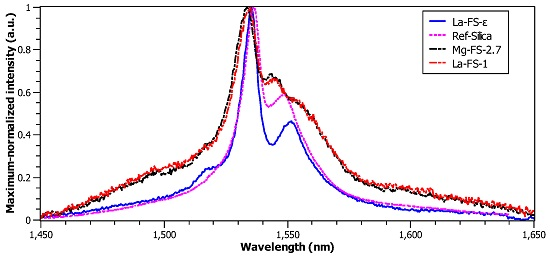
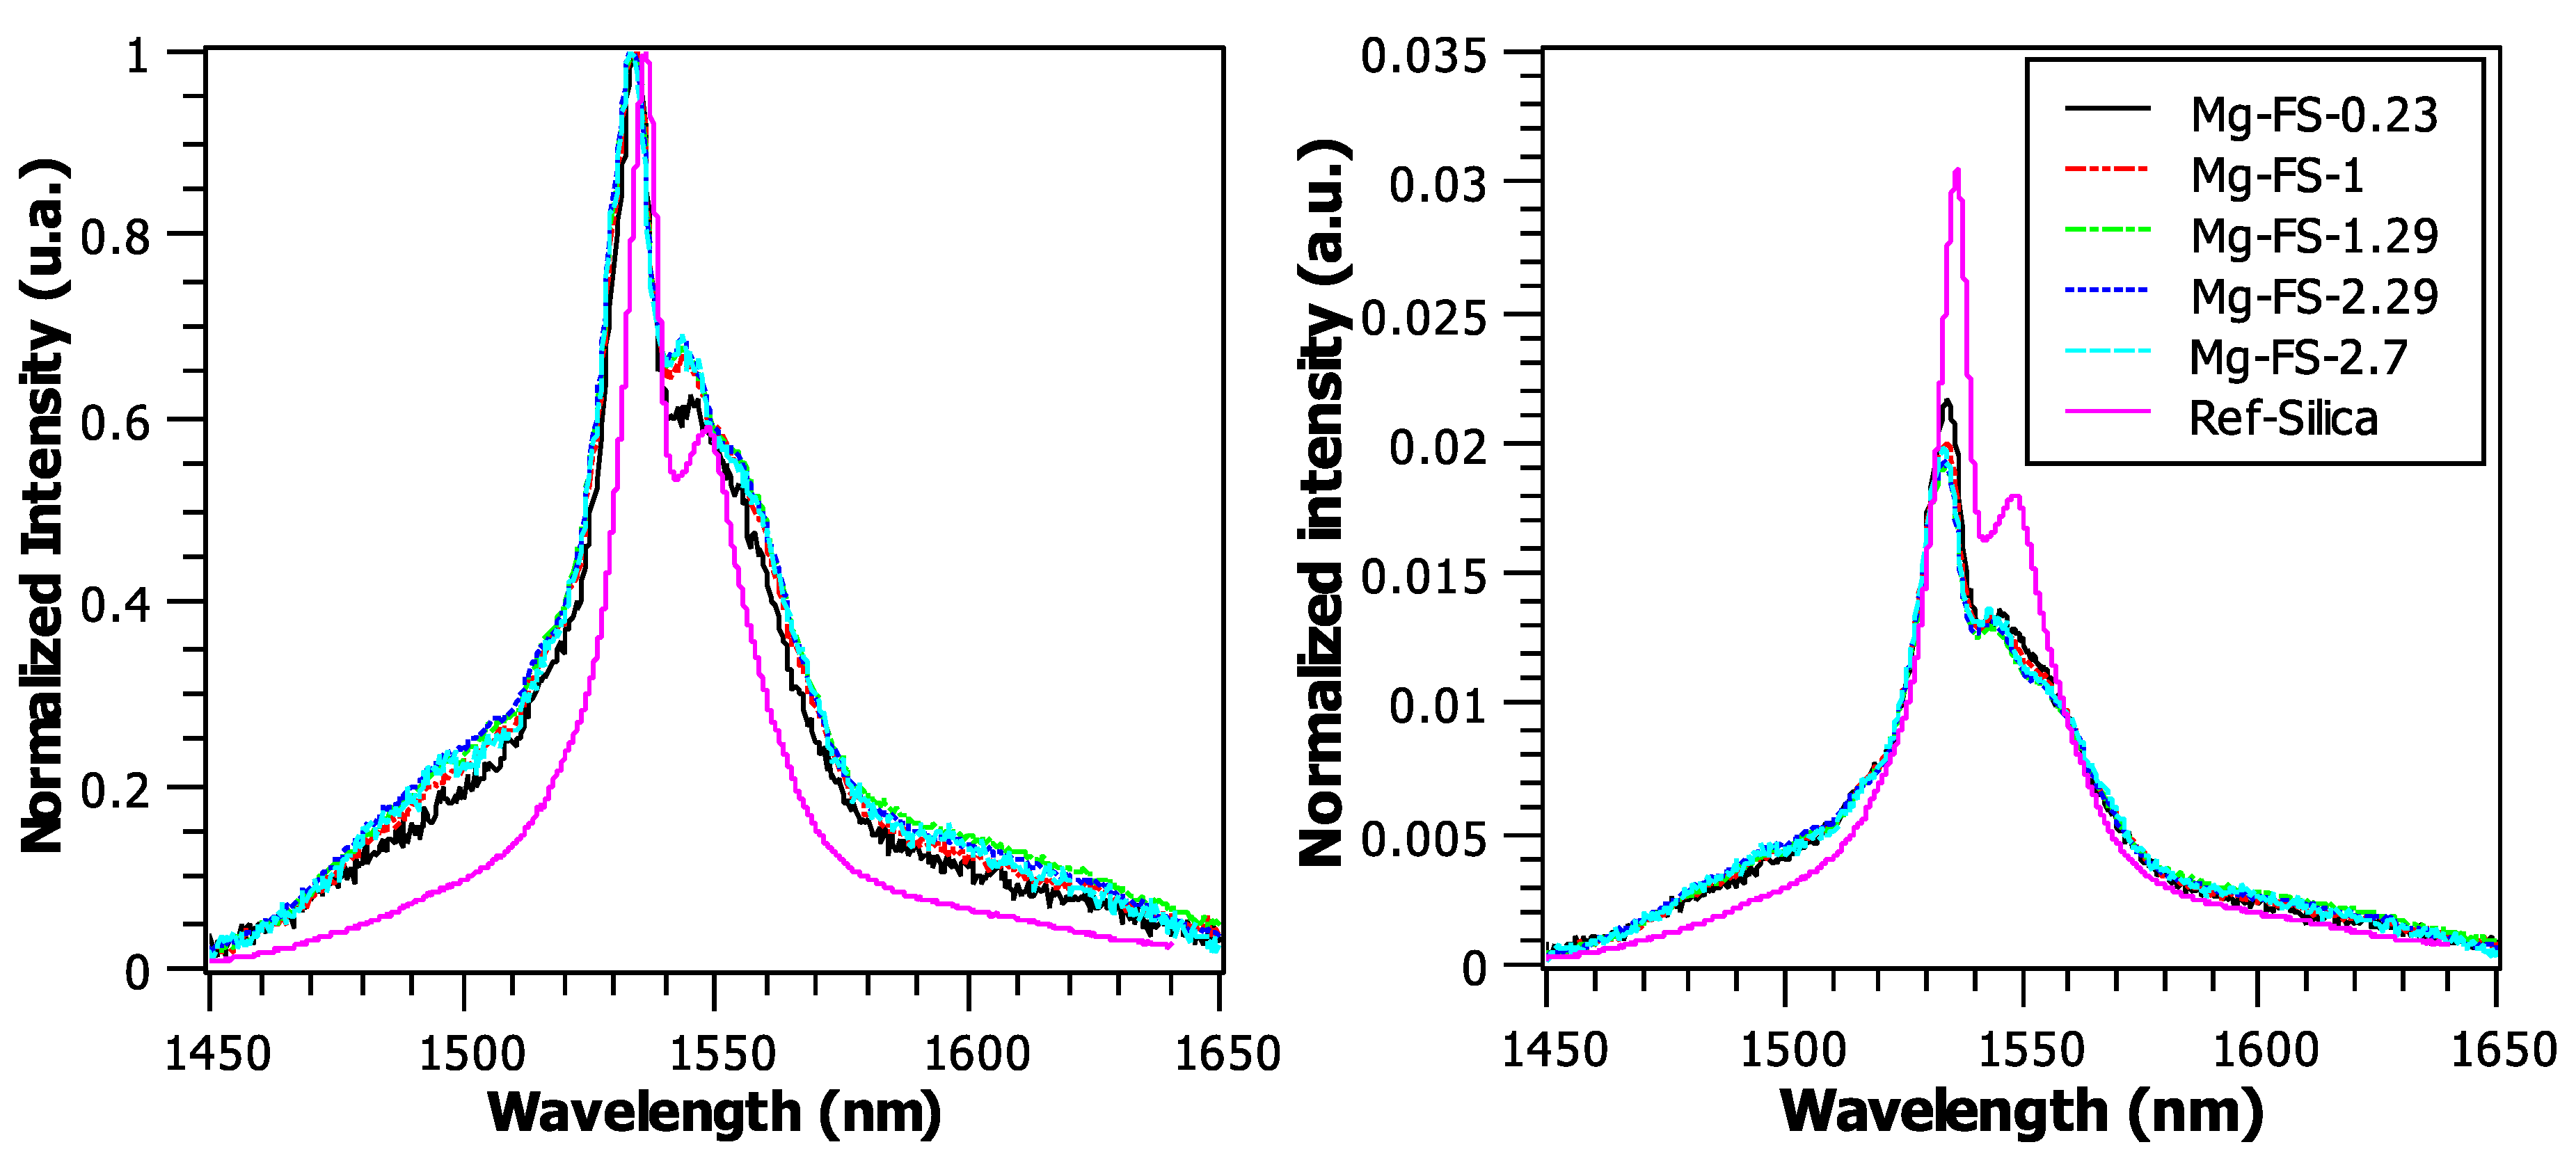
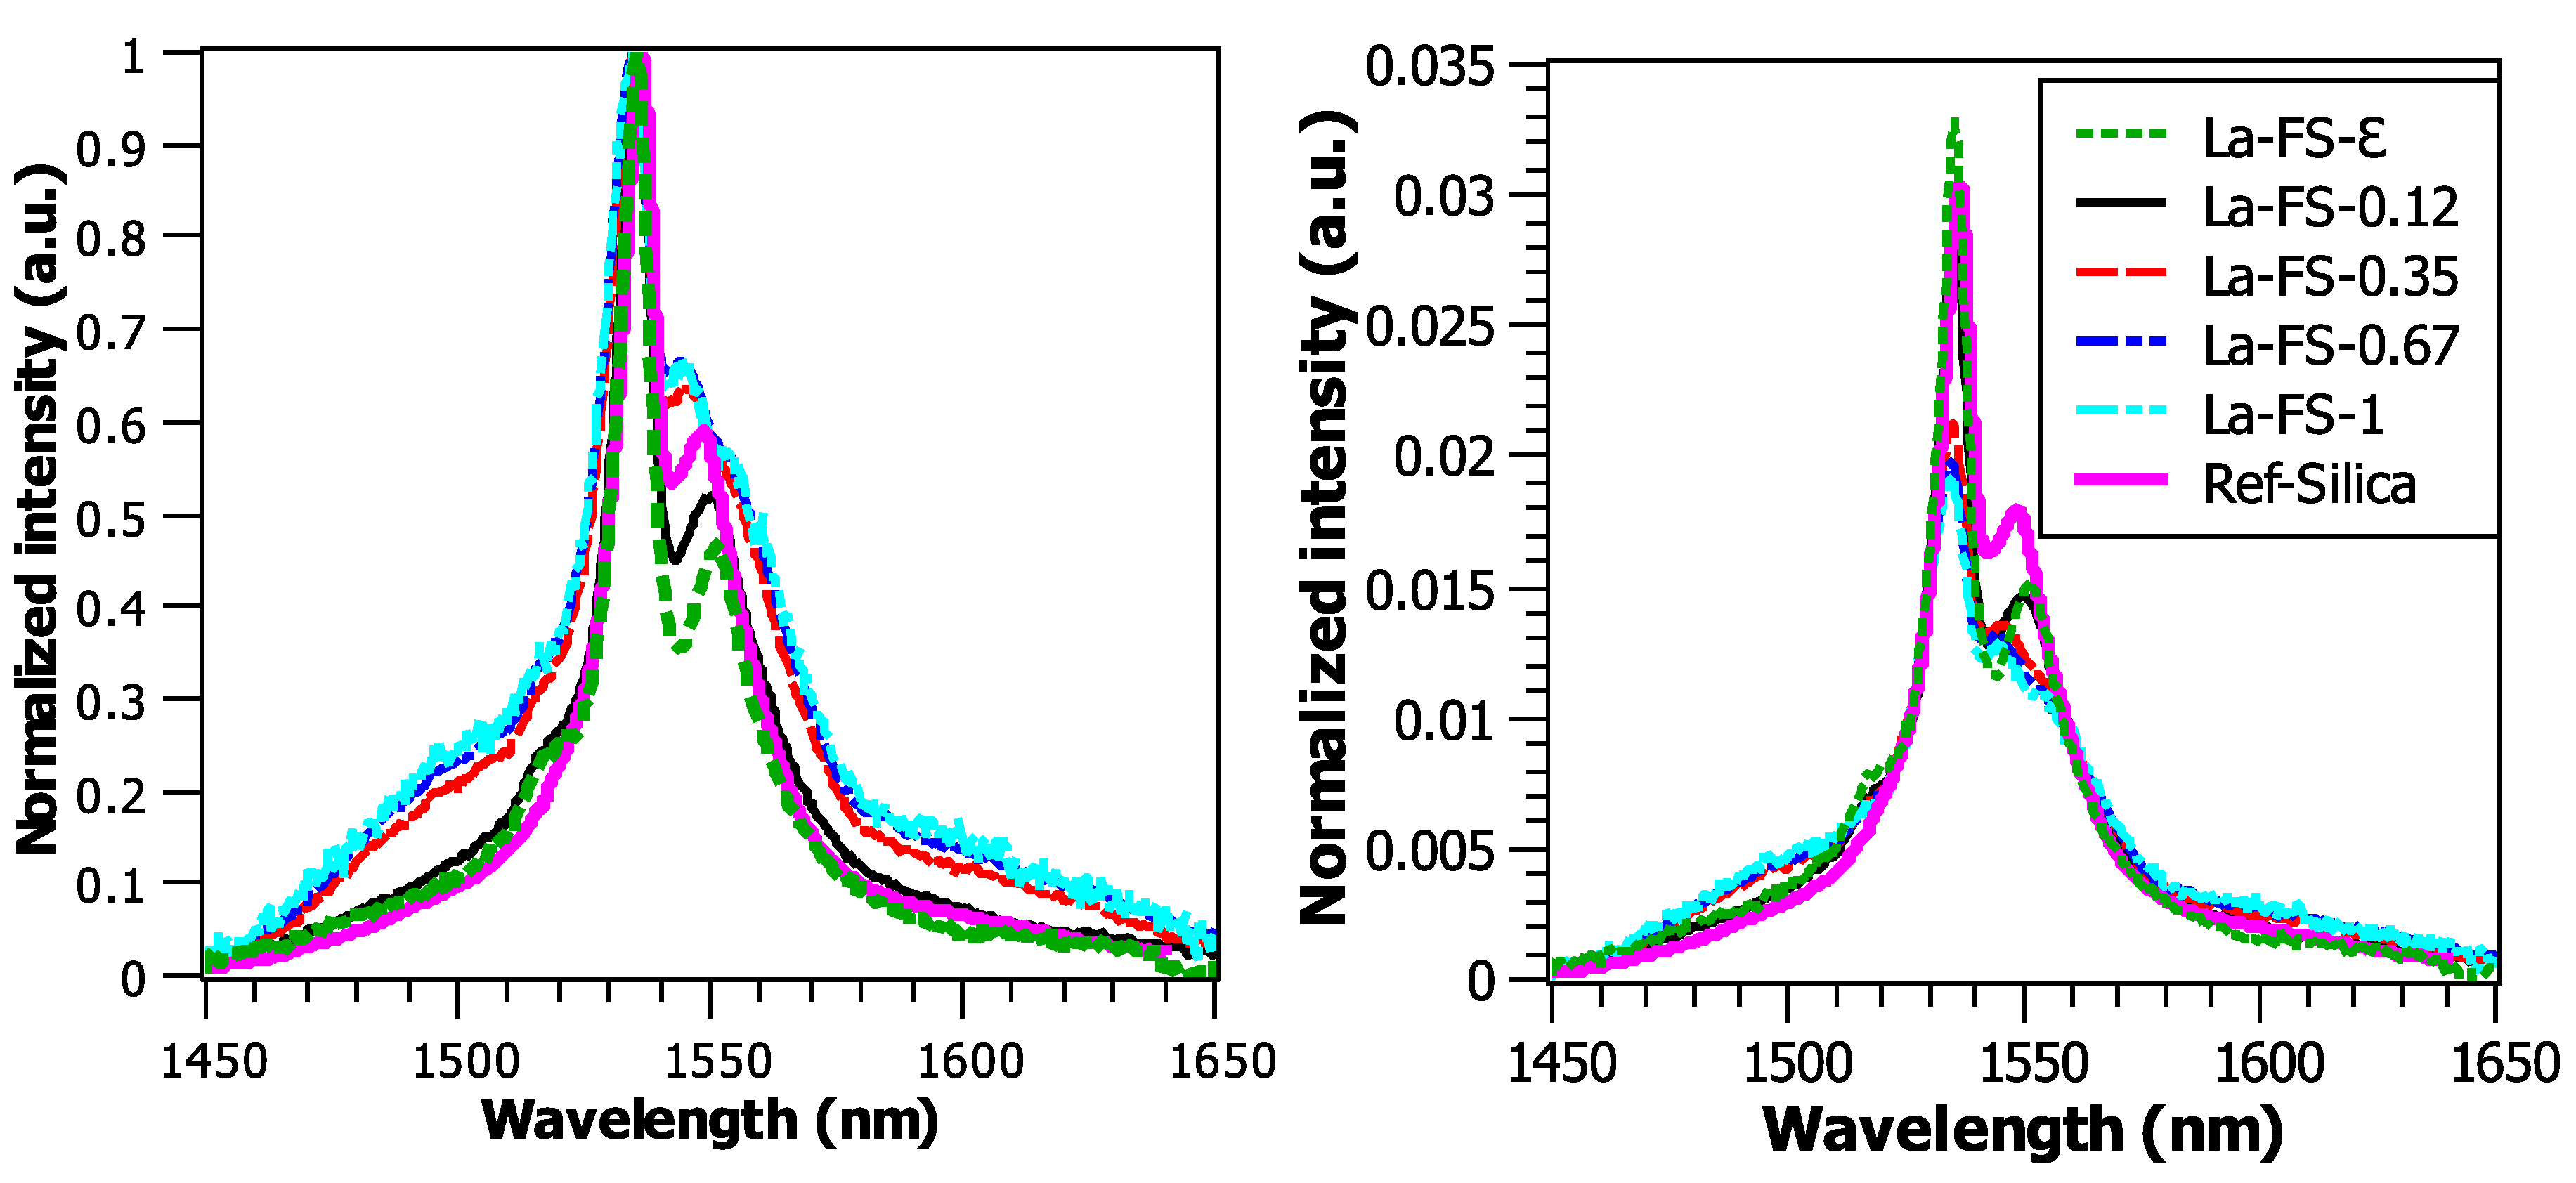
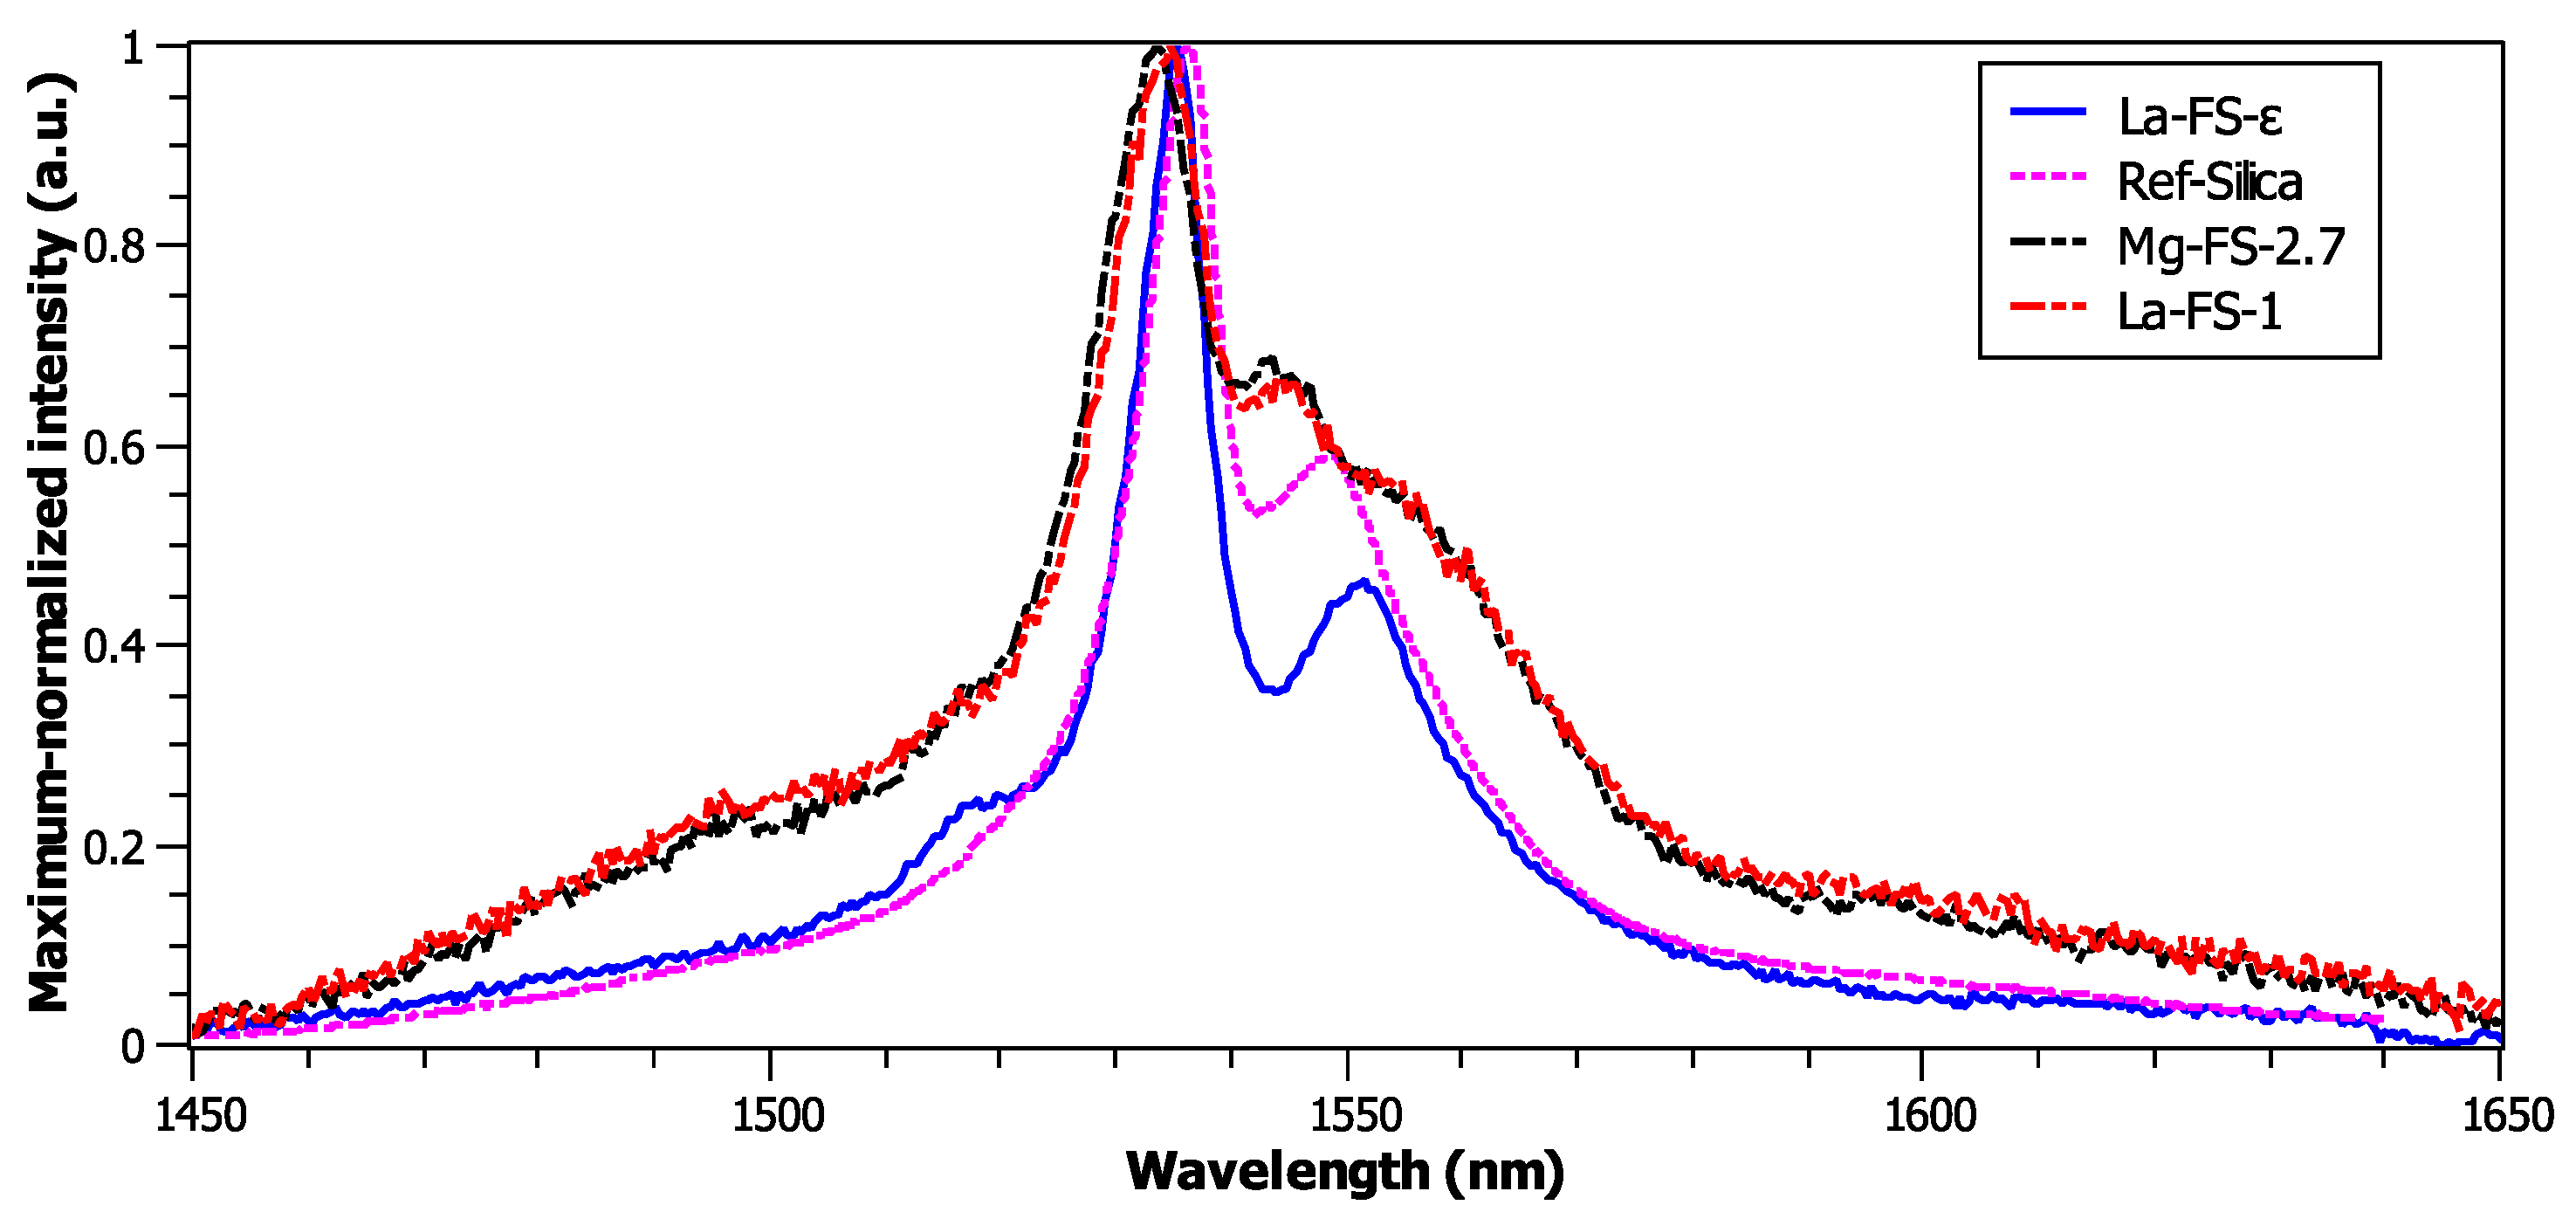
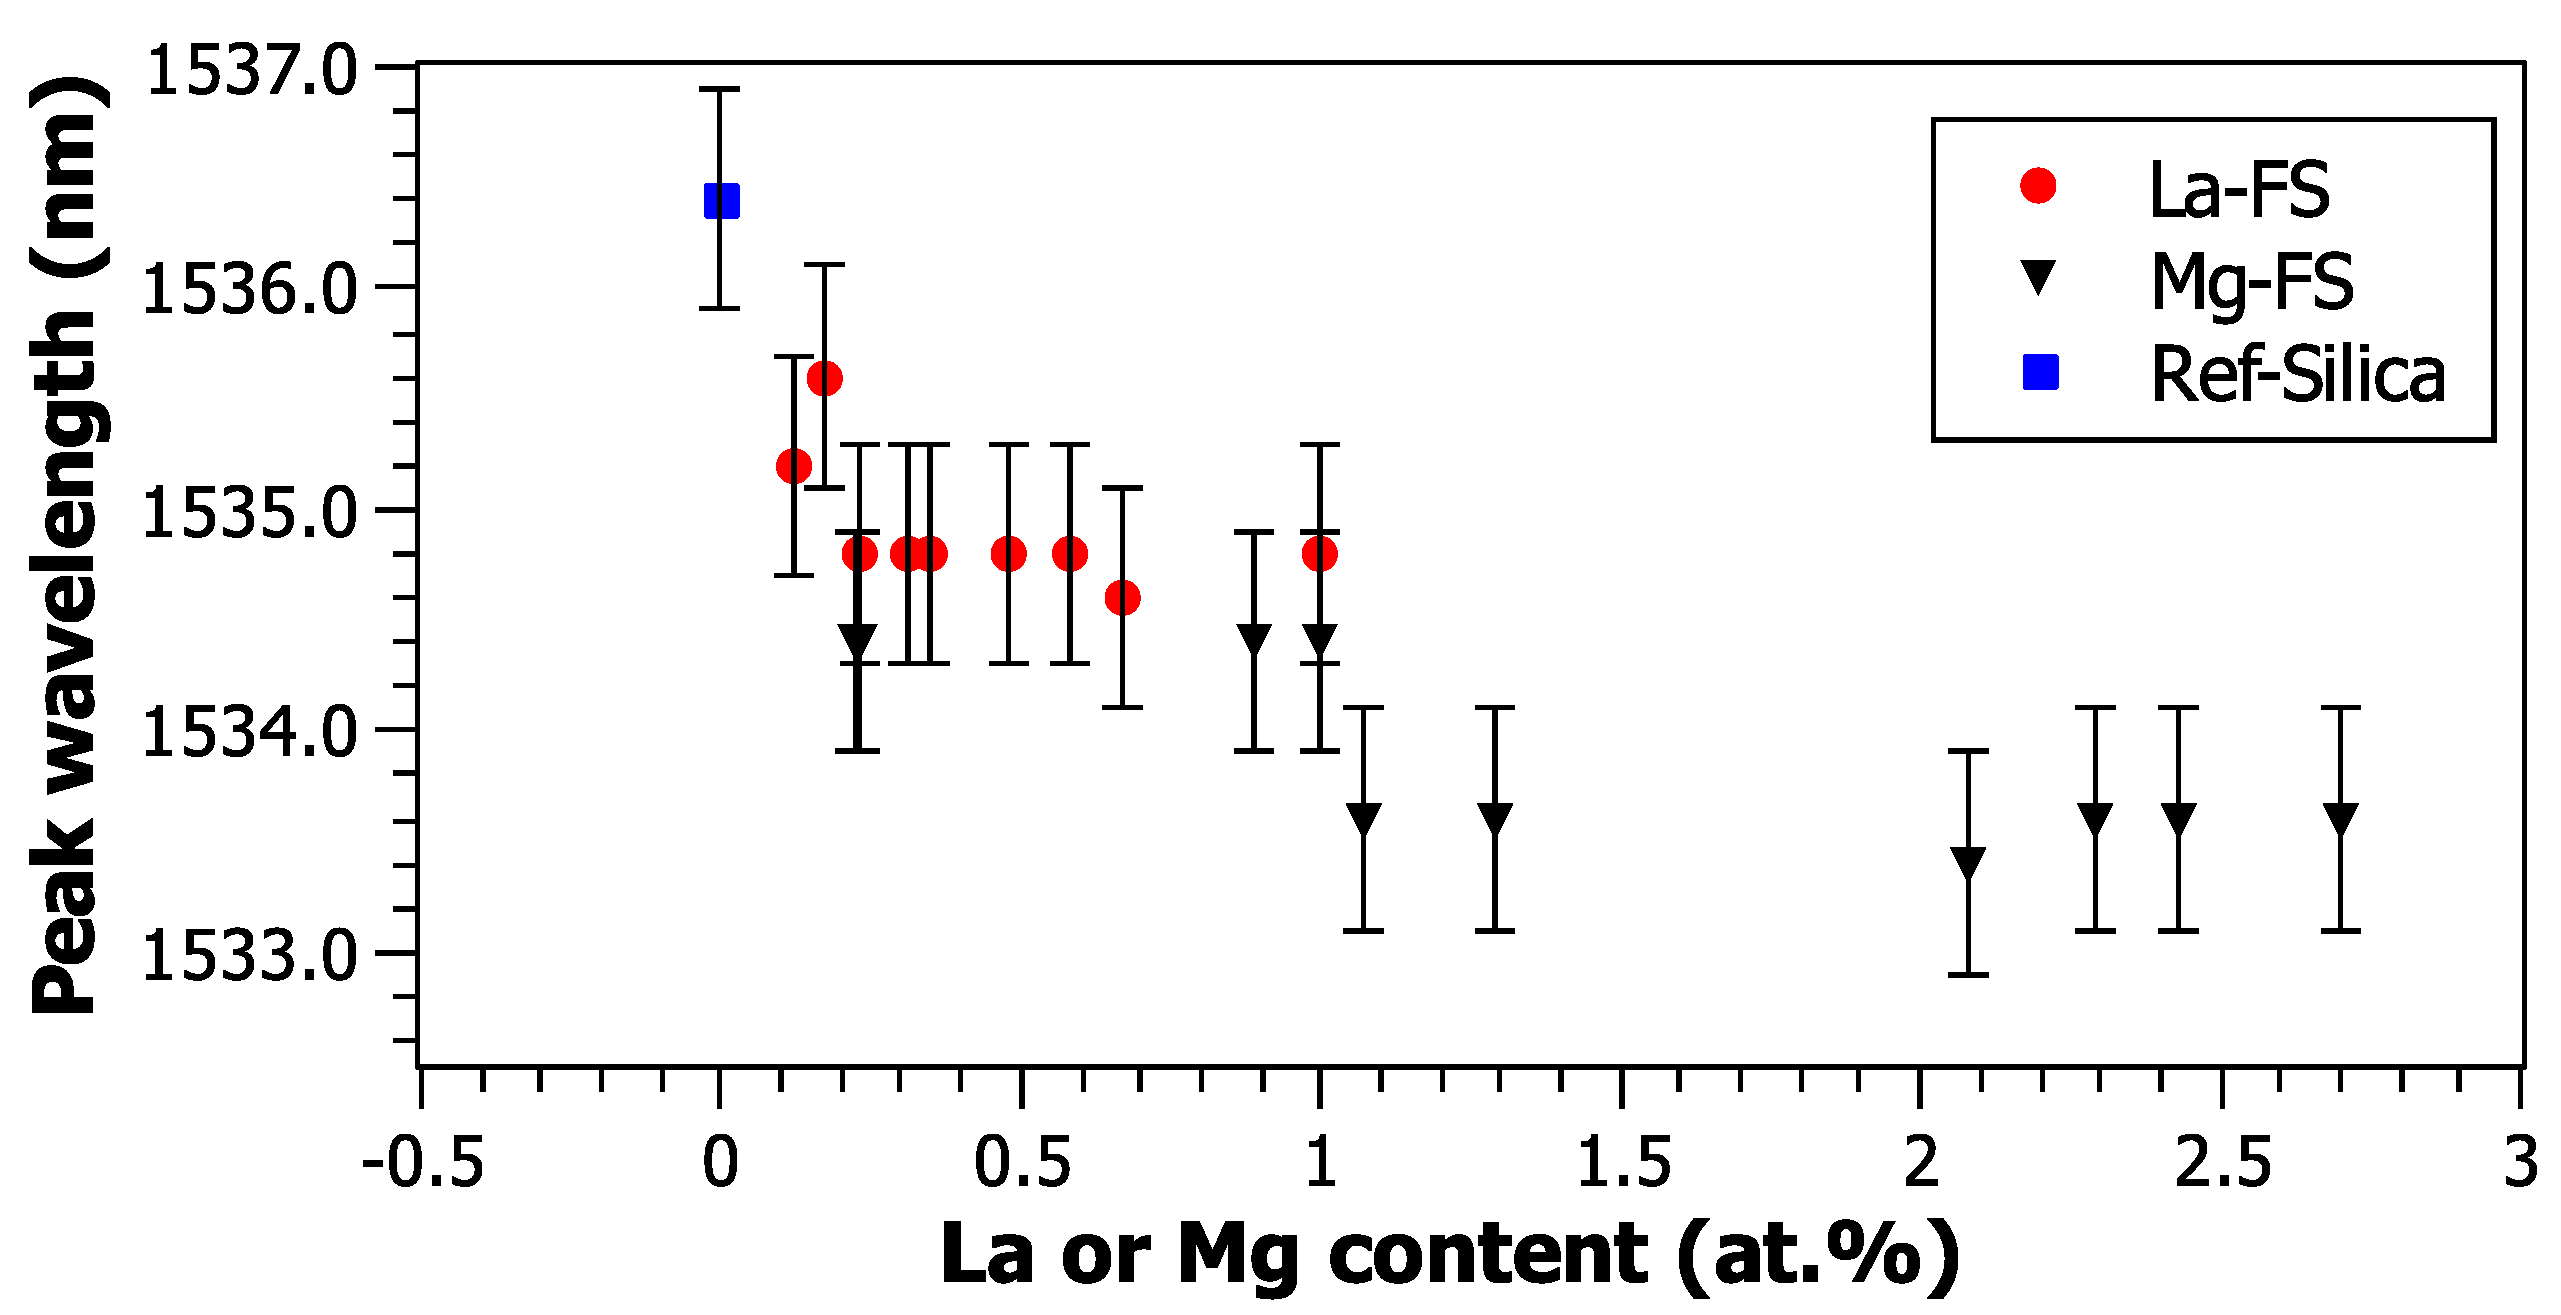
3.2. Spontaneous Emission Spectra
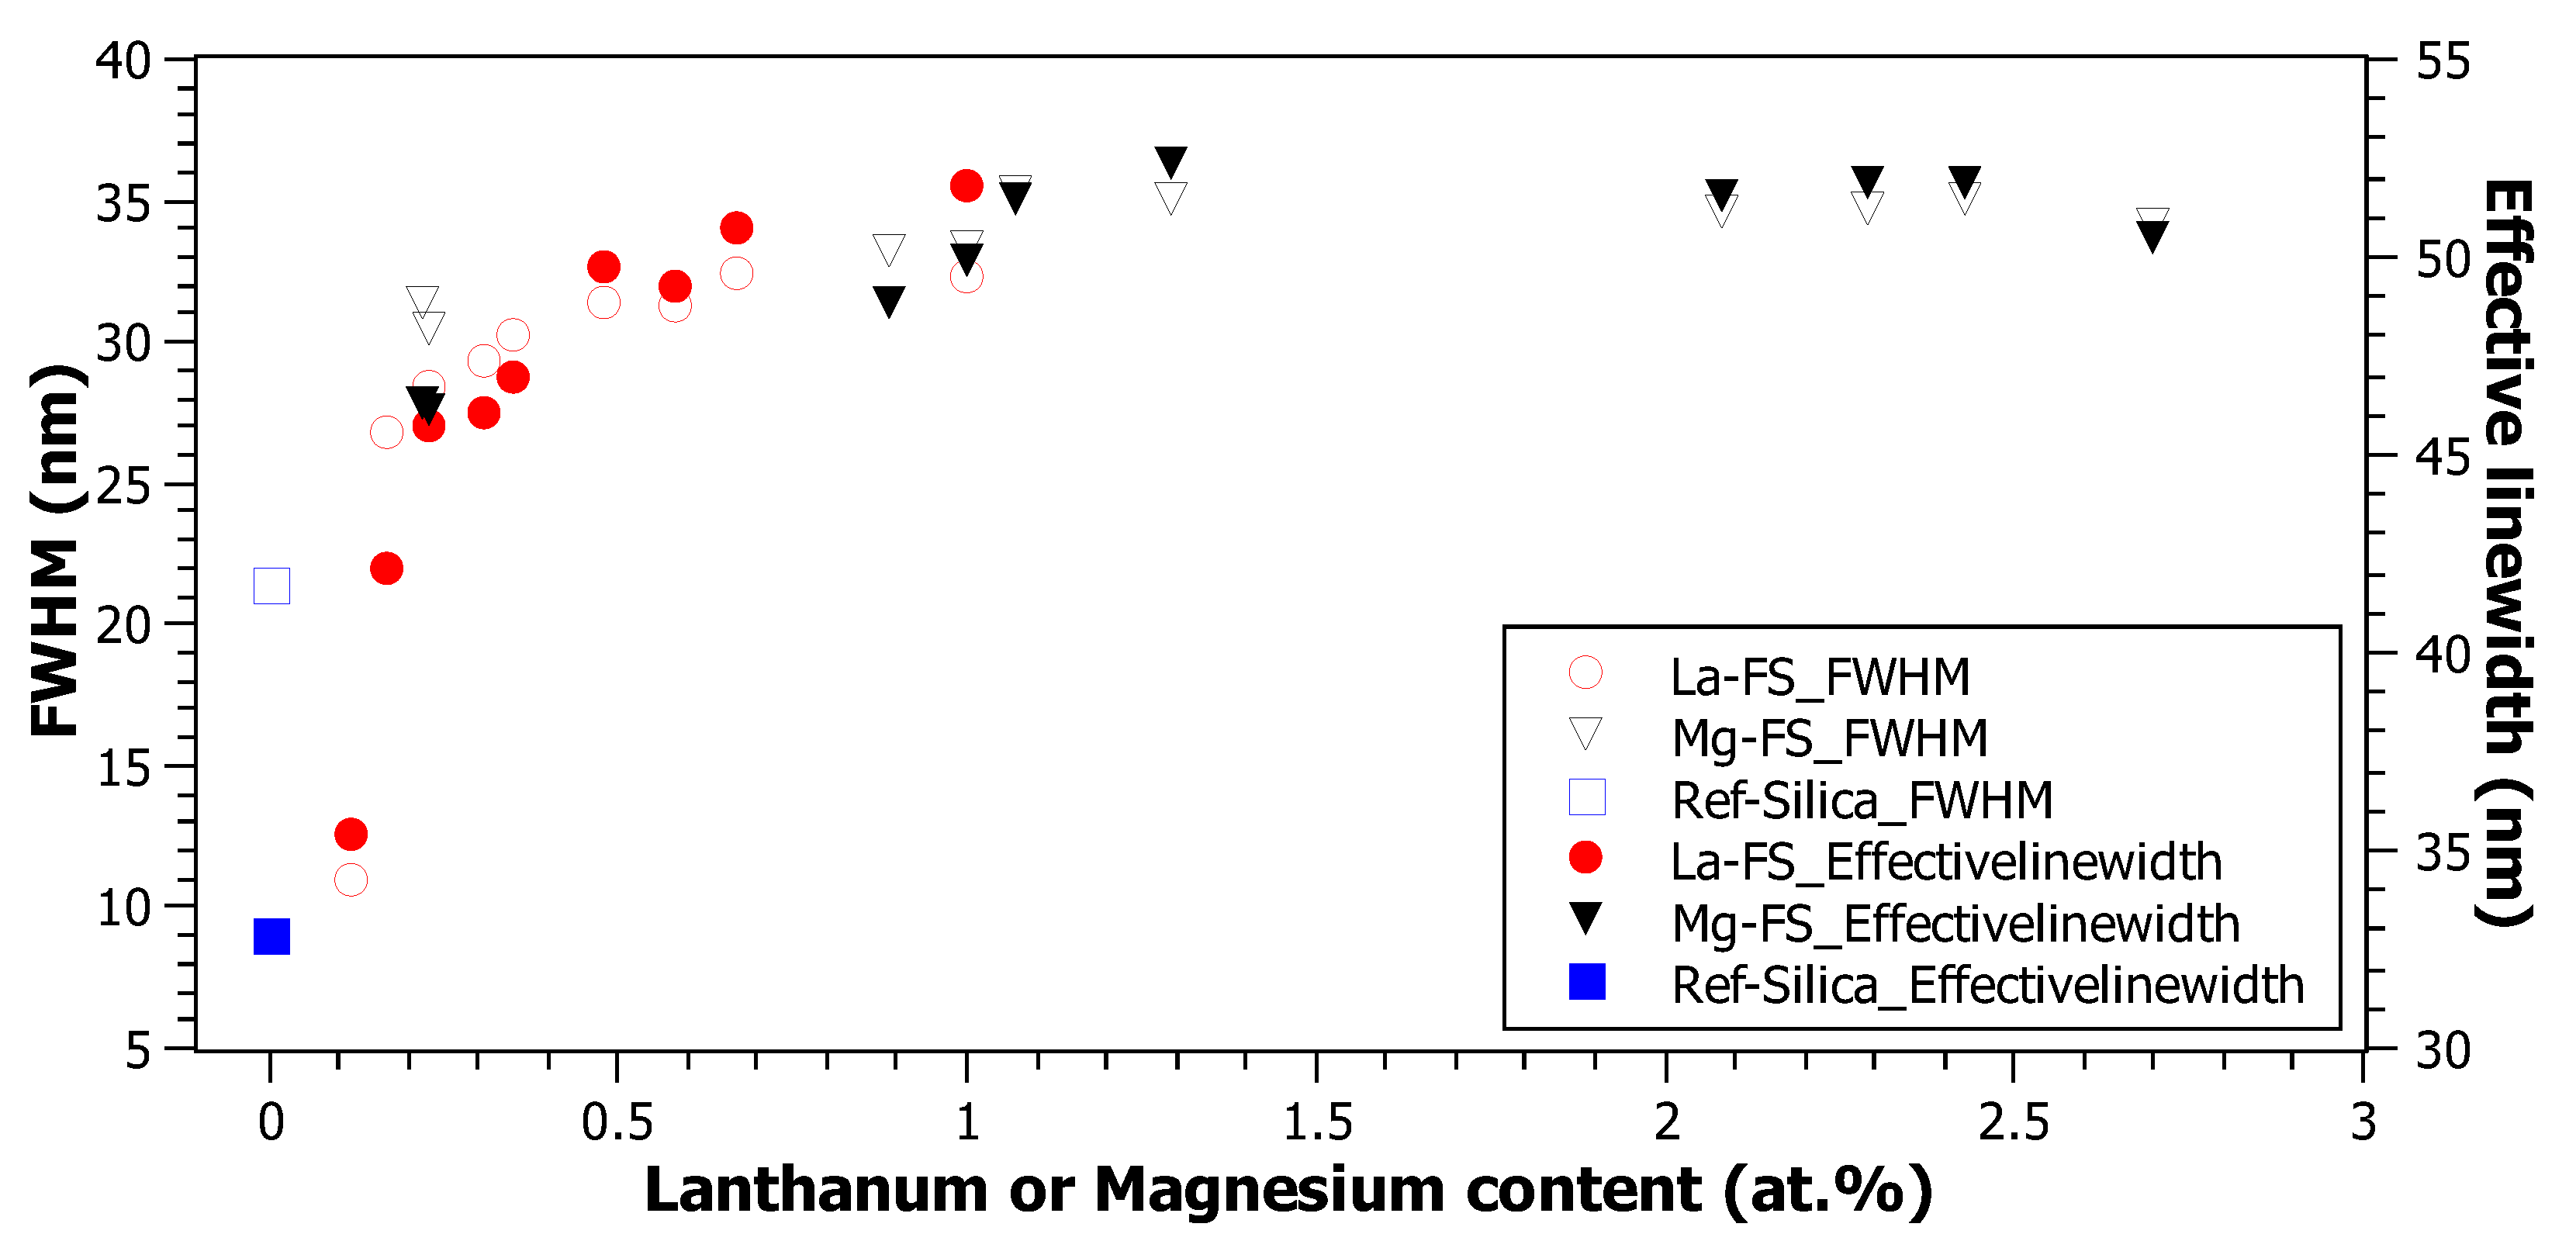
3.3. Width of Emission Band
4. Conclusions
Author Contributions
Funding
Conflicts of Interest
References
- Richardson, D.; Nilsson, J.; Clarkson, W. High power fiber lasers: current status and future perspectives. JOSA B 2010, 27, B63–B92. [Google Scholar] [CrossRef]
- Ballato, J.; Ebendorff-Heidepriem, H.; Zhao, J.; Petit, L.; Troles, J. Glass and process development for the next generation of optical fibers: A review. Fibers 2017, 5, 11. [Google Scholar] [CrossRef]
- Digonnet, M.J. (Ed.) Rare-Earth-Doped Fiber Lasers and Amplifiers; CRC Press: Boca Raton, FL, USA, 2001. [Google Scholar]
- Sudarsan, V.; Van Veggel, F.C.; Herring, R.A.; Raudsepp, M. Surface Eu3+ ions are different than “bulk” Eu3+ ions in crystalline doped LaF3 nanoparticles. J. Mater. Chemi. 2005, 15, 1332–1342. [Google Scholar] [CrossRef]
- Gonçalves, M.C.; Santos, L.F.; Almeida, R.M. Rare-earth-doped transparent glass ceramics. C. R. Chim. 2002, 5, 845–854. [Google Scholar]
- Faure, B.; Blanc, W.; Dussardier, B.; Monnom, G. Improvement of the Tm3+: 3H4 level lifetime in silica optical fibers by lowering the local phonon energy. J. Non-Cryst. Solids 2007, 353, 2767–2773. [Google Scholar] [CrossRef]
- Lupi, J.F.; Vermillac, M.; Blanc, W.; Mady, F.; Benabdesselam, M.; Dussardier, B.; Neuville, D.R. Impact of cerium and lanthanum on the photo-darkening and photo-bleaching mechanisms in thulium-doped fibre. Opt. Mater. 2017, 72, 106–114. [Google Scholar] [CrossRef] [Green Version]
- Lupi, J.F.; Vermillac, M.; Blanc, W.; Mady, F.; Benabdesselam, M.; Dussardier, B.; Neuville, D.R. Steady photodarkening of thulium alumino-silicate fibers pumped at 1.07 μm: Quantitative effect of lanthanum, cerium, and thulium. Opt. Lett. 2016, 41, 2771–2774. [Google Scholar] [CrossRef]
- Mebrouk, Y.; Mady, F.; Benabdesselam, M.; Duchez, J.B.; Blanc, W. Experimental evidence of Er3+ ion reduction in the radiation-induced degradation of erbium-doped silica fibers. Opt. Lett. 2014, 39, 6154–6157. [Google Scholar] [CrossRef]
- Vermillac, M.; Fneich, H.; Lupi, J.F.; Tissot, J.B.; Kucera, C.; Vennéguès, P.; Mehdi, A.; Neuville, D.R.; Ballato, J.; Blanc, W. Use of thulium-doped LaF3 nanoparticles to lower the phonon energy of the thulium’s environment in silica-based optical fibres. Opt. Mater. 2017, 68, 24–28. [Google Scholar] [CrossRef]
- Kucera, C.; Kokuoz, B.; Edmondson, D.; Griese, D.; Miller, M.; James, A.; Baker, W.; Ballato, J. Designer emission spectra through tailored energy transfer in nanoparticle-doped silica preforms. Opt. Lett. 2009, 34, 2339–2341. [Google Scholar] [CrossRef]
- Kasik, I.; Peterka, P.; Mrazek, J.; Honzatko, P. Silica optical fibers doped with nanoparticles for fiber lasers and broadband sources. Curr. Nanosci. 2016, 12, 277–290. [Google Scholar] [CrossRef]
- Blanc, W.; Guillermier, C.; Dussardier, B. Composition of nanoparticles in optical fibers by Secondary Ion Mass Spectrometry. Opt. Mater. Express 2012, 2, 1504–1510. [Google Scholar] [CrossRef]
- D’Acapito, F.; Blanc, W.; Dussardier, B. Different Er3+ environments in Mg-based nanoparticle-doped optical fibre preforms. J. Non-Cryst. Solids 2014, 401, 50–53. [Google Scholar] [CrossRef]
- Lupi, J.F.; Vermillac, M.; Trzesien, S.; Ude, M.; Blanc, W.; Dussardier, B. Gradual-time solution doping for the fabrication of longitudinally varying optical fibres. J. Lightw. Technol. 2018, 36, 1786–1791. [Google Scholar] [CrossRef]
- Vermillac, M.; Fneich, H.; Turlier, J.; Cabié, M.; Kucera, C.; Borschneck, D.; Peters, F.; Vennéguès, P.; Neisius, T.; Chaussedent, S.; et al. On the morphologies of oxides particles in optical fibers: Effect of the drawing tension and composition. Opt. Mater. 2018, in press. [Google Scholar] [CrossRef]
- Vermillac, M.; Lupi, J.F.; Peters, F.; Cabie, M.; Vennegues, P.; Kucera, C.; Neisius, T.; Ballato, J.; Blanc, W. Fiber-draw-induced elongation and break-up of particles inside the core of a silica-based optical fiber. J. Am. Ceram. Soc. 2017, 100, 1814–1819. [Google Scholar] [CrossRef] [Green Version]
- Schultz, P. Ultraviolet absorption of titanium and germanium in fused silica. In Proceedings of the Eleventh International Congress on Glass, Prague, Czech Republic, 4–8 July 1977. [Google Scholar]
- Schultz, P.C. Fused P2O5 Type Glasses. U.S. Patent 4,042,404, 16 August 1977. [Google Scholar]
- Ghatak, A.; Thyagarajan, K. An Introduction to Fiber Optics; Cambridge University Press: Cambridge, UK, 1998. [Google Scholar]
- D’Acapito, F.; Maurizio, C.; Paul, M.C.; Lee, T.S.; Blanc, W.; Dussardier, B. Role of CaO addition in the local order around Erbium in SiO2–GeO2–P2O5 fiber preforms. Mater. Sci. Eng. B 2008, 146, 167–170. [Google Scholar] [CrossRef]
- Wade, S.A.; Collins, S.F.; Baxter, G.W. Fluorescence intensity ratio technique for optical fiber point temperature sensing. J. Appl. Phys. 2003, 94, 4743–4756. [Google Scholar] [CrossRef]
- Weber, M. Optical materials, Part 1-Nonlinear optical properties/radiation damage. In CRC Handbook of Laser Science and Technology; CRC Press: Boca Raton, FL, USA, 1986; Volume 3. [Google Scholar]
- Jiang, S.; Luo, T.; Hwang, B.C.; Smekatala, F.; Seneschal, K.; Lucas, J.; Peyghambarian, N. Er3+-doped phosphate glasses for fiber amplifiers with high gain per unit length. J. Non-Cryst. Solids 2000, 263, 364–368. [Google Scholar] [CrossRef]


| Fiber Sample | Mg/La Content (atom %) | Ge (atom %) | Full-Width at Half-Maximum (FWHM) (nm) | |
|---|---|---|---|---|
| La-FS- | La—undetectable | 1.1 | 9.54 | 30.5 |
| La-FS-0.17 | La—0.17 | 0.87 | 26.8 | 42 |
| La-FS-0.23 | La—0.23 | 0.67 | 28.4 | 45.7 |
| La-FS-0.31 | La—0.31 | 0.43 | 29.4 | 46.1 |
| La-FS-0.35 | La—0.35 | 0.50 | 30.2 | 47 |
| La-FS-0.46 | La—0.46 * | 0.5 * | 31 | 48.5 |
| La-FS-0.51 | La—0.51 * | 0.5 * | 31.4 | 49.7 |
| La-FS-0.58 | La—0.58 | 0.52 | 31.3 | 49.3 |
| La-FS-0.67 | La—0.67 | 0.42 | 32.4 | 50.7 |
| La-FS-1 | La—1 | 0.26 | 32.3 | 51.8 |
| Mg-FS-0.22 | Mg—0.22 | 0.74 | 31.4 | 46.3 |
| Mg-FS-0.23 | Mg—0.23 | 0.78 | 30.5 | 46.2 |
| Mg-FS-0.89 | Mg—0.89 | 0.39 | 33.2 | 48.9 |
| Mg-FS-1 | Mg—1 | 0.39 | 33.3 | 50 |
| Mg-FS-1.1 | Mg—1.1 | 0.30 | 35.2 | 51.5 |
| Mg-FS-1.3 | Mg—1.3 | 0.34 | 35 | 52.3 |
| Mg-FS-2.1 | Mg—2.1 | 0.26 | 34.6 | 51.5 |
| Mg-FS-2.3 | Mg—2.3 | 0.26 | 34.7 | 51.9 |
| Mg-FS-2.4 | Mg—2.4 | 0.25 | 35.1 | 51.9 |
| Mg-FS-2.7 | Mg—2.7 | 0.15 | 34.2 | 50.5 |
| Ref-Silica | La/Mg—0; P—3.7 | 5.8 | 21.4 | 32.8 |
© 2018 by the authors. Licensee MDPI, Basel, Switzerland. This article is an open access article distributed under the terms and conditions of the Creative Commons Attribution (CC BY) license (http://creativecommons.org/licenses/by/4.0/).
Share and Cite
Vermillac, M.; Lupi, J.-F.; Trzesien, S.; Ude, M.; Blanc, W. On the Enlargement of the Emission Spectra from the 4I13/2 Level of Er3+ in Silica-Based Optical Fibers through Lanthanum or Magnesium Co-Doping. Ceramics 2018, 1, 364-374. https://doi.org/10.3390/ceramics1020029
Vermillac M, Lupi J-F, Trzesien S, Ude M, Blanc W. On the Enlargement of the Emission Spectra from the 4I13/2 Level of Er3+ in Silica-Based Optical Fibers through Lanthanum or Magnesium Co-Doping. Ceramics. 2018; 1(2):364-374. https://doi.org/10.3390/ceramics1020029
Chicago/Turabian StyleVermillac, Manuel, Jean-François Lupi, Stanislaw Trzesien, Michele Ude, and Wilfried Blanc. 2018. "On the Enlargement of the Emission Spectra from the 4I13/2 Level of Er3+ in Silica-Based Optical Fibers through Lanthanum or Magnesium Co-Doping" Ceramics 1, no. 2: 364-374. https://doi.org/10.3390/ceramics1020029