Article

Organizational Processes for Adopting Breakthrough Technology: Text Mining of AI Perception among Japanese Firms

1
Faculty of Business Administration, Musashino University, Tokyo 135-8181, Japan
2
Faculty of Business Administration, Kyoto Tachibana University, Kyoto 607-8175, Japan
*
Author to whom correspondence should be addressed.
Appl. Syst. Innov. 2024, 7(1), 13; https://doi.org/10.3390/asi7010013
Submission received: 21 December 2023 / Revised: 20 January 2024 / Accepted: 26 January 2024 / Published: 31 January 2024

Abstract

:
Artificial intelligence (AI) has become popular worldwide after technological breakthroughs in the early 2010s. Accordingly, many organizations and individuals have been using AI for various applications. Previous research has been dominated by case studies regarding the industrial use of AI, although how time-series changes affect users’ perceptions has not been clarified yet. This study analyzes time-series changes in AI perceptions through text mining from nonfinancial information obtained from Japanese firms’ disclosures. The main findings of this study are as follows: first, perceptions of AI vary across industries; second, the business sector has progressed through the stages of recognition, investment, strategization, commercialization, and monetization. This transition is concurrent with each category’s evolving interpretation of the innovator theory proposed by Rogers (2003), to some extent. Third, it took approximately a decade from the breakthrough technology to the monetization by Japanese firms. Our findings underline the importance of speeding up the organizational process through intervention and contribution to the areas regarding “diffusion of innovation” and perceptual characteristics.

1. Introduction

Artificial intelligence (AI) has gained popularity since the early 2010s and has been widely used in various applications, such as chatbots, smartphone facial recognition, video scripting, and recommendations. AI itself is an innovation, and it also leads to other innovations in the social [1,2], education [3], and healthcare [4,5] fields. Although there are potential adverse employment [6], legal [7,8], and ethical aspects [2,9] of AI, it has been highly adopted by almost all areas due to its technological impact.
Businesses are also using AI; in fact, the business sector is a leading actor in social transformation using AI and other innovations. With the development of AI technology and increased computational power, firms are using AI to analyze large amounts of data to create new industries, products, and services to generate revenue [10,11]. The relevant data will be used in decision-making [12], logistics [13,14], and human resource management (HRM) [15] to reduce costs. These applications are summarized by the terms Industry 4.0, Industry 5.0, and Digital Transformation [13,16].
Studies on AI are primarily conceptual model-building studies, reviews, and case studies. The advanced case studies showcase a spectrum of adoption timelines and strategies among firms. The variances in adopting new technologies such as AI underscore the need for a robust framework to comprehend the multifaceted nature of adopting innovations across firms.
Understanding the different paces and approaches to AI adoption across firms requires a theoretical framework considering the psychological and sociological dimensions involved in embracing innovative technologies. As Rogers [17] stated, adopting innovation is both a psychological and sociological process. Not only individuals but also organizations differ psychologically; accordingly, firms’ adoption of innovations is influenced by the decision-making processes and attitudes of decision makers in the organization. Consequently, some firms will adopt AI faster and others slower. Conservative firms may be reluctant to adopt AI; therefore, the penetration of the innovation across the business sector will require some time, during which firms may either adopt AI or exit the market due to competition. In addition, perceptions of AI and its applicability will evolve with the diffusion stage.
This study aims to understand the perception of AI in the Japanese business sector over time. How has the perception of AI evolved over time? And how do the perceptions of earlier adopters differ from those of later adopters? By addressing these questions, this study analyzes changes in Japanese firm’ perceptions of AI through text mining of nonfinancial information. The results of the analysis will identify factors that influence the speed of AI adoption in the business sector.
Japanese firms are characterized by accepting foreign technologies in the ICT sector. From the 2010s until the development of generative AI, GAFAM (Google, Amazon, Facebook, Apple, and Microsoft) and BAT (Baidu, Alibaba, and Tencent), which are U.S. and Chinese big-tech companies, have led the ICT sector [18]. Japanese firms occupied an important position in the global economy in the 1990s but are not currently global leaders in the industry. Analyzing the case of Japanese firms is relevant because they can serve as a reference for many countries that are not advanced in the ICT industry.
To this end, Section 2 discusses two related studies. The first is about AI and innovation management, the second considers the innovation theory, and the third considers nonfinancial information possibilities. Section 3 describes the analysis method, and Section 4 presents the results obtained. Section 5 discusses the results and Section 6 summarizes the conclusions.

2. Related Research

2.1. AI and Innovation Management

AI is changing how businesses operate, including innovation management. AI is expected to provide new opportunities for innovation management and reshape innovation practices in organizations. The innovation process is a four-stage process: (1) discovery and creation of new ideas, (2) selection of these ideas, (3) experimentation, and (4) development and commercialization. AI is considered more useful in the later stages of the innovation process than the earlier stage because AI is useful for later tasks that do not require as much creativity [19].
However, several caveats need to be considered when using AI. The first is in HRM. HRM using AI produces positive outcomes such as employee job satisfaction, commitment, employee engagement, and participation, improving employee performance. However, it has also been noted to increase employee turnover [20]. The second is the reform of organizational processes when adopting the innovations. Research on the adoption of blockchain technology indicates that employee training and business processes must be restructured for organizations to take advantage of new technology [21].
These points need to be addressed for AI to be used in firms. Depending on how quickly and appropriately they respond, firms are classified into four categories: AI-Frontrunners, that take the most advanced implementation approach to AI-based innovation management; AI-Practitioners, that take a pragmatic approach to AI implementation and seek to achieve results with limited resources; AI-Occasional Innovators, that make minimal effort concerning the relevance of AI-based innovation management; and Non-AI Innovators [22]. These classifications indicate differences in the speed of AI adoption among firms and implies that the social penetration of AI takes time. However, few studies have addressed this point. The differences in the speed of adoption or diffusion are then modeled using Rogers’ innovator theory.

2.2. Innovation Adoption and the Adoption Process

Innovation does not always lead to rapid diffusion because of the process by which people and organizations adopt innovations. According to Rogers [17], there are five steps for individuals to adopt innovation: knowledge, persuasion, adoption, implementation, and confirmation. Individuals recognize and learn about the existence and function of the innovation (knowledge), form favorable or unfavorable attitudes toward the innovation (persuasion), and decide whether to adopt or reject the innovation (adoption). Subsequently, if adopted, the innovation is used (implementation). However, additional information about the innovation can either strengthen attitudes toward it or cause individuals to abandon it (confirmation). Different psychological responses divide consumers into five categories according to the well-known innovator theory: innovators, who recognize the value of novelty and are the first to adopt innovations; early adopters, who are not as radical as innovators but are sensitive to industry trends and have influence over their surroundings; early majorities, who are cautious about innovation; late majorities, who are skeptical or reluctant to adopt innovations; and laggards, who are the last to adopt innovations. Thus, diffusion throughout society can be understood as taking place in stages and taking time.
Case studies based on the innovator theory have been ubiquitous, even in recent years. For example, in the agricultural sector, one study analyzed farmers’ adoption of precision farming and site-specific management [23]. Another study analyzed the adopters of IoT smart farming technologies [24]. Both studies found that education level, understanding of the technology, and age affect the speed of adoption. Moreover, in the sustainability sector, the diffusion of more sustainable diets has been analyzed [25]. Demographic characteristics, such as gender, age, education level, household size, and region of affiliation, were determined to be influential. EV diffusion was also influenced by gender, education level, environmental opinions, and adopters’ influence [26].
Rogers also modeled the organizational adoption of innovations. Organizations identify the organizational problem that innovation can solve (agenda-setting) and then align the organizational problem with the innovation (matching). The innovation is adapted to the organization’s needs (redefinition/restructuring), and then the relationship between the organization and the innovation is clarified (clarifying). Finally, innovation becomes a standard part of the organization’s internal operations (routinizing). Management scholars have studied how organizations deal with various issues when adopting innovation. These organizational theory studies are based on Rogers’ theory [27].
The first research gap concerns the business sector as a unit of analysis. Although there are microlevel analyses of individuals and organizations, few studies present an overview of the business sector or society. In particular, the business sector may have a unique perception because it is trying to build a competitive advantage in its business environment. The second research gap is the importance of perception. Previous research has reported that the diffusion of innovations is a matter of adopter discretion. In other words, it is not important whether AI is adopted. From our research interest, it is important how perceptions of AI have changed. However, previous studies have often focused on the characteristics of the adopter category, with little research on the change in perceptions behind adoption. The business sector will have different perceptions of AI, from recognition to generating revenue.

2.3. Diverse Datasets and Nonfinancial Information Possibilities

A time-series analysis of AI perceptions of business sector must be conducted, which requires a dataset that meets the conditions. The first dataset often used in innovation research is a survey. Moreover, it is necessary to collect data regularly to clarify the status of the same firms. For instance, the Japanese Ministry of Internal Affairs and Communications has conducted a long-term survey to collect data [28]. These panel data are used to reveal aspects of corporate R&D. However, it is difficult to understand changes in perception using this method because the questions must be concise to collect data from many firms. Although questionnaires help clarify the facts at a given point in time, conducting a long-term survey in advance to assess the importance of a particular upcoming technology is difficult. The second dataset is a collection of patents. For instance, R&D intensity and diversity are calculated from patent data and reveal a firm’s R&D activities [28]. However, analysis using patents can only be performed by firms that have acquired the patents. Some firms may not obtain patents owing to their business model, or they may not apply for patents to maintain confidentiality. In addition, firms that only adopt innovations and do not create innovations are excluded from the patent database. The third dataset comprises financial data [28,29]. Although financial data are often used to measure the impact of innovation on performance, some studies use R&D expenditures as a proxy for innovation. One study using financial data found that R&D expenditures are adjusted to be a fixed percentage of employment and sales [30]. Although these studies are useful for analyzing firm R&D, their sample size is limited to firms engaged in R&D activities. In addition, firms that employ innovation without R&D are excluded. In summary, the datasets used so far in the empirical analysis have some advantages; however, there are difficulties related to understanding the importance of the questionnaire items in advance and in analyzing firms that have not obtained patents or conducted R&D.
Our study focuses on nonfinancial information as a dataset. Nonfinancial information generally refers to information other than that in financial statements disclosed to stakeholders [31] and descriptive information rather than numerical data. Previous research has conducted a text analysis of Management’s Discussion and Analysis of the Financial Condition and Results of Operations (MD&A) [32,33]. For example, the tone of MD&A can predict firms’ investment activity [34] and dramatic changes in firms’ capital structure [35], which have received considerable research attention but have not been implemented extensively in innovation research.
Is AI adoption really disclosed in nonfinancial information? The first theoretical background is signaling theory [36]. There is information asymmetry between firms and investors; firms know the details of their operations, while investors do not. Voluntary disclosure by firms is one way to address this asymmetry [37]. Some studies have discussed the relationship between firm innovation and disclosure [38,39]. Given the societal interest in AI, information asymmetry with investors can be addressed by disclosing information about AI applications. The second theoretical background is impression management. It has been observed that organizations (and individuals) not only objectively describe the facts they face but also consciously or subconsciously control the direction of stakeholders’ understanding [40]. Even if information asymmetry between firms and investors were addressed, firms would still attempt to control stakeholders’ understanding of the firms. Implementing AI, a cutting-edge technology with high public interest, is likely to create the impression that a firm is advanced. Accordingly, we believe that the text of nonfinancial information is useful for analyzing firms’ perceptions over time.
The theoretical background can be summarized for the interests of this study as follows. Rogers’ innovator theory shows that AI diffuses throughout society and that there are differences in perceptions and changes through the stages of AI diffusion. This demonstrates the importance of perception before or along with innovation adoption. According to signaling theory and impression management theory, managers have incentives to actively disclose AI adoption, an advanced technology that society is paying attention to. However, it is difficult to analyze overall trends in perception using existing datasets. Thus, analyzing the text of securities reports effectively reveals the actual diffusion of AI to the business sector, as described in the next section.

3. Materials and Methods

3.1. Data Collection

The data used in this study are taken from the text of Japanese firms’ annual and quarterly security reports. Examining quarterly reports allows for an understanding of AI adoption on a finer time scale. Data were extracted from eol, a corporate financial database. The dataset was obtained from a full-text search of this database using “AI” or “jinkōchinō”, which means artificial intelligence in Japanese. The data are taken from the entire document, not limited to MD&A, because AI could be mentioned in other sections, such as “AI officers” or “AI business segments”.
There are three data acquisition points. First, data collection began in 2016. Annual/quarterly reports were digitalized since Japan’s fiscal year ended in March 2004. However, after organizing the data, we found that the quantity of data for the period 2004–2015 was relatively small (792 documents for the 10 years) (Figure 1). Therefore, we chose 2016 as the starting point. Second, the end of data collection was December 2022. It has been argued that generative AI, which began to spread since mid-2022, may have a qualitatively different impact on society than previous AI technologies [41,42]. Third, the present study uses the calendar year, whereas Japanese firms submit their annual/quarterly reports using the fiscal year, mostly April to March. This is because annual/quarterly reports are written considering subsequent events and social contexts that occur after the fiscal year end until disclosure.
The data contained in eol include not only firms listed on the Tokyo Stock Exchange (TSE) and local stock exchanges but also all firms that have filed with Electronic Disclosure for Investors’ NETwork (EDINET), which is the Japanese version of the electronic information disclosure system for disclosed documents established under the Financial Instruments and Exchange Act in Japan. Therefore, firms that have ceased operations owing to bankruptcy or merger and nonlisted firms that voluntarily filed documents are also included in EDINET. These firms are included in our dataset to understand perceptions of the overall Japanese business sector.
The dataset consisted of 31,476 documents for the period 2016–2022. Due to the specification of the database, when a full-text search is performed, only characters within a certain range are extracted before and after the search query. There are approximately 514 million total characters, including Japanese characters, letters, numbers, and symbols, with an average of 163.4 characters per document and a standard deviation of 39.0 characters. Note that some sentences or words may begin in the middle of a sentence or word; however, no special treatment was made for this.

3.2. Data Procedure

We have organized several words. The first criterion is consolidating Japanese and English words with the same meaning. The second criterion is consolidating Japanese synonyms (Appendix A). This data cleaning includes three types of “AI”: AI, “jinkōchinō”, and artificial intelligence in English, meaning that terms in Japanese, English, and abbreviations can appear parallel in the extracted data. In the case of the text “jinkōchinō (Artificial Intelligence: AI)”, the term AI appears three times in one document. However, this is not a significant problem in this study because the perception of AI is more important than AI itself.

3.3. Analysis

The first analysis step is to conduct descriptive statistics to capture the whole picture. Have all industries mentioned AI equally, or is there bias? We used the 10 industry classifications of the TSE as our standard. The correspondence between the 33 and 10 industries is shown in Table 1. We supplemented the data for firms whose industries were unknown by conducting Internet searches.
An independence test was conducted to analyze whether any relationship exists between the number of firms per industry and the number of documents. As an illustration, data from 2022 were used for both the number of firms per industry and the number of documents. The number of firms per industry was obtained from the TSE website. A residual analysis will continue if there is a significant difference in the independence test. We used Bellcurve (version 3.20) as software for the independence test and residual analysis.
Second, the data were analyzed. First, in the Japanese morphological analysis, four words were forced to be extracted, namely, “cloud”, “big data”, “machine learning”, and “5G”, because these were broken down into multiple words despite their meaning in our preliminary analysis. Three words, “tsuki” (month), “nendo” (fiscal year), and “heisei” (a regnal name from Japan’s past), are added to the stop-words in addition to the default settings of the text mining software described below because they appear many times but have no meaning.
After the morphological analysis, we performed text mining, which is the discovery of new, previously unknown information by a computer by automatically extracting information from different written resources [43]. This method has been used since before data science became popular. It is characterized by (1) the accumulation of studies and (2) the high reproducibility of results because it does not use stochastic models. Therefore, it was chosen as the main tool for this study.
(1) Co-occurrence network analysis was conducted to obtain a comprehensive view of the word. Co-occurrence network analysis is a combination of co-occurrence analysis which explores co-occurrence relationships of words, and network analysis [44]. The result of the co-occurrence network is represented by a diagram consisting of nodes (circles indicating word frequency) and edges (lines indicating co-occurrence frequencies between words). Nodes with high co-occurrence frequencies are clustered to provide a comprehensive view of the data [45]. This analysis can reveal the context of a large volume of text by focusing on frequently used words and visualizing their relationships. However, note that the results are interpreted by humans and thus have certain limitations.
Subsequently, (2) correspondence analysis determines the characteristics of the time-series change in AI perception. Correspondence analysis is a method of data analysis that graphically represents tabular data [46]. It is frequently used in text mining because it can effectively illustrate the relationship between words and other variables [47,48]. Two types of correspondence analysis were performed: (a) time-series analysis and (b) innovation theory-based analysis. In the co-occurrence network and subsequent correspondence analysis, 75 of the 95 words with more than 2000 occurrences were included (Appendix B).
Figure 2 demonstrates the accumulated number of firms that mention AI each year and those that mention AI for the first time. The number of newly mentioned firms has gradually decreased, peaking at 414 in 2018. According to Rogers’ theory, earlier adopter firms (innovators and early adopters) account for 16.5% of the total and 33% up to the peak year. For the cumulative number of firms up to the peak year 2018, 47% of the firms mentioned in 2016 were included, representing a large margin of error. However, we used the data as-is because subdividing to the monthly level would create inconsistencies between annual reports with more pages and quarterly reports with fewer pages. Thus, 790 newly mentioned firms in 2017–2018 constitute the early majority, whereas 933 firms out of 1127 newly mentioned firms in 2019–2021 constitute the late majority. Because generative AI may become widespread after 2023, we consider firms that start mentioning AI in 2022 to be laggards. After filtering the data to only the year when each firm began mentioning the innovation, there were a total of 6055 data points. We will perform a corresponding analysis of the text data and four categories of innovator theory.
For co-occurrence network and correspondence analyses, we used KH coder (version 3 Alpha), a popular Japanese text-mining software [45]. KH coder saves the results of co-occurrence network analysis in graphical HTML format, from which we manually translated the Japanese words into English. All correspondence analysis results are saved in csv format and manually translated into English.

4. Result

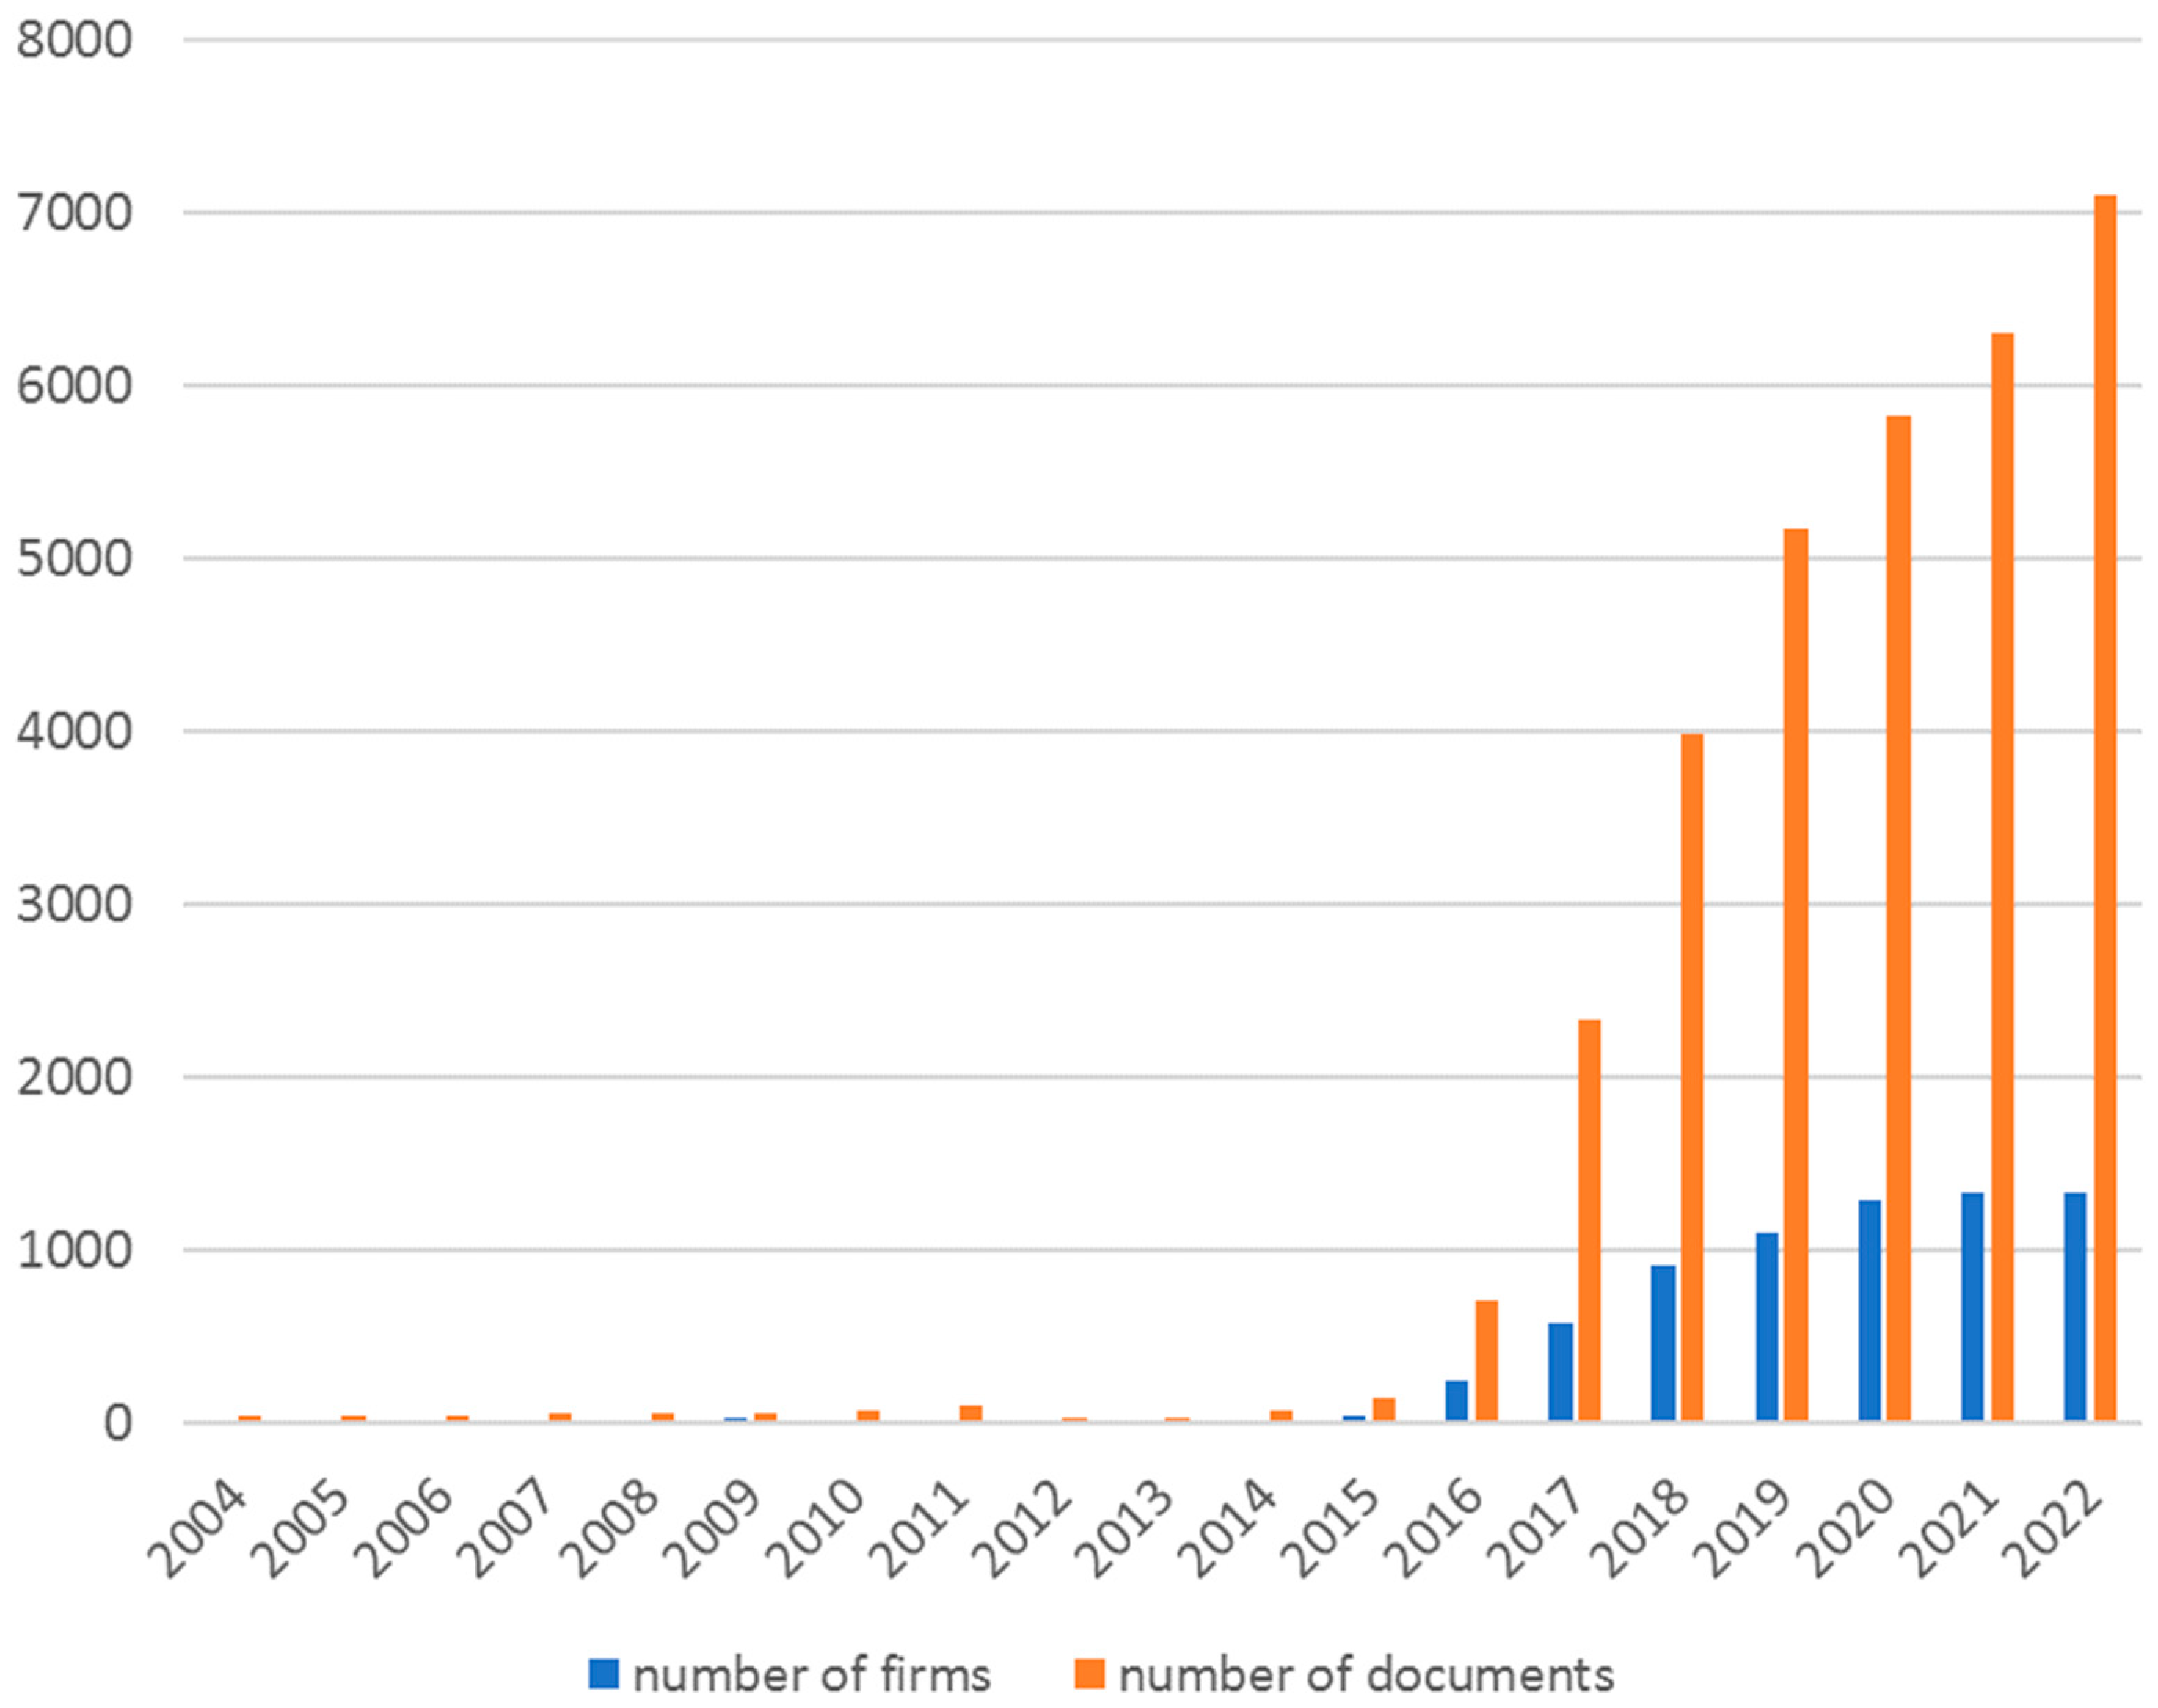
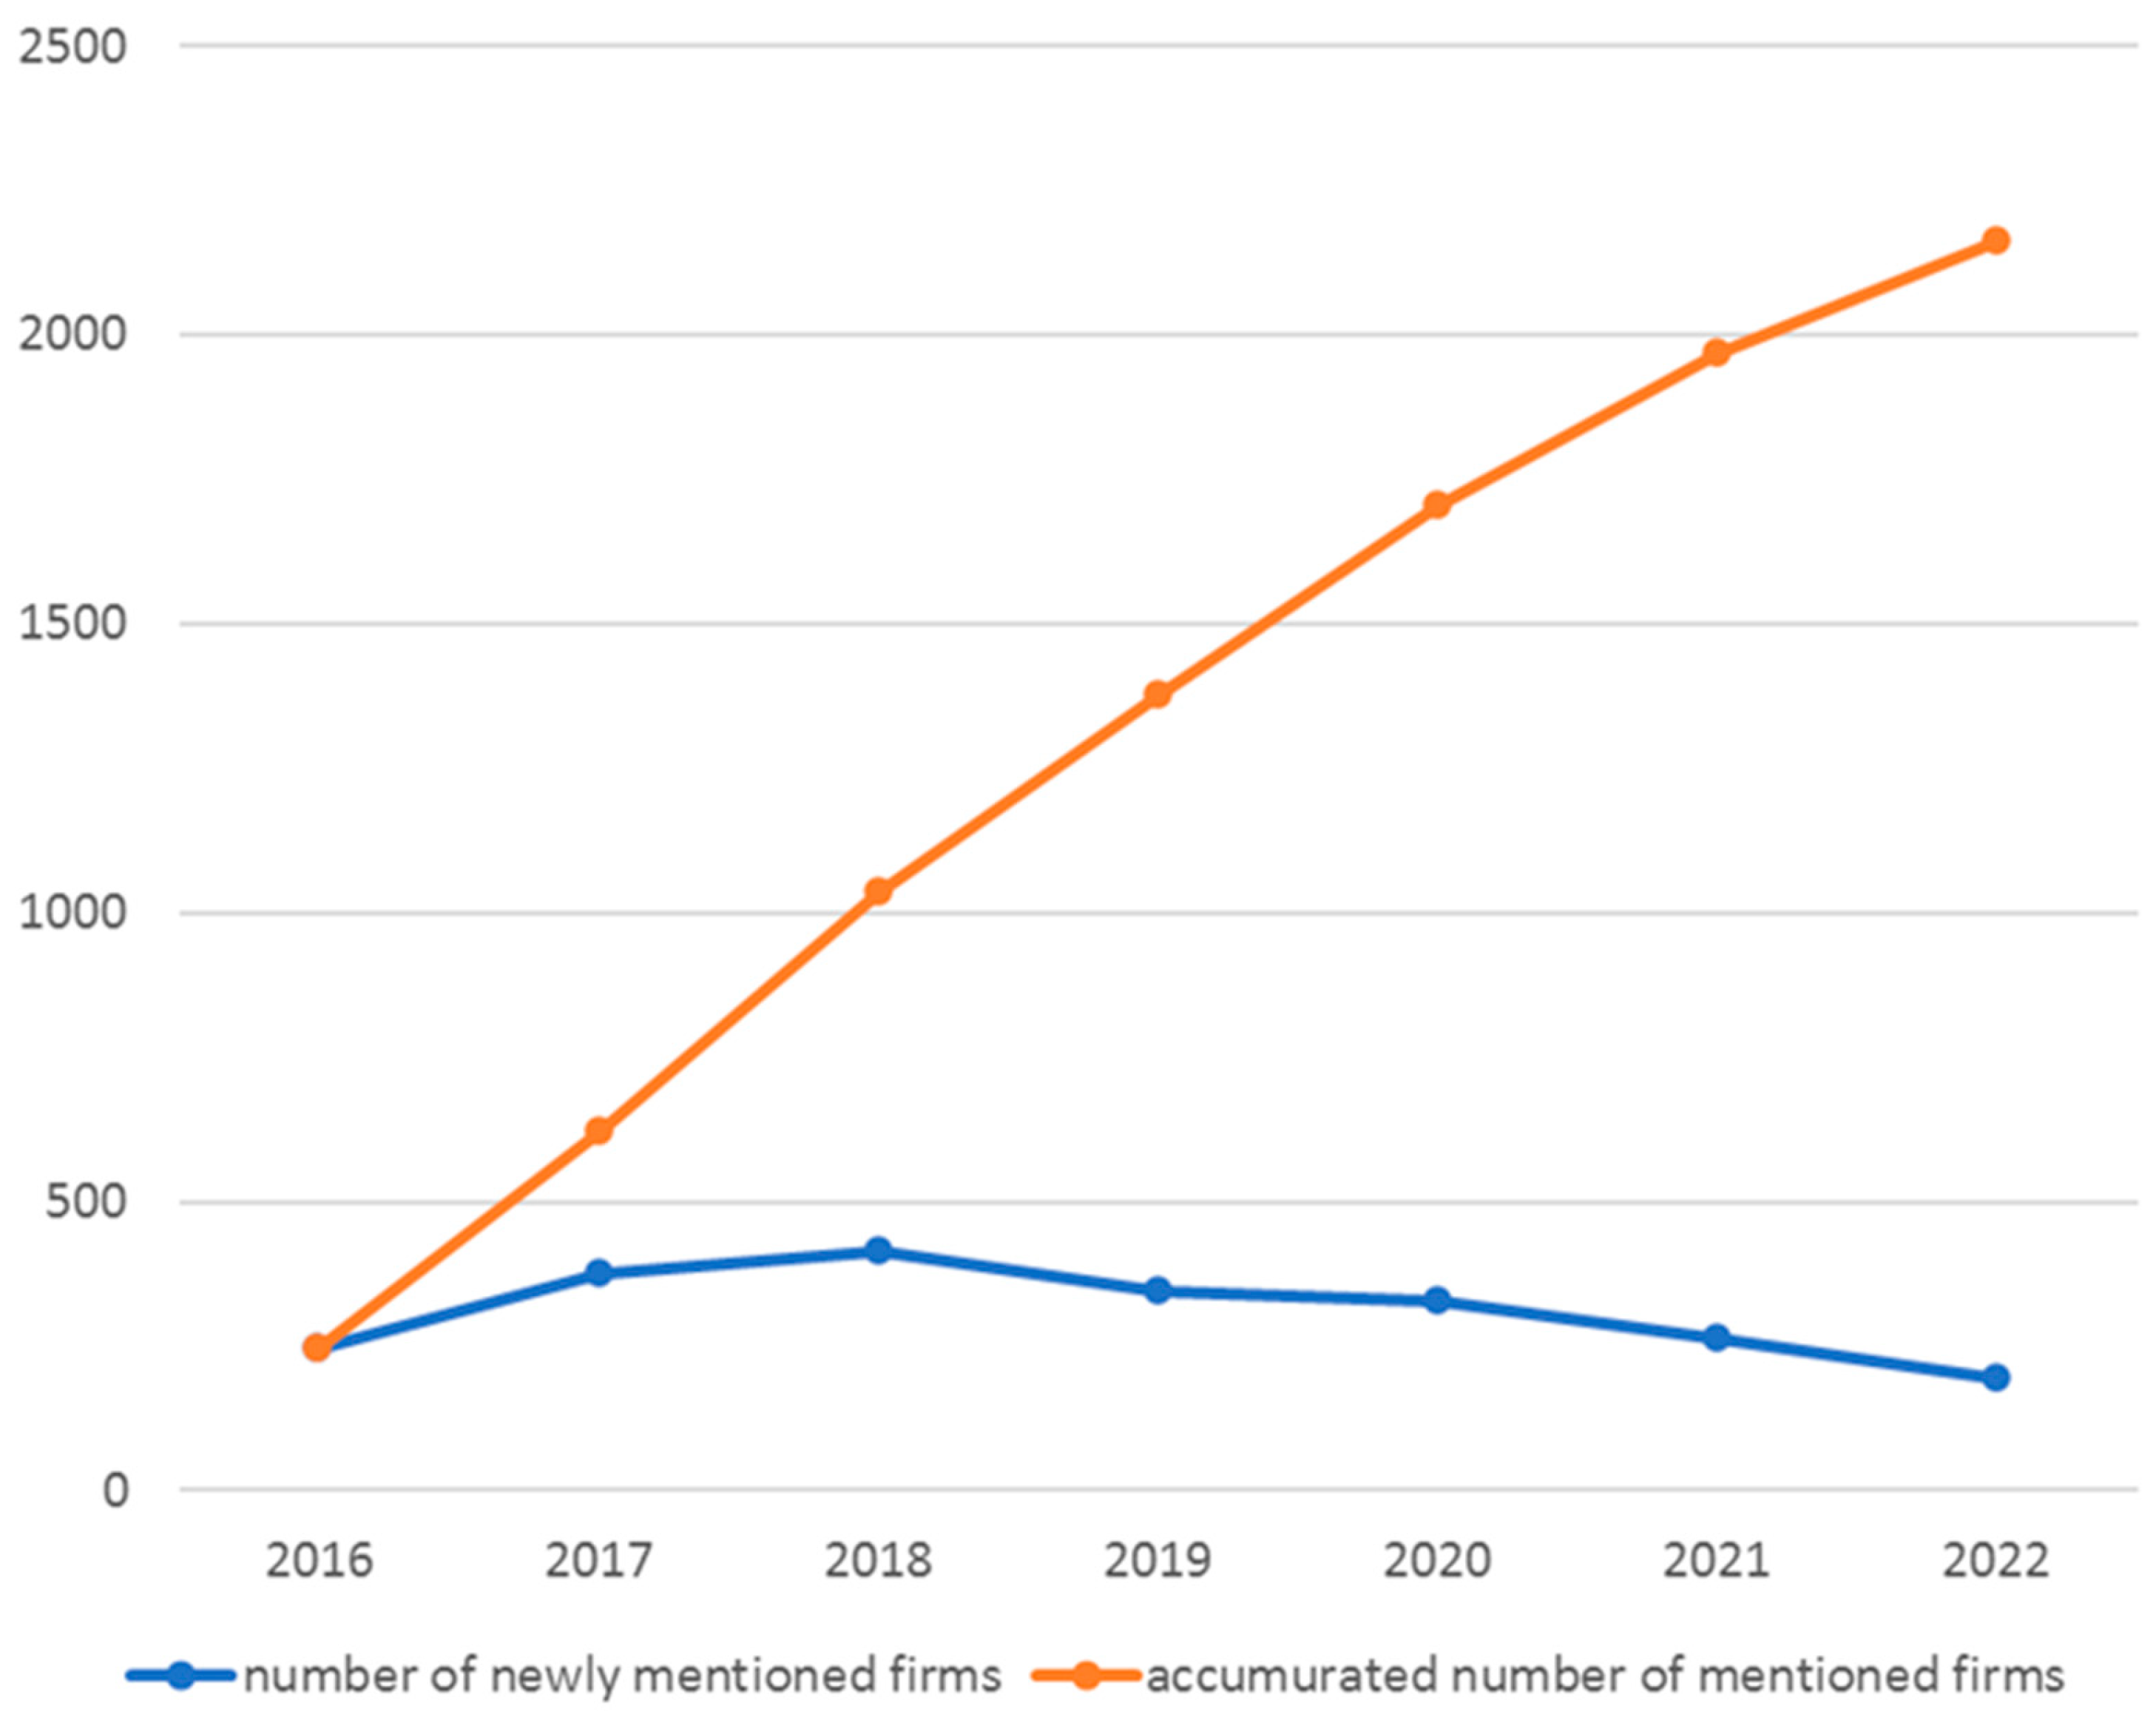
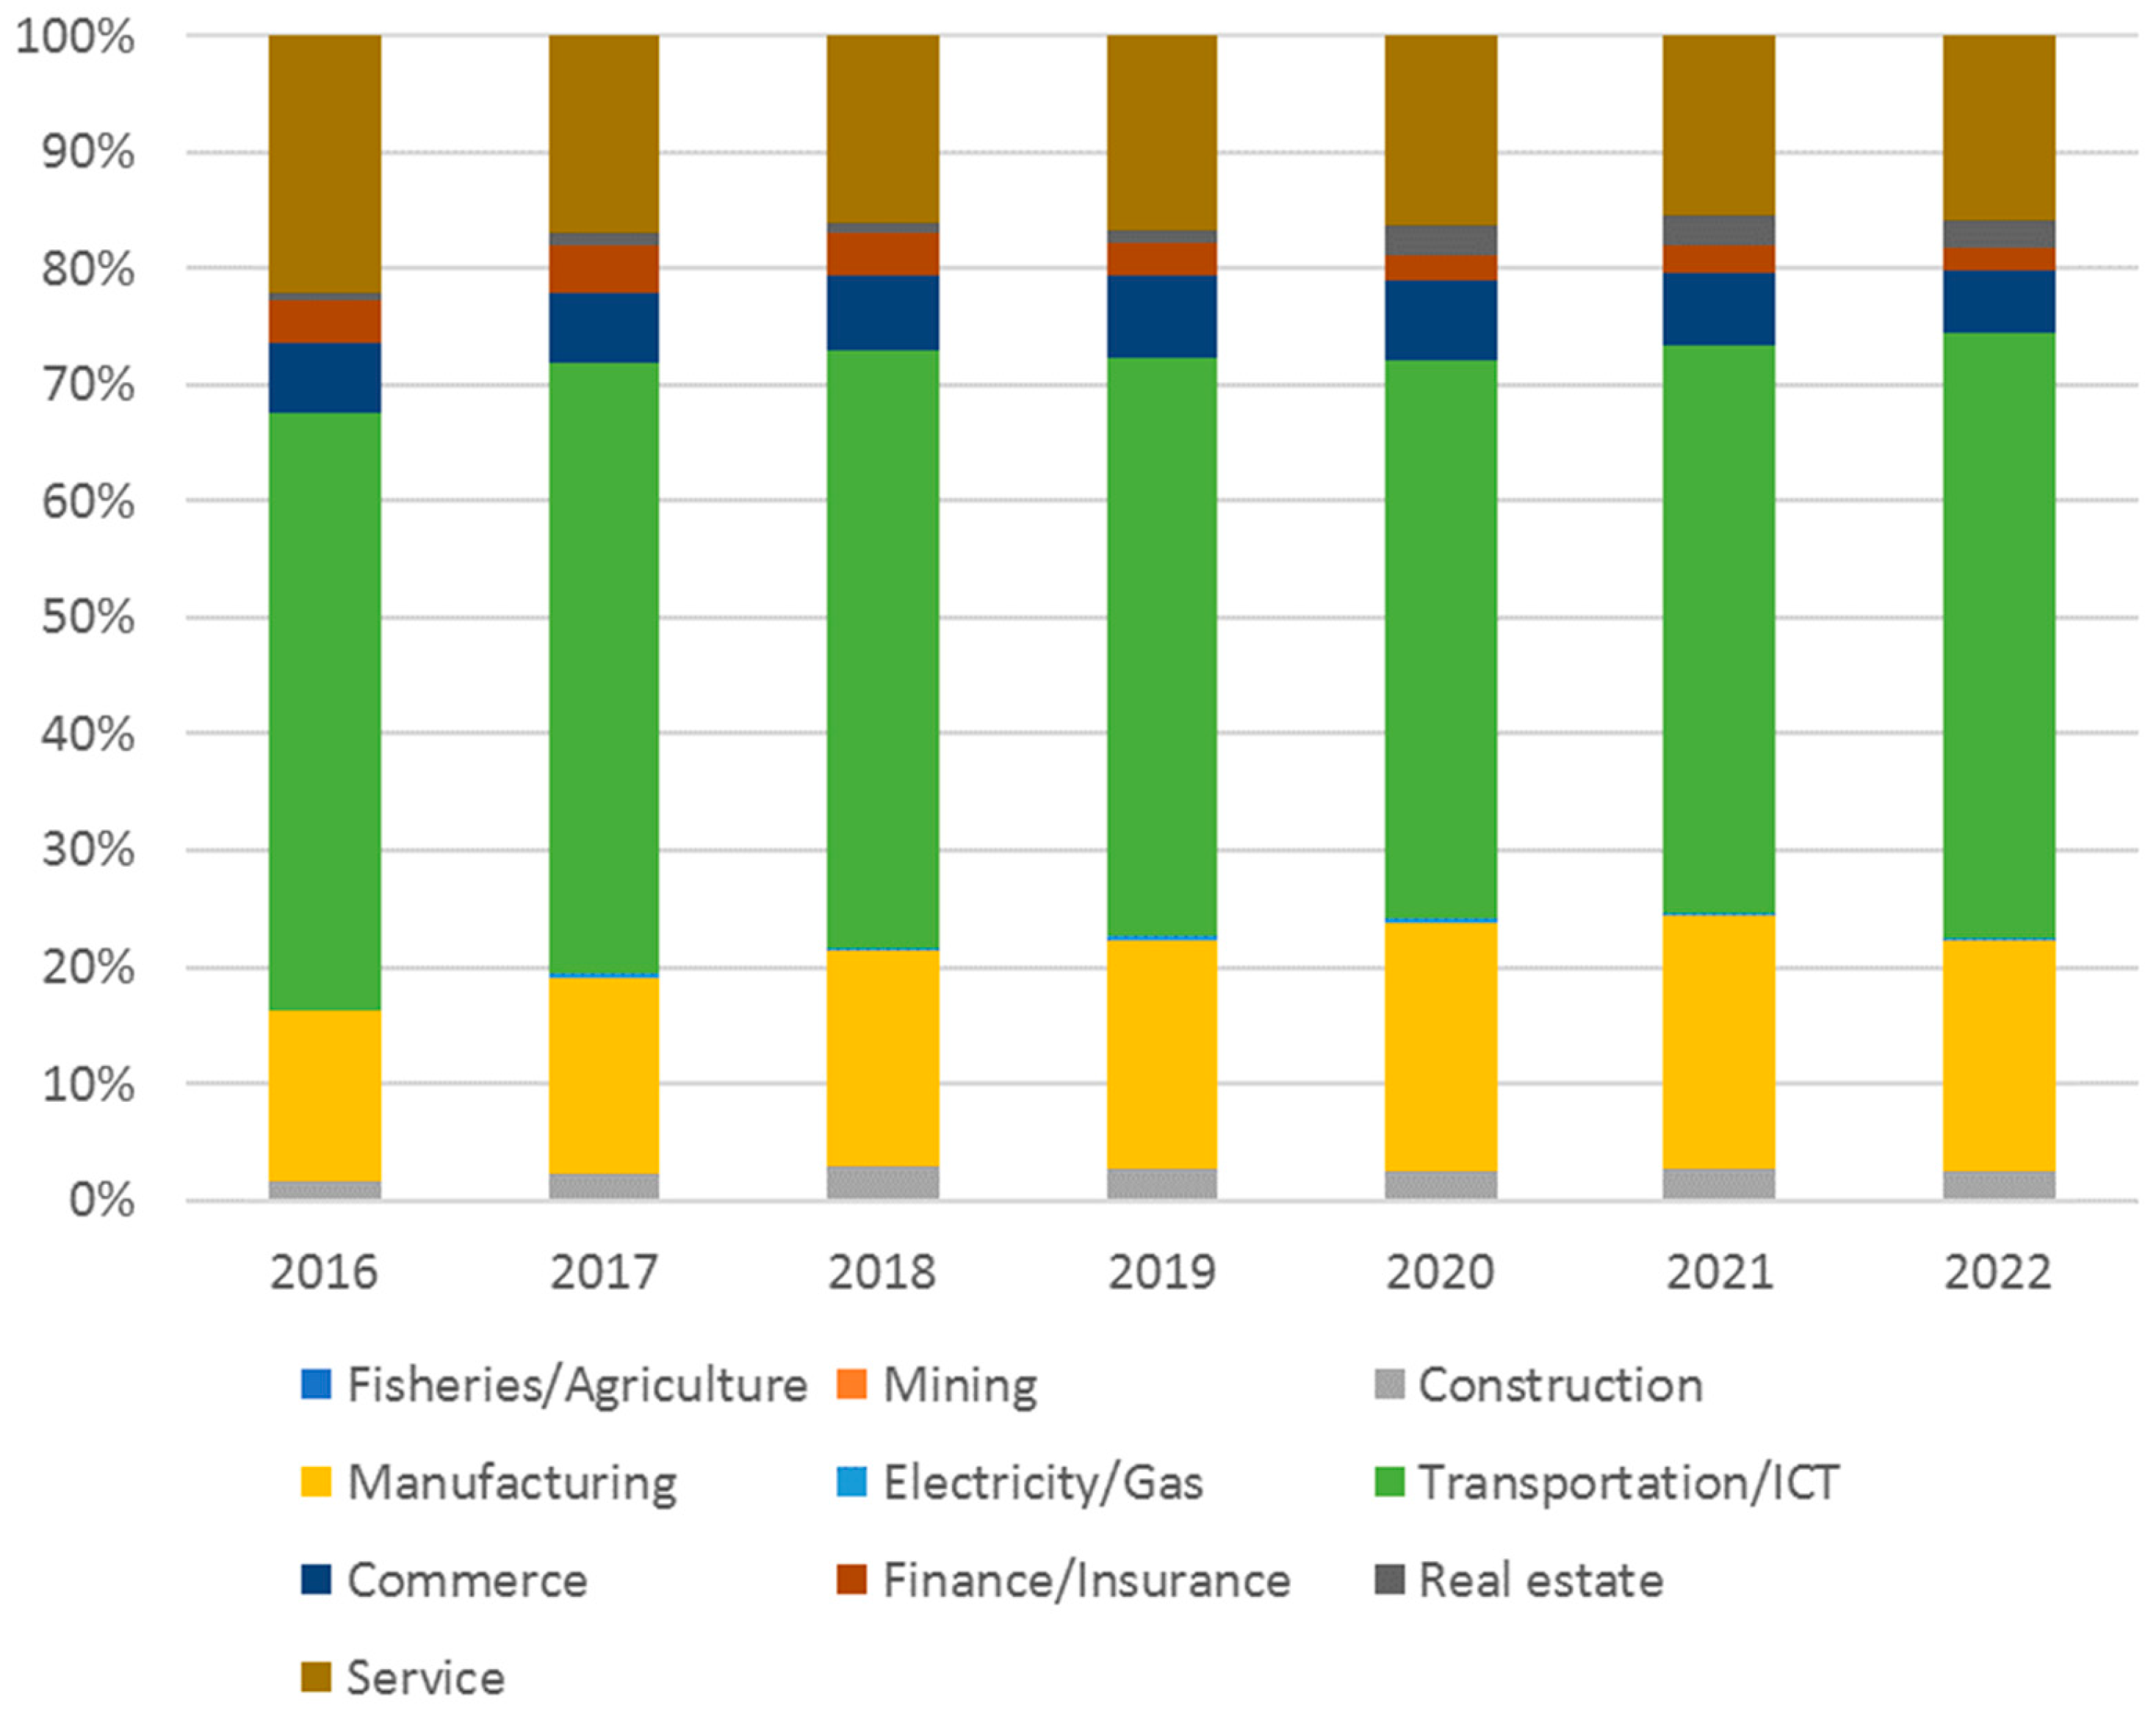
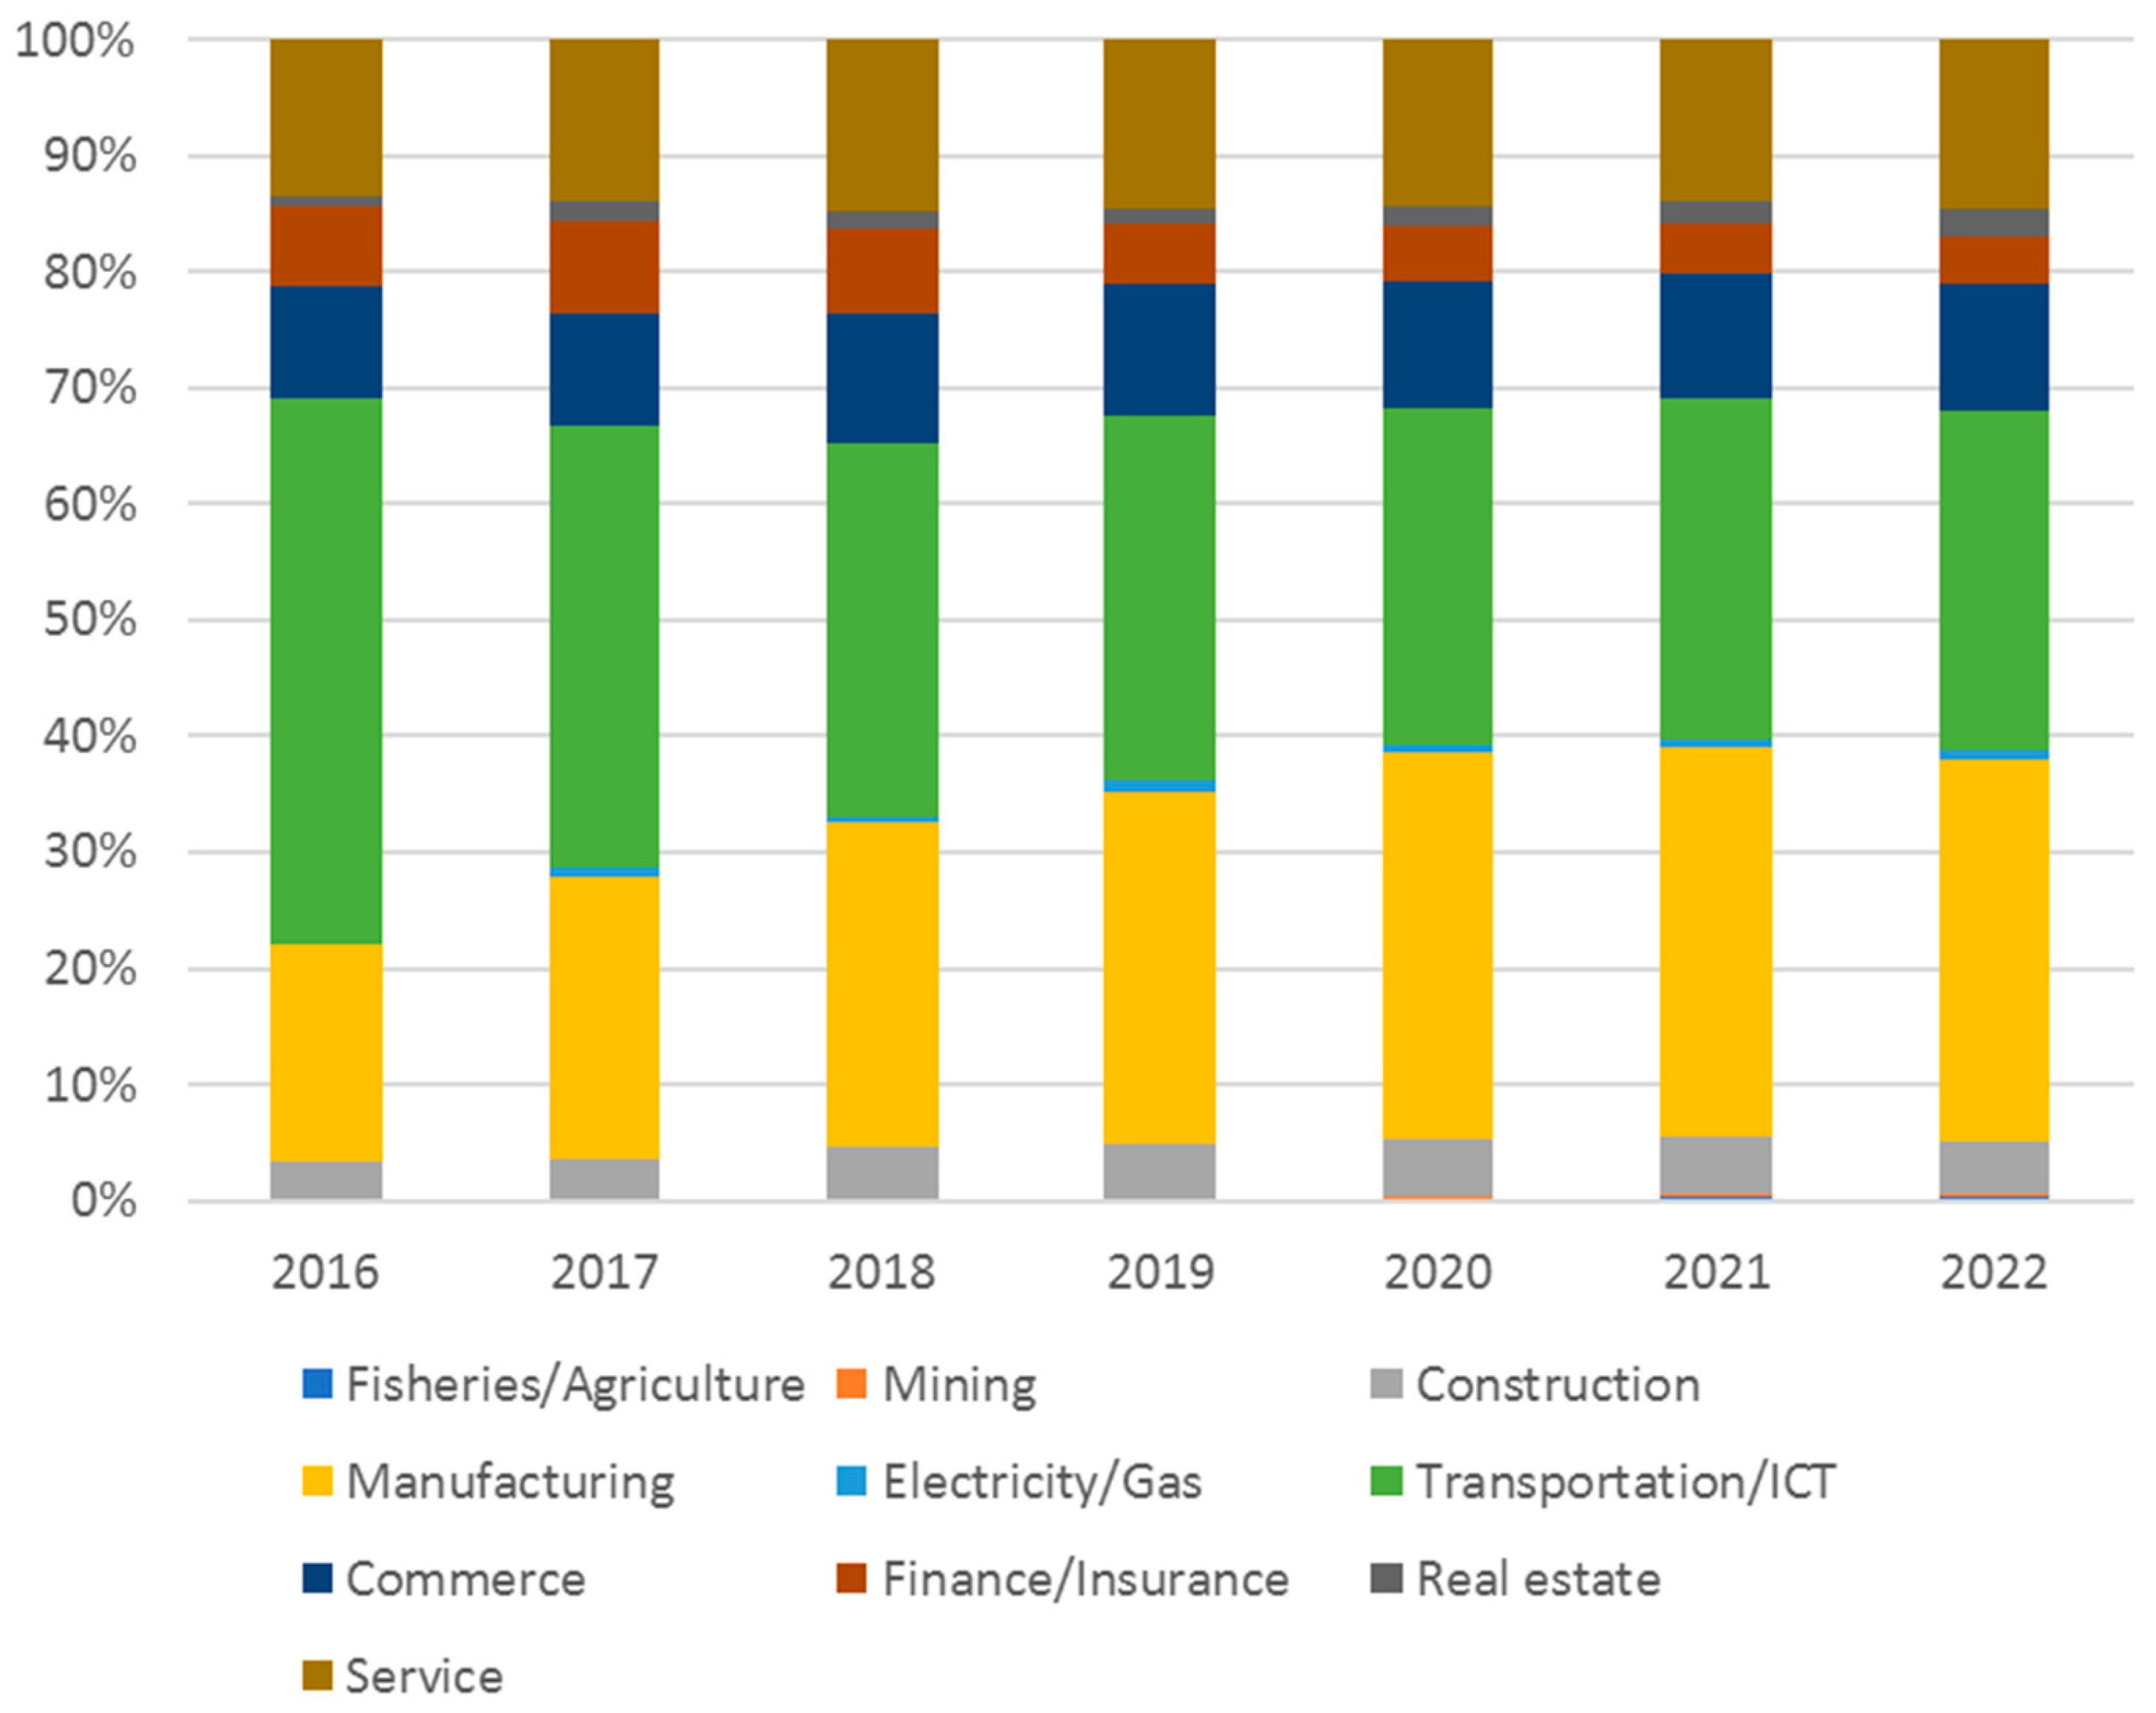
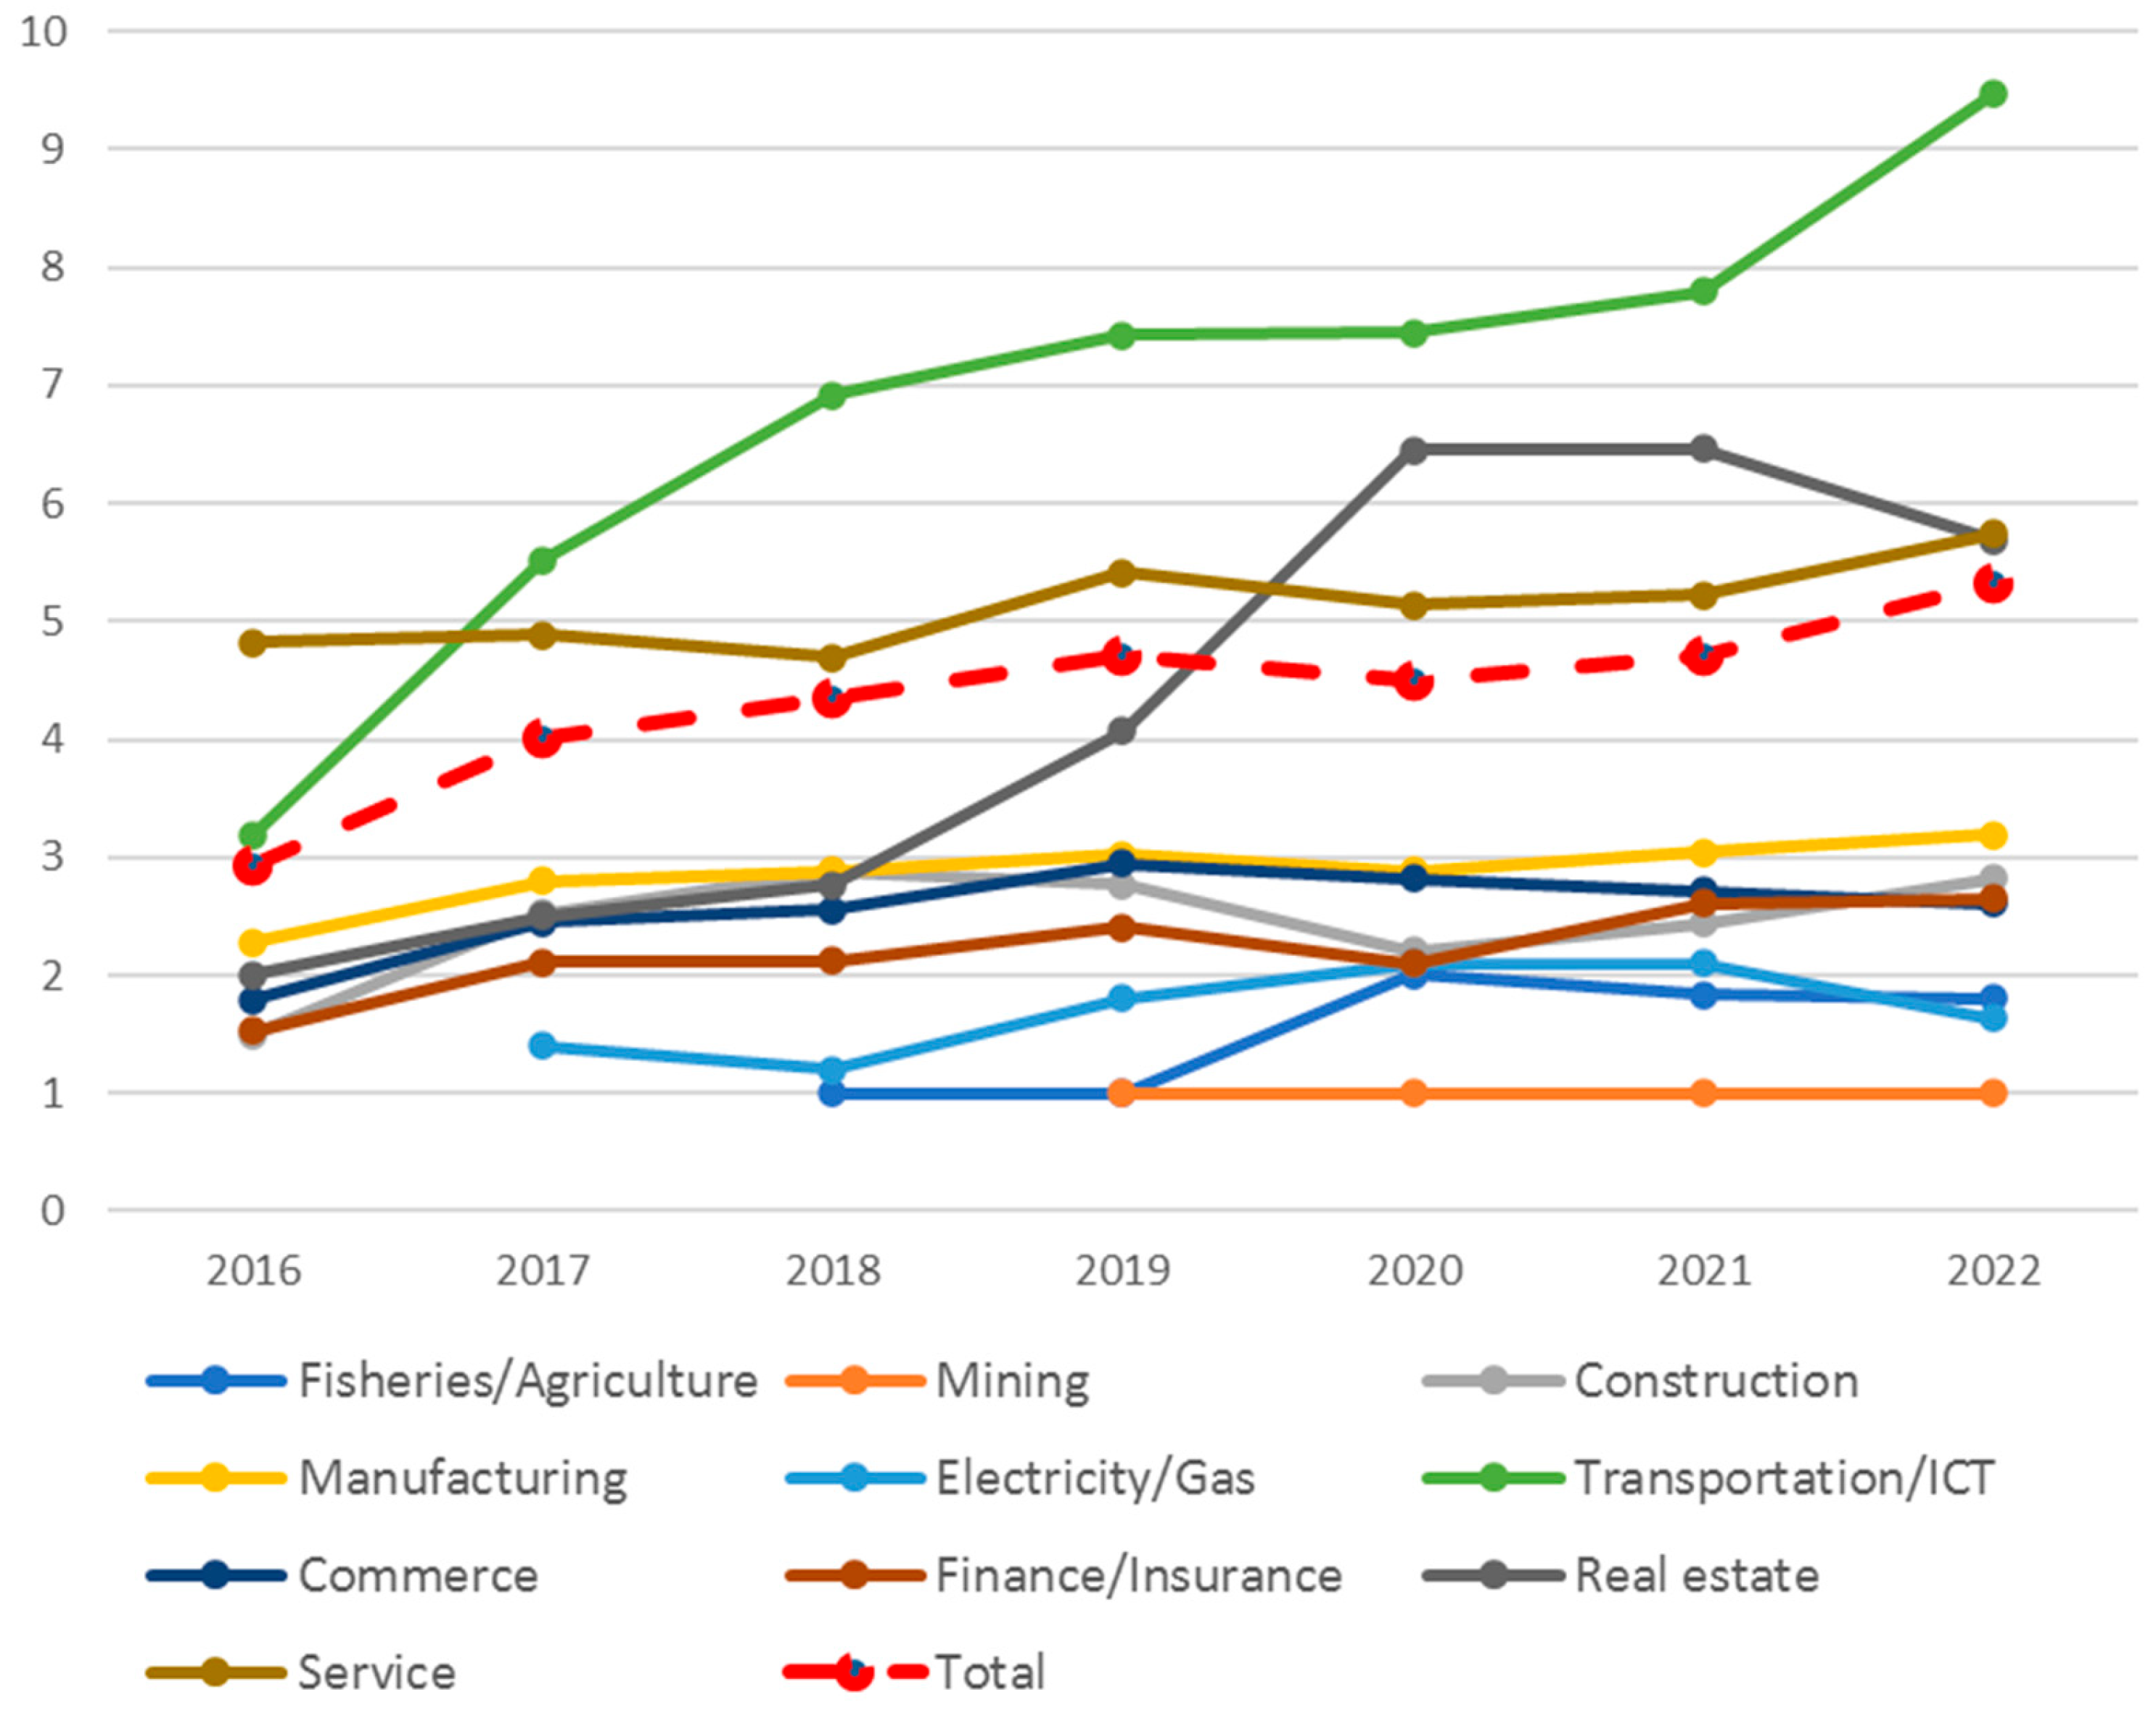
4.1. Descriptive Statistics

Figure 3 shows the percentage of documents mentioned by industry. Three industries, transportation/ICT, manufacturing, and services, account for approximately 85% of the total data. The remaining seven industries represent approximately 15% of the total. The data breakdown indicates that the transportation/ICT industry accounts for more than 50%, the manufacturing industry has increased to approximately 20% since 2016, and the service industry represents approximately 15%, indicating that the proportion of these industries has remained stable.
Figure 4 plots the number of firms by industry. Although the number of firms in the finance and insurance industry declined slightly between 2021 and 2022, the number of firms in other industries rose. The transportation/ICT sector represented 46.9% of the total in 2016 but less than 30% in 2022. The most notable expansion occurred in the manufacturing industry, where the percentage increased from 18.8% to 32.8% between 2016 and 2022. Other industries generally remained unchanged. This indicates that the transportation/ICT industry initially focused on AI, and the manufacturing industry eventually took notice.
Figure 5 illustrates the annual number of documents per firm, which increased moderately from an average of 2.9 in 2016 to 5.3 in 2022. The transportation/ICT industry stands out, with nearly three times more mentions of AI than the other industries, from an average of 3.2 in 2016 to 9.5 in 2022. The next most prominent industry is real estate, which has seen an increase in AI mentions since 2019 and is second only to the transportation/ICT industry between 2020 and 2021. Meanwhile, the average number of mentions in the manufacturing industry has remained stable at around 3.0.
We then conducted an independence test to determine whether there is a correlation between the number of firms per industry and the number of documents disclosed in 2022. The result of the analysis was χ2 = 216.12 with p < 0.01. The residual analysis revealed that more firms in the transportation/ICT industry mentioned AI than expected (p < 0.01), while fewer finance/commerce/manufacturing firms mentioned AI than expected (p < 0.01), suggesting that the accumulated poles of AI mentions vary by industry.

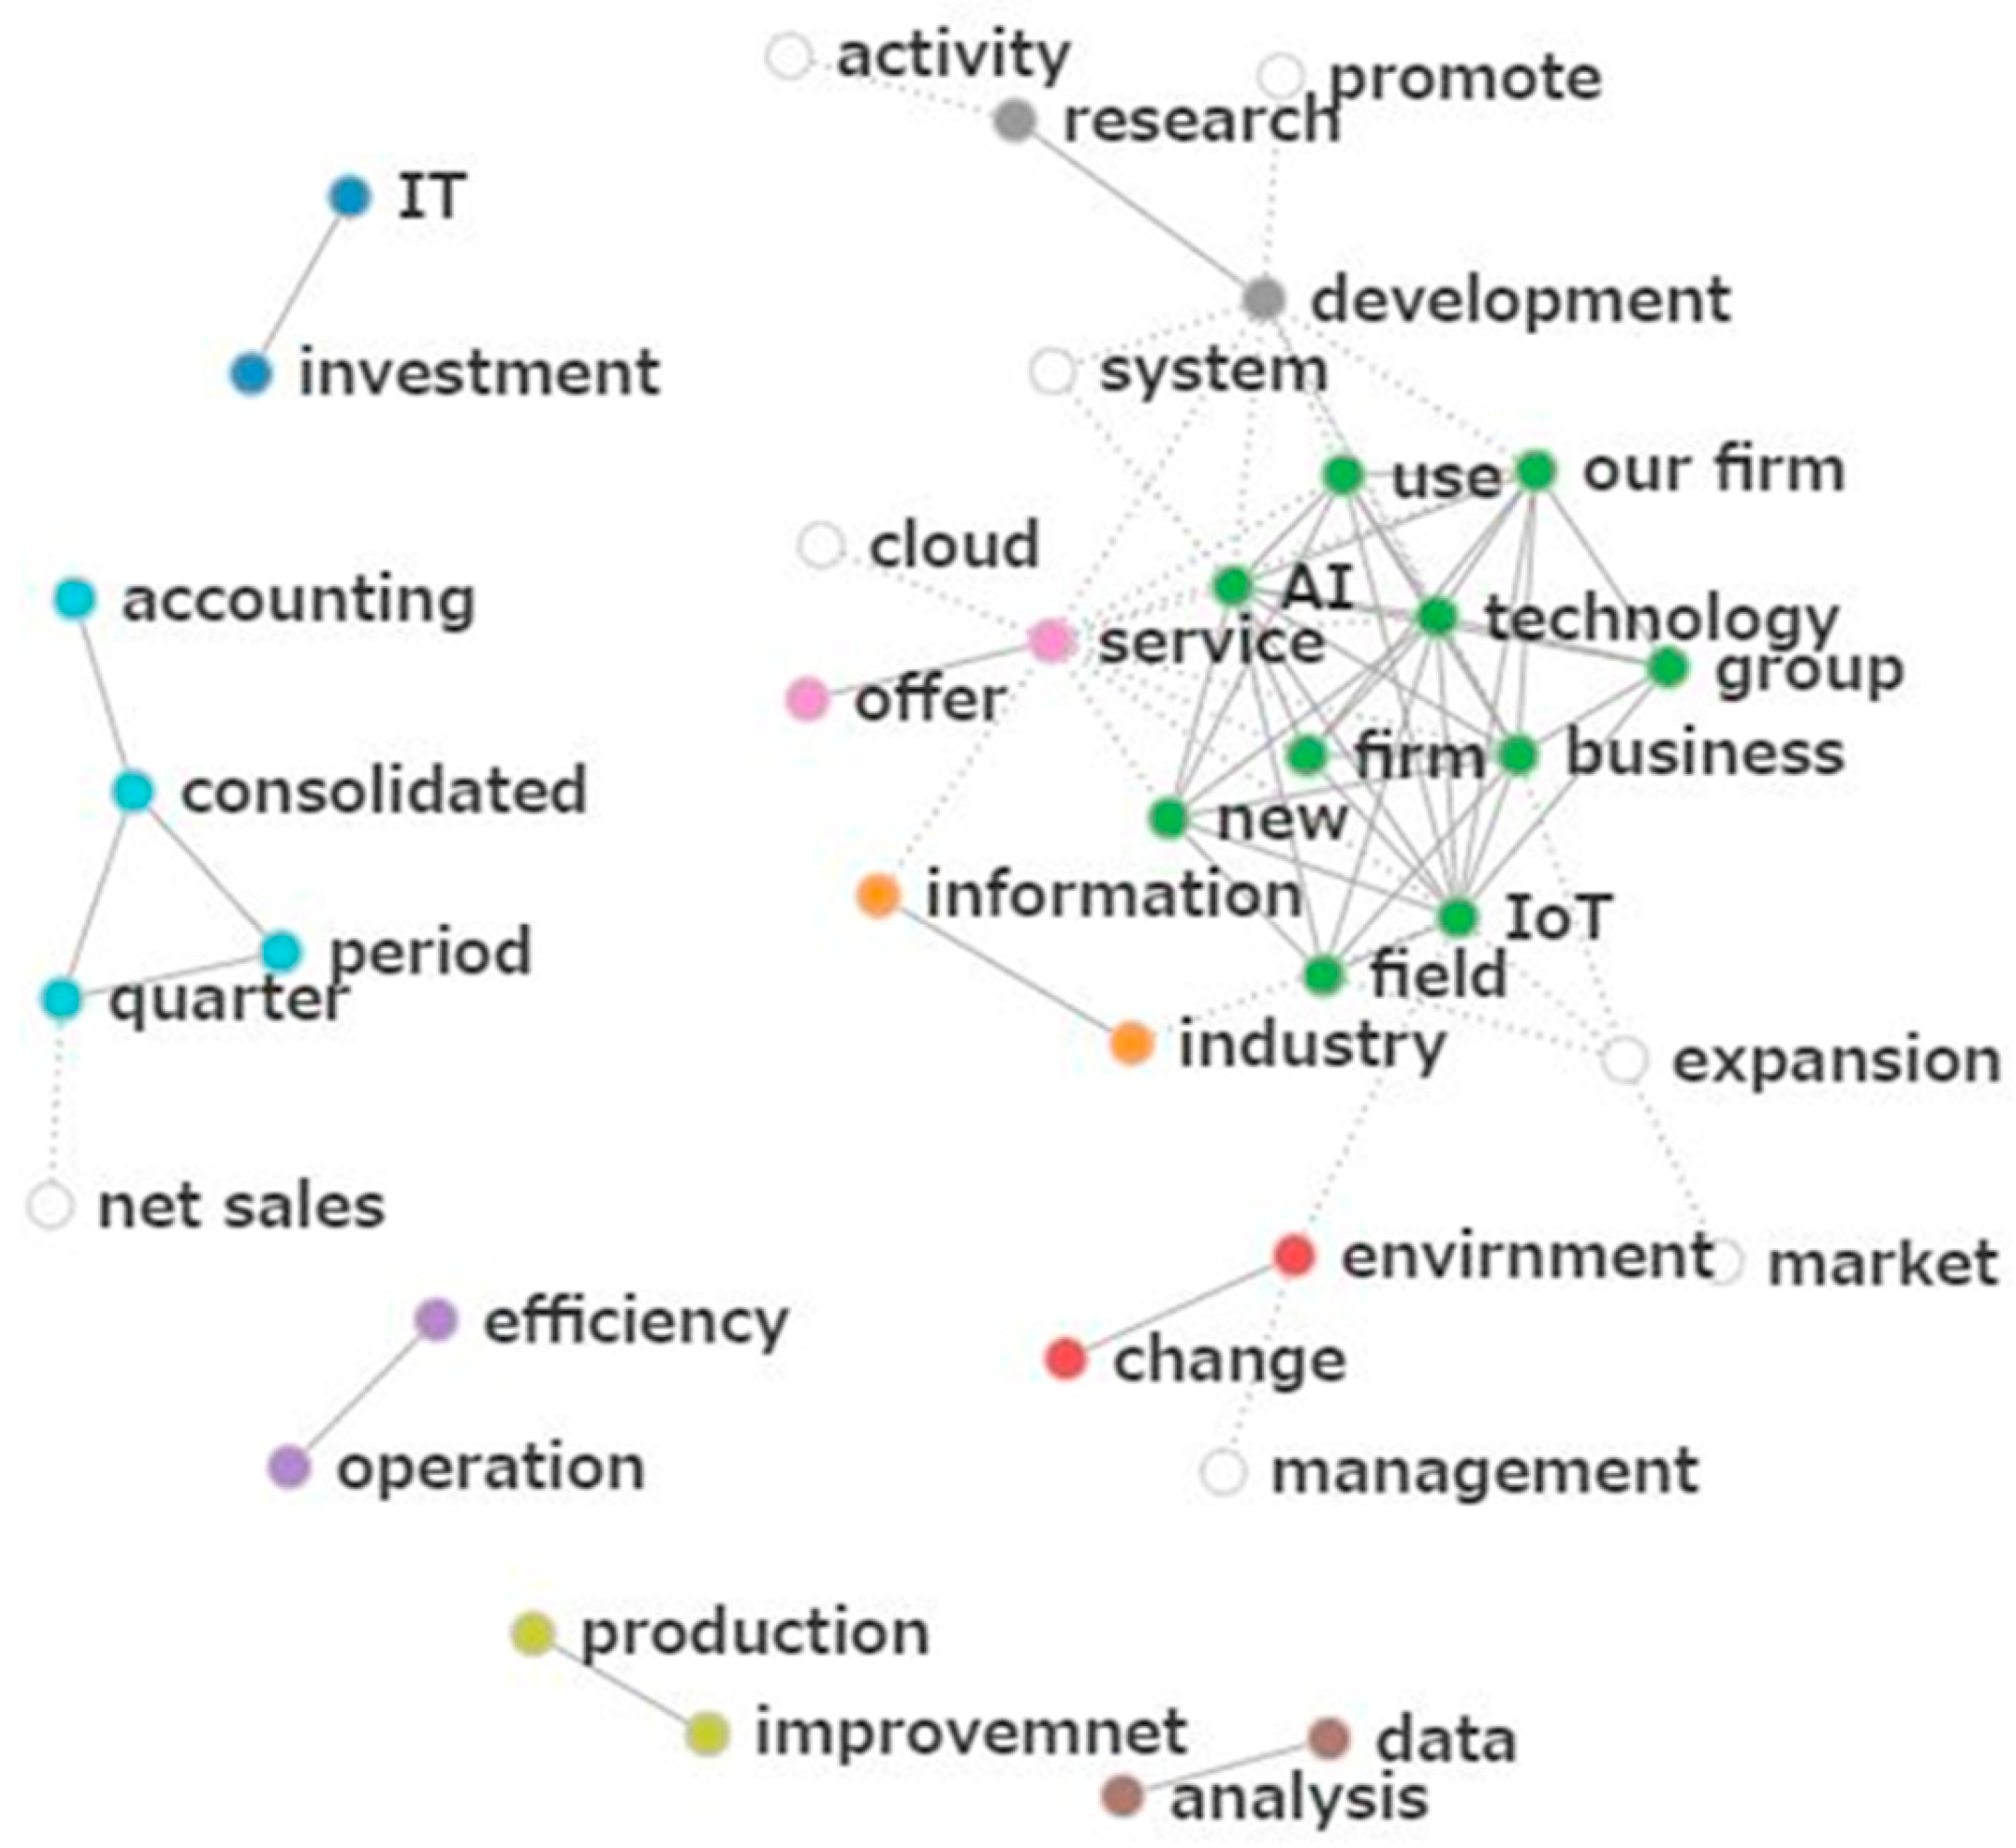
4.2. Co-Occurrence Network Analysis

Figure 6 shows the results of the co-occurrence network analysis using data from all industries for all time periods. The words are divided into several groups. The overall result indicates that during a changing business environment (red), a group uses AI to conduct new business (green) in the information industry (orange). We aim to analyze data (brown), conduct R&D (gray), provide new services (pink), improve operational efficiency (purple), and increase productivity (yellow). As a result, they achieved financial results in consolidated accounting (light blue).
Thus, we interpret that firms are aware of AI-related environmental changes and are advancing R&D to produce business results in response to these environmental changes.

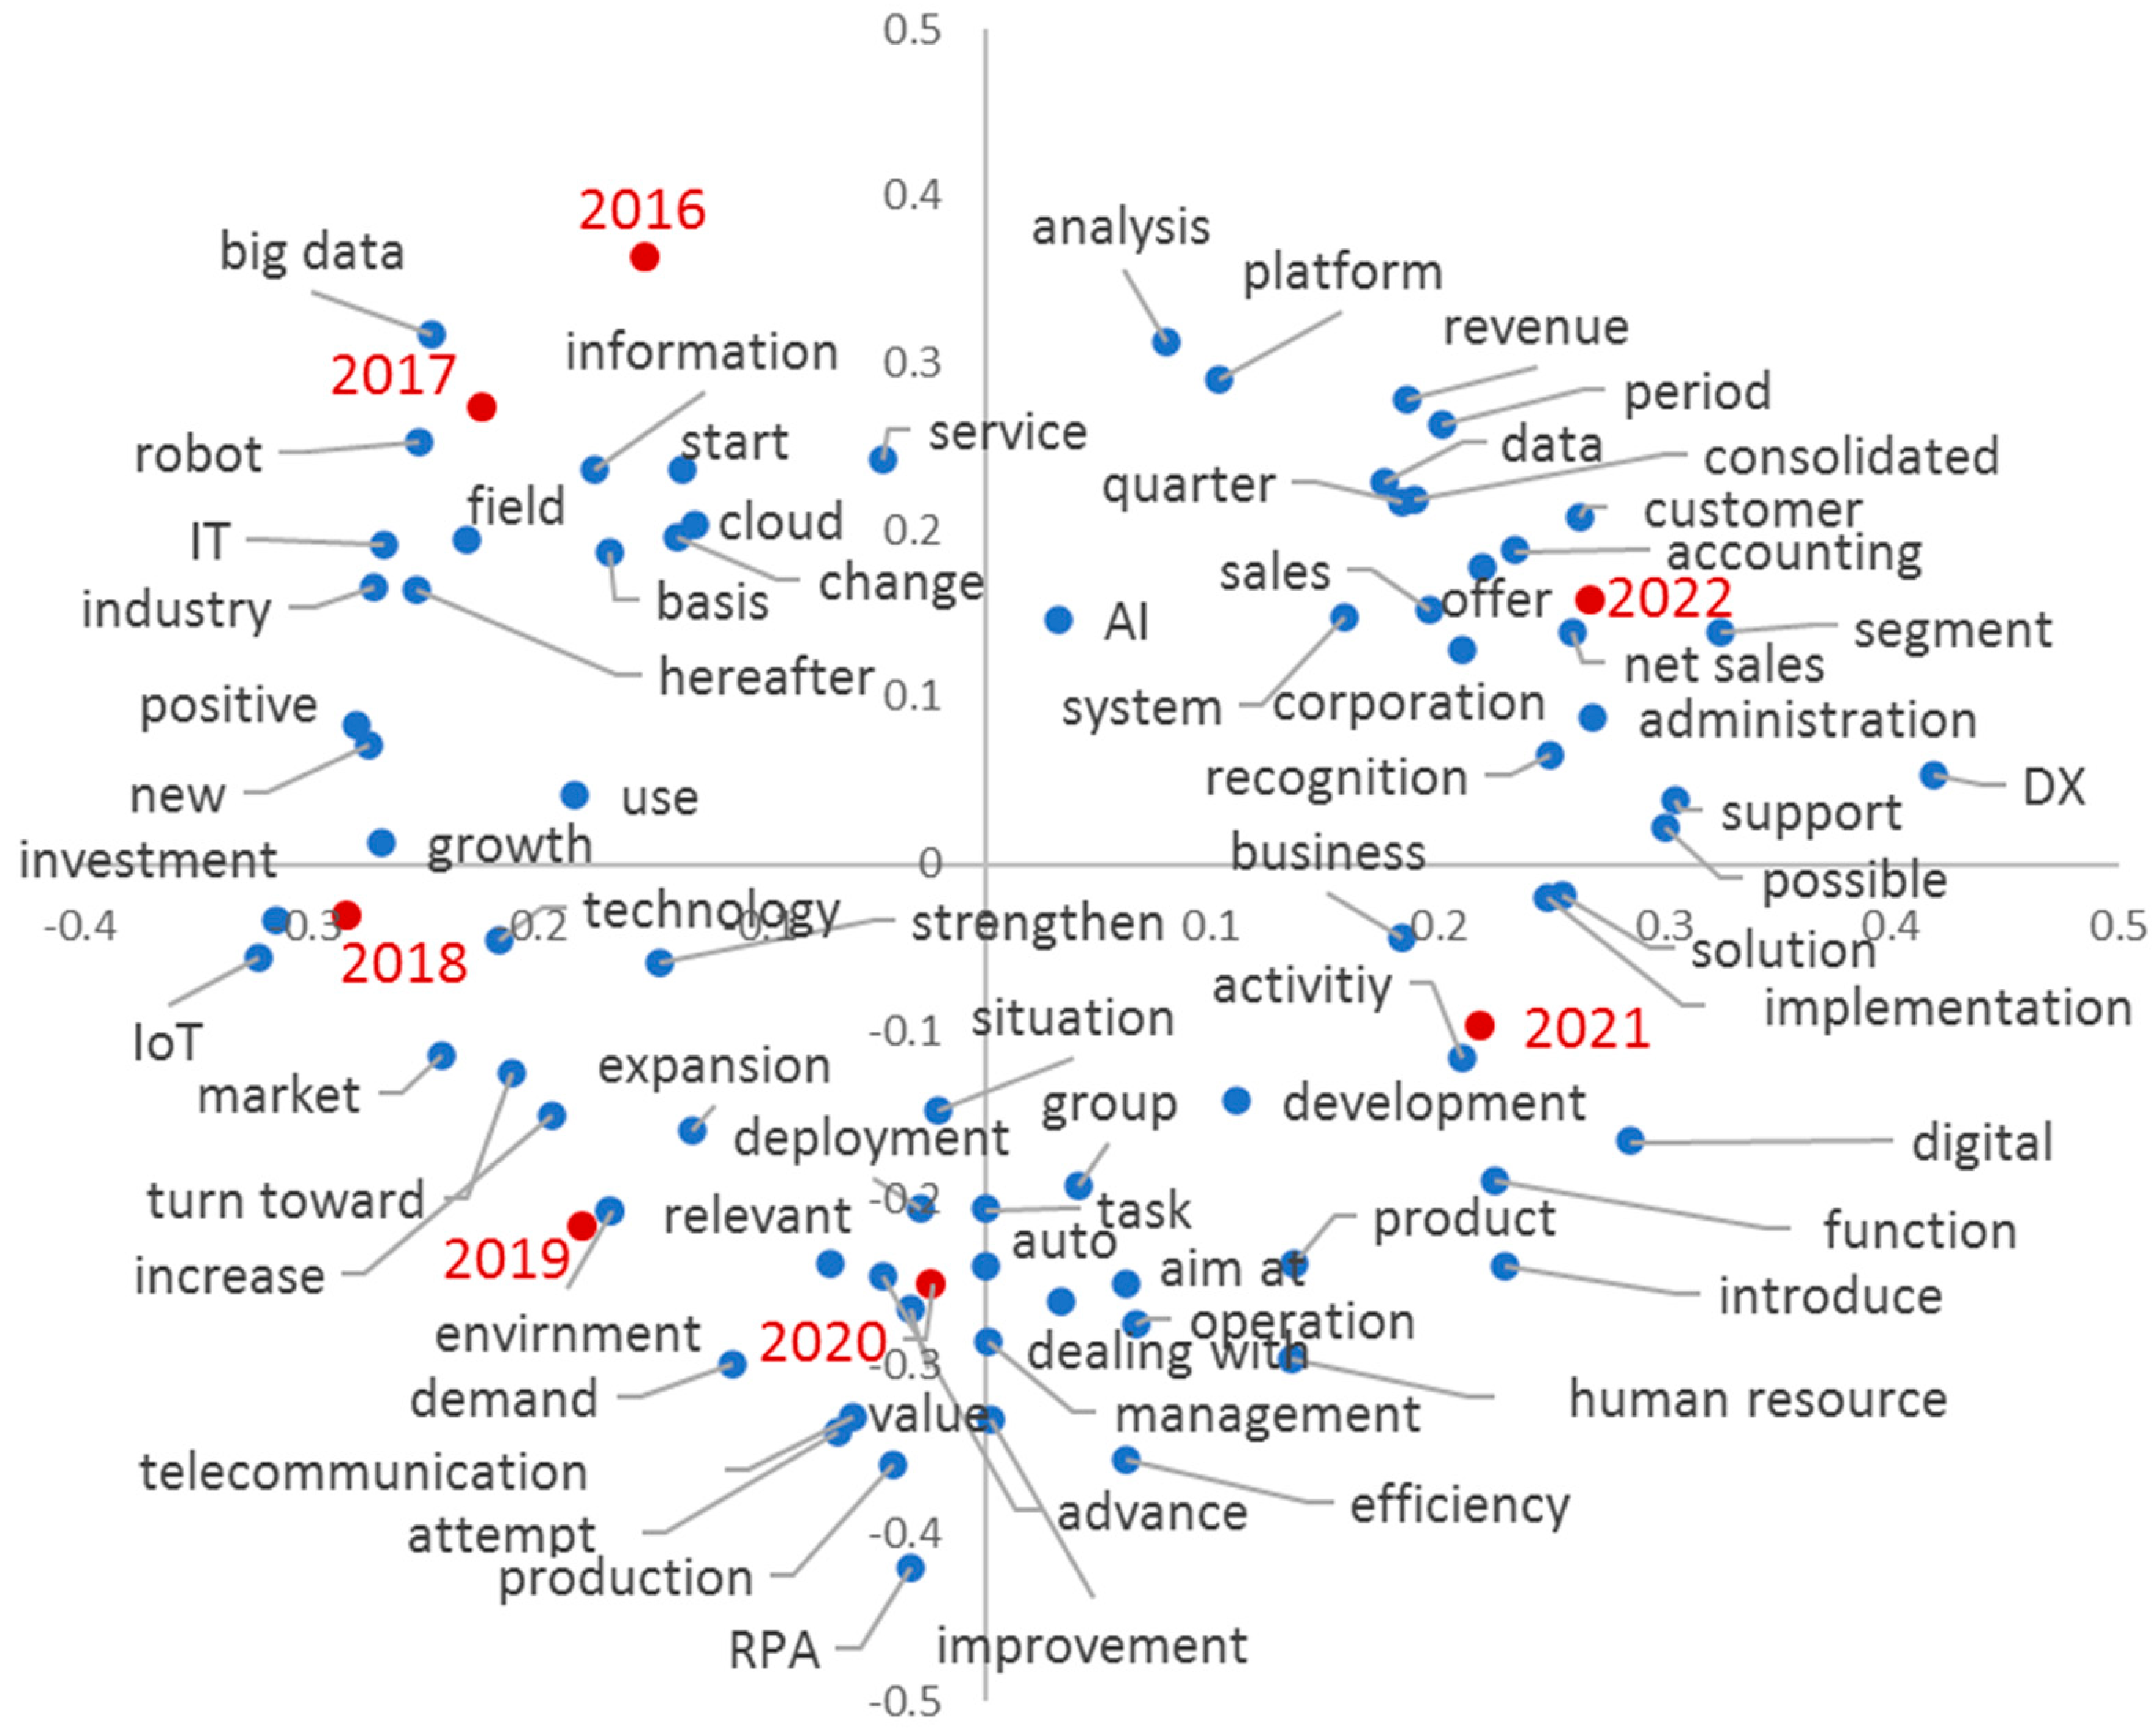
4.3. Correspondence Analysis

4.3.1. Time-Series Analysis

Figure 7 demonstrates the correspondence analysis results for the entire period, starting from the second quadrant in 2016, moving counterclockwise, and reaching the first quadrant in 2022. The period 2016–2017 was surrounded by important future technologies related to “big data”, “cloud”, and “robots”; thus, this period is categorized as the recognition stage. Meanwhile, 2018 is more closely associated with the terms “new”, “growth”, “positive”, and “investment”. It is now considered that AI has been recognized independently among related technologies and has become a unique area to invest in; thus, this period is called the investment stage. The period 2019–2020 is the stage of incorporation into strategy; accordingly, the terms “environment”, “expansion”, and “increase” are mentioned in 2019, whereas “management”, “group”, “value”, and “deployment” dominate in 2020. This indicates that the perception of AI evolved to be integrated into business strategies in response to the environmental change underlying AI expansion. A group response policy is evident. Simultaneously, the terms “operations”, “RPA”, “production”, and “efficiency” are close to one another. Accordingly, it can be stated that AI technology will be used to improve production efficiency to achieve AI-related strategies. This period is called the strategization stage.
The 2021–2022 period can be considered the commercialization and monetization stage. In 2021, the terms “business”, “development”, and “implementation” were prominent, indicating that AI business was being implemented. In 2022, the words “sales”, “segment”, “revenue”, and “accounting” were dominant, reflecting the commitment to using AI in accounting results.
In summary, integrating AI technology into business structures involves the process of the recognition, investment, strategization, commercialization, and monetization stages, as depicted in Figure 8.

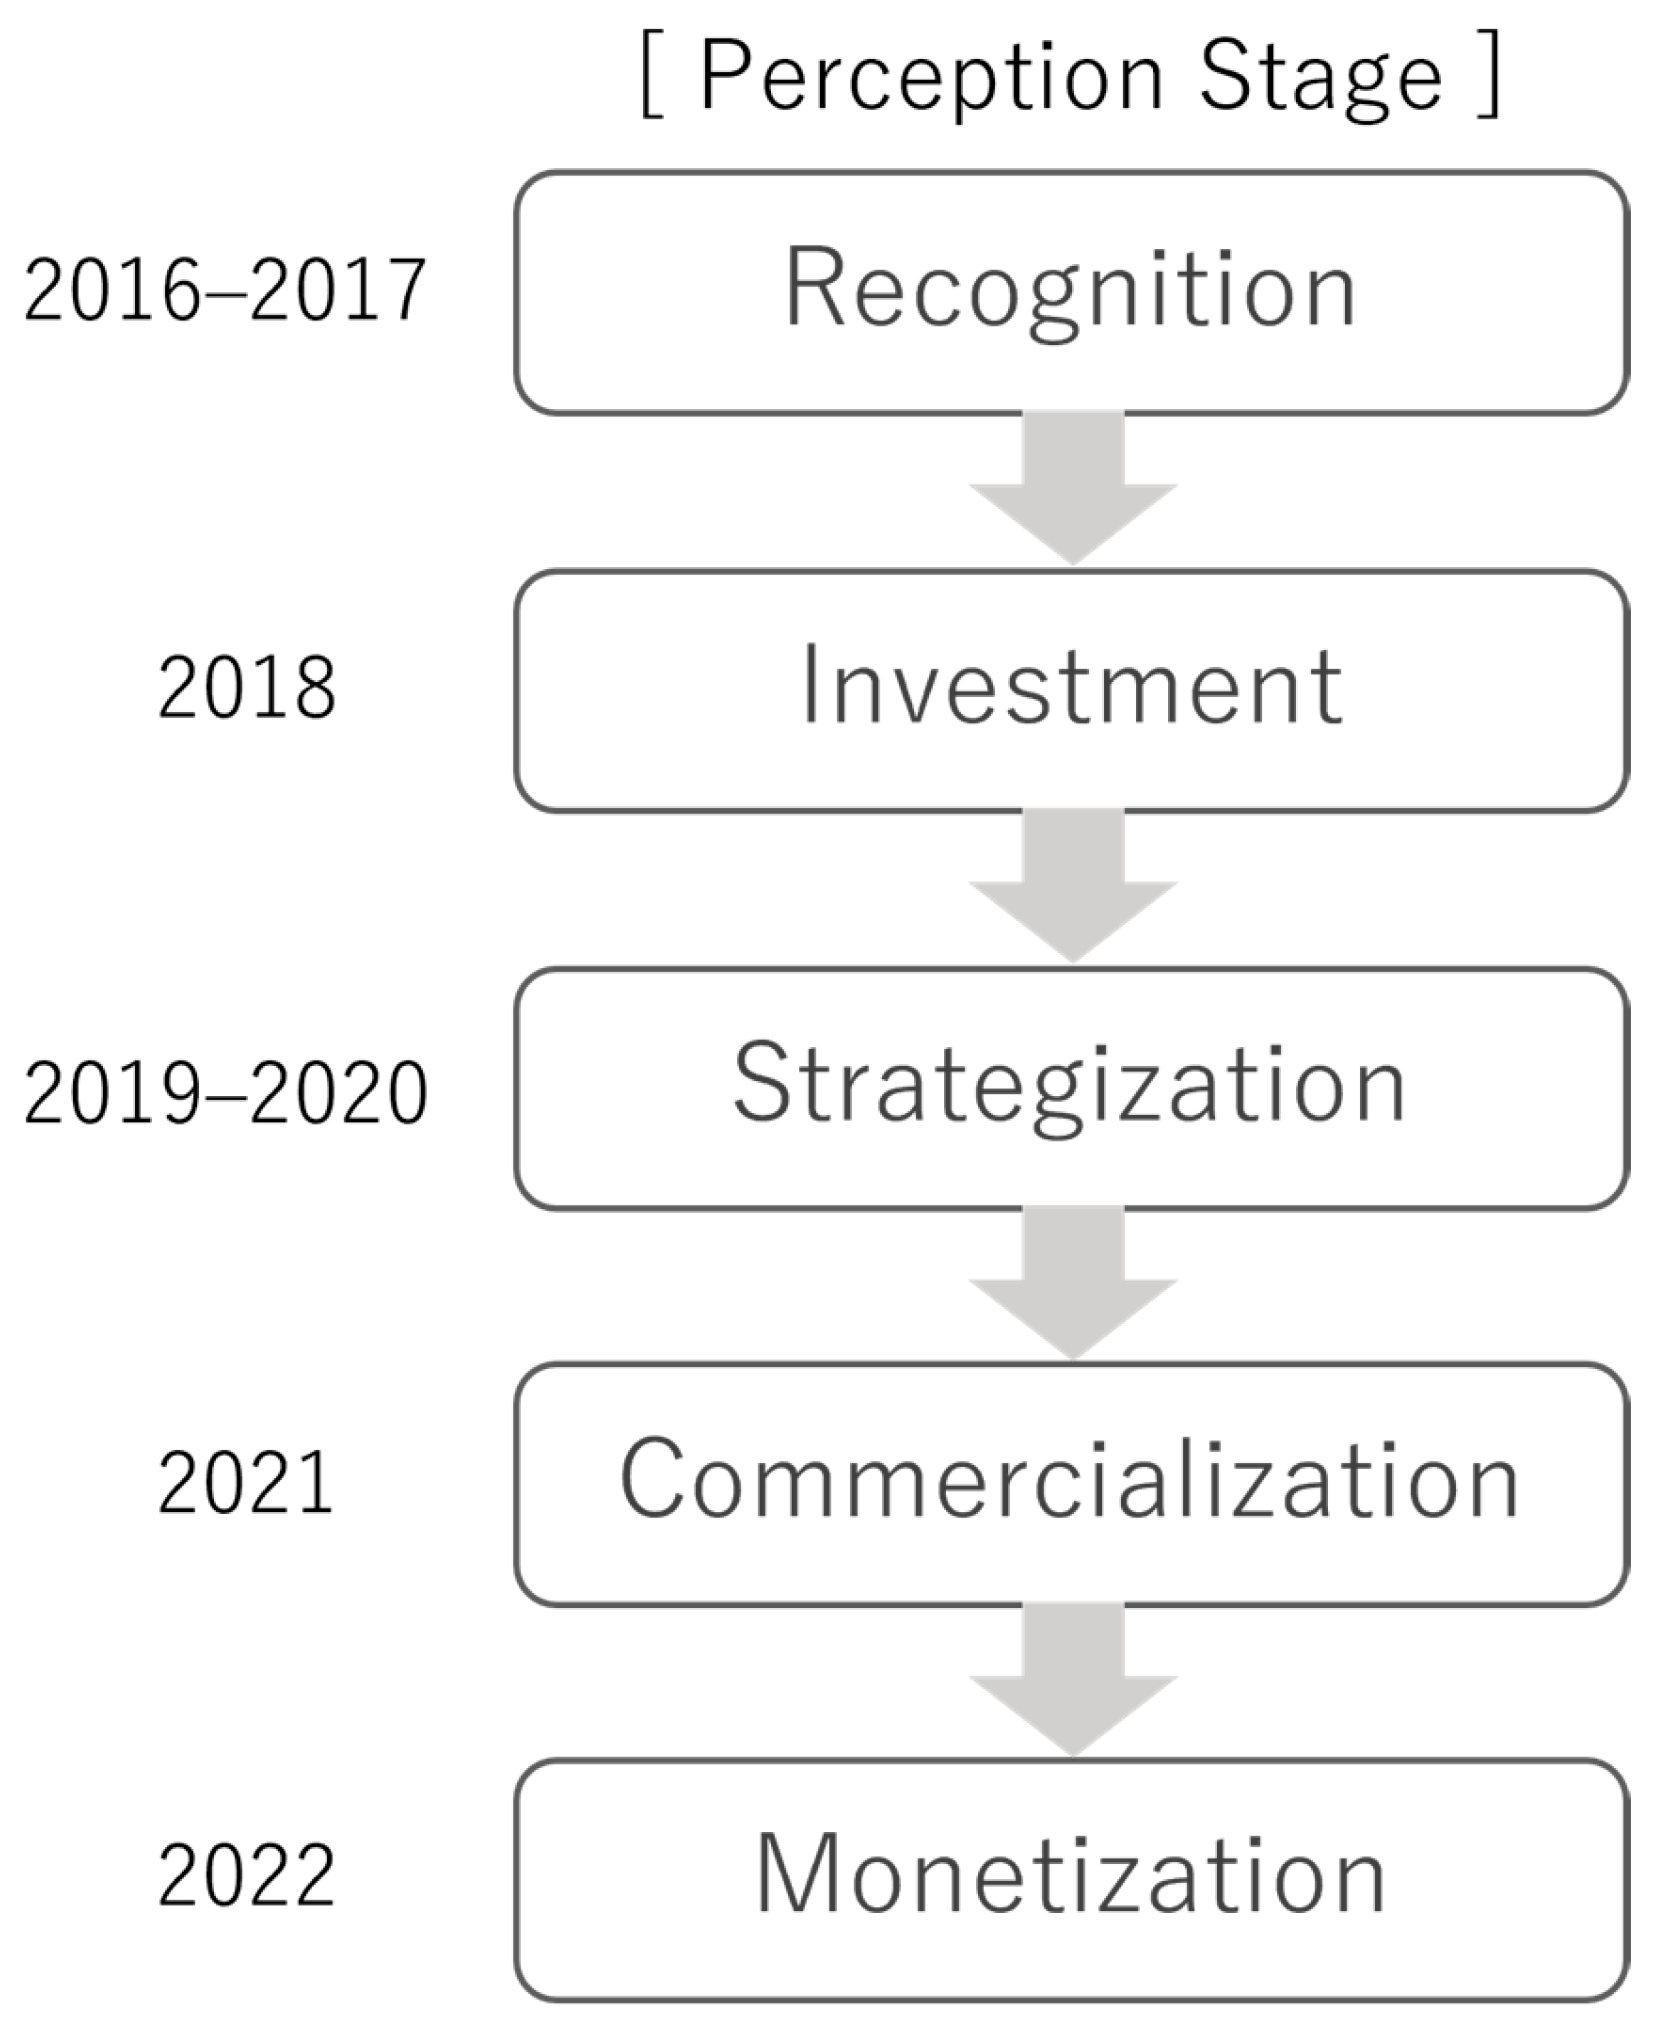
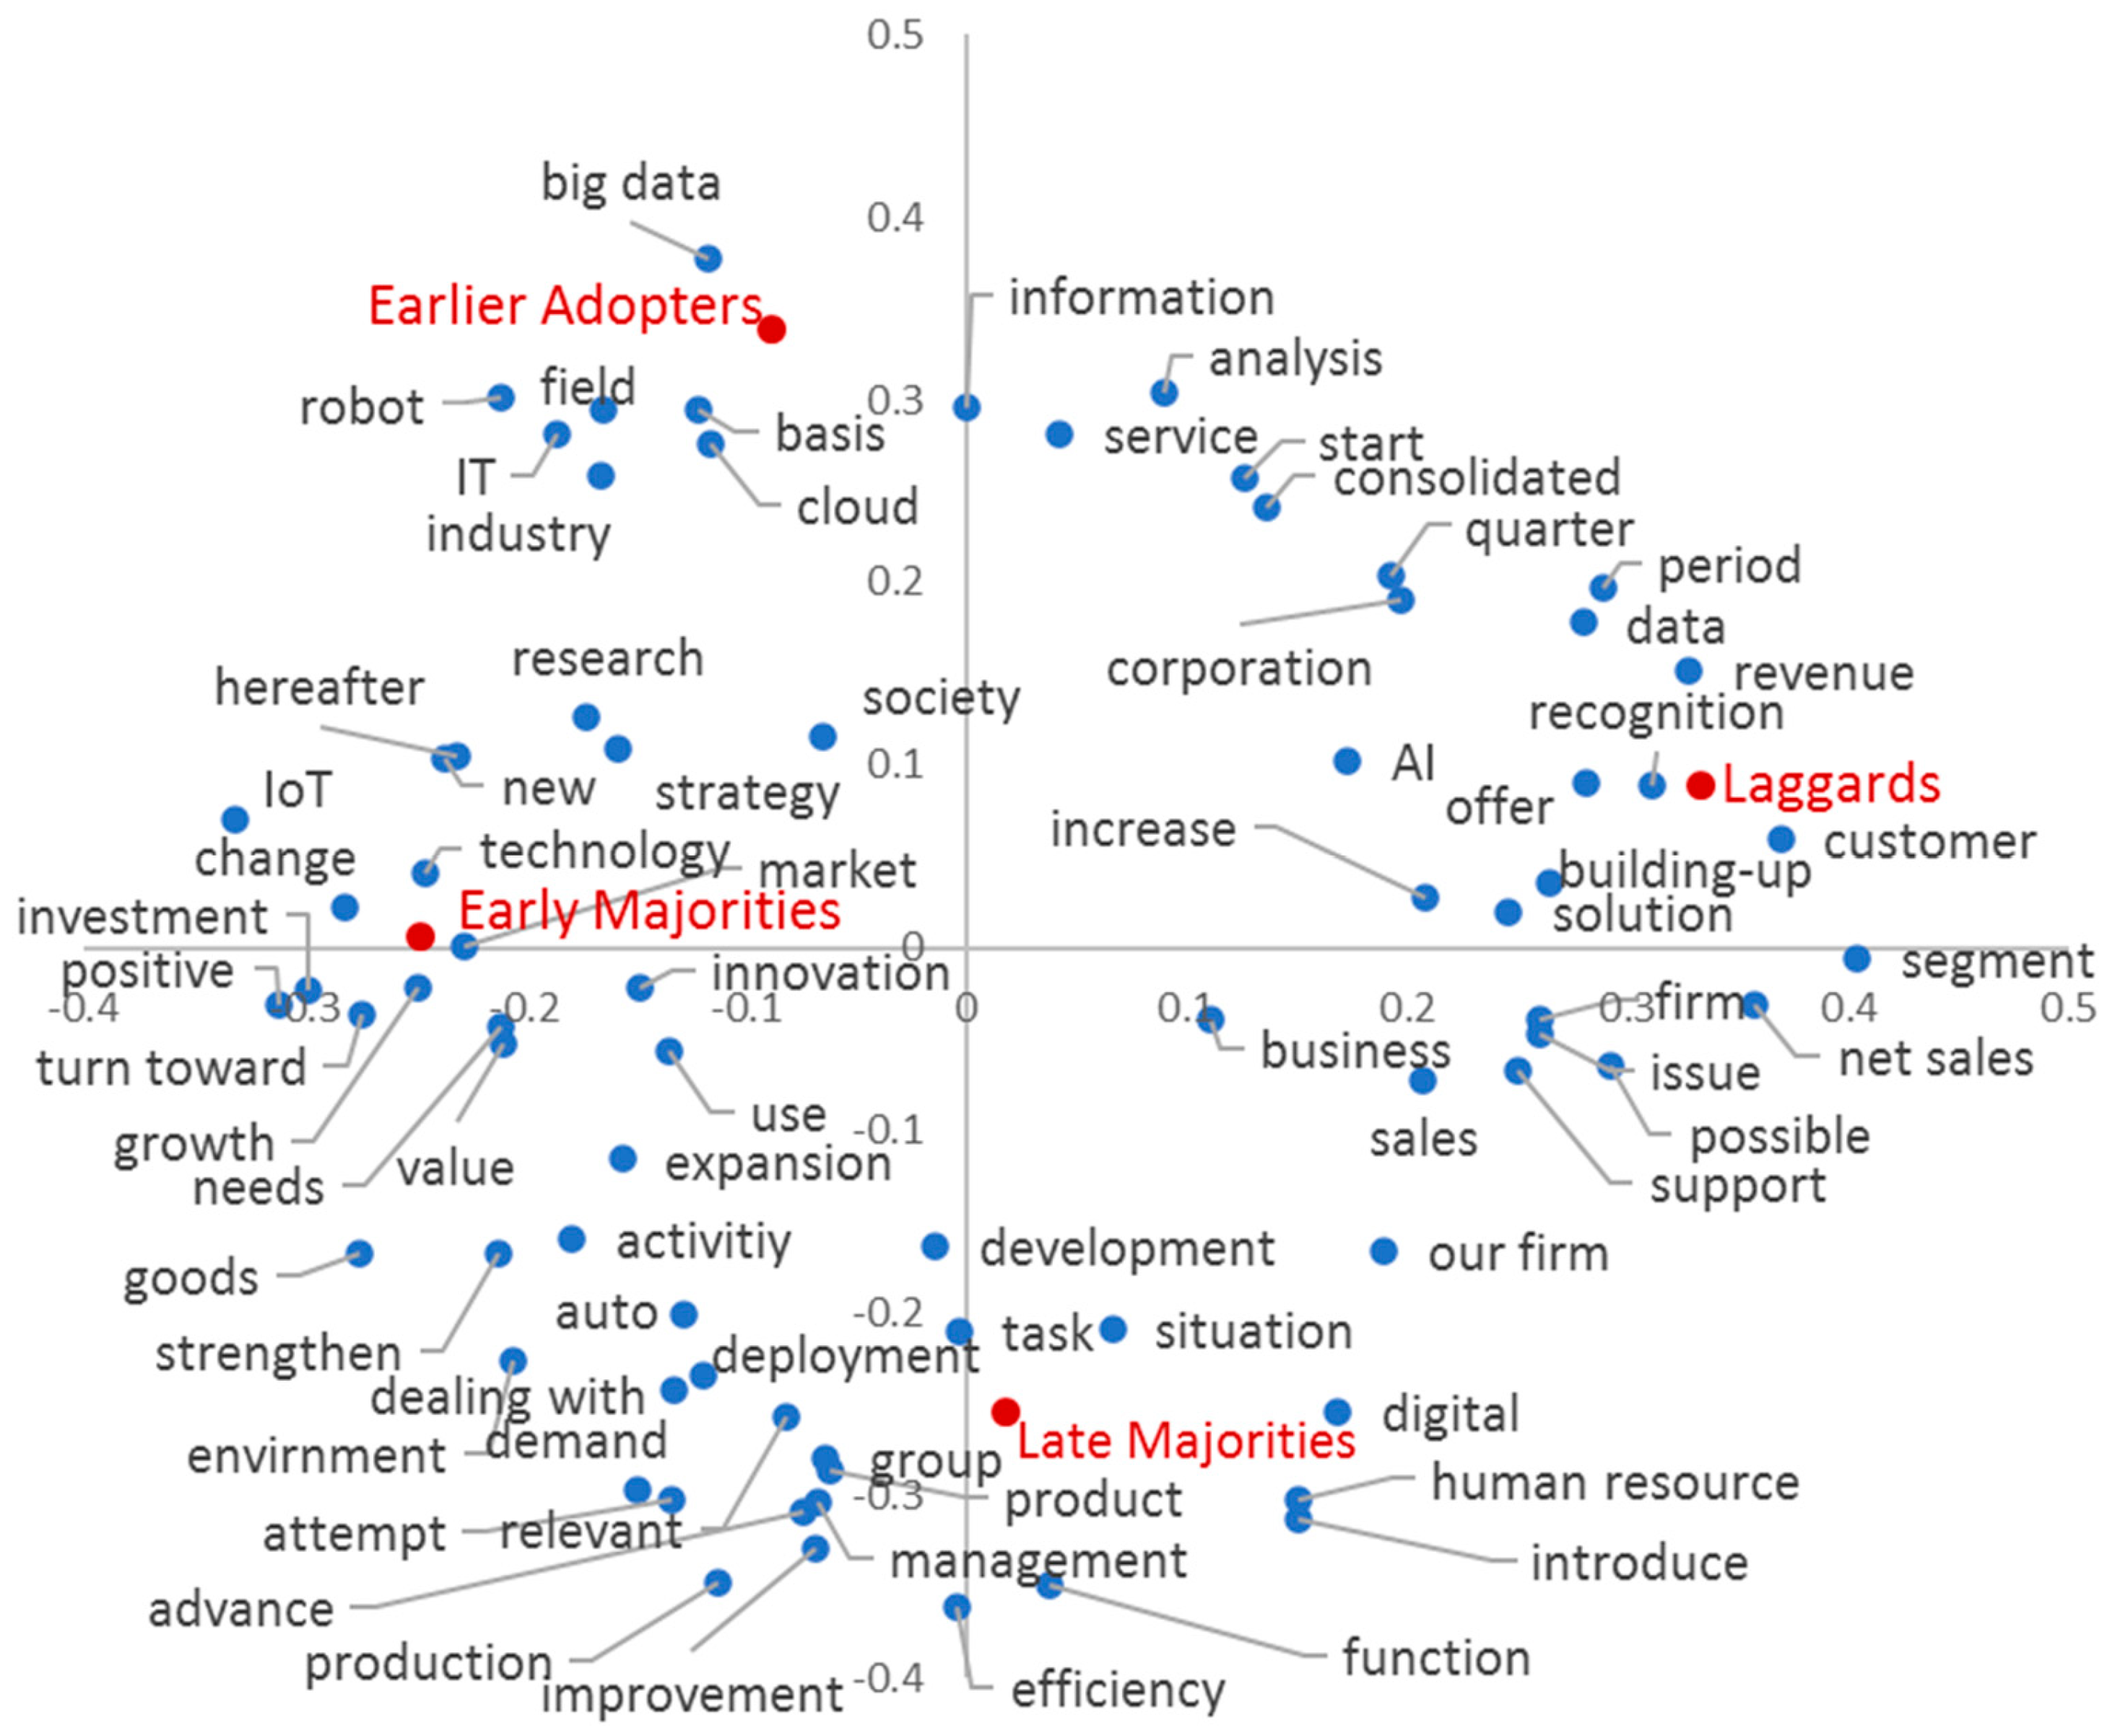
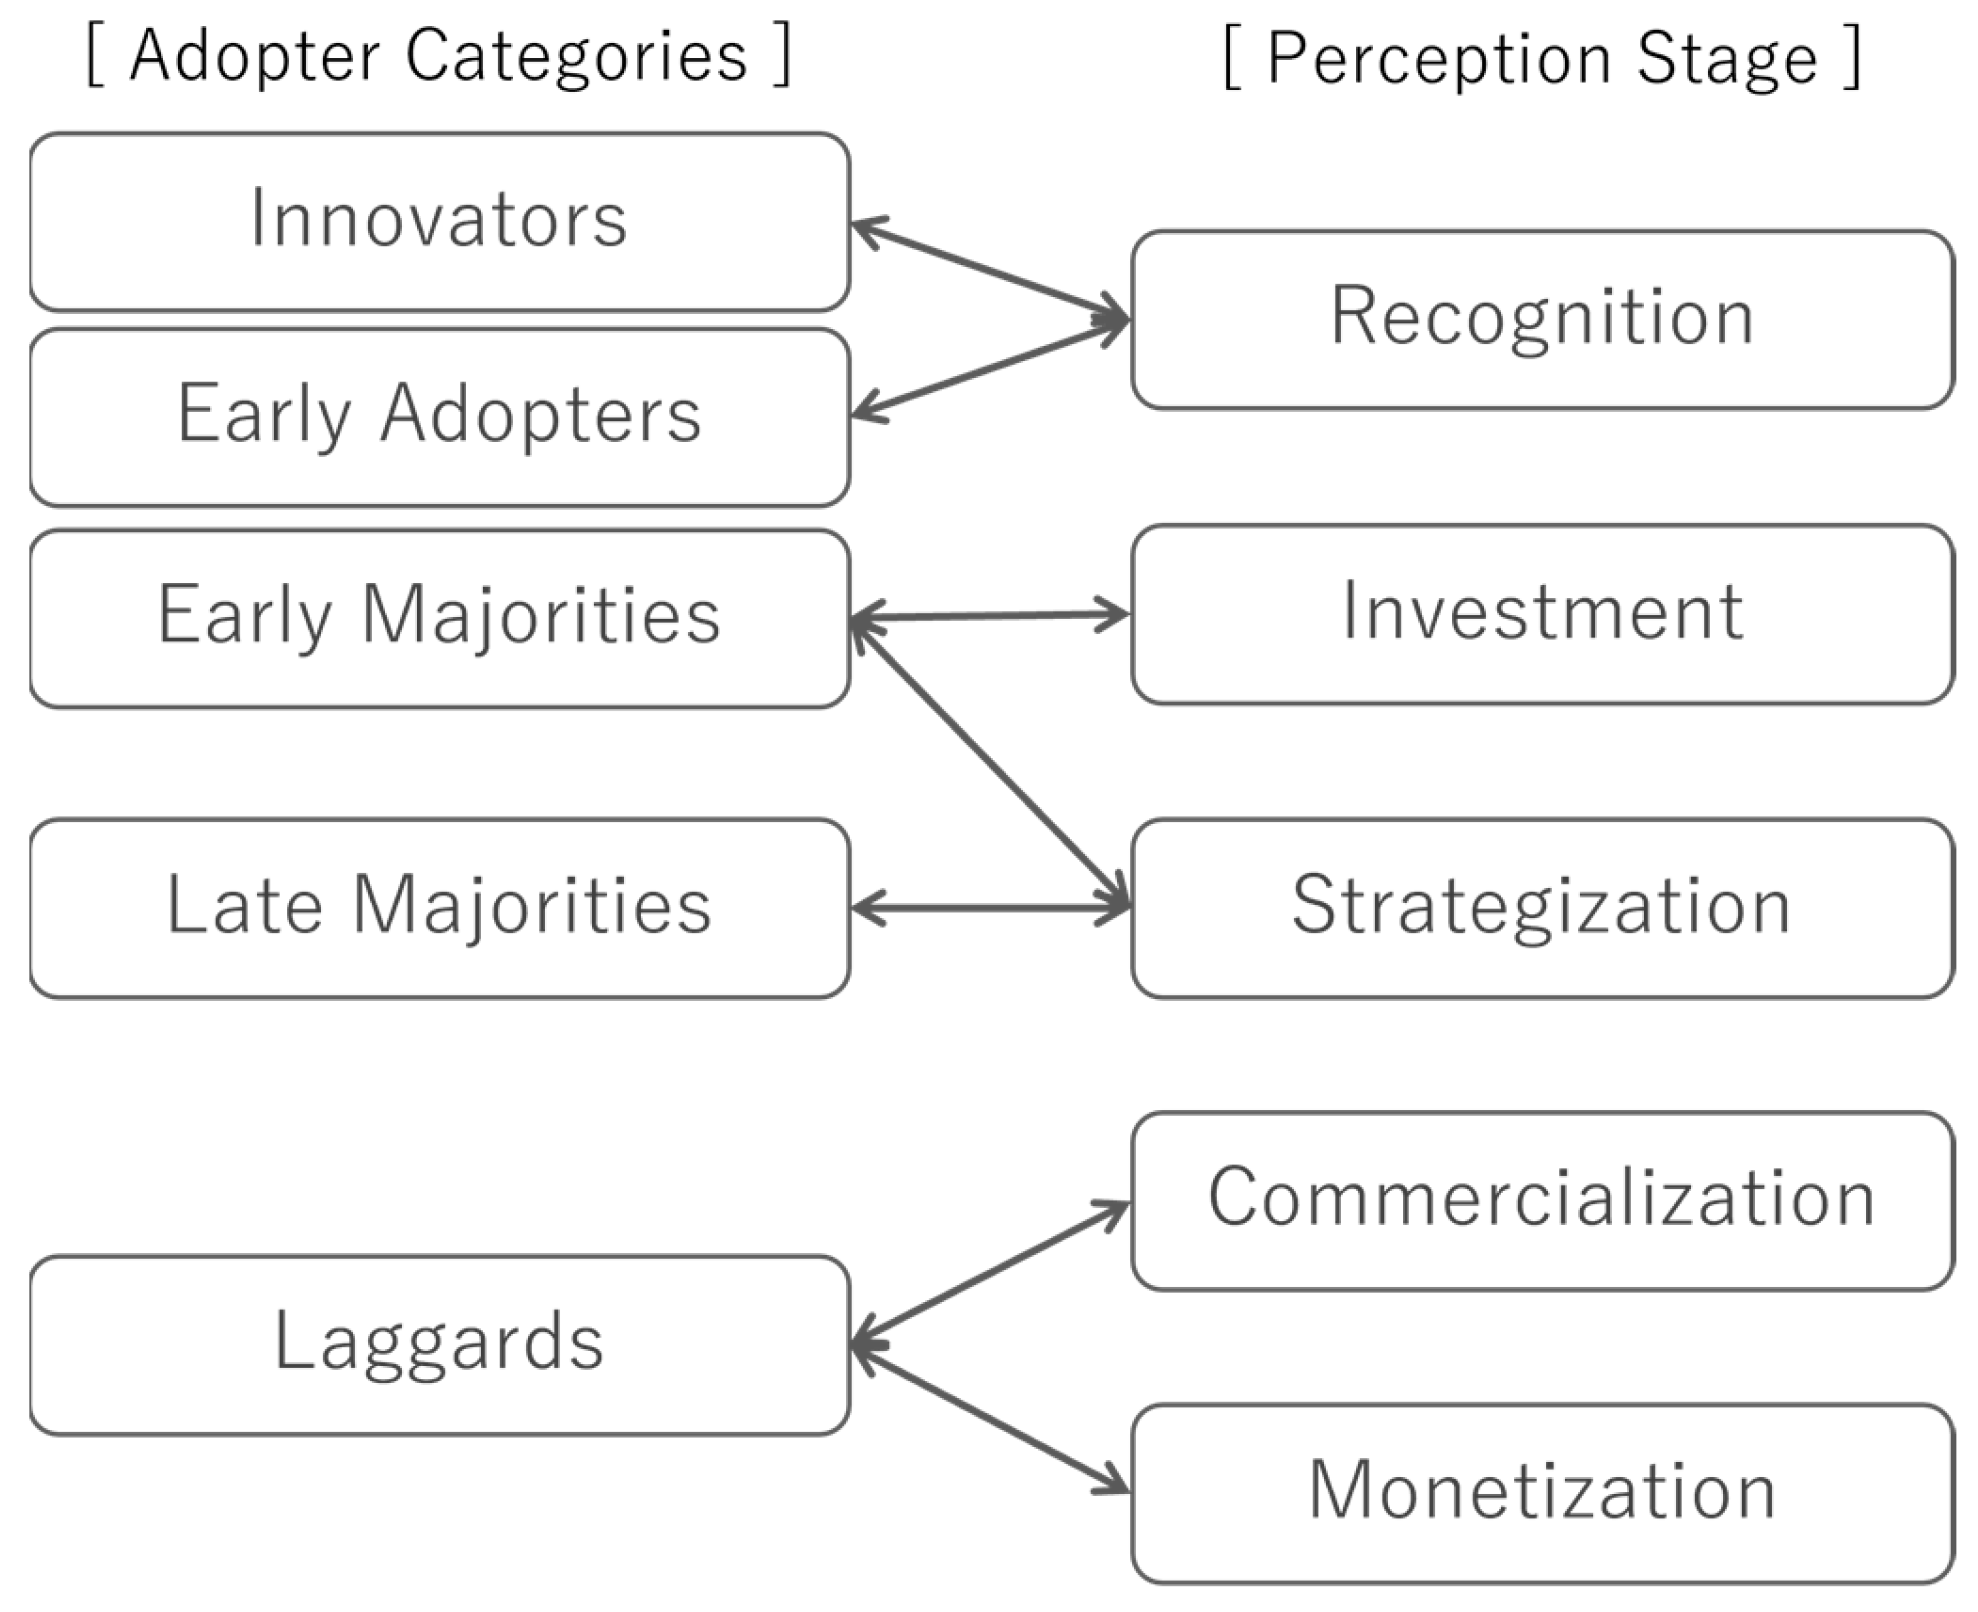
4.3.2. Innovation Theory−Based Analysis

Figure 9 shows the results of the correspondence analysis based on innovation theory. Figure 7 and Figure 9 appear similar, however while Figure 7 samples the text of all firms in a given year, Figure 9 uses only the text of firms in each adopter category. Accordingly, four categories are proposed: earlier adopters, early majorities, late majorities, and laggards. Earlier adopters recognized AI as a related technology, such as “big data”, “IT”, “cloud”, and “robotics”. The early majorities focused on the future prospects of “investment”, “growth”, “aggressiveness”, and “change”. Meanwhile, the late majorities preferred to focus on “management”, “groups”, “human resources”, “operations”, and “efficiency”, which are management functions. The laggards in 2022 mostly mentioned accounting terms, such as “revenue”, “segment”, and “sales”, in addition to the marketing-related terms “customer”, “build”, and “solution”. In other words, the focus of participants shifted to technology awareness (earlier adopters), future investment (early majorities), group strategies and applications (late majorities), and marketing and accounting (laggards). This flow is similar to the stages of AI perception depicted in Figure 8.
Note that there is no evidence that the latter category referred to or updated the interpretation of the former category; however, we argue that the interpretation of AI changed as a new category with a new interpretation of AI entered the market. Moreover, new interpretations could have attracted the next category.

5. Discussion

Based on text mining conducted on nonfinancial information, the results underscore the following four points. (1) The transportation/ICT industry was the most positive about AI, while finance/commerce/manufacturing industries were less positive. (2) The business sector went through five stages until AI was monetized, namely, recognition, investment, strategization, commercialization, and monetization, in what can be considered the “five-stage model” of AI adoption. (3) Firms’ changing interpretations may have influenced the progress through the stages. (4) It took a decade between the development of revolutionary AI technologies and monetization by firms.
Each of the model’s five stages is defined as follows. The recognition stage is the initial phase when businesses become aware of AI technology and its potential impact. In the investment stage, businesses start investing resources in AI, including financial investment, research, and talent acquisition. The strategization stage is when businesses develop strategic plans for integrating AI into their operations and products. During the commercialization stage, businesses develop and launch AI-driven products or services in the market. The monetization stage is when firms profit by using AI. Thus, the analysis in this study demonstrates that adopting AI is not a single decision point, but a multistep process. We will discuss the five-stage model of AI and its relation to innovator theory.

5.1. Contributions

The first contribution captures the diffusion of innovation and the corresponding change in perceptions across the business sector. AI is already being used in many businesses with positive results. There are two categories of firms: those that actively use AI and those that do not. Rogers’ innovation theory is one of the critical frameworks for understanding the field of innovation, and this difference between firms needs to be analyzed. Although innovation theory focuses on the perceptions of adopters, how society and the business sector perceive AI has not been discussed. Despite the various strengths of in-depth case studies and empirical analyses using questionnaires, patent data, and financial data, filling this research gap is challenging. By analyzing nonfinancial information, this study organizes perceptions of the business sector as a whole into a five-stage model, which can help fill the research gap on changing social perceptions associated with the diffusion of innovation.
The second contribution is Rogers’ theory of innovation. Innovation theory classifies the five adopter categories, each with a unique mindset. For example, innovators are the first to adopt innovations because they prefer to take risks, whereas laggards are the slowest because they value tradition. The five-stage model in this study reveals intermediate perceptions between these adopter characteristics and actual behavior. Figure 10 is a modification of Figure 8 that incorporates the adopter categories.
Figure 10 suggests that each adopter category is associated with its perception stage. Innovators and early adopters are those who first adopt innovation at the recognition stage. The early majority adopts innovations at the investment stage. Late majorities enter at the strategization stage, and laggards finally adopt innovations during the commercialization and monetization stages. Innovator theory suggests that later adopters make decisions by observing the actions of earlier adopters. Our model shows that the adopter category has a unique business perception of innovation. For example, late majorities may observe early majorities investing in innovation and late majorities disclose that innovation has been incorporated into their strategy. Our five-stage model can illustrate that the adopter category has a unique business perception of innovation to some extent. However, the relationship is complicated by the lack of examples, which is discussed in Section 5.3.

5.2. Implications

The first implication of this study is that text analysis of security reports is useful in the broader field of management studies. Some areas of management studies are difficult to measure quantitatively, with a prime example being management innovation (MI) [49]. MI encompasses innovations that are so difficult to grasp in terms of substance, such as organizational reforms and new management techniques, that MI has proven very challenging. Therefore, existing studies have used case studies [50] and questionnaires [51]. Further quantification may be possible using nonfinancial information even if considered important by top management. In addition, this method allows for analyzing firms and innovations with little news value. Print media indicators are sometimes used to analyze the diffusion of management methods [52]. However, news value strongly impacts coverage and quantity, especially in newspapers [53]; hence, there are more prominent firms, more news, and vice versa. This makes it difficult to analyze the actual state of dissemination. However, the corpus using full-text searches of security reports can also solve the problem posed by high and low news value items.
The second implication is a practical issue. Firms must accelerate their investments to speed up innovation diffusion because they are the main players driving social and economic change. The five-stage model underscores that bottlenecks are common in the organizational process of adopting innovation. Intervention by public organizations would be effective in accelerating this process for rapid social/economic change.

5.3. Limitations

Despite these contributions and implications, the exploratory nature of this study has several limitations. The first limitation is posed by the corpus. Our corpus was obtained from a full-text search of the database, but the search results are limited to a certain number of characters by the database specifications, not paragraphs. Retrieving the text in paragraphs might make it possible to clarify the perception more precisely. The second limitation is interpretation. As typified by text mining, natural language processing (NLP) can quantitatively analyze a large amount of text. However, bias can be introduced when interpreting the results obtained. This is confirmation bias or apophenia (the perceptual action of finding regularity and relevance in random or meaningless information). Although we have carefully identified them, these biases are still an unsolved problem associated with NLP [54]. The third limitation in the study is related to conducting a single case study of AI adoption by the Japanese business sector. Therefore, the validity of the five-stage model must be improved. In particular, the contribution to innovation theory must be limited because the amount of text was reduced when the data were classified by the adopter category. In this regard, it is important to include different cases.

5.4. Further Research

Future research should be conducted on the reversibility of the five-stage model. By reversibility, we mean the possibility that firms might regress to earlier stages in the model under certain conditions, such as market disruptions or internal strategic shifts. In our study, the change in perceptions of adoption is linear. However, when the perspective is more micro, the stages may return. In strategic management theory, three approaches that do not fall under the linear model have also been proposed: dynamic capability theory [55], lean startup [56], and game theory-based strategies [57]. Therefore, a theoretical investigation is warranted into whether our model is reversible and, if so, under what conditions it is reversible. Such research could offer valuable insights into the dynamic nature of strategic decision making in rapidly evolving technological landscapes.
The second direction of further research is to analyze the relationship between the employer category variables and hiring speed, among others. For example, firm size is negatively related to the speed of decision-making [58], and firm age is negatively related to the speed of organizational change [59]. If these studies are used as support, it is possible that smaller and younger firms adopt AI earlier in the process. Another possible research direction would be to use the adopter category as an explanatory variable. Understanding these relationships could offer valuable insights into businesses’ strategic decisions regarding innovations.
The third objective is to reveal society’s changing perceptions by analyzing other actors’ perceptions. While this study obtained the perceptions of the Japanese business sector, it is possible to analyze the perceptions of society through perceptions of media from newspapers, of politicians from parliamentary proceedings, of administrative organizations from white papers, and of researchers from academic papers. Then, it will become clear who led innovation adoption. Firms may be ahead of other actors in adopting innovations, or organizational processes may have delayed their adoption. By collecting texts from diverse actors, it may be possible to depict changes in society’s overall perception of innovations.

6. Conclusions

Since AI will bring about major societal changes, it is important to explore the perceptions of the main actors in the development and use of AI-related technologies. This study explores how the perception of AI in the Japanese business sector has changed over time to assess the speed of AI adoption.
Text mining of Japanese firms’ annual/quarterly reports revealed that the perception of AI throughout the business sector has shifted from recognition to monetization in the five-stage model. We also found that perceptions can change by adopter category according to innovator theory.
This finding contributes to clarifying the perception of innovation across the business sector and enabling awareness of less visible areas. In addition, the adoption process affects the speed of adoption by each firm, which in turn affects the diffusion of innovation throughout society. It also has implications for policymakers to lead innovation-mediated social change.

Author Contributions

Conceptualization, Y.H. and T.H.; methodology, Y.H.; formal analysis, Y.H.; writing—original draft preparation, Y.H.; writing—review and editing, Y.H. and T.H.; visualization, Y.H. All authors have read and agreed to the published version of the manuscript.

Funding

This research was funded by JSPS KAKENHI Grant no. 20H01540, 21K01663, and 20H01542.

Data Availability Statement

Restrictions apply to the availability of these data. Data was obtained from I-N Information Systems, Ltd and are available from https://www.indb.co.jp/english/ with the registration of the service. However, securities reports of Japanese firms for less than five years are available from EDINET https://disclosure2.edinet-fsa.go.jp. All URL were last accessed on January 29 January 2024.

Conflicts of Interest

The authors declare no conflicts of interest.

Appendix A

Table A1. Organized words.
Original TermEnglish Meanings of Original TermsOrganized TermEnglish Meanings of Organized Terms
artificial intelligence ai
人工知能artificial intelligenceai
デジタルトランス
フォーメーション
digital transformationdx
robotic process automation rpa
ロボティック・プロセス・オートメーションrobotic process automationrpa
cloud クラウドcloud
deep learning ディープラーニングdeep learning
技術technologyテクノロジーtechnology
事業businessビジネスbusiness
企業firm会社firm
management 経営management
マネージメントmanagement経営management
マネジメントmanagement経営management
業界industry産業industry
新しいnew新規new
新たnew新規new
解析analysis分析analysis
領域area分野area

Appendix B

Table A2. Japanese–English correspondence table.
EnglishJapaneseEnglishJapaneseEnglishJapanese
accounting会計goods商品production生産
activity活動groupグループquarter四半期
add加えるgrowth成長realize実現
administration管理hereafter今後recognition認識
advance進めるhuman resource人材relevant関連
AIaiimage画像research研究
aim at目指すimplementation推進revenue収益
analysis分析improvement向上robotロボット
attempt図るincrease増加RPArpa
auto自動industry産業sales販売
basis基盤information情報segmentセグメント
big dataビッグデータinnovation革新serviceサービス
building-up構築internetインターネットsituation状況
businessビジネスintroduce導入society社会
change変化investment投資solutionソリューション
cloudクラウドIoTiotsound音声
consolidated連結issue課題start開始
corporation株式会社ITitstrategy戦略
customer顧客management経営strengthen強化
dataデータmarket市場subsidiary子会社
dealing with対応medical医療support支援
demand需要needsニーズsystemシステム
deployment展開net sales売上tackle取り組む
development開発new新規task業務
digitalデジタルoffer提供technologyテクノロジー
DXdxoperation営業telecommunication通信
efficiency効率our firm当社tie-up提携
environment環境period期間turn toward向ける
expansion拡大platformプラットフォームusage利用
field分野positive積極use活用
firm会社possible可能value価値
function機能product製品

References

  1. Bokhari, S.A.A.; Myeong, S. Use of Artificial Intelligence in Smart Cities for Smart Decision-Making: A Social Innovation Perspective. Sustainability 2022, 14, 620. [Google Scholar] [CrossRef]
  2. Hutter, R.; Hutter, M. Chances and Risks of Artificial Intelligence—A Concept of Developing and Exploiting Machine Intelligence for Future Societies. Appl. Syst. Innov. 2021, 4, 37. [Google Scholar] [CrossRef]
  3. Lee, H.S.; Lee, J. Applying Artificial Intelligence in Physical Education and Future Perspectives. Sustainability 2021, 13, 351. [Google Scholar] [CrossRef]
  4. Al-Marsy, A.; Chaudhary, P.; Rodger, J.A. A Model for Examining Challenges and Opportunities in Use of Cloud Computing for Health Information Systems. Appl. Syst. Innov. 2021, 4, 15. [Google Scholar] [CrossRef]
  5. Lee, D.; Yoon, S.N. Application of Artificial Intelligence-Based Technologies in the Healthcare Industry: Opportunities and Challenges. Int. J. Environ. Res. Public Health 2021, 18, 271. [Google Scholar] [CrossRef] [PubMed]
  6. Frey, C.B.; Osborne, M.A. The Future of Employment: How Susceptible Are Jobs to Computerisation? Technol. Forecast. Soc. Change 2017, 114, 254–280. [Google Scholar] [CrossRef]
  7. Ebers, M.; Hoch, V.R.S.; Rosenkranz, F.; Ruschemeier, H.; Steinrötter, B. The European Commission’s Proposal for an Artificial Intelligence Act—A Critical Assessment by Members of the Robotics and AI Law Society (RAILS). J 2021, 4, 589–603. [Google Scholar] [CrossRef]
  8. Reier Forradellas, R.F.; Garay Gallastegui, L.M. Digital Transformation and Artificial Intelligence Applied to Business: Legal Regulations, Economic Impact and Perspective. Laws 2021, 10, 70. [Google Scholar] [CrossRef]
  9. Brendel, A.B.; Mirbabaie, M.; Lembcke, T.-B.; Hofeditz, L. Ethical Management of Artificial Intelligence. Sustainability 2021, 13, 1974. [Google Scholar] [CrossRef]
  10. Borges, A.F.S.; Laurindo, F.J.B.; Spínola, M.M.; Gonçalves, R.F.; Mattos, C.A. The Strategic Use of Artificial Intelligence in the Digital Era: Systematic Literature Review and Future Research Directions. Int. J. Inf. Manag. 2021, 57, 102225. [Google Scholar] [CrossRef]
  11. Kitsios, F.; Kamariotou, M. Artificial Intelligence and Business Strategy towards Digital Transformation: A Research Agenda. Sustainability 2021, 13, 2025. [Google Scholar] [CrossRef]
  12. Redchuk, A.; Walas Mateo, F. New Business Models on Artificial Intelligence—The Case of the Optimization of a Blast Furnace in the Steel Industry by a Machine Learning Solution. Appl. Syst. Innov. 2022, 5, 6. [Google Scholar] [CrossRef]
  13. Akundi, A.; Euresti, D.; Luna, S.; Ankobiah, W.; Lopes, A.; Edinbarough, I. State of Industry 5.0—Analysis and Identification of Current Research Trends. Appl. Syst. Innov. 2022, 5, 27. [Google Scholar] [CrossRef]
  14. Moshood, T.D.; Nawanir, G.; Sorooshian, S.; Okfalisa, O. Digital Twins Driven Supply Chain Visibility within Logistics: A New Paradigm for Future Logistics. Appl. Syst. Innov. 2021, 4, 29. [Google Scholar] [CrossRef]
  15. Orlova, E.V. Innovation in Company Labor Productivity Management: Data Science Methods Application. Appl. Syst. Innov. 2021, 4, 68. [Google Scholar] [CrossRef]
  16. Madsen, D.Ø.; Berg, T.; Di Nardo, M. Bibliometric Trends in Industry 5.0 Research: An Updated Overview. Appl. Syst. Innov. 2023, 6, 63. [Google Scholar] [CrossRef]
  17. Rogers, E.M. Diffusion of Innovations, 5th ed.; Simon and Schuster: New York, NY, USA, 2003; ISBN 978-0-7432-5823-4. [Google Scholar]
  18. De Bustos, J.C.M.; Izquierdo-Castillo, J. Who Will Control the Media? The Impact of GAFAM on the Media Industries in the Digital Economy. Rev. Lat. Comun. Soc. 2019, 74, 803–821. [Google Scholar]
  19. Truong, Y.; Papagiannidis, S. Artificial Intelligence as an Enabler for Innovation: A Review and Future Research Agenda. Technol. Forecast. Soc. Change 2022, 183, 121852. [Google Scholar] [CrossRef]
  20. Li, J.; Bonn, M.A.; Ye, B.H. Hotel Employee’s Artificial Intelligence and Robotics Awareness and Its Impact on Turnover Intention: The Moderating Roles of Perceived Organizational Support and Competitive Psychological Climate. Tour. Manag. 2019, 73, 172–181. [Google Scholar] [CrossRef]
  21. Tiron-Tudor, A.; Deliu, D.; Farcane, N.; Dontu, A. Managing Change with and through Blockchain in Accountancy Organizations: A Systematic Literature Review. J. Organ. Change Manag. 2021, 34, 477–506. [Google Scholar] [CrossRef]
  22. Füller, J.; Hutter, K.; Wahl, J.; Bilgram, V.; Tekic, Z. How AI Revolutionizes Innovation Management—Perceptions and Implementation Preferences of AI-Based Innovators. Technol. Forecast. Soc. Change 2022, 178, 121598. [Google Scholar] [CrossRef]
  23. Vecchio, Y.; Agnusdei, G.P.; Miglietta, P.P.; Capitanio, F. Adoption of Precision Farming Tools: The Case of Italian Farmers. Int. J. Environ. Res. Public Health 2020, 17, 869. [Google Scholar] [CrossRef] [PubMed]
  24. Strong, R.; Wynn, J.T.; Lindner, J.R.; Palmer, K. Evaluating Brazilian Agriculturalists’ IoT Smart Agriculture Adoption Barriers: Understanding Stakeholder Salience Prior to Launching an Innovation. Sensors 2022, 22, 6833. [Google Scholar] [CrossRef] [PubMed]
  25. Gonera, A.; Svanes, E.; Bugge, A.B.; Hatlebakk, M.M.; Prexl, K.-M.; Ueland, Ø. Moving Consumers along the Innovation Adoption Curve: A New Approach to Accelerate the Shift toward a More Sustainable Diet. Sustainability 2021, 13, 4477. [Google Scholar] [CrossRef]
  26. Bjørge, N.M.; Hjelkrem, O.A.; Babri, S. Characterisation of Norwegian Battery Electric Vehicle Owners by Level of Adoption. World Electr. Veh. J. 2022, 13, 150. [Google Scholar] [CrossRef]
  27. Damanpour, F. Footnotes to Research on Management Innovation. Organ. Stud. 2014, 35, 1265–1285. [Google Scholar] [CrossRef]
  28. Yamaguchi, S.; Nitta, R.; Hara, Y.; Shimizu, H. Who Explores Further? Evidence on R&D Outsourcing from the Survey of Research and Development. RD Manag. 2021, 51, 114–126. [Google Scholar] [CrossRef]
  29. Zahra, S.A. Environment, Corporate Entrepreneurship, and Financial Performance: A Taxonomic Approach. J. Bus. Ventur. 1993, 8, 319–340. [Google Scholar] [CrossRef]
  30. Coad, A.; Rao, R. Firm Growth and R&D Expenditure. Econ. Innov. New Technol. 2010, 19, 127–145. [Google Scholar] [CrossRef]
  31. Banker, R.D.; Potter, G.; Srinivasan, D. An Empirical Investigation of an Incentive Plan That Includes Nonfinancial Performance Measures. Account. Rev. 2000, 75, 65–92. [Google Scholar] [CrossRef]
  32. Cole, C.J.; Jones, C.L. Management Discussion and Analysis: A Review and Implications for Future Research. J. Account. Lit. 2005, 24, 135–174. [Google Scholar]
  33. Senave, E.; Jans, M.J.; Srivastava, R.P. The Application of Text Mining in Accounting. Int. J. Account. Inf. Syst. 2023, 50, 100624. [Google Scholar] [CrossRef]
  34. Berns, J.; Bick, P.; Flugum, R.; Houston, R. Do Changes in MD&A Section Tone Predict Investment Behavior? Financ. Rev. 2022, 57, 129–153. [Google Scholar] [CrossRef]
  35. Wang, Q.; Wu, D.; Yan, L. Effect of Positive Tone in MD&A Disclosure on Capital Structure Adjustment Speed: Evidence from China. Account. Financ. 2021, 61, 5809–5845. [Google Scholar] [CrossRef]
  36. Romito, S.; Vurro, C. Non-Financial Disclosure and Information Asymmetry: A Stakeholder View on US Listed Firms. Corp. Soc. Responsib. Environ. Manag. 2021, 28, 595–605. [Google Scholar] [CrossRef]
  37. Connelly, B.L.; Certo, S.T.; Ireland, R.D.; Reutzel, C.R. Signaling Theory: A Review and Assessment. J. Manag. 2011, 37, 39–67. [Google Scholar] [CrossRef]
  38. Ding, B.Y.; Wei, F. Executive Resume Information Disclosure and Corporate Innovation: Evidence from China. Manag. Decis. Econ. 2022, 43, 3593–3610. [Google Scholar] [CrossRef]
  39. Jia, N. Corporate Innovation Strategy and Disclosure Policy. Rev. Quant. Finan. Acc. 2019, 52, 253–288. [Google Scholar] [CrossRef]
  40. Leung, S.; Parker, L.; Courtis, J. Impression Management through Minimal Narrative Disclosure in Annual Reports. Br. Account. Rev. 2015, 47, 275–289. [Google Scholar] [CrossRef]
  41. Cao, X. A New Era of Intelligent Interaction: Opportunities and Challenges Brought by ChatGPT. Geogr. Res. Bull. 2023, 2, 162–165. [Google Scholar] [CrossRef]
  42. Ting, D.S.J.; Tan, T.F.; Ting, D.S.W. ChatGPT in Ophthalmology: The Dawn of a New Era? Eye 2023, 38, 4–7. [Google Scholar] [CrossRef] [PubMed]
  43. Gupta, V.; Lehal, G. A Survey of Text Mining Techniques and Applications. J. Emerg. Technol. Web Intell. 2009, 1, 60–76. [Google Scholar] [CrossRef]
  44. Yano, Y.; Blandford, D.; Maruyama, A.; Nakamura, T. Consumer Perceptions of Fresh Leafy Vegetables in Japan: An Application of Word Co-Occurrence Network Analysis. Br. Food J. 2018, 120, 2554–2568. [Google Scholar] [CrossRef]
  45. Higuchi, K. KH Coder 3 Reference Manual; Ritsumeikan University: Kioto, Japan, 2016. [Google Scholar]
  46. Greenacre, M. Correspondence Analysis in Practice; CRC Press: Boca Raton, FL, USA, 2017. [Google Scholar]
  47. Jung, Y.; Suh, Y. Mining the Voice of Employees: A Text Mining Approach to Identifying and Analyzing Job Satisfaction Factors from Online Employee Reviews. Decis. Support Syst. 2019, 123, 113074. [Google Scholar] [CrossRef]
  48. Wang, X.; Inaba, M. Analyzing Structures and Evolution of Digital Humanities Based on Correspondence Analysis and Co-Word Analysis. Art Res. 2009, 9, 123–134. [Google Scholar]
  49. Birkinshaw, J.; Mol, M. How Management Innovation Happens. MIT Sloan Manag. Rev. 2006, 47, 81–88. [Google Scholar]
  50. Lin, H.; Su, J. A Case Study on Adoptive Management Innovation in China. J. Organ. Change Manag. 2014, 27, 83–114. [Google Scholar] [CrossRef]
  51. Kraśnicka, T.; Głód, W.; Wronka-Pośpiech, M. Management Innovation and Its Measurement. J. Entrep. Manag. Innov. 2016, 12, 95–121. [Google Scholar] [CrossRef]
  52. Benders, J.; Nijholt, J.; Heusinkveld, S. Using Print Media Indicators in Management Fashion Research. Qual. Quant. 2007, 41, 815–829. [Google Scholar] [CrossRef]
  53. Lagerwerf, L.; Govaert, C.G. Raising Clickworthiness: Effects of Foregrounding News Values in Online Newspaper Headlines. In News Values from an Audience Perspective; Temmerman, M., Mast, J., Eds.; Springer International Publishing: Cham, Switzerland, 2021; pp. 95–119. ISBN 978-3-030-45046-5. [Google Scholar]
  54. Paape, D. Five Degrees of (Non)Sense: Investigating the Connection between Bullshit Receptivity and Susceptibility to Semantic Illusions. Exp. Linguist. Mean. 2023, 2, 189–201. [Google Scholar] [CrossRef]
  55. Eisenhardt, K.M.; Martin, J.A. Dynamic Capabilities: What Are They? Strateg. Manag. J. 2000, 21, 1105–1121. [Google Scholar] [CrossRef]
  56. Reis, E. The Lean Startup; Crown Business: New York, NY, USA, 2011. [Google Scholar]
  57. Brandenburger, A.M.; Barry, J.N. The Right Game: Use Game Theory to Shape Strategy. Harv. Bus. Rev. 1995, 76, 57–71. [Google Scholar]
  58. Robert Baum, J.; Wally, S. Strategic Decision Speed and Firm Performance. Strateg. Manag. J. 2003, 24, 1107–1129. [Google Scholar] [CrossRef]
  59. Le Mens, G.; Hannan, M.T.; Pólos, L. Age-Related Structural Inertia: A Distance-Based Approach. Organ. Sci. 2015, 26, 756–773. [Google Scholar] [CrossRef]
Figure 1. Number of firms and documents.
Asi 07 00013 g001
Figure 2. Number of newly mentioned firms.
Asi 07 00013 g002
Figure 3. Share of documents by industry.
Asi 07 00013 g003
Figure 4. Share of mentioned firms by industry.
Asi 07 00013 g004
Figure 5. Average number of mentions by industry.
Asi 07 00013 g005
Figure 6. Co-occurrence network.
Asi 07 00013 g006
Figure 7. Time−series-based correspondence analysis.
Asi 07 00013 g007
Figure 8. Stages of AI perception.
Asi 07 00013 g008
Figure 9. Innovation theory−based correspondence analysis.
Asi 07 00013 g009
Figure 10. Innovation theory and five stages of perception.
Asi 07 00013 g010
Table 1. Ten and thirty-three industries in Japan (https://www.jpx.co.jp/sicc/sectors/nlsgeu00000329wk-att/gyousyu.pdf, accessed on 29 January 2024).
10 Industries33 Industries
Fisheries/AgricultureFisheries and Agriculture
MiningMining
ConstructionConstruction
ManufacturingFoodstuffs, Textiles, Pulp & Paper, Chemicals, Pharmaceuticals, Petroleum and Coal Products, Rubber Products, Glass & Ceramics Products, Iron and Steel, Nonferrous Metals, Metal Products, Machinery, Electrical equipment, Transportation equipment, Precision Equipment, Other Products
Electricity/GasElectricity and Gas
Transportation/ICTLand Transportation, Marine Transportation, Air Transportation, Warehousing and Transportation, Information and Communication,
CommerceWholesale and Retail Trade
Finance/InsuranceBanking, Securities and Commodity Futures Trading, Insurance, Other Financial Industry
Real estateReal Estate
ServiceService
Disclaimer/Publisher’s Note: The statements, opinions and data contained in all publications are solely those of the individual author(s) and contributor(s) and not of MDPI and/or the editor(s). MDPI and/or the editor(s) disclaim responsibility for any injury to people or property resulting from any ideas, methods, instructions or products referred to in the content.

