
Reshaping the Digital Twin Construct with Levels of Digital Twinning (LoDT)

 ,
,  ,
,  ,
, 
Abstract
:1. Introduction
1.1. Background
1.2. Research Objectives and Paper Organisation
2. Functional Architecture of Digital Twinning
2.1. Terms and Definitions
- Physical entity: this can be a physical asset, a group of physical assets, or a process involving physical assets;
- Data: data is generated and exchanged between the physical and digital spaces, with different levels of automation and a certain frequency and precision, thereby ensuring synchronisation between physical and virtual spaces;
- Digital models: these models aim to represent the physical entity with a certain level of fidelity and, based on existing data, generate new data and information to support decision making;
- Decision making: the main use of DTs is to support decision making in view of realising value from the physical entity and the corresponding data and digital model.
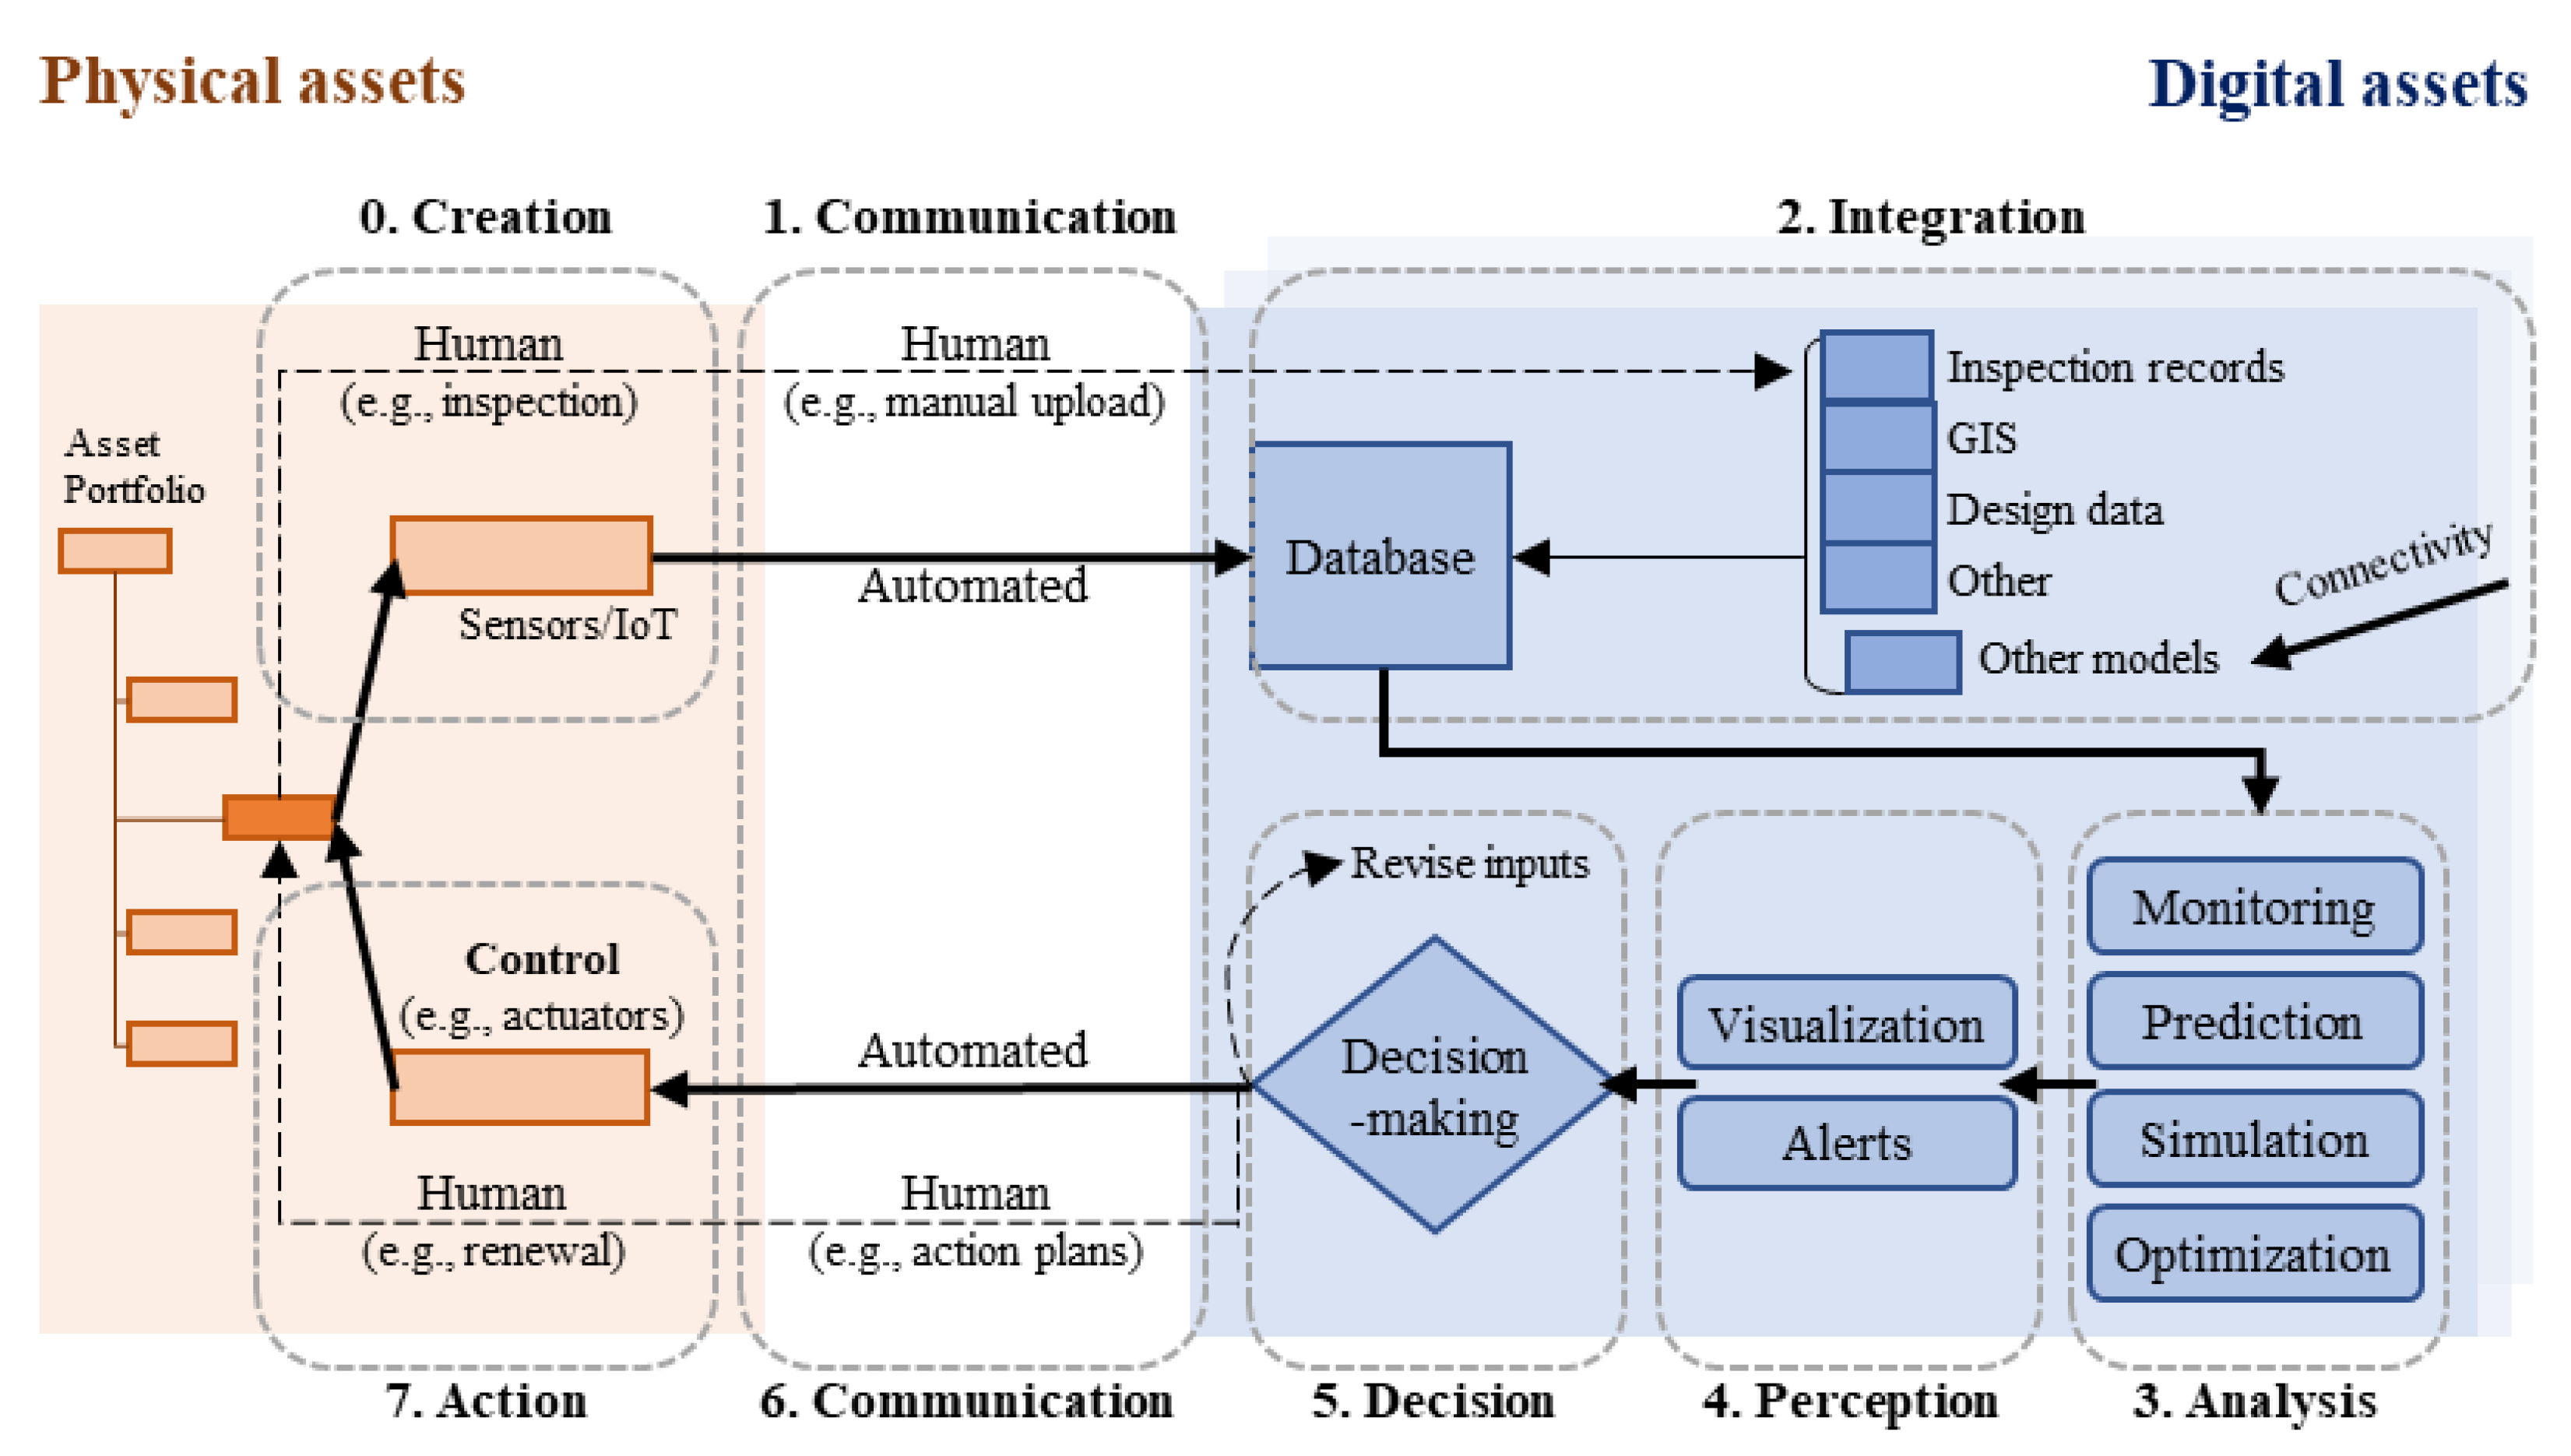
2.2. The Architecture
2.2.1. Creation
2.2.2. Communication
2.2.3. Integration
2.2.4. Analysis
- -
- Monitoring, which can be descriptive (if perceptions focus on performance without analysing the underlying causes) or diagnostic (if there is a root cause failure analysis);
- -
- Prediction and simulation, where the goal is to predict the future behaviour of a phenomenon based on historical data and the combination of multiple scenarios. This application includes predictive models, stochastic and deterministic simulations, etc.;
- -
- Optimisation, which can be considered prescriptive (if recommendations for improving asset/system performance are proposed) or cognitive (if these improvement actions are performed autonomously by artificial intelligence mechanisms).
2.2.5. Perception
2.2.6. Decision
2.2.7. Action
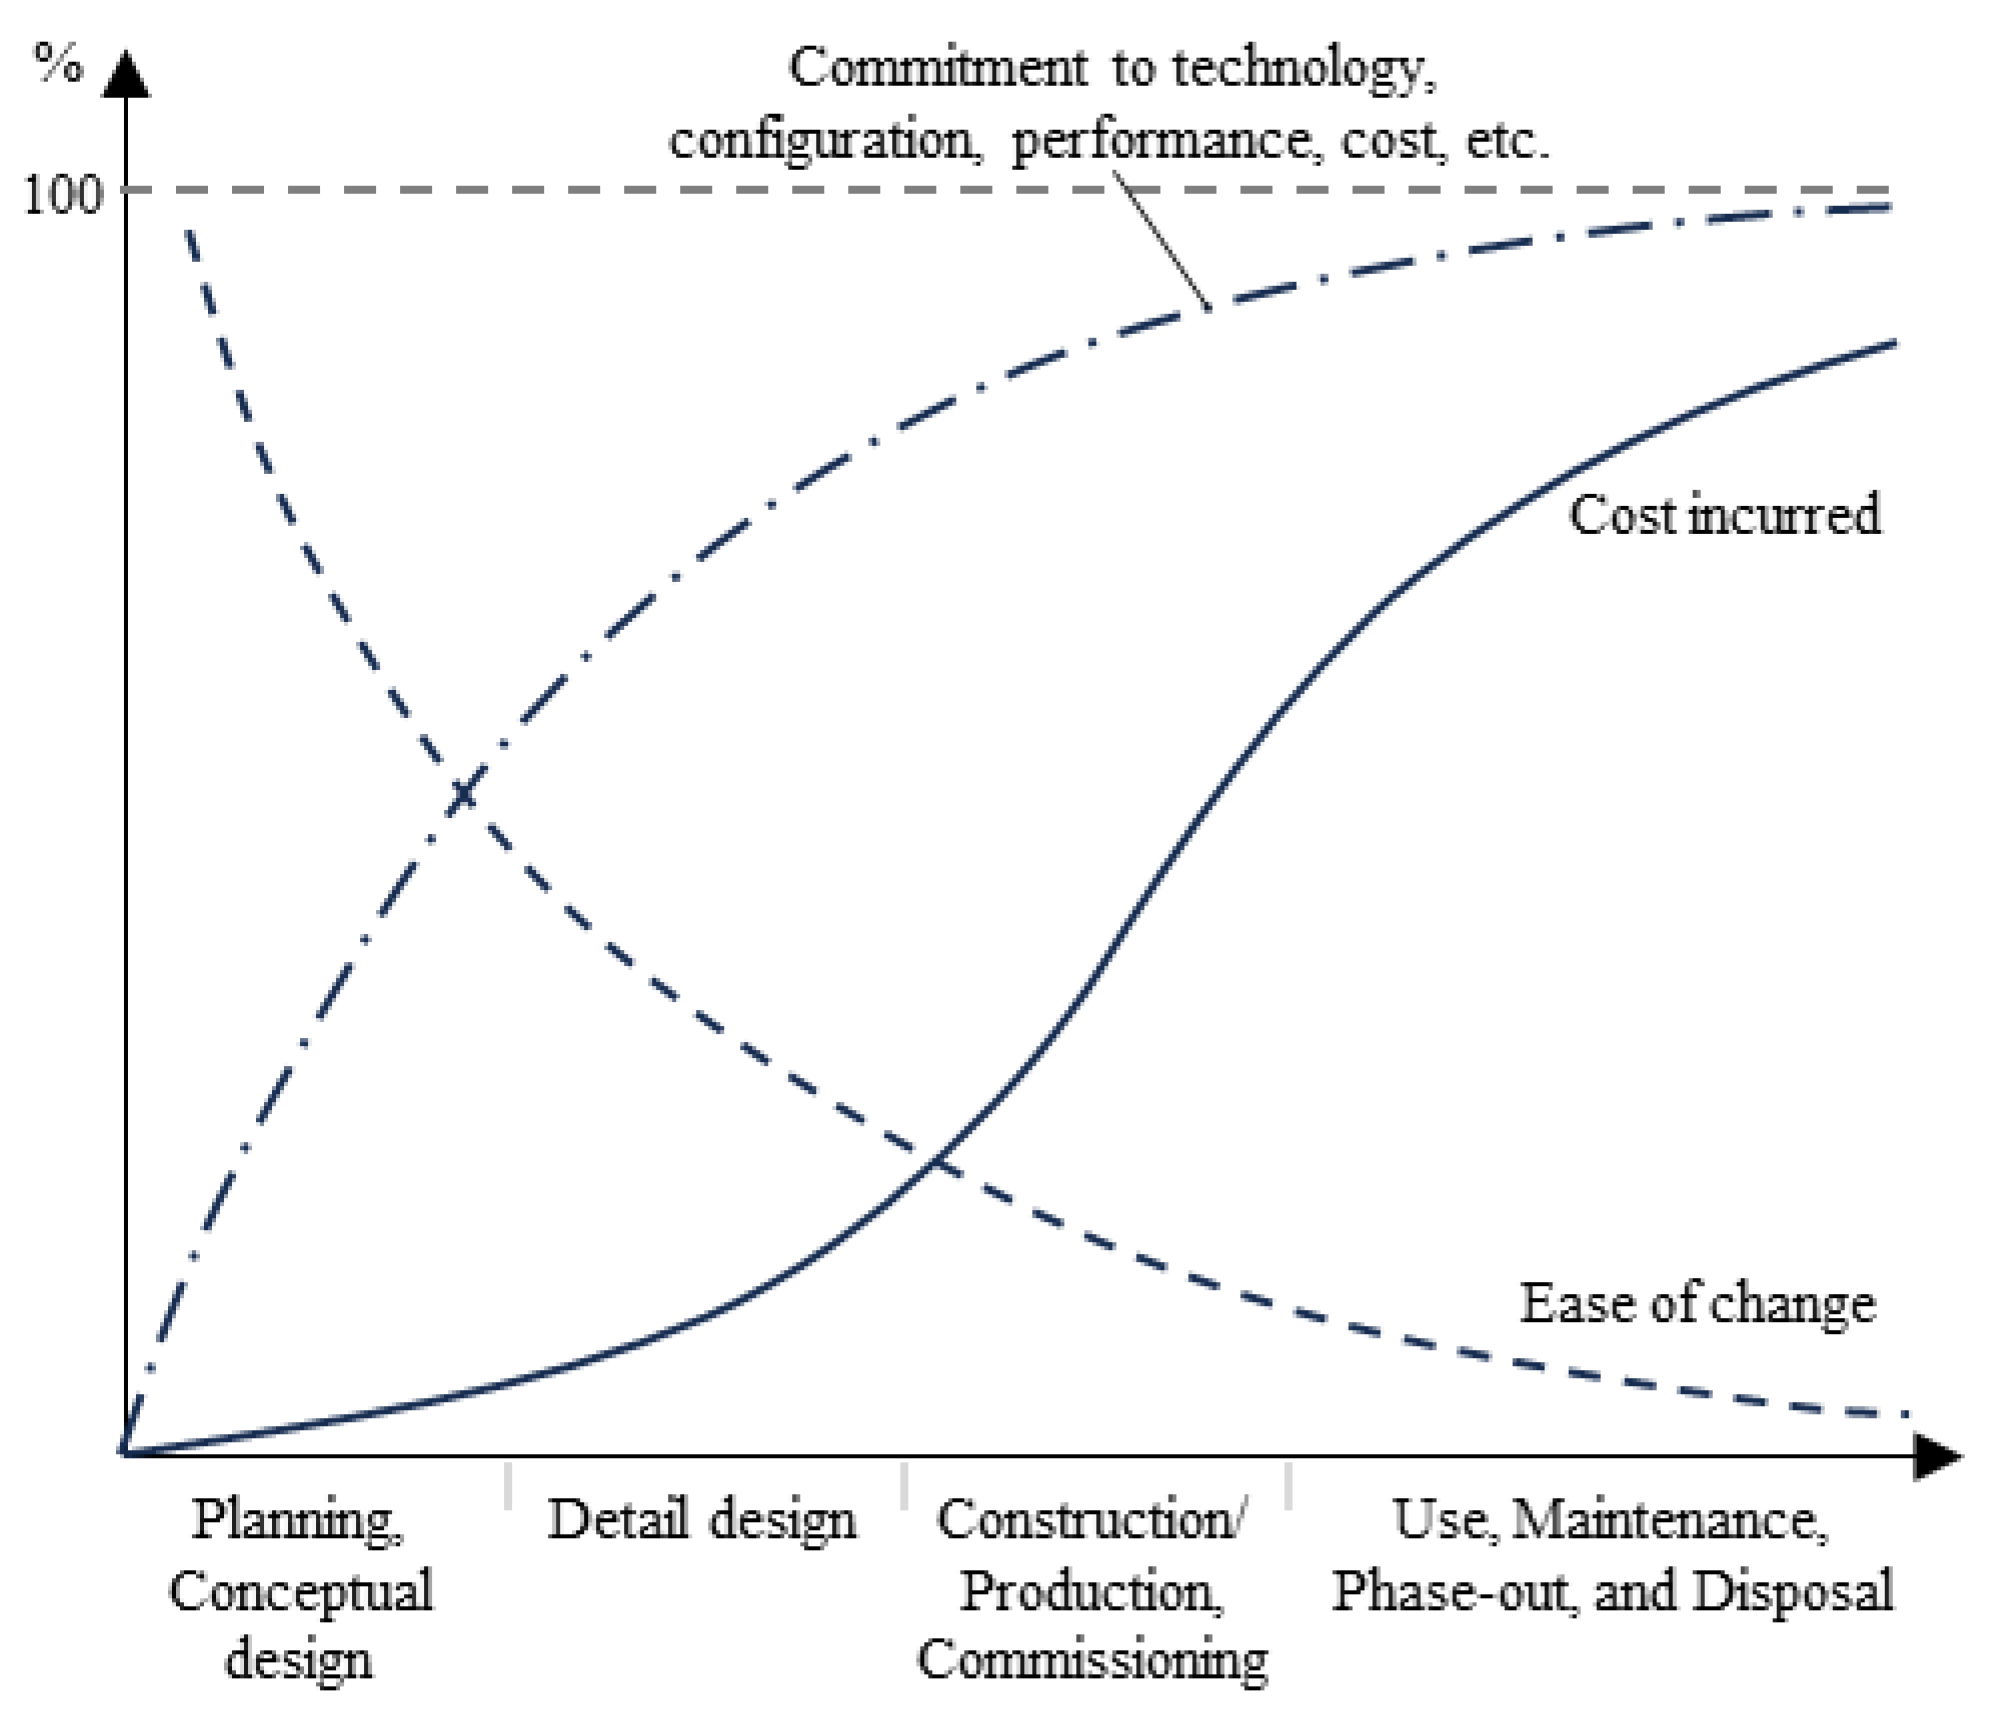
3. Digital Twinning throughout the Life Cycle of Physical Assets
3.1. Uses and Life Cycle Phases of Physical Assets
3.1.1. Planning and Design
3.1.2. Construction
3.1.3. Use
3.1.4. End of Life
3.2. Summary
4. Assessing the Level of Digital Twinning (LoDT)
4.1. UNI-TWIN—The Unified Digital Twinning Assessment Model
- Since the concept of a “Digital Twin” requires a digital representation and a real-time data connection from the physical space to the virtual space, this interpretation can be associated with a minimum development level of 4 in the “connection” dimension and a level 2 in the geometric representation;
- The so-called “Digital Shadows” [45], which envision an automatic data connection only between the physical and virtual spaces, correspond to a level 4 in the “connection” dimension;
- The so-called “Advanced Digital Twins” or “Intelligent Digital Twins” [58], because of their advanced analytical capabilities, using cognitive models that attempt to replicate human intelligence (artificial intelligence), correspond to level 5+ in the “intelligence” dimension;
- Because cyber–physical systems possess all the characteristics of a “true Digital Twin” but lack the geometric representation of the physical entity, these are assigned level 1 in “geometric representation”.
4.2. Digital Twinning Dimensions
4.2.1. Hierarchy
4.2.2. Connection
4.2.3. Synchronisation
4.2.4. Geometric Representation
4.2.5. Non-Geometric Representation
4.2.6. Intelligence
4.2.7. Interface
4.2.8. Accessibility
4.2.9. Autonomy
4.3. Summary and Additional Observations
4.4. Digital Twinning Level of Road and Rail Case Studies
4.4.1. Context
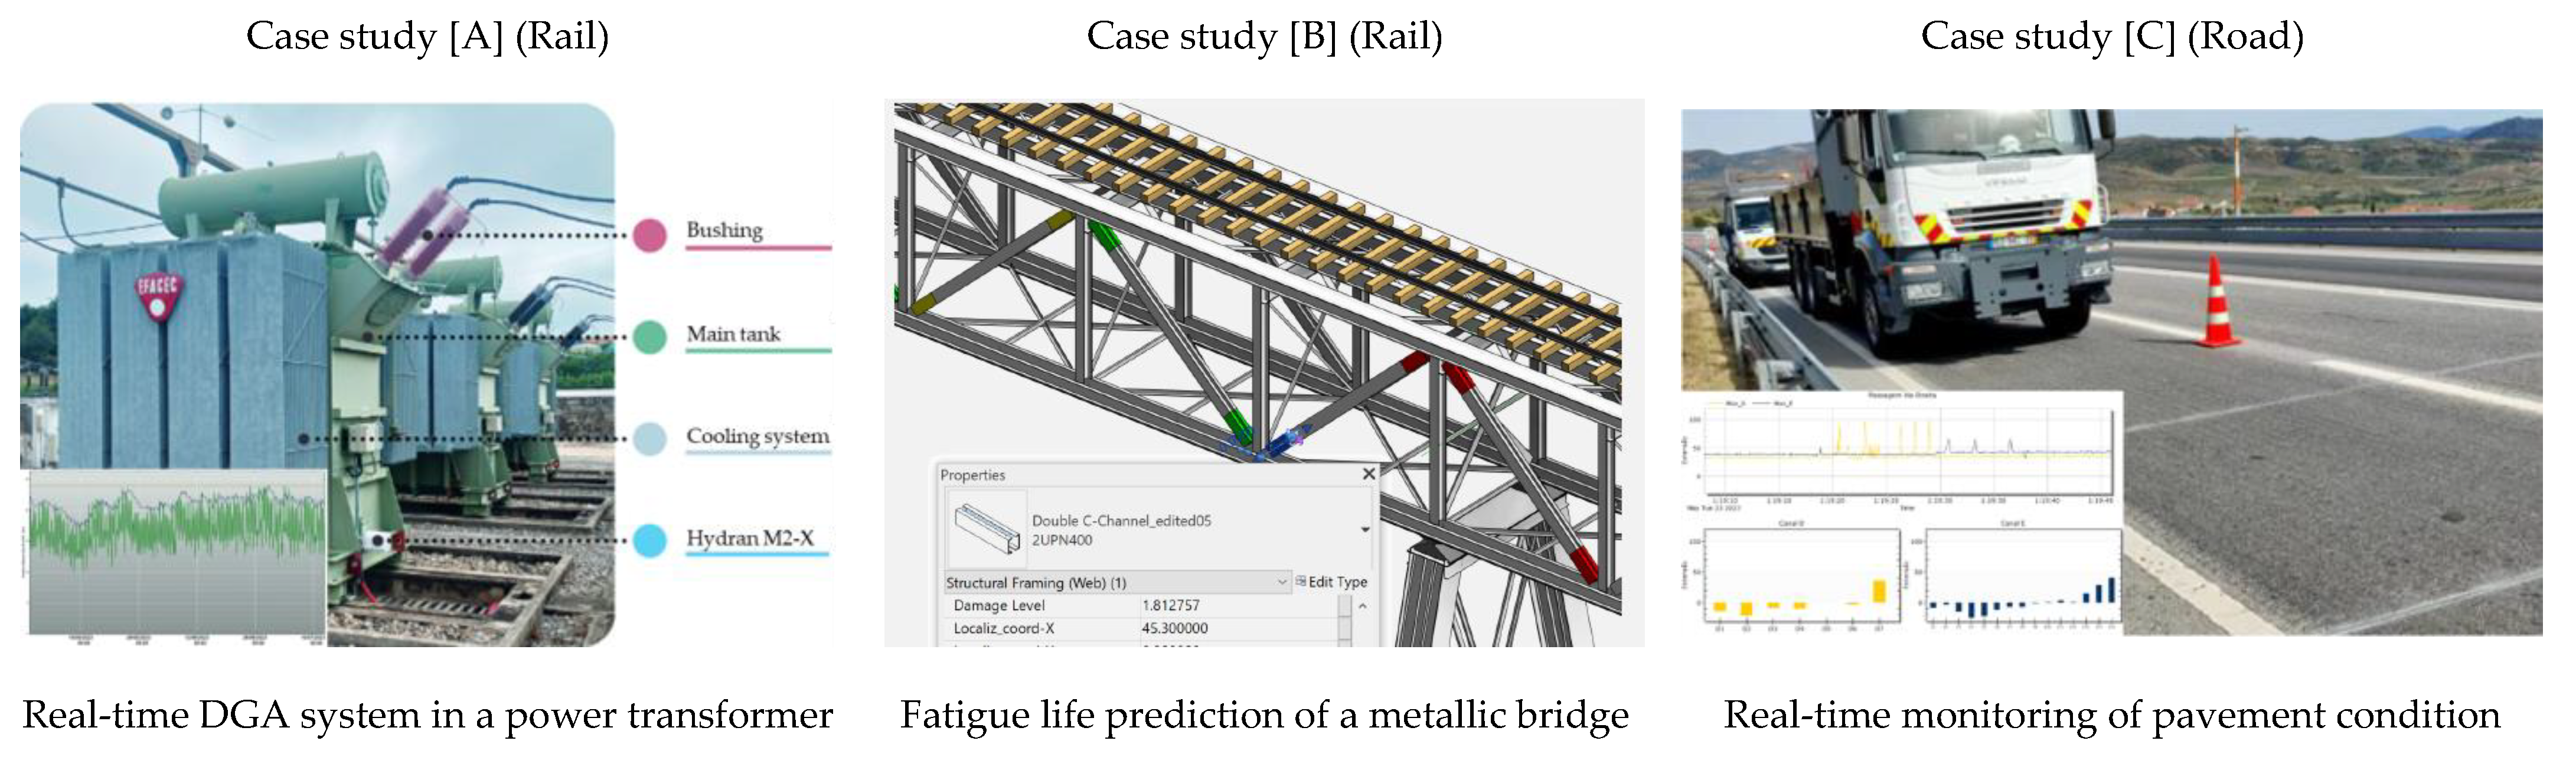
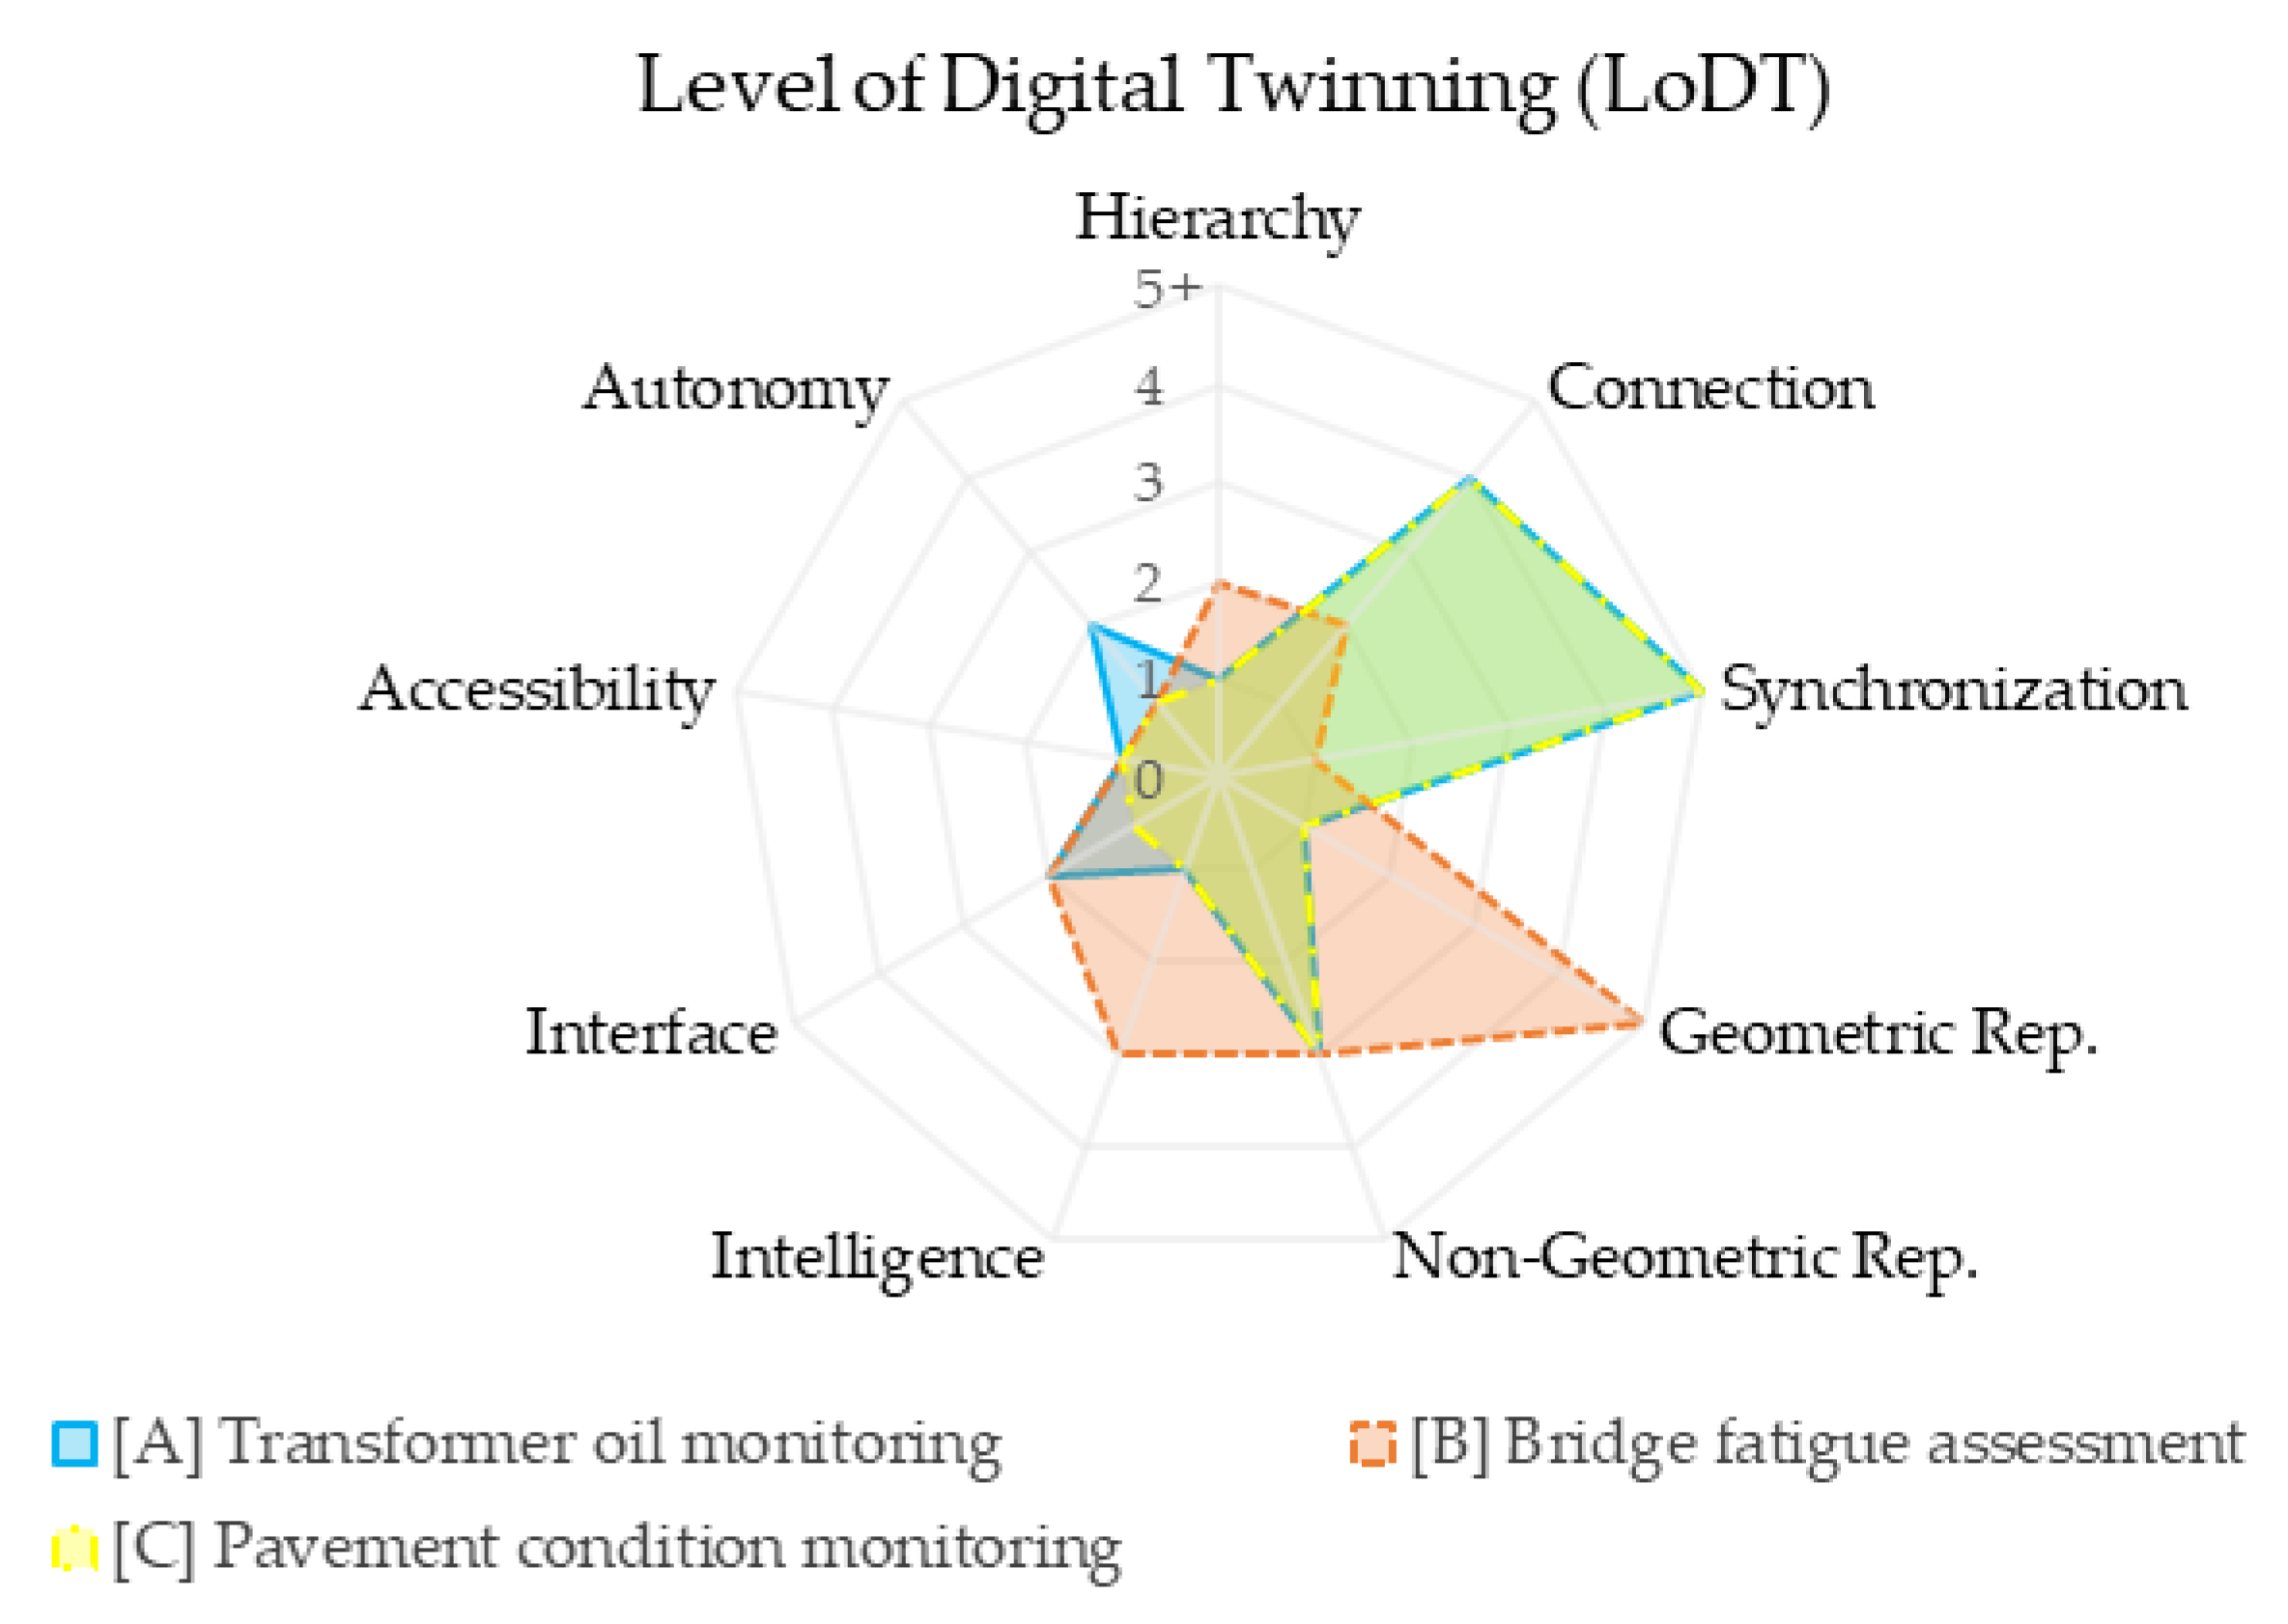
4.4.2. Case Studies
- -
- Case study [A] [104] involves a real-time Dissolved Gas Analysis (DGA) system in a power transformer at the Salreu traction substation, located on Linha do Norte railway line. The Hydran M2-X unit continuously monitors and communicates gas and moisture levels in the power transformer oil. It promptly alerts the user to abnormal readings, minimizing the risk of unplanned outages and reducing the associated costs of reactive interventions.
- -
- Case study [B] [105] focuses on the federation and interaction of a Fatigue Analysis System and a BIM model for the Várzeas railway bridge, located on the Linha da Beira Alta railway line. This integrated solution enables decision-makers to simulate traffic scenarios and predict the fatigue life of the bridge, facilitating informed long-term investment decisions.
- -
- Case study [C] [106,107] is a real-time monitoring system for a section of road pavement on the IC5 route, km 75 + 700. The project goal is to develop a pavement condition prediction model, integrated with a geometrical model, to support long-term renewal planning. At the present time, the system has only real-time monitoring capabilities (e.g., strain, temperature, and number of vehicles), so the predictive capabilities and the integration with the geometrical model are still to be achieved.
5. Conclusions
Author Contributions
Funding
Data Availability Statement
Conflicts of Interest
References
- Gartner. Gartner Identifies Five Emerging Technology Trends That Will Blur the Lines between Human and Machine; Gartner: Stamford, CT, USA, 2018; Available online: https://www.gartner.com/en/newsroom/press-releases/2018-08-20-gartner-identifies-five-emerging-technology-trends-that-will-blur-the-lines-between-human-and-machine (accessed on 27 September 2023).
- Mussomeli, A.; Parrot, A.; Umbenhauer, B.; Warshaw, L. Deloitte Insights—Tech Trends 2020; Deloitte: New York, NY, USA, 2020; Available online: https://www2.deloitte.com/content/dam/insights/us/articles/tech-trends-2020/DI_TechTrends2020.pdf (accessed on 17 July 2023).
- MarketsandMarkets. Digital Twin Industry Worth $110.1 Billion by 2028; MarketsandMarkets: Northbrook, IL, USA, 2023; Available online: https://www.marketsandmarkets.com/PressReleases/digital-twin.asp (accessed on 27 September 2023).
- IEEE Computer Society. IEEE Computer Society’s Top 12 Technology Trends for 2020; IEEE Computer Society: Washington, DC, USA, 2019; Available online: https://www.computer.org/press-room/2019-news/ieee-computer-societys-top-12-technology-trends-for-2020 (accessed on 27 September 2023).
- Tao, F.; Zhang, H.; Liu, A.; Nee, A.Y.C. Digital Twin in Industry: State-of-the-Art. IEEE Trans. Ind. Inform. 2019, 15, 2405–2415. [Google Scholar] [CrossRef]
- Vieira, J.; Poças Martins, J.; Marques de Almeida, N.; Patrício, H.; Gomes Morgado, J. Towards Resilient and Sustainable Rail and Road Networks: A Systematic Literature Review on Digital Twins. Sustainability 2022, 14, 7060. [Google Scholar] [CrossRef]
- Hasan, M.; Wegner, P. Digital Twin Market Report 2023–2027; IoT Analytics: Hamburg, Germany, 2023; Available online: https://iot-analytics.com/product/digital-twin-market-report-2023-2027/ (accessed on 7 September 2023).
- Agrawal, A.; Singh, V.; Thiel, R.; Pillsbury, M.; Knoll, H.; Puckett, J.; Fischer, M. Digital Twin in Practice: Emergent Insights from an ethnographic-action research study. In Construction Research Congress 2022; ASCE: Arlington, VA, USA, 2022; pp. 1253–1260. [Google Scholar] [CrossRef]
- Callcut, M.; Agliozzo, J.-P.C.; Varga, L.; McMillan, L. Digital Twins in Civil Infrastructure Systems. Sustainability 2021, 13, 11549. [Google Scholar] [CrossRef]
- Liu, M.; Fang, S.; Dong, H.; Xu, C. Review of digital twin about concepts, technologies, and industrial applications. J. Manuf. Syst. 2021, 58, 346–361. [Google Scholar] [CrossRef]
- Kochan, A. Digital Twin Concept of the ECTS application. J. Transp. Eng. 2020, 131, 87–98. [Google Scholar] [CrossRef]
- Chen, L.; Xie, X.; Lu, Q.; Parlikad, A.K.; Pitt, M.; Yang, J. Gemini Principles-Based Digital Twin Maturity Model for Asset Management. Sustainability 2021, 13, 8224. [Google Scholar] [CrossRef]
- Singh, M.; Fuenmayor, E.; Hinchy, E.P.; Qiao, Y.; Murray, N.; Devine, D. Digital Twin: Origin to Future. Appl. Syst. Innov. 2021, 4, 36. [Google Scholar] [CrossRef]
- Johnson, A.; Heaton, J.; Yule, S.; Luke, S.; Pocock, D.; Parkilad, A.K.; Schooling, J. Informing the information requirements of a digital twin: A rail industry case study. Proc. Inst. Civ. Eng.—Smart Infrastruct. Constr. 2022, 174, 33–45. [Google Scholar] [CrossRef]
- Arisekola, K.; Madson, K. Digital twins for asset management: Social network analysis-based review. Autom. Constr. 2023, 150, 104833. [Google Scholar] [CrossRef]
- Sanhudo, L.; Martins, J.P.; Rocha, A.; Soeiro, A.; Correia, T. A digitalização nas empresas da Indústria AEC portuguesa: Inquérito e análise de resultados. In FEUP DECivil, 10th ed.; U.PORTO: Porto, Portugal, 2022; pp. 13–17. Available online: https://repositorio-aberto.up.pt/handle/10216/144569 (accessed on 27 September 2023).
- Opoku, D.-G.J.; Perera, S.; Osei-Kyei, R.; Rashidi, M.; Bamdad, K.; Famakinwa, T. Barriers to the Adoption of Digital Twin in the Construction Industry: A Literature Review. Informatics 2023, 10, 14. [Google Scholar] [CrossRef]
- Bowers, K.; Buscher, V.; Dentten, R.; Edwards, M.; England, J.; Enzer, M.; Parlikad, A.K.; Schooling, J. Smart Infrastructure: Getting more from Strategic Assets; University of Cambridge: Cambridge, UK, 2017; Available online: https://www-smartinfrastructure.eng.cam.ac.uk/files/the-smart-infrastructure-paper (accessed on 27 September 2023).
- Grieves, M.; Vickers, J. Digital Twin: Mitigating Unpredictable, Undesirable Emergent Behavior in Complex Systems. In Transdisciplinary Perspectives on Complex Systems, 1st ed.; Kahlen, F.-J., Flumerfelt, S., Alves, A., Eds.; Springer: Cham, Switzerland, 2017; pp. 85–113. [Google Scholar] [CrossRef]
- Ariyachandra, M.R.; Brilakis, I.K. Digital Twinning of Railway Overhead Line Equipment from Airborne LiDAR Data; International Symposium on Automation and Robotics in Construction (ISARC): Kitakyushu, Japan, 2020; pp. 1270–1277. ISBN 978-952-94-3634-7. [Google Scholar]
- Lu, R.; Brilakis, I.K. Digital twinning of existing reinforced concrete bridges from labelled point clusters. Autom. Constr. 2019, 105, 102837. [Google Scholar] [CrossRef]
- Saariluoma, P.; Karvonen, A.; Sorsamäki, L. Human Digital Twins in Acquiring Information About Human Mental Processes for Cognitive Mimetics. In Information Modelling and Knowledge Bases XXXIII; Tropmann-Frick, M., Jaakkola, H., Thalheim, B., Kiyoki, Y., Yoshida, N., Eds.; IOS Press: Amsterdam, The Netherlands, 2021; Frontiers in Artificial Intelligence and Applications, 343; pp. 163–176. [Google Scholar] [CrossRef]
- Schleich, B.; Anwer, N.; Mathieu, L.; Wartzack, S. Shaping the digital twin for design and production engineering. CIRP Ann. 2017, 66, 141–144. [Google Scholar] [CrossRef]
- Rathore, M.M.; Shah, S.A.; Shukla, D.; Bentafat, E.; Bakiras, S. The Role of AI, Machine Learning, and Big Data in Digital Twinning: A Systematic Literature Review, Challenges, and Opportunities. IEEE Access 2021, 9, 32030–32052. [Google Scholar] [CrossRef]
- Piromalis, D.; Kantaros, A. Digital Twins in the Automotive Industry: The Road toward Physical-Digital Convergence. Appl. Syst. Innov. 2022, 5, 65. [Google Scholar] [CrossRef]
- Bolton, A.; Butler, L.; Dabson, I.; Enzer, M.; Evans, M.; Fenemore, T.; Harradence, F.; Keaney, E.; Kemp, A.; Luck, A.; et al. Gemini Principles; CDBB: Cambridge, UK, 2018. [Google Scholar] [CrossRef]
- ISO 55000; ISO 55000:2014—Asset Management—Overview, Principles and Terminology. International Organization for Standardization: Geneva, Switzerland, 2014.
- Olcott, S.; Mullen, C. Digital Twin Consortium Defines Digital Twin; Digital Twin Consortium: Boston, MA, USA, 2020; Available online: https://www.digitaltwinconsortium.org/2020/12/digital-twin-consortium-defines-digital-twin/ (accessed on 27 September 2023).
- McKee, D. Platform Stack Architectural Framework: An Introductory Guide. In A Digital Twin Consortium White Paper; Digital Twin Consortium: Boston, MA, USA, 2023; Available online: https://www.digitaltwinconsortium.org/platform-stack-architectural-fram-formework-an-introductory-guide-form/ (accessed on 11 July 2023).
- Digital Twin Hub. Available online: https://digitaltwinhub.co.uk/glossary/digital-twin/ (accessed on 27 September 2023).
- Mercer, A. Are We Digital Twinning Yet? Building Smart: Kings Langley, UK, 2021; Available online: https://www.buildingsmart.org/are-we-digital-twinning-yet/ (accessed on 20 September 2023).
- Change2Twin. Digital Twin, 2021. Available online: https://www.change2twin.eu/digital-twin/ (accessed on 20 September 2023).
- ISO 23247-1; ISO 23247-1:2021—Automation systems and integration—Digital twin framework for manufacturing—Part 1: Overview and general principles. International Organization for Standardization: Geneva, Switzerland, 2021.
- Redman, T. Seizing Opportunity in Data Quality. In Frontiers; MITSloan Management Review: Cambridge, MA, USA, 2017; Available online: https://sloanreview.mit.edu/article/seizing-opportunity-in-data-quality/ (accessed on 25 July 2023).
- APDA. Sistemas de Informação Na Gestão de Ativos—Análise SWOT 2022; Associação Portuguesa de Distribuição e Drenagem de Águas, Comissão Especializada de Gestão de Ativos: Lisbon, Portugal, 2022; Available online: https://apda.pt/site/upload/files/apda_sistemas_informacao_gestao_ativos_cega2022.pdf (accessed on 7 March 2023).
- Ammar, A.; Nassereddine, H.; Dadi, G. Roadmap to a Holistic Highway Digital Twin: A Why, How, & Why Framework. Crit. Infrastruct.—Mod. Approach New Dev. 2022, 3, 1–22. [Google Scholar] [CrossRef]
- Rowley, J. The wisdom hierarchy: Representations of the DIKW hierarchy. J. Inf. Sci. 2007, 33, 163–180. [Google Scholar] [CrossRef]
- Cataldo, J.; Prochno, P. Cognitive Assets: A Model to Understand the Organizational Appropriation of Collective Tacit Knowledge. In Management of Technology Key Success Factors for Innovation and Sustainable Development; Morel-Guimaraes, L., Khalil, T., Hosni, Y., Eds.; Elsevier: Oxford, UK, 2005; pp. 123–133. Available online: https://www.researchgate.net/publication/265406151_Cognitive_Assets_A_Model_to_Understand_the_Organizational_Appropriation_of_Collective_Tacit_Knowledge (accessed on 27 March 2023).
- ISO/DIS 55013; ISO/DIS 55013—Asset Management—Guidance on the Management of Data Assets (Draft). International Organization for Standardization: Geneva, Switzerland, 2023. Available online: https://www.iso.org/obp/ui/en/#iso:std:iso:55013:dis:ed-1:v1:en (accessed on 27 September 2023).
- Parrot, A.; Warshaw, L. Industry 4.0 and the Digital Twin—Manufacturing Meets Its Match; Deloitte University Press: New York, NY, USA, 2017; Available online: https://www2.deloitte.com/content/dam/Deloitte/kr/Documents/insights/deloitte-newsletter/2017/26_201706/kr_insights_deloitte-newsletter-26_report_02_en.pdf (accessed on 27 September 2023).
- El Mokhtari, K.; Panushev, I.; McArthur, J. Development of a Cognitive Digital Twin for Building Management and Operations. Front. Built Environ. 2022, 8, 856873. [Google Scholar] [CrossRef]
- Stanford-Clark, A.; Frank-Schultz, E. IBM Digital Twin Point of View December 2020; IBM Academy of Technology: New York, NY, USA, 2020. [Google Scholar]
- Abdellah, A.; Koucheryavy, A. Survey on Artificial Intelligence Techniques in 5G Networks. Telecom IT 2020, 8, 1–10. [Google Scholar] [CrossRef]
- Penn State. BIM Uses. Pennsylvania State University—College of Engineering. Available online: https://bim.psu.edu/uses/ (accessed on 27 September 2023).
- Kritzinger, W.; Karner, M.; Traar, G.; Henjes, J.; Sihn, W. Digital Twin in manufacturing: A categorical literature review and classification. IFAC-PapersOnLine 2018, 51, 1016–1022. [Google Scholar] [CrossRef]
- Digital Twin Consortium. Glossary of Digital Twins. Available online: https://www.digitaltwinconsortium.org/glossary/glossary/#digital-thread (accessed on 27 September 2023).
- Barbosa, F.; Woetzel, J.; Mischke, J.; Ribeirinho, M.J.; Sridhar, M.; Parsons, M.; Bertram, N.; Brown, S. Reinventing Construction: A Route to Higher Productivity; McKinsey Global Institute; McKinsey & Company: New York, NY, USAC, 2017; Available online: https://www.mckinsey.com/capabilities/operations/our-insights/reinventing-construction-through-a-productivity-revolution (accessed on 18 September 2023).
- Borrmann, A.; König, M.; Koch, C.; Beetz, J. Building Information Modeling: Why? What? How? In Building Information Modeling; Borrmann, A., König, M., Koch, C., Beetz, J., Eds.; Springer: Cham, Switzerland, 2018. [Google Scholar] [CrossRef]
- CBC. Distributed Information & BIM Total Lifecycle. Construction Blockchain Consortium, Digital Construction Management Series, 2022. Available online: https://www.constructionblockchain.org/white-papers (accessed on 27 September 2023).
- Blanchard, B.S.; Fabrycky, W.J. Systems Engineering and Analysis, 4th ed.; Pearson Prentice Hall: Englewood Cliffs, NJ, USA, 1990; ISBN 978-0131869776. [Google Scholar]
- Murman, E.M.; Walton, M.; Rebentisch, E. Challenges in the Better, Faster, Cheaper Era of Aeronautical Design, Engineering, and Manufacturing. Aeronaut. J. 2000, 104, 481–489. [Google Scholar] [CrossRef]
- Feist, S.; Sanhudo, L.; Esteves, V.; Pires, M.; Costa, A.A. Algoritmos de aprendizagem computacional para a modularização de projetos de arquitetura. In 4° Congresso Português De Building Information Modelling; UMinho Editora: Braga, Portugal, 2022. [Google Scholar] [CrossRef]
- KiwiRail. Hutt Valley Line—Digital Shields. Available online: https://www.kiwirail.co.nz/our-network/our-regions/wellington/hutt-valley-line/digital-shields/ (accessed on 27 September 2023).
- Rev@Construction [a]. O Projeto Mobilizador Para a Revolução Digital da Construção—Conferência Final. 27 June 2023. Available online: https://revconstruction.pt/wp-content/uploads/2023/06/Rev@_Conferencia_FINAL_total.pdf (accessed on 27 September 2023).
- Rev@Construction [b]. PointCloud4BIM. 30 June 2023. Available online: https://revconstruction.pt/en/outputs/pointcloud4bim/ (accessed on 27 September 2023).
- Yu, G.; Lin, D.; Wang, Y.; Hu, M.; Sugumaran, V.; Chen, J. Digital Twin-enabled and Knowledge-driven decision support for tunnel electromechanical equipment maintenance. Tunn. Undergr. Space Technol. 2023, 140, 105318. [Google Scholar] [CrossRef]
- Barreto, P.; Silva, L.; Cabral, R.; Correia, M.; Davies, S.; Cordeiro, T. Monitorização de obras geotécnicas com técnicas baseadas em satélites. In 10° Congresso Rodoferroviário Português; Centro Rodoferroviário Português: Lisbon, Portugal, 2022; Available online: https://10crp.crp.pt/wp-content/uploads/2022/07/paper_132.pdf (accessed on 27 September 2023).
- Madni, A.M.; Madni, C.C.; Lucero, S.D. Leveraging Digital Twin Technology in Model-Based Systems Engineering. Systems 2019, 7, 7. [Google Scholar] [CrossRef]
- Patrício, H. Roboshot. In 1° Workshop BIM/SIG—Infraestruturas Lineares e Geotécnicas; Sociedade Portuguesa de Geotecnia: Lisbon, Portugal, 2023; Available online: https://zenodo.org/record/8333912 (accessed on 11 October 2023).
- Azevedo, C. Asset Management Insights—Phases, Practices, And Value, 1st ed.; Industrial Press, Inc.: Norwalk, CT, USA, 2019; ISBN 978-0-8311-3644. [Google Scholar]
- Dinis, F.M.; Poças Martins, J.; Guimarães, A.S.; Rangel, B. BIM and Semantic Enrichment Methods and Applications: A Review of Recent Developments. Arch. Comput. Methods Eng. 2022, 29, 879–895. [Google Scholar] [CrossRef]
- Matoseiro Dinis, F.; Rodrigues, R.; Pedro da Silva Poças Martins, J. Development and validation of natural user interfaces for semantic enrichment of BIM models using open formats. Constr. Innov. 2023. ahead-of-print. [Google Scholar] [CrossRef]
- Uhlenkamp, J.-F.; Hauge, J.B.; Broda, E.; Lütjen, M.; Freitag, M.; Thoben, K.-D. Digital Twins: A Maturity Model for Their Classification and Evaluation. IEEE Access 2022, 10, 69605–69635. [Google Scholar] [CrossRef]
- Rook, B. How Digital Twins Are Transforming Wind Operations; Windpower Engineering & Development: Cleveland, OH, USA, 2019; Available online: https://www.windpowerengineering.com/how-digital-twins-are-transforming-wind-operations/ (accessed on 27 September 2023).
- Digital Government Authority. Digital Twin, 2021. Available online: https://dga.gov.sa/sites/default/files/2022-08/Digital%20Twin.pdf (accessed on 27 September 2023).
- TechUK. Unlocking Value Across the UK’s Digital Twin Ecosystem. February, 2021. Available online: https://www.ashb.com/wp-content/uploads/2021/10/IS-2021-240.pdf (accessed on 27 September 2023).
- Lamb, K. Principle-Based Digital Twins: A Scoping Review; Centre for Digital Built Britain: Cambridge, UK, 2019. [Google Scholar] [CrossRef]
- Evans, S.; Savian, C.; Burns, A.; Cooper, C. Digital Twins for the Built Environment—An Introduction to the Opportunities, Benefits, Challenges and Risks; The Institution of Engineering and Technology: Hertfordshire, UK, 2019; Available online: https://www.theiet.org/media/8762/digital-twins-for-the-built-environment.pdf (accessed on 27 September 2023).
- CDBB [a]. Digital Twin Interactive Navigator. Centre for Digital Built Britain, version 01, 11 May 2021. Available online: https://www.cdbb.cam.ac.uk/files/cdbb_dt_navigator_with_links_11.05.2021.pdf (accessed on 27 September 2023).
- Kim, Y.-W.; Yoo, S.; Lee, H. Characterization of Digital Twin; ResearchGate: Daejeon, South Korea, 2023; Available online: https://www.researchgate.net/publication/353930234 (accessed on 27 September 2023).
- Bray, R. Harnessing BIM to Realize Digital Twins; Autodesk: San Francisco, CA, USA, 2021; Available online: https://investors.autodesk.com/static-files/ed778b66-bae4-4006-99a8-064359ff196e (accessed on 27 September 2023).
- BSI Group. JTC1-SC41/298/NP Digital Twin—Maturity Model and Guidance for a Maturity Assessment; BSI Group, Standards Development: London, UK, 2022; Available online: https://standardsdevelopment.bsigroup.com/projects/9022-07390#/section (accessed on 27 September 2023).
- ARUP. Digital Twin—Towards a Meaningful Framework; ARUP: London, UK, 2019; Available online: www.arup.com/digitaltwinreport (accessed on 27 September 2023).
- Stark, R.; Damerau, T. Digital Twin. In CIRP Encyclopedia of Production Engineering; Chatti, S., Tolio, T., Eds.; Springer: Heidelberg, Germany, 2019. [Google Scholar] [CrossRef]
- Harper, K.E.; Ganz, C.; Malakuti, S. Digital Twin Architecture and Standards. IIC J. Innov. 2019, 12pp. Available online: https://www.iiconsortium.org/news-pdf/joi-articles/2019-November-JoI-Digital-Twin-Architecture-and-Standards.pdf (accessed on 27 September 2023).
- Woods, E.; Freeas, B. Creating Zero Carbon Communities: The Role of Digital Twins; Commissioned by Integrated Environmental Solutions (IES): Glasgow, Scotland, 2019; Available online: https://www.iesve.com/support/white-papers/digital-twin-white-paper.pdf (accessed on 27 September 2023).
- Turner, J.; Ferris, R.; Eckhardt, S. Infrastructure Digital Twin Maturity: A Model for Measuring Progress. A Digital Twin Consortium White Paper, 4 August 2021. Available online: https://www.digitaltwinconsortium.org/wp-content/uploads/sites/3/2022/06/Infrastructure-Digital-Twin-Maturity-Model.pdf (accessed on 27 September 2023).
- Bolpagni, M.; Hooper, E.; Boutle, A.; Rossiter, D.; Churcher, D.; Tennyson, R.; Davidson, S.; Thompson, N.; Dearlove, J.; Winfield, M.; et al. Information Management According to BS EN ISO 19650—Guidance Part 2: Processes for Project Delivery, 4th ed.; UK BIM Framework: London, UK, 2020; Available online: https://ukbimframework.org/wp-content/uploads/2020/05/ISO19650-2Edition4.pdf (accessed on 18 October 2023).
- EN 17412-1; EN 17412-1:2020—Building Information Modelling—Level of Information Need—Part 1: Concepts and principles. European Committee for Standardization: Brussels, Belgium, 2020.
- ISO 19650-1; ISO 19650-1:2018—Organization and digitization of information about buildings and civil engineering works, including building information modelling (BIM)—Information management using building information modelling—Part 1: Concepts and principles. International Organization for Standardization: Geneva, Switzerland, 2018.
- Nour El-Din, M.; Pereira, P.F.; Poças Martins, J.; Ramos, N.M.M. Digital Twins for Construction Assets Using BIM Standard Specifications. Buildings 2022, 12, 2155. [Google Scholar] [CrossRef]
- CDBB [b]. Describing Digital Twins—Anatomy and Taxonomy for Digital Twins. Centre for Digital Built Britain, National Digital Twin Programme, 2021. Available online: https://digital-twins.kumu.io/describing-digital-twins (accessed on 27 September 2023).
- Zheng, X.; Lu, J.; Kiritsis, D. The emergence of cognitive digital twin: Vision, challenges and opportunities. Int. J. Prod. Res. 2022, 60, 7610–7632. [Google Scholar] [CrossRef]
- NBIMS-USTM V3; National Institute of Building Sciences BuildingSMART Alliance. National BIM Standard—United States Version 3. National Institute of Building Sciences BuildingSMART Alliance: Washington, DC, USA, 2015. Available online: https://www.nationalbimstandard.org/files/NBIMS-US_V3_5.2_Minimum_BIM.pdf (accessed on 27 September 2023).
- NATSPEC BIM. NATSPEC National BIM Guide—BIM Object/Element Matrix Manual v1.0. Available online: https://bim.natspec.org/images/NATSPEC_Documents/NATSPEC_BIM_Object-Element_Matrix_v1.0_Sep_2011.xls (accessed on 18 October 2023).
- UNITED BIM. BIM Level of Development|LOD 100, 200, 300, 350, 400, 500. Available online: https://www.united-bim.com/bim-level-of-development-lod-100-200-300-350-400-500/ (accessed on 18 October 2023).
- Zeda.io. What is MoSCoW Prioritisation & How to Use It? Available online: https://zeda.io/blog/what-is-moscow-prioritisation-how-to-use-it (accessed on 18 October 2023).
- Bittner, K.; Spence, I. Use Case Modeling, 1st ed.; Addison-Wesley Professional, Addison-Wesley Object Technology Series; Addison Wesley: Boston, MA, USA, 2002; ISBN 978-0-201-70913-1. [Google Scholar]
- Weird Geek. 5 Types of Analytics: Prescriptive, Predictive, Diagnostic, Descriptive and Cognitive Analytics; Weird Geek: Seoul, Republic of Korea, 2018; Available online: https://www.weirdgeek.com/2018/11/types-of-analytics/ (accessed on 27 September 2023).
- BASF. BASF Coatings Online Trainings—Chapter 4—Data Analytics. Available online: https://lean.coatings-campus.basf.com/en/chapter-4-data-analytics (accessed on 27 September 2023).
- Liu, Y.K.; Ong, S.K.; Nee, A.Y.C. State-of-the-art survey on digital twin implementations. Adv. Manuf. 2022, 10, 1–23. [Google Scholar] [CrossRef]
- Mirzaei, K.; Arashpour, M.; Asadi, E.; Masoumi, H.; Li, H. Automatic generation of structural geometric digital twins from point clouds. Sci. Rep. 2022, 12, 22321. [Google Scholar] [CrossRef]
- Schrotter, G.; Hürzeler, C. The Digital Twin of the City of Zurich for Urban Planning. PFG 2020, 88, 99–112. [Google Scholar] [CrossRef]
- Singapore Land Authority. Virtual Singapore. Available online: https://www.sla.gov.sg/geospatial/gw/virtual-singapore (accessed on 27 September 2023).
- Xue, F.; Lu, W.; Chen, K. Automatic Generation of Semantically Rich As-Built Building Information Models Using 2D Images: A Derivative-Free Optimization Approach. Comput.-Aided Civ. Infrastruct. Eng. 2018, 33, 926–942. [Google Scholar] [CrossRef]
- BIM Forum. Level of Development Specification; BIM Forum: Woburn, MA, USA, 2015; Available online: https://bimforum.org/wp-content/uploads/2022/06/BIMForum_LOD_2015_reprint.pdf (accessed on 19 October 2023).
- Swaddle, P. Specification Development and Digital Plans of Work; National Building Specification: England, UK, 2022; Available online: https://www.thenbs.com/knowledge/specification-development-and-digital-plans-of-work (accessed on 19 October 2023).
- Meschini, S.; Pellegrini, L.; Locatelli, M.; Accardo, D.; Tagliabue, L.C.; Di Giuda, G.M.; Avena, M. Toward cognitive digital twins using a BIM-GIS asset management system for a diffused university. Front. Built Environ. 2022, 8, 959475. [Google Scholar] [CrossRef]
- Moore, W.J.; Starr, A.G. An intelligent maintenance system for continuous cost-based prioritisation of maintenance activities. Comput. Ind. 2006, 57, 595–606. [Google Scholar] [CrossRef]
- Shahzad, M.; Shafiq, M.T.; Douglas, D.; Kassem, M. Digital Twins in Built Environments: An Investigation of the Characteristics, Applications, and Challenges. Buildings 2022, 12, 120. [Google Scholar] [CrossRef]
- Lee, D.; Lee, S.H.; Masoud, N.; Krishnan, M.S.; Li, V.C. Integrated digital twin and blockchain framework to support accountable information sharing in construction projects. Autom. Constr. 2021, 127, 103688. [Google Scholar] [CrossRef]
- IP. Relatório e Contas, 2022. Available online: https://www.infraestruturasdeportugal.pt/sites/default/files/inline-files/RC_2022_IP_nao_ESEF.pdf (accessed on 16 November 2023).
- IP. 50 Desafios de Inovação da IP, 2023. Available online: https://www.infraestruturasdeportugal.pt/sites/default/files/inline-files/DesafiosIDI-2023.pdf (accessed on 16 November 2023).
- Ferrovia 4.0. Sistema de Análise de Óleos Isolantes em Transformadores de Tração. Ferrovia 4.0, PPS1—Sustainability of the Railway System, 2023. Available online: http://ferrovia40.pt/estrutura-do-projeto/sustentabilidade-do-sistema-ferroviario/?lang=en (accessed on 19 October 2023).
- Nhamage, I.A.; Dang, N.-S.; Horas, C.S.; Poças Martins, J.; Matos, J.A.; Calçada, R. Performing Fatigue State Characterization in Railway Steel Bridges Using Digital Twin Models. Appl. Sci. 2023, 13, 6741. [Google Scholar] [CrossRef]
- Oliveira, J.; Rebelo, F.; Silva, H.; Oliveira e Sá, J.; Paixão, A.; Freire, A.C.; de Lurdes Antunes, M.; Fortunato, E.; Afonso, J.; Alvarenga, P.; et al. Desenvolvimento de um Sistema de Monitorização para Avaliar o Desempenho de Pavimentos Rodoviários Durante o Seu ciclo de Vida – App Pav 4.0 lc; 10° Congresso Rodoferroviário Português: Lisbon, Portugal, 2022; Available online: https://10crp.crp.pt/wp-content/uploads/2022/07/paper_106.pdf (accessed on 27 September 2023).
- Rev@Construction [c]. Workshops Demonstradores PAV 4.0 LC. 24 May 2023. Available online: https://revconstruction.pt/wp-content/uploads/2023/05/Rev@_WSPAV40LC.pdf (accessed on 27 September 2023).


| Source | Definition |
|---|---|
| [28] | A DT is a virtual representation of real-world entities and processes, synchronised at a specified frequency and fidelity. DT systems transform business by accelerating holistic understanding, optimal decision making, and effective action. DTs use real-time and historical data to represent the past and present and simulate predicted futures. |
| [29] | (…) simply having a model, or a simulation without real data, or a dashboard without feedback or control of a real entity is insufficient to be called a DT. You need all the criteria (…) to be categorised as a DT. |
| [30] | A digital representation of a physical asset or the service delivered by it, used to make decisions that will affect the physical asset. Any changes to the physical assets will be reflected in the DT. |
| [31] | A DT is a representation of a physical asset or system in a digital form. A DT allows visual performance insights through continuous data inputs. |
| [32] | A DT is a digital replica of an artefact, process, or service that is so accurate that it can be used as basis for taking decisions. The digital replica and physical world are often connected by streams of data. |
| [33] | [manufacturing context] fit for purpose digital representation of an observable manufacturing element with synchronisation between the element and its digital representation |
| Planning and Design | Construction | Use | End of Life |
|---|---|---|---|
 | |||
| Comparison and analysis of solutions | Timeline planning of construction | Operations planning | Prediction of the “optimal replacement” point |
| Budgeting and tender preparation | Quantity take-off for market consultation | Monitoring operational conditions | Extraction of types and quantities of materials |
| Detection of design conflicts | Quantity extraction for measurement reports and billing | Communication with users and stakeholders | Planning of repurposing, deactivation or dismantling |
| Design solution optimisation | Execution control (schedule, cost, quality, etc.) | Service optimisation | |
| Accelerating the licensing process | Planning of activities involving special safety risks | Response to unforeseen events | |
| Human resource training in construction | Optimisation of maintenance activities (predictive) | ||
| Optimisation of the construction supply chain | Human resource training in operations and maintenance | ||
| Automation of construction processes | |||
| Accelerating construction commissioning | |||
| Dimension | Description |
|---|---|
| Hierarchy | The hierarchical level of the physical assets pertaining to the case |
| Connection | The type of data connection between the physical and digital spaces |
| Synchronisation | The frequency at which data is integrated into the digital space |
| Geometric representation | The type of geometric representation of the physical space |
| Non-geometric representation | The level of representation of non-geometric characteristics of the physical space that are relevant to the defined purpose |
| Intelligence | The type of intelligence associated with data analysis |
| Interface | How users interact with the information generated in the digital space |
| Accessibility | The scope of users that access the information generated by the digital space |
| Autonomy | The autonomy level of digital space in decision making |
| Level | Hierarchy | Connection | Synchro. | Geom. Rep. | NGeom. Rep. | Intelligence | Interface | Accessibility | Autonomy |
|---|---|---|---|---|---|---|---|---|---|
| 1 | Component | No connection | No synchronisation | No geometric representation | No representation of non-geometric characteristics | Descriptive (what is happening) | No interface | Single user | No autonomy (decisions and actions executed exclusively by humans) |
| 2 | Asset | Manual data flow in both ways (from physical to digital and vice versa) (digital model) | Monthly/yearly | Conceptual (the model is mass-indicative of area, height, volume, location, and orientation. It consists of symbols or other generic representations) | Only the necessary non-geometric requirements are represented, with flaws in quality, quantity and granularity | Diagnostic (why is it happening) | Local access | Minimal (multiple users in one team/department) | User-assistance (alerts and notifications are produced) |
| 3 | Asset class/group of assets | Semi-automatic in one way (e.g., manual acquisition supported by automatic tools like drones, RFID, or LiDAR) | Daily/weekly | Approximate (the elements are partially defined by outlining their approximate quantity, size, shape, and location) | The necessary requirements are represented with adequate quality, quantity and granularity, without major data flaws | Predictive (what could happen) | De-centralised and shared access (e.g., cloud, smartphones/tablets) | Limited (multiple users across same-level teams/departments) | Partial autonomy (it has control over some activities) |
| 4 | System of assets | Automatic in one way (e.g., digital shadow, from physical to digital) | Hourly/minutes | Precise (specific elements are confirmed as 3D object geometry. The model contains the accurate quantity, size, shape, location, and orientation.) | Both the necessary and important requirements are represented with adequate quality, quantity and granularity. Some data flaws can exist | Prescriptive (what should be done) | Immersive (Virtual Reality/Augmented Reality/Metaverse) | Advanced (multiple users across company structure) | High autonomy (critical tasks are performed autonomously, with little human intervention) |
| 5+ | System of Systems (portfolio) | Automatic in both ways (digital twin) | ≤seconds/event-driven | As-built (a verified representation in terms of size, shape, location, quantity, and orientation) | All non-geometric requirements (necessary, important, nice-to-have) are integrated with adequate quality, quantity and granularity | Cognitive (application of human-like intelligence to cause something to happen) | Smart hybrid (e.g., multi-sense technologies) | Full (multiple users across stakeholders) | Limited options for human intervention |
| Ad. from: | [82,83] | [45,63,74] | [63,74] | [63,84,85,86] | [87,88] | [63,89,90] | [74,76] | [63] | [63,70,73,74] |
| DT Element | Architecture Phase | Dimension |
|---|---|---|
| Physical entity | Creation | Hierarchy |
| Data | Connection | |
| Communication | Synchronization | |
| Integration | Non-geometric representation | |
| Digital models | Analysis | Intelligence |
| Perception | Geometric representation | |
| Decision making | Interface | |
| Decision | Autonomy | |
| Action |
| Case Study | Hierarchy | Connection | Synchron. | Geom. Rep. | NGeom. Rep. | Intelligence | Interface | Accessib. | Autonomy |
|---|---|---|---|---|---|---|---|---|---|
| [A] | (1) | (4) | (5+) | (1) | (3) | (1) | (2) | (1) | (2) |
| Component (oil of a single power transformer) | Automatic from physical to digital space (via Ethernet) | Readings sent to user every 15 s | No representation needed for this testing phase | PT ID, location, temperature, moisture and gas readings; it lacks gas characterization | Has the ability to detect abnormal readings according to pre-defined thresholds | Local computer with specific software | A single user has access to these data | Sends alerts in case of abnormal gas concentration values | |
| [B] | (2) | (2) | (1) | (5+) | (3) | (3) | (2) | (1) | (1) |
| Asset (Várzeas bridge, with component detail in the results) | Input of internal and external data were mainly manual/off-line | One-shot data inputs and simulations | As-is BIM model, LOD 300 | There is a lack of historical data related to a key variable (historical loads), but recent data and estimates are key inputs | Predictive capabilities through the analysis of past demand and structural simulation | The integration between FAS and BIM is supported by Dynamo API, accessible on one local computer | Single user | No autonomy | |
| [C] | (1) | (4) | (5+) | (1) | (3) | (1) | (1) | (1) | (1) |
| Two lanes of a road section | Automatic from physical to digital space (via Ethernet) | Real-time data (<seconds) | No representation for this testing phase | Strain, temperature, time | Descriptive analysis Goal: prediction of pavement behaviour through ML (level 3) | Local computer Goal: an integrated APP (level 3) | Single user | No autonomy |
Disclaimer/Publisher’s Note: The statements, opinions and data contained in all publications are solely those of the individual author(s) and contributor(s) and not of MDPI and/or the editor(s). MDPI and/or the editor(s) disclaim responsibility for any injury to people or property resulting from any ideas, methods, instructions or products referred to in the content. |
© 2023 by the authors. Licensee MDPI, Basel, Switzerland. This article is an open access article distributed under the terms and conditions of the Creative Commons Attribution (CC BY) license (https://creativecommons.org/licenses/by/4.0/).
Share and Cite
Vieira, J.; Poças Martins, J.; de Almeida, N.M.; Patrício, H.; Morgado, J. Reshaping the Digital Twin Construct with Levels of Digital Twinning (LoDT). Appl. Syst. Innov. 2023, 6, 114. https://doi.org/10.3390/asi6060114
Vieira J, Poças Martins J, de Almeida NM, Patrício H, Morgado J. Reshaping the Digital Twin Construct with Levels of Digital Twinning (LoDT). Applied System Innovation. 2023; 6(6):114. https://doi.org/10.3390/asi6060114
Chicago/Turabian StyleVieira, João, João Poças Martins, Nuno Marques de Almeida, Hugo Patrício, and João Morgado. 2023. "Reshaping the Digital Twin Construct with Levels of Digital Twinning (LoDT)" Applied System Innovation 6, no. 6: 114. https://doi.org/10.3390/asi6060114