Article

Empirical Model for the Retained Stability Index of Asphalt Mixtures Using Hybrid Machine Learning Approach

1
Civil and Environmental Engineering Department, College of Engineering, Mutah University, Mutah, P.O. Box 7, Karak 61710, Jordan
2
Department of Civil Engineering, Jerash University, Jerash 26150, Jordan
*
Author to whom correspondence should be addressed.
Appl. Syst. Innov. 2023, 6(5), 93; https://doi.org/10.3390/asi6050093
Submission received: 13 September 2023 / Revised: 10 October 2023 / Accepted: 16 October 2023 / Published: 18 October 2023

Abstract

:
Moisture susceptibility is a complex phenomenon that induces various distresses in asphalt pavements and can be assessed by the Retained Stability Index (RSI). This study proposes a robust model to predict the RSI using a hybrid machine learning technique, including Artificial Neural Network (ANN) and Gene Expression Programming. The model is expressed as a simple and direct mathematical function with input variables of mineral filler proportion (F%), water absorption rate of combined aggregate (Ab%), asphalt content (AC%), and air void content (Va%). A relative importance analysis ranked AC% as the most influential variable on RSI, followed by Va%, F%, and Ab%. The experimental RSI results of 150 testing samples of various mixes were utilized along with other data points generated by the ANN to train and validate the proposed model. The model promotes a high level of accuracy for predicting the RSI with a 96.6% coefficient of determination (R2) and very low errors. In addition, the sensitivity of the model has been verified by considering the effect of the variables, which is in line with the results of network connection weight and previous studies in the literature. F%, Ab%, and Va% have an inverse relationship with the RSI values, whereas AC% has the opposite. The model helps forecast the water susceptibility of asphalt mixes by which the experimental effort is minimized and the mixes’ performance can be improved.

1. Introduction

Moisture damage in asphalt mixtures is the degradation of the mixture’s mechanical properties due to the existence of water in the pavement, either as a liquid or vapor, which eventually leads to an adhesive failure between the bitumen and mineral aggregates and a cohesive failure within the bitumen that coats the aggregates [1,2]. Moisture damage is a critical phenomenon that alleviates the stiffness and load capacity of flexible pavements [3] and causes a costly failure of the pavement structure [4]. It also leads to the formation of various pavement distresses, such as stripping, raveling, shelling, and hydraulic scour [1], and increases the severity of existing rutting, cracking, and potholes [5]. Moreover, stripping is the most common distress induced by moisture damage, where a physical separation (adhesive failure) can result at the aggregate–bitumen interface due to the higher surface energy of water compared to the asphalt cement [2,6,7,8].
Many laboratory testing methods were used to evaluate and measure the moisture susceptibility of asphalt mixtures. Some of the tests include immersed wheel-tracking configurations such as the Hamburg wheel-tracking test and the Asphalt Pavement Analyzer device [9,10], while others evaluate moisture damage by calculating the ratio of strength or stiffness of water-conditioned compacted Hot-Mix Asphalt (HMA) samples to that of unconditioned samples [4]. The latter includes several testing protocols such as the immersion–compression test, the resilient modulus test, the double-punch method, the tensile strength ratio (TSR) or modified Lottman (AASHTO T 283), the Retained Stability Index (RSI), and others [11,12,13,14]. Even though these testing procedures help compare the moisture susceptibility of different mixtures, they do not provide information about the proper characteristics of asphalt mixes. This refers to the fact that they do not consider the fundamental measurements of material properties that influence the mechanisms of moisture-induced damage in asphalt mixes [8]. Also, adopting a single test from among these methods as an ideal procedure for characterizing the moisture sensitivity performance of mixes is impractical due to the wide variety of conditions, factors, and material properties that impact the moisture susceptibility of asphalt pavement [9,10,11,15].
Machine learning (ML)-based methods, which are subfields of artificial intelligence (AI) techniques, have been widely implemented in various engineering disciplines due to their powerful ability and high accuracy in analyzing and developing predictive models [16,17,18,19]. Artificial Neural Networks (ANNs) and Gene Expression Programming (GEP) are typical examples of methods that are successfully utilized for predicting the complex characteristics of asphalt mixtures [16,20,21]. Many research works have predicted the moisture sensitivity of asphalt mixes using the TSR test [22,23,24]. A recent study introduced by Dalhat and Osman [25] utilized the ANN technique to solely study the influence of volumetric and aggregate properties of asphalt mixtures on their moisture resistance based on the Retained Stability Index (RSI). Although their study thoroughly presented the relationships between various mixtures’ properties and RSI values, it included some little-to-none influential variables on moisture-induced damage and direct mathematical equations for predicting the RSI values of asphalt mixtures.
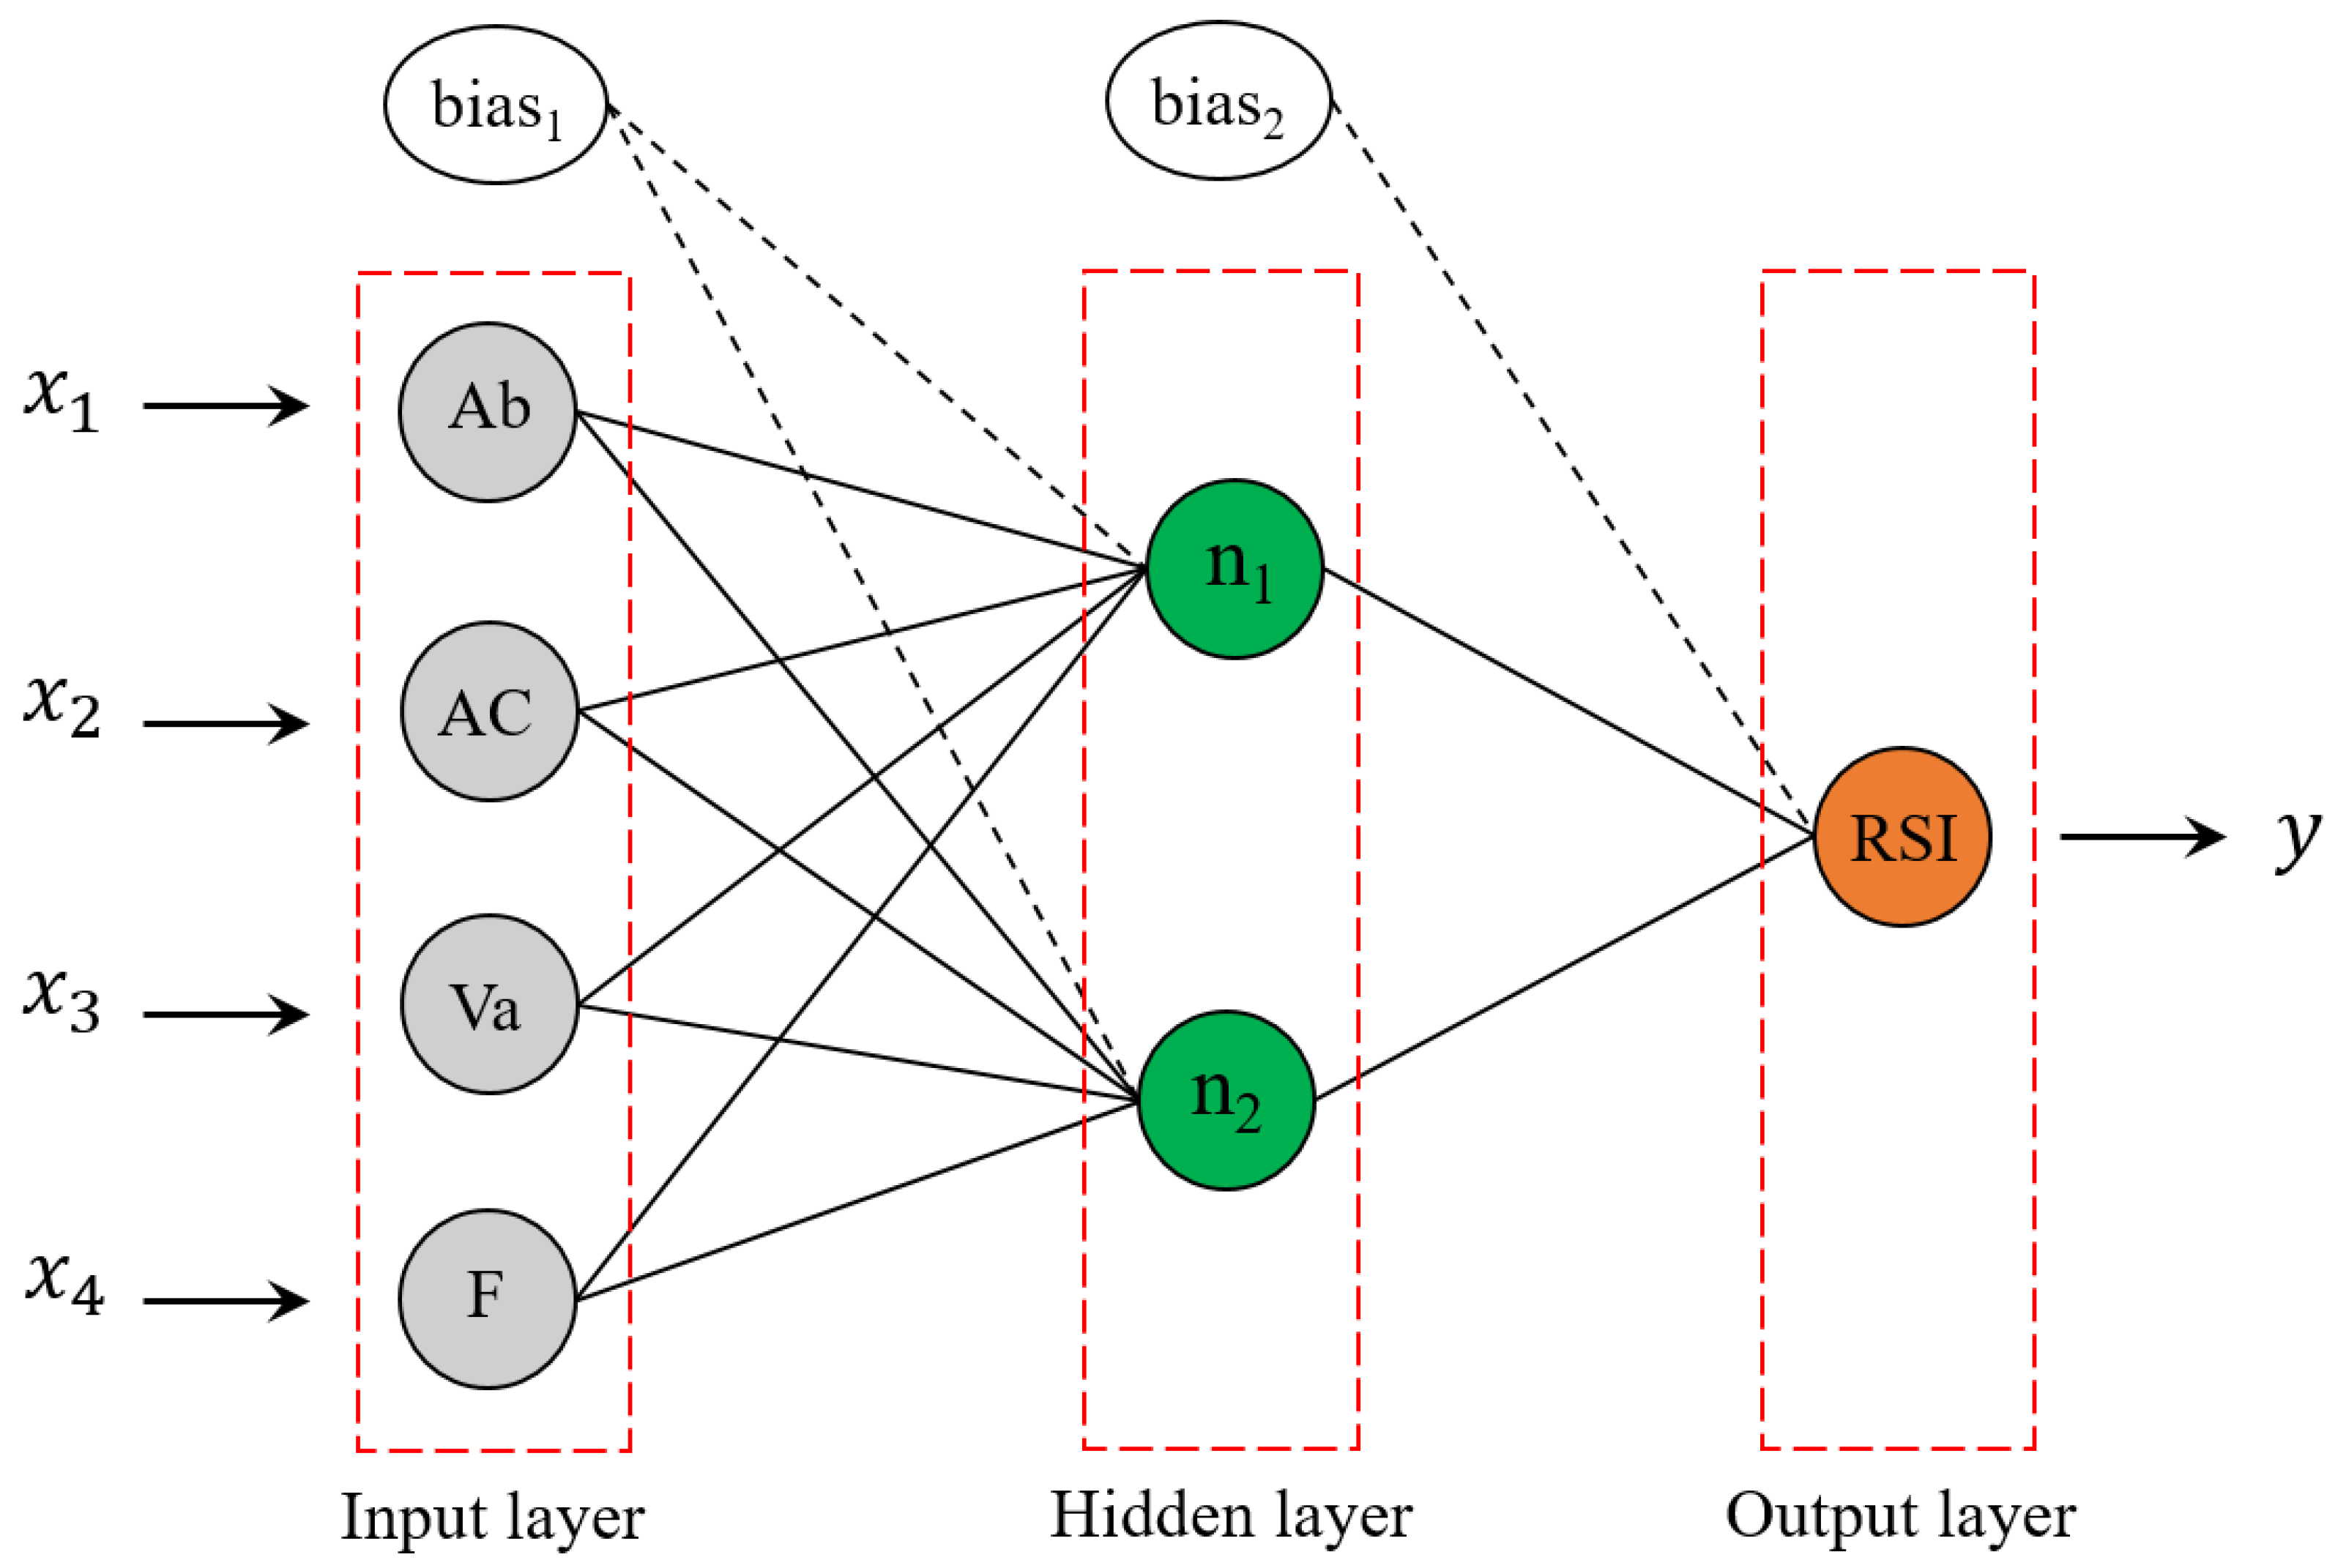
The RSI test is a straightforward testing method that is still valid and is used by pavement agencies to evaluate the moisture sensitivity of asphaltic mixes. This study aims to develop an accurate model that provides a practical and direct mathematical equation for estimating the RSI value of asphalt mixes using a hybrid machine learning approach, including the ANN and GEP techniques. In addition, the model will only consider the most crucial factors that affect the moisture damage of asphalt mixes, including aggregate absorption property, asphalt content, air void percentage, and filler content. These factors are fundamentally imperative in the design procedure of asphalt mixes, which would promote a model for easy implementation by pavement engineers and local agencies. The model will be useful to improve the performance of asphalt mixes before their production by evaluating the water susceptibility of mixes without the need to perform the destructive RSI test, saving time, materials, and effort.
Moisture damage mechanisms and common influential factors
Moisture usually reaches asphalt mixes through different mechanisms, including surface water infiltration, capillary rise action, and water diffusion. Infiltration is considered the primary source of moisture in asphalt pavements [3,8], while diffusion is the most common mechanism of moisture transport where molecules move from a high to a low concentration region, and hence durability damage in asphalt pavements occurs [26,27]. Moisture damage, however, starts with the moisture transport mechanisms by which the moisture gets into the asphalt mixture’s structure. A process of change in conditions at the aggregate–binder interface then occurs, adversely affecting the integrity and capacity of asphalt mixes [1]. Typically, six mechanisms contribute to moisture damage in asphalt mixes: asphalt film detachment and displacement, mastic dispersion and desorption, film microcracks, and spontaneous emulsification [1,28].
The fundamental causes of moisture damage in asphalt pavement have been vastly investigated. Some causes can be related to aggregate mineralogy and binder characteristics [27,29,30], while others refer to environmental and traffic conditions, volumetric properties, and a construction process [12,31]. Lu and Harvey [2] conducted an in-field investigation of asphalt pavement cores to determine the most influential parameters for moisture damage. They found that air void content, pavement structure, pavement age, and overall rainfall significantly influence moisture damage [2]. High air void contents in an asphalt mix not only increase the tendency of mixes to moisture damage but also could result in early aging and low fatigue resistance [7].
Ahmed et al. [32] evaluated the durability of HMA at different air void contents ranging from 4% to 9%. The study showed a proportional relationship between the air void percentage and HMA permeability, which is the ability of a porous medium such as an asphalt mix to transmit water [33]. However, vulnerable mixes to moisture damage have been achieved at air void contents beyond 6% [32]. Invisible cracks, known as “checks”, with a length of 1–4 inches and 1–3 inches apart, are typically propagated while paving asphalt mixes in fields [6]. These checks, however, increase the permeability of the mixes by connecting the entrapped air voids and making effective routes for surface water to infiltrate inside the pavement structure, which leads to less durable mixtures prone to moisture damage [6,7].
In addition, moisture damage is influenced by the internal composition of the mixes. Insufficient asphalt cement contents in HMA can provide a relatively thin asphalt film coating the aggregate particles, promoting cohesive damage within the mastic and/or adhesive damage at the aggregate–bitumen interface in the presence of water [31,33]. However, aggregates’ mineralogy is much more dominant in moisture damage than asphalt cement types [27,29,31]. For instance, siliceous-type (acid) aggregates such as gravel and granite are more prone to moisture damage than high-carbonate (basic) aggregates like limestone [1,29]. The limestone aggregate is mainly composed of calcite, a moisture-resistant mineral, whereas the granite aggregate is composed of albite, quartz, and K-feldspar, which are sensitive to moisture damage [30]. Therefore, selecting proper types of aggregate with good compatibility with asphalt cement is imperative for designing asphalt mixes that are less sensitive to moisture damage [34]. Further, the moisture-absorption property of aggregates is an important factor that significantly influences moisture attack in asphalt mixes [29,30]. Aggregates with high affinity to water impose an adhesive failure at the aggregate–binder interface [3]. This is because of the required short time for water diffusion in such porous aggregates [27,30]. Dalhat and Osman [25] studied the influence of asphalt mixes’ volumetric and aggregate properties on the moisture susceptibility of different asphalt mixtures using the RSI. The major findings of their study indicate that increasing the air void contents and amount of friable materials in asphalt mixtures reduces the moisture resistance performance of the mixtures.
Another critical parameter significantly influencing moisture damage is the mineral filler percentage in asphalt mixes [35,36,37]. Mineral fillers are the proportion of blended aggregates in asphalt mixtures that passes through sieve No. 200 (<0.075 mm) and is suspended in bitumen to form mastic [13,38]. Previous studies indicated that incorporating cementitious types of mineral fillers in asphalt mixes could improve the moisture resistance, stability, and deformation resistance of the mixes [13,15,37,38]. However, increasing the filler contents in asphalt mixes could result in moisture damage. Huang et al. [36] studied asphalt mix performance by utilizing different types of filler materials at various contents ranging from 2% to 10%. Their results revealed that the moisture susceptibility of the mixes increases by increasing the filler contents due to the reduction in the asphalt binder content that forms the exact amount of mastic for lubricating the aggregate particles. Airey et al. [4] and Sakanlou et al. [39] also stressed that moisture damage could happen due to the loss in cohesive strength of the asphalt–filler mastic coating the asphalt mix’s particles.
Overall, previous studies indicated that the progression of moisture damage in asphalt mixes is attributed to numerous factors. The materials and volumetric properties of asphalt mixes, including moisture absorption of aggregates, asphalt cement content, air void content, and proportion of mineral filler in the mixes, can be the most influential parameters that significantly control the moisture damage of the mixtures.

2. Objective and Methods

This research article aims to establish a practical and accurate mathematical-based model for estimating the RSI value of asphalt mixes using a hybrid machine learning approach, including the ANN and GEP techniques. The model will consider four input variables that significantly influence the moisture susceptibility of asphalt mixes, including the moisture absorption percentage of aggregates (Ab%), asphalt content (AC%), air void content (Va%), and percentage of mineral filler (F%) passing through a 0.075 mm sieve.
To develop the model, different asphalt mixes with an appropriate variety in the input variables were selected for sample preparations. Sufficient numbers of compacted samples were then prepared and tested following the Marshall standard method. The moisture susceptibility of those mixes was evaluated based on the measured RSI values. Because of the limited number of measured RSI points, a robust ANN model was developed and utilized to generate a new dataset of RSI. The GEP technique was then used to establish a predictive model (equation) employing the combined datasets of the newly generated and experimental (raw) RSI data points. Sensitivity analyses were then performed to validate the accuracy of the proposed GEP model. The methodology of this study is outlined in Figure 1 and discussed in detail in the following sections.

3. Materials and Testing

3.1. Raw Materials

Local bitumen with a penetration grade of 60/70 and crushed limestone aggregates are the main components of asphalt mixes used in this study. Table 1 shows the physical characteristics of the bitumen, which comply with the ASTM D946 [40] requirements for a 60/70-penetration-grade bitumen. Since this study aims to measure the RSI values of asphalt mixtures while considering the influence of some aggregate and mixture properties, including the variables Ab%, AC%, Va%, and F%, it was imperative to look for aggregate materials with different properties. Therefore, the aggregates were collected from various local quarries across Jordan. Five available quarries were found to be suitable sources of aggregates with different absorption properties and filler proportions in the fine-size aggregate. The collected aggregates from each source were dried, sieved, and combined individually to meet the gradation limits of the specification of the Ministry of Public Works and Housing (MPWH) in Jordan [41] for wearing asphalt mixes, as shown in Figure 2. The aggregate blend characteristics and physical properties satisfy Jordan’s MPWH requirements for paving aggregates, as shown in Table 2.

3.2. Sample Preparation and Testing Results

In this study, 150 asphalt concrete samples of 2.5 inches in height and 4.0 inches in diameter were prepared according to the standard Marshall method ASTM D6927 [42]. The samples were mixed for each blend at five trials of asphalt cement contents (ACs%) of 3.5%, 4.0%, 4.5%, 5.0%, and 5.5% by total mix weight. Six replicate samples were prepared at each AC% trial and compacted with 75 blows per side by a Marshall hammer. The volumetric measurements, including the air void content (Va%), were determined for each sample. The mixtures’ samples at each trial AC% were divided into two groups of triplicate samples of unconditioned (control) and conditioned specimens. The control samples were submerged in water for 30 min at 60 °C before they were tested for Marshall stability. The conditioned samples were tested after being submerged in water for 24 h at 60 °C. The RSI value of each sample group was then determined using Equation (1). The average RSI results are summarized in Table 3.
RSI = S 1 S 2 × 100 %
where S1 is the stability of the conditioned samples after being submerged in water for 24 h and S2 is the stability of the control samples after being submerged for 30 min.
It should be mentioned that 75% of RSI is the minimum satisfactory limit for a durable mix of asphalt [14,43,44]. The RSI results indicated that some testing groups of samples were prone to moisture damage by means of average RSI values of less than 75%. This supports the fact that the moisture sensitivity of the mixes would be influenced by varying the mix properties of Ab%, F%, AC%, and Va%.

4. Model Development

As discussed earlier, this study aims to develop an accurate predictive model of RSI in the form of a simple, straightforward equation. The GEP technique can generate a straightforward mathematical function, making it one of the most suitable tools for developing such empirical models [16]. However, developing a GEP model with a limited-size dataset would result in a non-generalized and susceptible-to-overfitting model. Hence, hybrid machine learning is adopted in this study for developing the RSI predictive model. The ANN approach, which is known as an efficient and robust tool for generating predictive models in terms of numerical codes, will be employed first to generate new reliable datasets of different combinations. These data will be fed along with the raw dataset into the GEP software for developing the final mathematical equation for predicting the RSI value.

4.1. Developing ANN Model and Generating New Datasets

The ANN is a class of machine learning techniques implemented widely for estimating and solving various engineering problems with a high accuracy rate of predictions [17,25,45,46,47,48]. A typical layout of an ANN model is a multi-layer feed-forward framework of input, hidden, and output layers that are successively connected by calibrated links called weights. The input layer comprises several neurons corresponding to the independent variables in the model, while the output layer includes a neuron corresponding to the dependent variable. The hidden layer contains a number of neurons that are typically determined by the trial-and-error method, as they play an essential role in determining the model’s accuracy and complexity. The ANN architecture also contains constant values known as biases that adjust the overall output of each neuron within the hidden and output layers.
This study used the ANN toolbox in Matlab R2022b [49] to develop a shallow ANN model. Four independent variables (Ab%, F%, AC%, and Va%) were employed as predictors in the input layer to predict the RSI. The model was trained using 75% of the data and tested with the rest through the Bayesian regularization algorithm to ensure the model’s generalization and avoid overfitting. This algorithm was selected because it is a robust method with a better generalization process and difficulty in overtraining and overfitting the data, capable of providing an optimal model of a small-size dataset [50,51].
Four neural network iterations with different numbers of hidden neurons (i.e., one, two, three, and four) were conducted to determine the desired number of neurons that provide a high level of accuracy and very low and stable convergence of errors for the ANN model. The generated models were evaluated statistically based on the values of the Mean Squared Errors (MSEs) and the coefficient of determination (R2) for the training and testing datasets. Table 4 shows the results of the modeling runs. The results indicate that two hidden neurons were the optimal neuron size for the network, where consistent measures of very low MSE values and very high R2 values were obtained for both datasets. In addition, the training process of the datasets with two hidden neurons reveals how well the obtained Mean Squared Errors (MSEs) were minimized for both datasets and stood at a stable level of convergence at epoch 26, as shown in Figure 3. A simple schematic representation of the ANN architecture is shown in Figure 4.
While the developed ANN model will be used to generate a new dataset for prediction, the overall performance of the model was evaluated statistically by calculating the mean absolute error (MAE), root-mean-square error (RMSE), coefficient of determination (R2) value, and the average “experimental-to-predicted” ratio of all datasets. The model resulted in very low errors of (0.383) and (0.470) for the MAE and RMSE, a very high R2 value of (99.19%), and an average ratio of (1.00). This verifies the high level of accuracy of the selected model.
In addition, the sensitivity of the ANN model was evaluated by quantifying the relative importance and impact of the input variables in the network. The Garson algorithm technique [52] was used in this study for calculating the relative importance or contribution of the input variables in predicting the RSI values. It should be mentioned that the method considers the absolute values of the weights and does not present the relational directions of variables with respect to the output variable [53]. However, many researchers have adopted it widely due to its accuracy in evaluating the contributions of predictor variables in the network [24,54,55,56,57,58,59]. The relative importance results are shown in Figure 5. It is noticed that AC% and Va% are the most essential variables in predicting the RSI, with 35.6% and 33.5% contribution rates, respectively. F% has a moderate contribution rate of 22.4% compared to Ab%, which has the lowest rate of 8.5%.
The connection weight method by Olden and Jackson [60] was adopted to assess the impact of the predictor variables on the predicted RSI value, as illustrated in Figure 6. The results revealed that AC positively impacts the RSI value, while the other variables (F, Ab, and Va) do the opposite. These results, however, prove that the generated ANN model effectively considers the significance of each input variable while predicting the RSI.
Consequently, the ANN model with two hidden neurons was utilized to generate new datasets of various combinations of variables. First, the input variables were kept constant at their original mean values. The new values of each input variable were then interchanged at a regular interval and within their upper and lower limits, while keeping the values of the rest of the variables constant at their average. This approach was repeated independently for all input variables. The new combinations of datasets were then utilized as predictor data points to predict their corresponding output values of RSI using the ANN model. Finally, the obtained datasets were combined with the raw dataset to be used again for developing a simple empirical equation of RSI using the GEP software.

4.2. GEP Predictive Model

The GEP, a class of machine learning tools developed by Ferreira [61], is extensively used in the literature for developing robust predictive models in several engineering fields [16,62]. Also, many researchers have employed it as a hybrid predictive tool along with other machine learning approaches [45,46,47,48] due to its main feature of providing the model as an expression tree (ET), which can be converted into a simple mathematical equation. An ET of a GEP model consists of genes and chromosomes of constant length, where the genes are connected together by a predefined linking function, including addition, subtraction, multiplication, or division. Each gene is composed of a head and tails. The head is a mix of numbers, variables, and mathematical functions, whereas the tails include numbers and variables. More details on the GEP approach can be referred to in references [61,63].
In this study, GeneXproTools was utilized to generate the GEP model employing the combined datasets, as illustrated earlier. The datasets were divided randomly by the software into a training dataset (75%) and a validation dataset (25%). Many previous studies indicated no standard method for selecting the GEP setting parameters as it is based on the trial-and-error approach. However, some common parameters play an essential role in the model’s performance, including the linking function, head size, number of chromosomes, and number of used genes [16,64,65]. Therefore, the model was developed after several iterations of trial and error to achieve the best-fitted model with the highest R2 value and the fewest errors for both the training and validating datasets.
Table 5 displays the ideal setting parameters that were employed in the proposed GEP model. The resulting ET of the model is shown in Figure 7. The notations d 0 , d 1 , d 2 , and d 3 represent, in sequence, the input variables F , A b , A C , and V a . The constants in the first gene (Sub-ET 1) are C 7 = 8.764 , C 5 = 4.925 , C 1 = 2.493 ; in the second gene (Sub-ET 2), the constants are C 1 = 1.443 , C 0 = 9.396 , C 7 = 9.768 ; and in the third gene (Sub-ET 3), the constant is C 9 = 5.649 . The resulting tree has been simplified as a simple mathematical equation (Equation (2)) for predicting RSI values.
RSI = A + B + C
A = V a × V a 8.764 + A C 4.925 × tanh V a 2.493 B = 1.443 × A b A C 91.778 C = A C + 5.649 A C 2 × F + V a

5. Evaluation and Sensitivity of the Proposed Model

The proposed GEP model is evaluated statistically in this section to validate its accuracy in predicting the asphalt mixes’ RSI value. The statistical measurements R2, MAE, and RMSE were determined for the training, testing, and all datasets, as shown in Table 6. The low error values and high R2 values of these datasets and their convergence together indicate the generalization and high level of accuracy of the model in predicting the RSI value. The model also results in an average ratio of “tested-to-predicted” RSI of (1.00) and a very low coefficient of variation of (0.841).
The model sensitivity in capturing the impact of the input parameters on the predicted RSI values was investigated through a parametric analysis. This type of analysis was found to be a valuable and reliable approach for validating the sensitivity of predictive models [16,17,25,45,46,
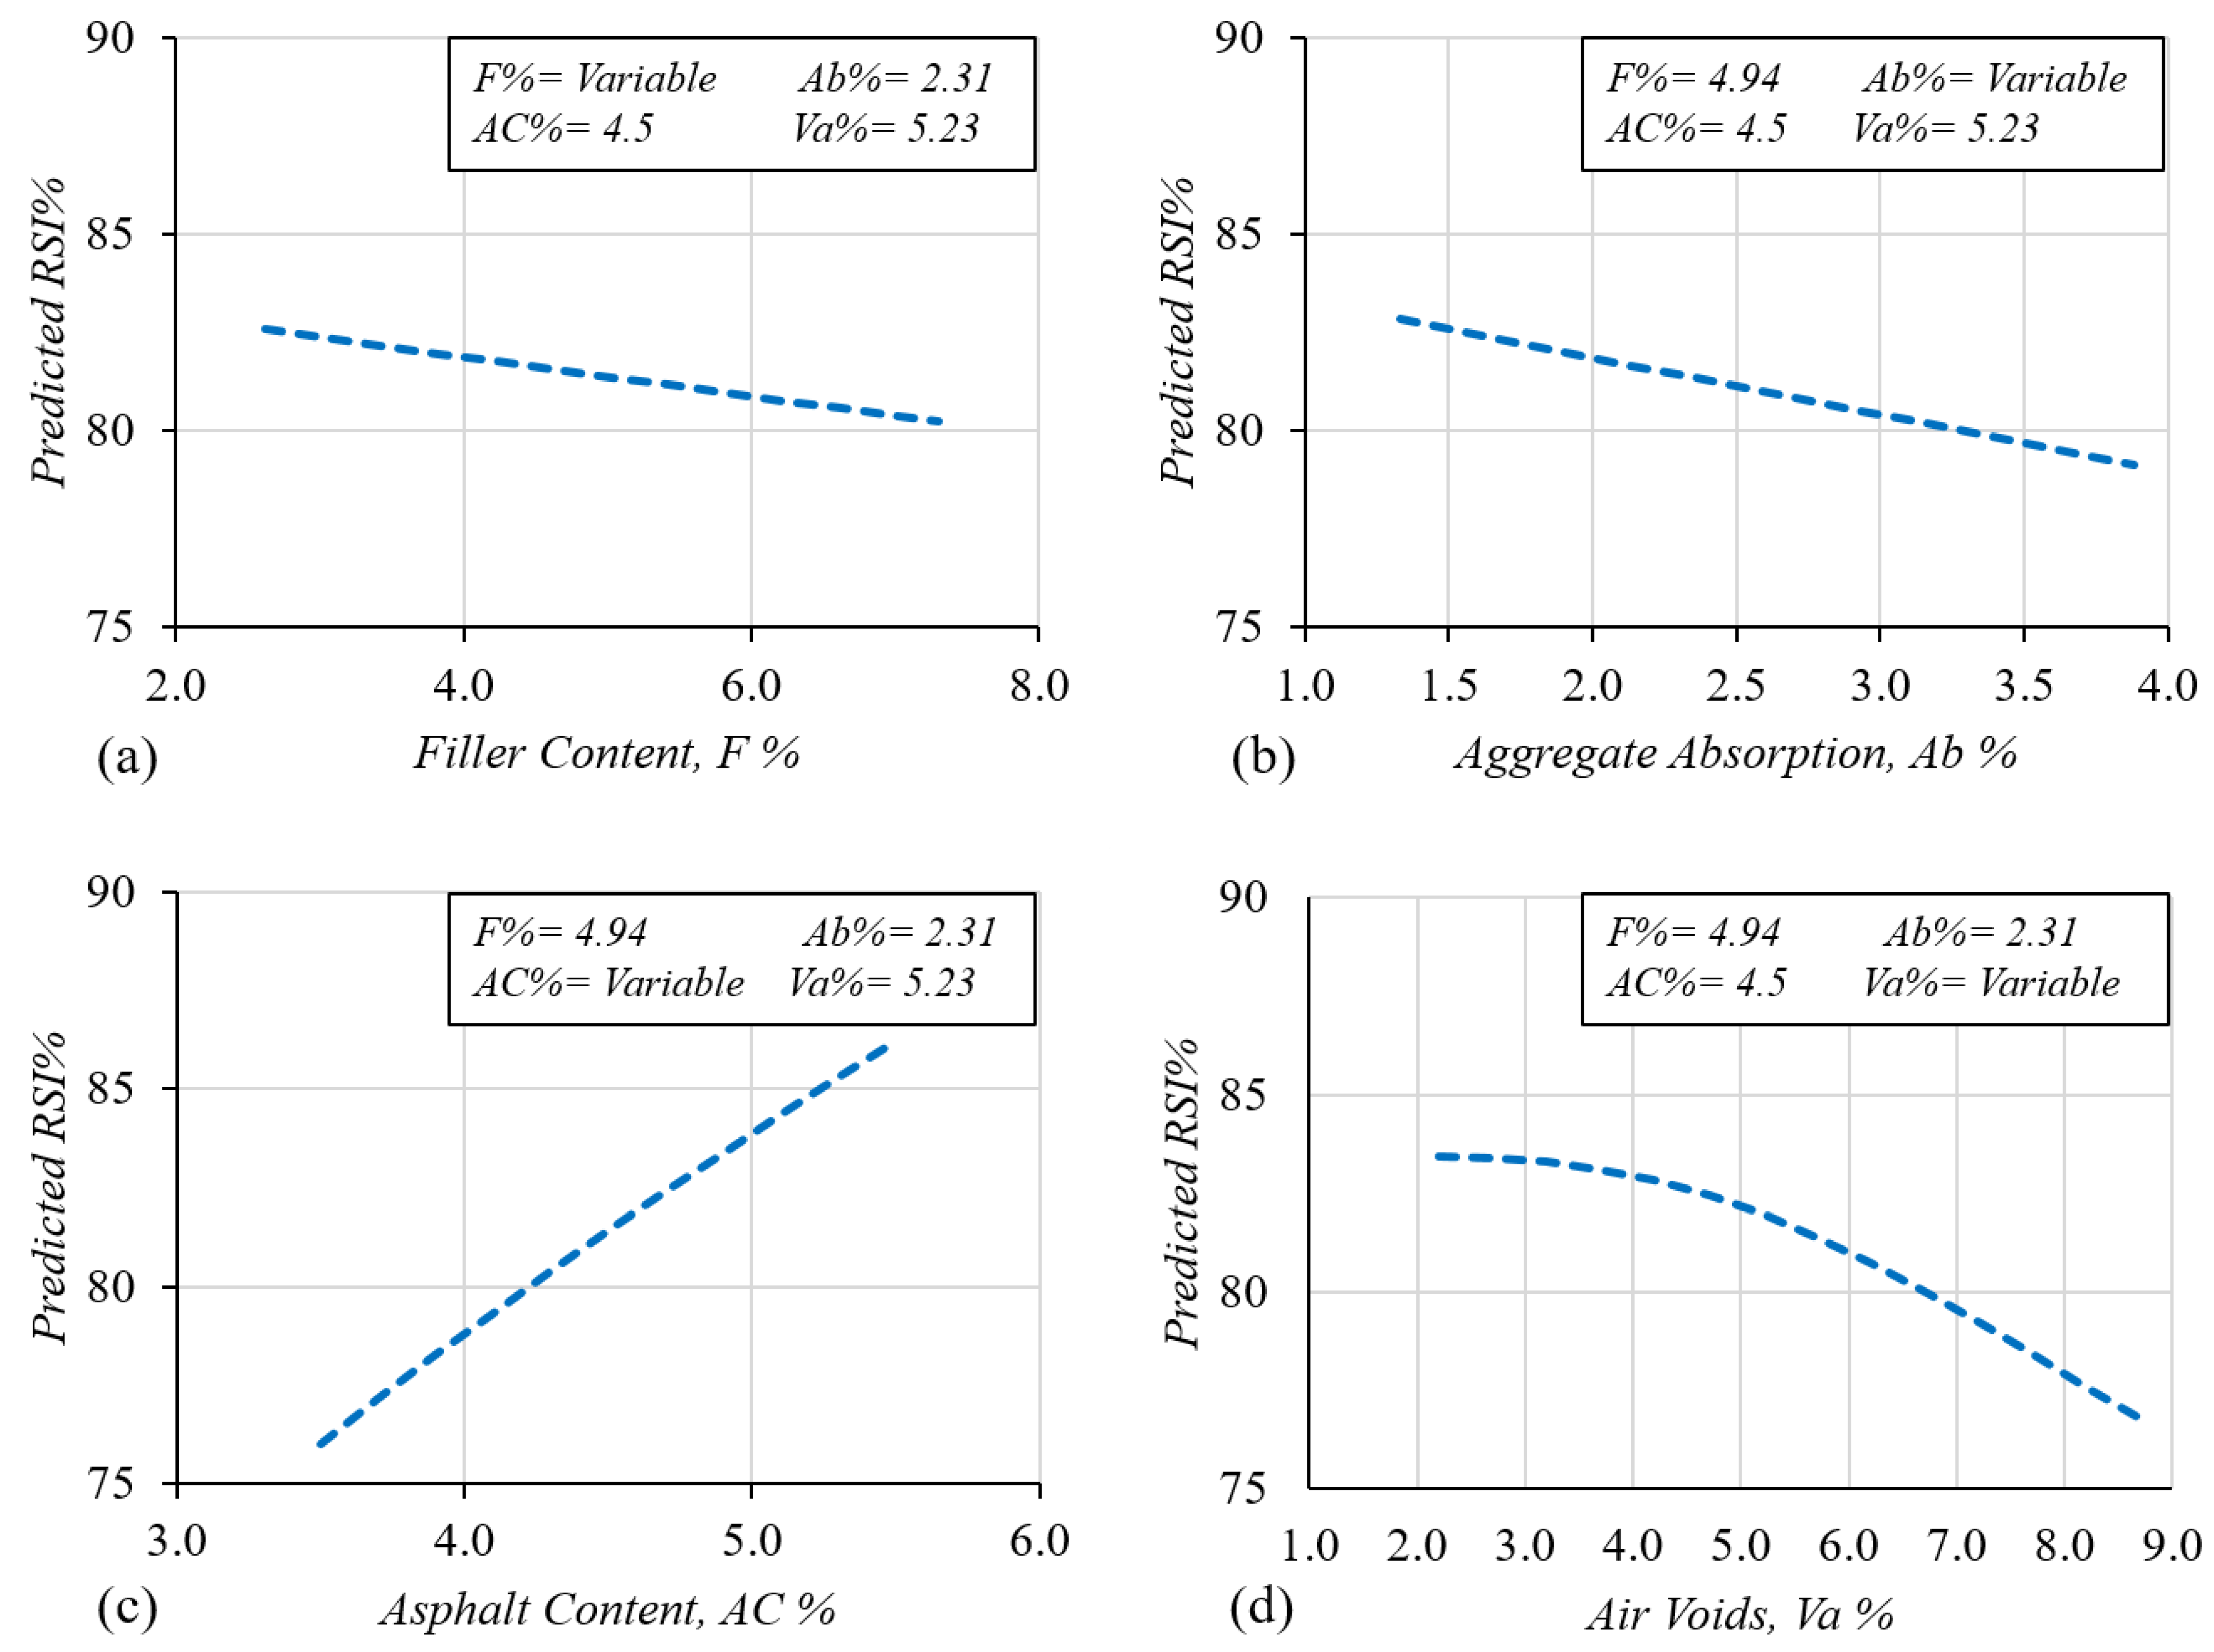
47]. It is based on utilizing the proposed model to predict a dependent variable that corresponds to interchangeable datasets of the input variables. Thus, the GEP model is utilized to predict the RSI values after varying every input parameter in the model while keeping the other three variables constant at their mean values. This approach was repeated in sequence for all parameters, as shown in 
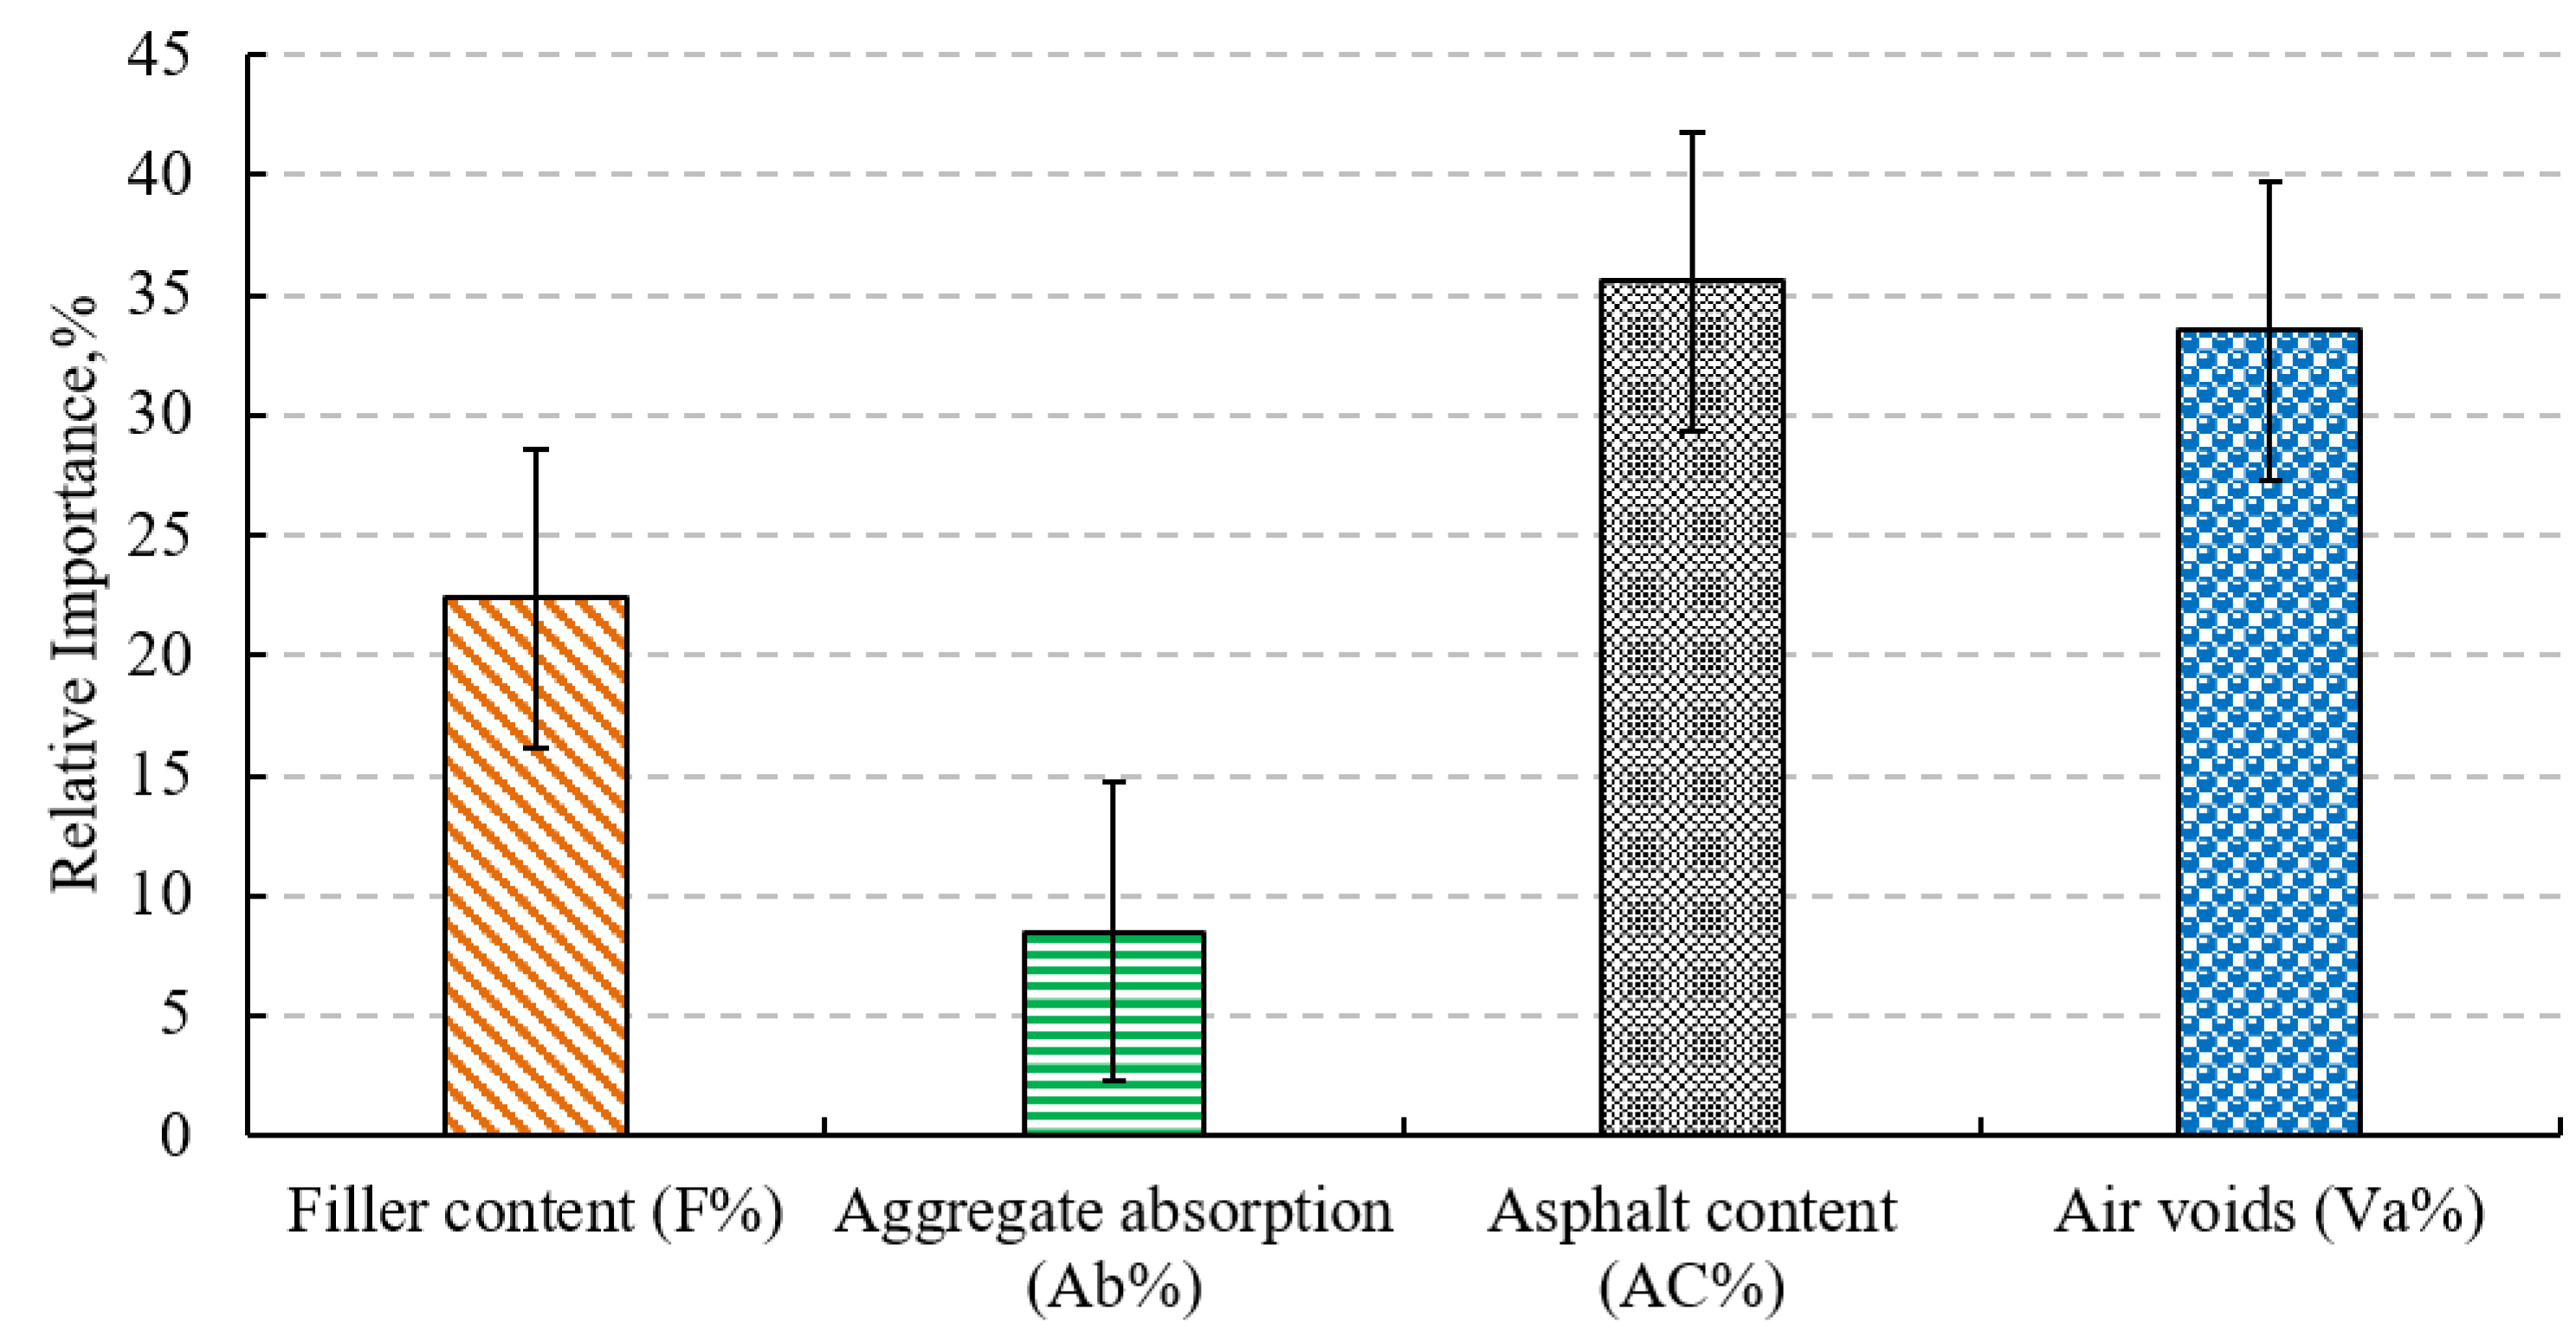
Figure 8. The obtained trends prove the model’s sensitivity and efficiency in predicting the RSI while considering the impact of the input variables, as they confirm the network connection weight results (see Figure 6), where the RSI values increase by increasing the AC values and decreasing the F, Ab, and Va values.
While the moisture sensitivity of the mixes decreases as the RSI value increases, these plots were elucidated following results from previously published research articles. Figure 8a shows a negative relationship between the mineral filler content and the durability of the asphalt mixes. Previous studies found that incorporating mineral filler in asphalt mixes enhances stability by increasing the stiffness of the asphalt mixes [36,38]. However, increasing the filler content reduces the asphalt proportion in the same amount of mastic required for coating and lubricating the aggregate particles, resulting in a mixture prone to moisture damage [36]. Figure 8b shows that the RSI values decrease as the moisture-absorption property of the aggregates in the mixtures increases. This can be referred to as the nature of absorptive (porous) aggregates with a high affinity to moisture, facilitating water diffusion into the aggregate–bitumen interface and increasing the severity of moisture damage [27,30]. It is worth stating that moisture diffusion transforms the moisture-imposed damage from a cohesive to an adhesive mode. The former mode prevails in the dry-conditioned samples where failure is formed within the bulk of asphalt coating aggregates, whereas the latter is dominant in the wet-conditioned samples where the failure is interfacial and mainly weakens the aggregate–bitumen bonds by water intrusion [29,30]. Figure 8c indicates that the durability of asphalt mixes with high RSI values increases significantly as AC% increases in the mixes. This can be explained by the provided thicker asphalt film that coats the aggregate particles and hence reduces the adverse effect of water on asphalt mixes [31]. Figure 8d shows a concave downward relationship between the RSI values and Va%. This refers to the fact that increasing Va% in asphalt mixes increases their permeability and induces their moisture susceptibility through adhesive failure [1,2,7]. In addition, increasing the permeability of asphalt concrete makes it a porous medium for water infiltration, which impairs the mixture’s strength [32]. This observation aligns with previous RSI results obtained by Behiry [12] and Dalhat et al. [25].

6. Conclusions

A robust predictive model for the Retained Stability Index (RSI) of asphalt mixes has been developed in this study. A hybrid ML approach, including the ANN and GEP tools, was utilized in the model development. The model considered the most common influential parameters on the moisture susceptibility of asphalt pavements, including F%, Ab%, AC%, and Va%. Overall, 150 HMA samples were prepared using local aggregate and asphalt materials in Jordan. The water susceptibility of the mixes was evaluated through the measured RSI value. The Bayesian regularization algorithm, known for its ability to provide a robust generalization ANN model, was used to predict new reliable combinations of datasets. The following are the main findings of this research work:
  • The relative importance analysis of the network implied that AC% has the highest impact on the RSI value with a contribution rate of 35.6%, followed by Va%, F%, and Ab% with contributions of 33.5%, 22.4%, and 8.5%, respectively.
  • The datasets generated by the ANN were combined with the experimental dataset and fed into the GEP tool to develop the final prediction model in terms of a simple mathematical function.
  • The proposed GEP model proved its high accuracy and sensitivity in predicting the RSI of asphalt mixes, considering the impact of the input variables. The overall performance measures of the model result in a very high (R2) value of 96.6% and very low error values of 0.530 and 0.659 for MAE and RMSE. The experimental-to-predicted RSI values of the model have an average of 1.00 and a low coefficient of variation of 0.841.
  • In addition to the performance measures, a parametric analysis was conducted to evaluate the model sensitivity concerning every input variable. The result trends were confirmed with the ANN connection weight analysis and previous results found in the literature. It was found that increasing F%, Ab%, and Va% in asphalt mixes can reduce the RSI value, whereas increasing AC% can enhance the moisture susceptibility of the mixes by increasing the RSI value.
  • Overall, the proposed model is accurate and provides a straightforward mathematical equation for predicting the RSI value of asphalt mixes. It can be recommended to assess the moisture sensitivity of asphalt mixes without performing destructive testing, which would save natural resources and experimental effort. It can also help to improve the moisture damage performance of the mixes prior to the design phase.
It must be mentioned that the model is limited by the bitumen grade, traffic condition, and aggregate properties used. For future research, it would be recommended to develop another predictive model that further considers mix design parameters for asphalt mixes prepared at various levels of compaction and for mixes constructed with recycled asphalt materials and different bitumen grades, aggregate types, and graduations.

Author Contributions

Conceptualization: Y.S.J.; Methodology: Y.S.J. and M.J.A.-K.; Data curation: Y.S.J. and M.R.; Formal analysis and investigation: Y.S.J., M.J.A.-K. and M.R.; Visualization: Y.S.J.; Software: Y.S.J. and M.R.; Validation: Y.S.J. and M.J.A.-K.; Writing—original draft: Y.S.J., M.J.A.-K. and M.R.; Writing—review and editing: Y.S.J. All authors have read and agreed to the published version of the manuscript.

Funding

The authors declare that no funds, grants, or other support were received during the preparation of this manuscript.

Data Availability Statement

Data will be available upon reasonable request.

Conflicts of Interest

The authors declare that they have no known competing financial interests or personal relationships that could have appeared to influence the work reported in this paper.

References

  1. Caro, S.; Masad, E.; Bhasin, A.; Little, D.N. Moisture susceptibility of asphalt mixtures, Part 1: Mechanisms. Int. J. Pavement Eng. 2008, 9, 81–98. [Google Scholar] [CrossRef]
  2. Lu, Q.; Harvey, J.T. Field investigation of factors associated with moisture damage in asphalt pavements. In Proceedings of the 10th International Conference on Asphalt Pavements (ISAP), Quebec, QC, Canada, 12–17 August 2006; pp. 691–700. [Google Scholar]
  3. Masad, E.; Arambula, E.; Ketcham, R.; Abbas, A.; Martin, A.E. Nondestructive measurements of moisture transport in asphalt mixtures. Asph. Paving Technol.-Proc. 2007, 76, 919. [Google Scholar]
  4. Airey, G.D.; Collop, A.C.; Zoorob, S.E.; Elliott, R.C. The influence of aggregate, filler and bitumen on asphalt mixture moisture damage. Constr. Build. Mater. 2008, 22, 2015–2024. [Google Scholar] [CrossRef]
  5. Grenfell, J.; Ahmad, N.; Liu, Y.; Apeagyei, A.; Large, D.; Airey, G. Assessing asphalt mixture moisture susceptibility through intrinsic adhesion, bitumen stripping and mechanical damage. Road Mater. Pavement Des. 2014, 15, 131–152. [Google Scholar] [CrossRef]
  6. El Hussein, H.M.; Abd El Halim, A.O.; Kennepohl, G.J. Assessment of the influence of compaction method on asphalt concrete resistance to moisture damage. Constr. Build. Mater. 1993, 7, 149–156. [Google Scholar]
  7. Chen, J.S.; Lin, K.Y.; Young, S.Y. Effects of crack width and permeability on moisture-induced damage of pavements. J. Mater. Civ. Eng. 2004, 16, 276–282. [Google Scholar] [CrossRef]
  8. Bhasin, A.; Masad, E.; Little, D.; Lytton, R. Limits on adhesive bond energy for improved resistance of hot-mix asphalt to moisture damage. Transp. Res. Rec. 2006, 1970, 2–13. [Google Scholar] [CrossRef]
  9. Akentuna, M.; Mohammad, L.N.; Sachdeva, S.; Cooper, S.B., III; Cooper, S.B., Jr. Effectiveness of Loaded Wheel Tracking Test to Ascertain Moisture Susceptibility of Asphalt Mixtures. Transp. Res. Rec. 2022, 2676, 421–434. [Google Scholar] [CrossRef]
  10. Kim, Y.R.; Zhang, J.; Ban, H. Moisture damage characterization of warm-mix asphalt mixtures based on laboratory-field evaluation. Constr. Build. Mater. 2012, 31, 204–211. [Google Scholar] [CrossRef]
  11. Hamzah, M.O.; Kakar, M.R.; Hainin, M.R. An overview of moisture damage in asphalt mixtures. J. Teknol. 2015, 73, 125–131. [Google Scholar] [CrossRef]
  12. Behiry, A.E.A.E.M. Laboratory evaluation of resistance to moisture damage in asphalt mixtures. Ain Shams Eng. J. 2013, 4, 351–363. [Google Scholar] [CrossRef]
  13. Jweihan, Y.S. Performance of aged asphalt mixes containing waste oil shale filler. Int. J. Pavement Res. Technol. 2023, 1–15. [Google Scholar] [CrossRef]
  14. Al-Kheetan, M.J. Waste Not, Want Not: Sustainable Use of Anti-Stripping-Treated Waste Ceramic in Superpave Asphalt Mixtures. Sustainability 2023, 15, 7579. [Google Scholar] [CrossRef]
  15. Huang, B.; Shu, X.; Dong, Q.; Shen, J. Laboratory evaluation of moisture susceptibility of hot-mix asphalt containing cementitious fillers. J. Mater. Civ. Eng. 2010, 22, 667–673. [Google Scholar] [CrossRef]
  16. Jweihan, Y.S. Predictive model of asphalt mixes’ theoretical maximum specific gravity using gene expression programming. Results Eng. 2023, 19, 101242. [Google Scholar] [CrossRef]
  17. Jweihan, Y.S.; Alawadi, R.J.; Momani, Y.S.; Tarawneh, A.N. Prediction of Marshall Test Results for Dense Glasphalt Mixtures Using Artificial Neural Networks. Front. Built Environ. 2022, 8, 949167. [Google Scholar] [CrossRef]
  18. Maabreh, M.; Almasabha, G. Machine Learning Regression Algorithms for Shear Strength Prediction of SFRC-DBs: Performance Evaluation and Comparisons. Arab. J. Sci. Eng. 2023, 1–17. [Google Scholar] [CrossRef]
  19. Ghasemi, P.; Aslani, M.; Rollins, D.K.; Williams, R.C. Principal component neural networks for modeling, prediction, and optimization of hot mix asphalt dynamics modulus. Infrastructures 2019, 4, 53. [Google Scholar] [CrossRef]
  20. Majidifard, H.; Jahangiri, B.; Buttlar, W.G.; Alavi, A.H. New machine learning-based prediction models for fracture energy of asphalt mixtures. Measurement 2019, 135, 438–451. [Google Scholar] [CrossRef]
  21. Khan, K.; Jalal, F.E.; Khan, M.A.; Salami, B.A.; Amin, M.N.; Alabdullah, A.A.; Samiullah, Q.; Arab, A.M.A.; Faraz, M.I.; Iqbal, M. Prediction Models for Evaluating Resilient Modulus of Stabilized Aggregate Bases in Wet and Dry Alternating Environments: ANN and GEP Approaches. Materials 2022, 15, 4386. [Google Scholar] [CrossRef]
  22. Gandhi, T.; Xiao, F.; Amirkhanian, S.N. Estimating indirect tensile strength of mixtures containing anti-stripping agents using an artificial neural network approach. Int. J. Pavement Res. Technol. 2009, 2, 1. [Google Scholar]
  23. Goel, G.; Sachdeva, S.N.; Pal, M. Modelling of tensile strength ratio of bituminous concrete mixes using support vector machines and M5 model tree. Int. J. Pavement Res. Technol. 2022, 15, 86–97. [Google Scholar] [CrossRef]
  24. Kumar, A.J.B.; Parihar, M.S.; Murshida, P.; Sunitha, V.; Mathew, S. Moisture Damage Prediction of Hot Mix Asphalt Using Artificial Neural Network. In Proceedings of the Sixth International Conference of Transportation Research Group of India: CTRG 2021 Volume 1; Springer Nature: Berlin/Heidelberg, Germany, 2022; Volume 271, p. 123. [Google Scholar]
  25. Dalhat, M.A.; Osman, S.A. Studying the impact of aggregates and mix volumetric properties on the moisture resistance of asphalt concrete using a feed-Forward artificial neural network. Road Mater. Pavement Des. 2023, 24, 2737–2758. [Google Scholar] [CrossRef]
  26. Kringos, N.; Scarpas, A. Raveling of asphaltic mixes due to water damage: Computational identification of controlling parameters. Transp. Res. Rec. 2005, 1929, 79–87. [Google Scholar] [CrossRef]
  27. Apeagyei, A.K.; Grenfell, J.R.; Airey, G.D. Influence of aggregate absorption and diffusion properties on moisture damage in asphalt mixtures. Road Mater. Pavement Des. 2015, 16 (Suppl. S1), 404–422. [Google Scholar] [CrossRef]
  28. Little, D.N.; Jones, D.R. Chemical and mechanical processes of moisture damage in hot-mix asphalt pavements. In National Seminar on Moisture Sensitivity of Asphalt Pavements; Transportation Research Board: Washington, DC, USA, 2003; pp. 37–70. [Google Scholar]
  29. Zhang, J.; Apeagyei, A.K.; Airey, G.D.; Grenfell, J.R. Influence of aggregate mineralogical composition on water resistance of aggregate–bitumen adhesion. Int. J. Adhes. Adhes. 2015, 62, 45–54. [Google Scholar] [CrossRef]
  30. Zhang, J.; Airey, G.D.; Grenfell, J.; Apeagyei, A.K. Moisture damage evaluation of aggregate–bitumen bonds with the respect of moisture absorption, tensile strength and failure surface. Road Mater. Pavement Des. 2017, 18, 833–848. [Google Scholar] [CrossRef]
  31. Sengoz, B.; Agar, E. Effect of asphalt film thickness on the moisture sensitivity characteristics of hot-mix asphalt. Build. Environ. 2007, 42, 3621–3628. [Google Scholar] [CrossRef]
  32. Ahmad, N.; Haroon, W.; Abid, M.M. Effect of air voids on permeability and durability of hot mix asphalt. J. Natl. Sci. Found. Sri Lanka 2020, 48, 463–474. [Google Scholar] [CrossRef]
  33. Arambula, E.; Masad, E.; Martin, A.E. Influence of air void distribution on the moisture susceptibility of asphalt mixes. J. Mater. Civ. Eng. 2007, 19, 655–664. [Google Scholar] [CrossRef]
  34. Baldi-Sevilla, A.; Aguiar-Moya, J.P.; Vargas-Nordcbeck, A.; Loria-Salazar, L. Effect of aggregate–bitumen compatibility on moisture susceptibility of asphalt mixtures. Road Mater. Pavement Des. 2017, 18 (Suppl. 2), 318–328. [Google Scholar] [CrossRef]
  35. Aljassar, A.H.; Metwali, S.; Ali, M.A. Effect of filler types on Marshall stability and retained strength of asphalt concrete. Int. J. Pavement Eng. 2004, 5, 47–51. [Google Scholar] [CrossRef]
  36. Huang, B.; Shu, X.; Chen, X. Effects of mineral fillers on hot-mix asphalt laboratory-measured properties. Int. J. Pavement Eng. 2007, 8, 1–9. [Google Scholar] [CrossRef]
  37. Singh, B.; Jain, S. Effect of lime and cement fillers on moisture susceptibility of cold mix asphalt. Road Mater. Pavement Des. 2022, 23, 2433–2449. [Google Scholar] [CrossRef]
  38. Akbulut, H.; Gürer, C.; Çetin, S.; Elmacı, A. Investigation of using granite sludge as filler in bituminous hot mixtures. Constr. Build. Mater. 2012, 36, 430–436. [Google Scholar] [CrossRef]
  39. Sakanlou, F.; Shirmohammadi, H.; Hamedi, G.H. Investigating the effect of filler types on thermodynamic parameters and their relationship with moisture sensitivity of asphalt mixes. Mater. Struct. 2018, 51, 39. [Google Scholar] [CrossRef]
  40. ASTM D 946; Standard Specification for Penetration-Graded Asphalt Cement for Use in Pavement Construction. American Society for Testing and Materials: West Conshohocken, PA, USA, 2009.
  41. Ministry of Public Works and Housing, Director of Planning and Development. Specifications for Highway and Bridge Construction; Ministry of Public Works and Housing, Director of Planning and Development: Amman, Jordan, 2008; Volume II. [Google Scholar]
  42. ASTM D6927-15; Standard Test Method for Marshall Stability and Flow of Asphalt Mixtures. ASTM International: West Conshohocken, PA, USA, 2015.
  43. Sarsam, S.; Azawee, E. Assessment of asphalt binder stripping using surface free energy. Res. Appl. Mater. 2013, 1, 27–30. [Google Scholar] [CrossRef]
  44. Mirzababaei, P.; Moghadas Nejad, F.; Naderi, K. Effect of liquid silane-based anti-stripping additives on rheological properties of asphalt binder and hot mix asphalt moisture sensitivity. Road Mater. Pavement Des. 2020, 21, 570–585. [Google Scholar] [CrossRef]
  45. Tarawneh, A.; Saleh, E.; Almasabha, G.; Alghossoon, A. Hybrid Data-Driven Machine Learning Framework for Determining Prestressed Concrete Losses. Arab. J. Sci. Eng. 2023, 48, 13179–13193. [Google Scholar] [CrossRef]
  46. Alghossoon, A.; Tarawneh, A.; Almasabha, G.; Murad, Y.; Saleh, E.; Sahawneh, H. Shear strength of circular concrete-filled tube (CCFT) members using human-guided artificial intelligence approach. Eng. Struct. 2023, 282, 115820. [Google Scholar] [CrossRef]
  47. Momani, Y.; Alawadi, R.; Majdalaweyh, S.; Tarawneh, A.; Jweihan, Y.S. Data-driven machine learning prediction models for the tensile capacity of anchors in thin concrete. Innov. Infrastruct. Solut. 2022, 7, 294. [Google Scholar] [CrossRef]
  48. Naderpour, H.; Sharei, M.; Fakharian, P.; Heravi, M.A. Shear strength prediction of reinforced concrete shear wall using ANN, GMDH-NN and GEP. J. Soft Comput. Civ. Eng. 2022, 6, 66–87. [Google Scholar]
  49. MATLAB and Statistics Toolbox Release 2022b; The MathWorks, Inc.: Natick, MA, USA, 2022.
  50. Burden, F.; Winkler, D. Bayesian regularization of neural networks. In Artificial Neural Networks: Methods and Applications; Springer: Berlin/Heidelberg, Germany, 2009; pp. 23–42. [Google Scholar]
  51. Đorđević, F.; Kostić, S.M. Practical ANN prediction models for the axial capacity of square CFST columns. J. Big Data 2023, 10, 67. [Google Scholar] [CrossRef]
  52. Garson, G.D. Interpreting neural-network connection weights. AI Expert 1991, 6, 46–51. [Google Scholar]
  53. Ibrahim, O.M. A comparison of methods for assessing the relative importance of input variables in artificial neural networks. J. Appl. Sci. Res. 2013, 9, 5692–5700. [Google Scholar]
  54. Rabi, M.; Ferreira, F.P.V.; Abarkan, I.; Limbachiya, V.; Shamass, R. Prediction of the cross-sectional capacity of cold-formed CHS using numerical modelling and machine learning. Results Eng. 2023, 17, 100902. [Google Scholar] [CrossRef]
  55. Rabi, M. Bond prediction of stainless-steel reinforcement using artificial neural networks. Proc. Inst. Civ. Eng.-Constr. Mater. 2023, 1–11. [Google Scholar] [CrossRef]
  56. Rabi, M.; Abarkan, I.; Shamass, R. Buckling resistance of hot-finished CHS beam-columns using FE modelling and machine learning. Steel Constr. 2023. [Google Scholar] [CrossRef]
  57. Isleem, H.F.; Peng, F.; Tayeh, B.A. Confinement model for LRS FRP-confined concrete using conventional regression and artificial neural network techniques. Compos. Struct. 2022, 279, 114779. [Google Scholar] [CrossRef]
  58. Ozgan, E. Artificial neural network based modelling of the Marshall Stability of asphalt concrete. Expert Syst. Appl. 2011, 38, 6025–6030. [Google Scholar] [CrossRef]
  59. Sharifi, Y.; Moghbeli, A. Shear capacity assessment of steel fiber reinforced concrete beams using artificial neural network. Innov. Infrastruct. Solut. 2021, 6, 89. [Google Scholar] [CrossRef]
  60. Olden, J.D.; Jackson, D.A. Illuminating the “black box”: A randomization approach for understanding variable contributions in artificial neural networks. Ecol. Model. 2002, 154, 135–150. [Google Scholar] [CrossRef]
  61. Ferreira, C. Gene expression programming: A new adaptive algorithm for solving problems. arXiv 2001, arXiv:cs/0102027. [Google Scholar]
  62. Almasabha, G. Gene expression model to estimate the overstrength ratio of short links. In Structures; Elsevier: Amsterdam, The Netherlands, 2022; Volume 37, pp. 528–535. [Google Scholar]
  63. Ferreira, C. Gene expression programming in problem solving. In Soft Computing and Industry: Recent Applications; Springer: Berlin/Heidelberg, Germany, 2002; pp. 635–653. [Google Scholar]
  64. Amin, M.N.; Iqbal, M.; Jamal, A.; Ullah, S.; Khan, K.; Abu-Arab, A.M.; Al-Ahmad, Q.M.; Khan, S. Gep tree-based prediction model for interfacial bond strength of externally bonded frp laminates on grooves with concrete prism. Polymers 2022, 14, 2016. [Google Scholar] [CrossRef] [PubMed]
  65. Asghar, R.; Javed, M.F.; Alrowais, R.; Khalil, A.; Mohamed, A.M.; Mohamed, A.; Vatin, N.I. Predicting the Lateral Load Carrying Capacity of Reinforced Concrete Rectangular Columns: Gene Expression Programming. Materials 2022, 15, 2673. [Google Scholar] [CrossRef] [PubMed]
Figure 1. Research methods.
Asi 06 00093 g001
Figure 2. Gradations of combined aggregate mixes.
Asi 06 00093 g002
Figure 3. Training process of the network using two hidden neurons.
Asi 06 00093 g003
Figure 4. Layout drawing of the ANN model.
Asi 06 00093 g004
Figure 5. Contributions of variables to RSI.
Asi 06 00093 g005
Figure 6. Impact of input variables on RSI.
Asi 06 00093 g006
Figure 7. GEP expression tree.
Asi 06 00093 g007
Figure 8. Parametric analysis of predicted RSI values versus (a) Filler Content, (b) Aggregate Absorption, (c) Asphalt Content, and (d) Air Voids.
Asi 06 00093 g008
Table 1. Bitumen properties.
TestResultASTM D946 Criteria
Min.Max.
Specific gravity at 25 °C 1.02nana
Ductility at 25 °C, cm 127100na
Flash Point (°C) 306230na
Softening Point (°C) 51.846na
Penetration (0.1 mm) 67.36070
Loss on heating (%) 0.26na0.8
Penetration of residue, % of original 63.154na
Rotational viscosity at 135 °C, Pa·s 0.458nana
Rotational viscosity at 165 °C, Pa·s 0.158nana
Table 2. Aggregate mixes’ characteristics and physical properties.
PropertyAggregate Blends Criteria (Jordan’s MPWH)
Mix AMix BMix CMix DMix E
Bulk specific gravity of combined aggregate (dry) 2.5312.5572.6132.6012.545na
Apparent specific gravity of combined aggregate 2.6942.7062.7182.7112.701na
Moisture absorption of combined aggregate (%) 1.3342.0793.7712.5211.858na
Filler proportions (%) 2.624.977.346.063.722–8%
Abrasion loss (500 revolutions) (%) 25.2%28.3%26.5%27%25.8%35% max.
Ratio of wear loss (100/500) (%) 20%22%19%23%22%25% max.
Sand equivalent (%) 62.7%65.5%61.8%63.2%62.5%50% min.
Clay lumps (%) 0.7%0.4%0.5%0.4%0.6%1% max.
Soundness by sodium sulfate (%) 5.1%5.4%4.1%4.6%4.2%9% max.
Table 3. Average results of RSI values.
Asphalt MixturesF%Ab%AC%Average Values
Va%S1 (kN)S2 (kN)RSI %
Mix A 2.621.3343.58.810.9347.90072.25
2.621.3344.07.511.4258.75276.61
2.621.3344.56.114.02411.56082.43
2.621.3345.04.514.15112.28686.82
2.621.3345.53.713.71011.94387.11
Mix B 4.972.083.57.911.9058.51671.53
4.972.084.06.513.03610.11477.58
4.972.084.55.114.38611.85082.37
4.972.085.04.015.01412.61584.02
4.972.085.53.015.37712.95784.26
Mix C 7.343.773.57.012.0628.49470.42
7.343.774.05.414.92610.91273.11
7.343.774.54.216.22012.73978.54
7.343.775.03.315.75912.66180.34
7.343.775.52.115.48512.29679.41
Mix D 6.062.5213.57.311.7688.31370.64
6.062.5214.05.914.73911.32476.83
6.062.5214.54.415.56312.72481.76
6.062.5215.03.515.36712.68982.57
6.062.5215.52.414.58211.94081.88
Mix E 3.721.863.58.410.7687.73471.83
3.721.864.06.911.7979.15077.56
3.721.864.55.413.38611.16083.37
3.721.865.04.214.09211.95984.86
3.721.865.53.313.74911.75785.51
Table 4. Statistical measures of the network iterations.
NeuronsTraining DatasetTesting Dataset
MSER2MSER2
11.43940.94793.9520.8207
20.22510.99240.20670.9928
30.21910.99221.06530.9700
40.16670.99400.73940.9702
Table 5. GEP parameters.
Linking FunctionAddition
Number of genes3
Function selections + , , × , ÷   , tanh ( x ) ,   x 2 , x
Head size8
Number of chromosomes30
Table 6. Performance measures of the proposed model.
Performance MeasuresTraining DatasetTesting DatasetAll Datasets
MAE0.5370.5080.530
RMSE0.6620.6480.659
R20.9620.9730.966
Disclaimer/Publisher’s Note: The statements, opinions and data contained in all publications are solely those of the individual author(s) and contributor(s) and not of MDPI and/or the editor(s). MDPI and/or the editor(s) disclaim responsibility for any injury to people or property resulting from any ideas, methods, instructions or products referred to in the content.

