1. Introduction
In December 2019, an outbreak of pneumonia of unknown origins emerged in the Wuhan, province of Hubei, China. Shortly after, the severe acute respiratory syndrome coronavirus 2 (SARS-CoV-2), transmissible from animals to humans, was discovered. On 12 March 2020, the World Health Organization declared a pandemic [
1].
The effects of the SARS-CoV-2 virus have caused an increased interest in the development and distribution of safe and effective vaccines.
Undoubtedly, in this situation, the main focus is to develop an effective vaccine. However, it is also necessary to understand how the vaccines can be delivered as quickly as possible to vaccination centers so that they can be administered and thus help the population achieve immunity against this virus.
According to [
2], in the last 28 days (5 December 2022 to 1 January 2023), over 14.5 million cases and over 46,000 deaths have been reported globally. This represents an increase of 25% and 21%, respectively, compared to the previous 28 days. Therefore, COVID-19 is still an urgent matter, and the optimized distribution of the vaccine is crucial to control the spread of this disease.
For this reason, the main goal of this paper is to determine a way of optimizing vaccine distribution routes so that the vaccines can be delivered as quickly as possible to vaccination centers.
This article starts with a literature review of the subject matter and the theoretical foundation of this paper are presented. The literature review provides background knowledge on how to define the problem, as well as identify the current solutions to the problem. Therefore, the literature review and theoretical foundations justify the choice of methodology used in this case study. Then, the case study (scenarios to be tested) and the methodology used are presented. Afterwards, the results are presented and discussed. Finally, some limitations and proposals for future works on this matter are detailed and a conclusion is made.
When it comes to optimizing vaccine distribution routes, there are several constraints to consider; two of the most crucial being maximum time (due to the fragile state of the vaccines, the deteriorating nature of the vaccine compound, and the storage conditions of the transport unit) and capacity [
3,
4,
5]. Therefore, the case study must present a model that considers the present constraints and provides an optimized route.
Another relevant aspect that this problem must address is the human impact on the environment, given that transport is a source of greenhouse gas emissions [
6]. Logistical processes are not just strongly linked to environmental consequences; they also represent a large part of an organization’s costs, forcing the implementation of mechanisms that allow for a minimization of those costs [
6,
7].
The strategy to optimize vehicle routes is used in transportation networks to minimize the cost of operation and increase consideration for sustainability. Thus, using the VPRTW model, it is possible to reduce the emission of Carbon Dioxide (CO
2), reducing environmental impact [
6]. The Vehicle Routing Problem with Time Windows (VRPTW) consists of finding the least costly routes that stills ensures each point is visited within a predetermined time window. Thus, considering that each vehicle cannot exceed its capacity, it must start and end a route at a given depot [
8]. However, for this study’s problem, as already mentioned, the most crucial constraints are time and capacity—not cost—given the short life span during which vaccines can be transported and not lose their effectiveness. Therefore, the problem that this paper focuses on is determining a method to optimize Pfizer vaccine distribution routes in Central Portugal, considering that the proposed solution must consider constraints such as time, vehicle capacity, and logistical environmental consequences. Thus, some other constraints and lines of thought must be considered. Several aspects must be considered to optimize the number of vehicles: the maximum capacity of each vehicle in terms of maximum weight it can carry and the maximum number of Pfizer vaccine bottles it can transport. the demand of each vaccination center and its location must also be considered, in order to calculate the distance in terms of time and minimize it. When calculating the optimized routes, the time limit, which is estimated through the life span of each vaccine according to the Pfizer conditions of transportation, is the crucial factor. The estimated time leads to two possible transportation scenarios: one that uses overtime, and another that does not. All the presented aspects will be considered in the proposed solution. After testing the two scenarios, a follow-up analysis will be conducted. In this analysis, both the total cost and the total CO
2 emissions of each route will be calculated. This will aid in the development of a set of criteria for selecting the optimized route, considering not only the route’s total cost but also which route will be the most efficient.
The two initial hypotheses to optimize the distribution of the COVID-19 vaccines and solve the initial questions are as follows:
Hypothesis 1.: The scenario that considers 480 min provides the most optimized solution for the distribution of COVID-19 vaccines for each cluster.
Hypothesis 2.: The scenario that considers 585 min provides the most optimized solution for the distribution of COVID-19 vaccines for each cluster.
Hypothesis 3.: Both scenarios provide the same optimal solution for the distribution of COVID-19 vaccines for each cluster.
Hypothesis 4.: When the CO2 emissions value is minimized, the total cost of the route is also minimized in each cluster.
Through a literature review, it was concluded that this study contributes to:
Identifying methods and algorithms to explore pandemic containment delivery operations. This case focuses on Central Portugal, however, it can be extended or applied to other locations and conditions;
Highlighting the social impact of VPRTW through decreasing the vaccine’s delivery time by optimizing the routes, due to the urgent need to properly vaccinate the population;
Studying the economic and sustainability impacts of the COVID-19 vaccine distribution process through further analysis (after route optimization);
Providing a replicable methodology to optimize the COVID-19 vaccine’s distribution route. This method can then be applied to other fields, such as when there is a distribution problem for perishable products;
Using VRPTW to address a social problem as opposed to a commercial problem for which efficiency is associated with minimizing costs. In this case, it is used to minimize time;
Ensuring the vaccines are delivered within the established quality parameters;
Ensuring the vaccines are delivered in secure conditions.
However, the main contribution of this case study is the proposed methodology, which associates each center’s demand, vehicle capacity, number of vehicles, and vaccine distribution needs. The study also proposes a deep analysis of the possible roads, in order to maximize the safe delivery of the vaccines.
2. Theoretical Foundation
Logistics industries have grown significantly in recent years and are expected to grow at a faster rate in the future [
9]. One of the most important applications within logistics operations is vehicle routing. This happens because the allocation of resources cannot be accomplished unless resources are available at the right time, place, and in the right amount [
10]. As a result, providing cost-effective and efficient services is of primary importance to any logistics enterprise [
11]. This importance grows exponentially when considering epidemics and pandemics, such as the COVID-19 pandemic.
The Travelling Salesman Problem (TPS) is a classic problem of routing. In TPS, a salesman has to visit a set of cities, starting at one city and subsequently returning to the same city they started in [
9]. This must be achieved while minimizing the total length and total cost of the trip [
9].
The TPS originates from the classic Vehicle Routing Problem (VRP) [
11]. This problem aims to find a set of routes at a minimal total cost, beginning from, and ending the trip, at a depot [
9]. This assures that each customer’s demands are fulfilled. The first known application of VRP was for petrol deliveries [
11] and was introduced by Dantzig and Ramser [
12].
Due to improvements in computational technology, VRP has been extended in many ways by introducing real-life aspects or characteristics, creating extensions from the classical VRPT [
11]. Some examples are [
12] time-dependent vehicle routing problem (TDVRP); multi-depot VRP; location routing problem; periodic VRP; VRP with time window; green VRP; and electric-vehicle VRP, among many others.
Most of the methods and applications for the solutions found in the literature relate to commercial problems, in which case, efficiency is associated with minimizing costs [
13]. However, the imperative restriction in this case study is time, given the vaccine’s fragile conditions. Therefore, a Vehicle Routing Problem with Time Window (VRPTW) must be applied.
In 1987, for the first time in history, Solomon used the VPRTW, which required that delivery vehicles provide their services to the customer in the stipulated time interval, guaranteeing customer satisfaction [
14]. The VRPTW is an extension of the Vehicle Routing Problem (VRP), with an added time window constraint at each search point (that is, each node/point in a determined route), which means that for each search point, the service’s first and last start times are defined, and the vehicles are required to serve the customers within this time window [
8,
14]. VRPTW consists of finding the route with the shortest time so that each considered customer is visited within a defined time window by only one vehicle [
15].
In addition, the considered vehicle cannot deliver a quantity that exceeds its capacity and must finish its route at the starting point [
15].
There are two types of time window constraints for the demand points: the hard time window and the soft time window. The first case requires that the vehicle must start serving the customers within the stipulated time window. In this case, there are two options: waiting if the vehicle arrives early and rejecting the vehicle if it arrives after the time window closes. In the second case, the vehicles do not need to start serving customers within the time window. However, there must be a punishment if the vehicle arrives after the time window opens [
14].
Some of the most useful applications of the VRPTW include bank deliveries, postal deliveries, industrial refuse collection, national franchise restaurant services, school bus routing, security patrol services, and just-in-time manufacturing [
16].
It is imperative to account for the various limitations of this process. The optimization of the process needs to comprehensively consider the relationship between the number of vehicles’ load distribution, the time window restrictions, and the path planning required to achieve the shortest time possible [
8,
14].
The priority restrictions in this case study are the time window in which the vaccines can be delivered (due to their delicate characteristics) and each vehicle’s capacity. It must also consider the determination of the optimized number of vehicles and the path planning to achieve the shortest time possible.
For this reason, this case study will adopt the VRPTW method with a load restriction. The VRPTW allows for finding the shortest time routes and ensuring that each vehicle only carries the maximum load assigned.
In the review of the literature, heuristic and metaheuristic methods to solve the VRPTW were studied. Heuristics come from the Greek word meaning “to discover” based on intuition and habit [
17]. Therefore, classical heuristics include trial and error, intelligent guesses, elimination, and experiences [
17]. They are a flexible, problem solving, and individual-optimization methods that facilitate quick decisions (within modest computing times) and good quality solutions for complex data with limited knowledge and relatively limited exploration of the search space [
17,
18]. Moreover, most heuristics can be easily extended to account for the diversity of constraints encountered in real-life contexts [
18].
Metaheuristics are high-level heuristics whose emphasis is on performing deep exploration of the most promising regions of the solution space [
18]. These methods typically combine sophisticated neighborhood search rules, memory structures, and a recombination of solutions [
18].
Similar to heuristics, metaheuristics try to efficiently explore the search space of optimization problems [
17]. However, while the adaptation to a specific problem uses heuristics as a solution method, a metaheuristic method may manipulate a complete or incomplete single solution or a collection of solutions at each interaction [
8]. In other words, a heuristic provides a solution for a specific problem, in a way that works for that situation. However, it cannot be used to solve a different problem [
8]. Therefore, metaheuristics are nothing more than sophisticated improvement procedures, and they can simply be viewed as natural enhancements of classical heuristics [
18]. Metaheuristic algorithms are based on the behavior of natural phenomena such as physical phenomena, biological evolution, and living beings. These algorithms define themselves as the interactions between local individuals and their behaviors, which are split into five groups according to their nature [
19]:
Evolutionary Algorithms are based on Charles Darwin’s theory of natural selection. This algorithm starts with a population and then searches through successive generations to find the most optimal solution. Two of the associated algorithms are Genetic Algorithm and Genetic Programming.
Physical Algorithms consist of the laws of physics, such as heating and cooling. During the physical process, the heating of the material and the subsequent cooling contributes to a reduction of energy in a system. This is how simulated annealing arises. Therefore, this algorithm aims to achieve the optimal solution for the system. Some of the associated algorithms are Harmony Search and Memetic Algorithm.
Swarm Intelligence Algorithms are based on solving problems using the collective and organized behavior of animals and insects. This algorithm is a multi-agent system inspired by collective intelligence (given by the interaction of homogeneous agents). Two of the associated algorithms are Particle Swarm Optimization and Ant Colony Optimization.
Bio-inspired Algorithms derive from the behavior of the biological evolution of a living organism. These algorithms respond to the nature of distributed, decentralized, and self-organized data of malleable nature. Some of the associated algorithms are Artificial Immune System and Bacterial Foraging Optimization.
Miscellaneous Algorithms aim to provide an alternative solution to traditional real-time-based applications with intensification and diversification of the search space. Two of the associated algorithms are Cat Swarm Optimization and Bat Algorithm.
Although [
9,
10,
11,
15,
20,
21] consider Genetic Algorithm to be a metaheuristic, other authors in the analyzed literature consider it to be a heuristic. Some examples of these authors are [
14,
16,
22].
Some interesting case studies of VRPTW problems can be identified in the literature. In some of these studies, it is necessary to minimize the total distribution costs to satisfy the customer demand at a specific receiving time [
9,
11,
22]. In other cases, the studies focus on minimizing the longest route and the total distance travelled [
13]. All the cases that have been mentioned so far have something in common: optimization routes. In order to achieve all goals, the authors used several different methodologies. Hoa et al. [
11] used VRPTW in GA, Yuan [
22] used GA through MATLAB plot plugin in Python, Pacheco and Laguna [
13] developed an optimization system based on a customized heuristic method, and Agrawal et al. [
9] used LINGO software and a GA. Through the different methodologies, all the studies improved the distribution systems, achieving their goals.
According to Zhang et al. [
14], a heuristic generic VRPTW with capacity, objectives, the number of vehicles, and distance can address this study’s problem. Additionally, VRPTW allows for finding quality solutions in a reasonable time.
After analyzing the case studies mentioned, it was confirmed that the approach which suits the constraints and variables of the problem at hand is the approach presented by [
10]. Therefore, this will be the approach used in this study.
2.1. Mathematical Formulation
Let,
S = {1, 2,..., n} be the set of depots,
I = {1, 2,..., m} the set of clients that are depots,
V = {0, I} the union of S and I (set to “0” because there is only one depot and limited to I, because each vehicle starts at origin zero and goes to the first vaccination center; when it leaves the first to go to the second, that first center becomes an origin. This logic repeats through all vaccination centers, thus being limited to the set of clients I),
vs the set of customers served by vehicle s,
cij (cij ≥ 0, i, j ∈ V) the distance between the points of the customers,
C the maximum load,
gi (i ∈ V) the required load capacity of each customer required,
xsij indicates whether vehicles will serve customer j after having served customer i (xsij = 1 for service, xsij = 0 for no service),
ysi indicates whether customer i is served by vehicle s (ysi = 1 should be served, ysi = 0 should not be served),
[ai, bi] the timeout window of customer I,
ai the allowed service start time of customer i,
bi the end time of customer i, and
si the initial service time of customer
i [
14].
The mathematical model used is represented in the following formulation [
10]:
where
F1 is the number of vehicles and
F2 is the total distance run by all vehicles, subject to:
where
ϵ {0,1}, Ɐ
i,
j ϵ
V, Ɐ
s ϵ
S;
ϵ {0,1}, Ɐ
i ϵ
I, Ɐ
s ϵ
SEquations (2) and (3) represent, respectively, that the vehicle directly serves customer
j after serving customer
i, and the vehicle only serves customer
i before serving customer
j. Equations (4) and (5) indicate, respectively, that each vehicle must not exceed the maximum load capacity, and the vehicle must return to its origin after completing the service. Equation (6) means that each customer is only served by one single vehicle. Equation (7) allows for avoiding the generation of subloops in the service process. Equation (8) represents the hard time window restriction [
14].
This mathematical formulation of the VRPTW that will be used in this study is, according to Zhang et al. [
14], a heuristic method.
2.2. Algorithm
This algorithm is based on two important assumptions:
- (a)
The starting point is the endpoint; in this case, the distribution center of Montemor-O-Velho;
- (b)
Except for the starting point, each location is visited only once.
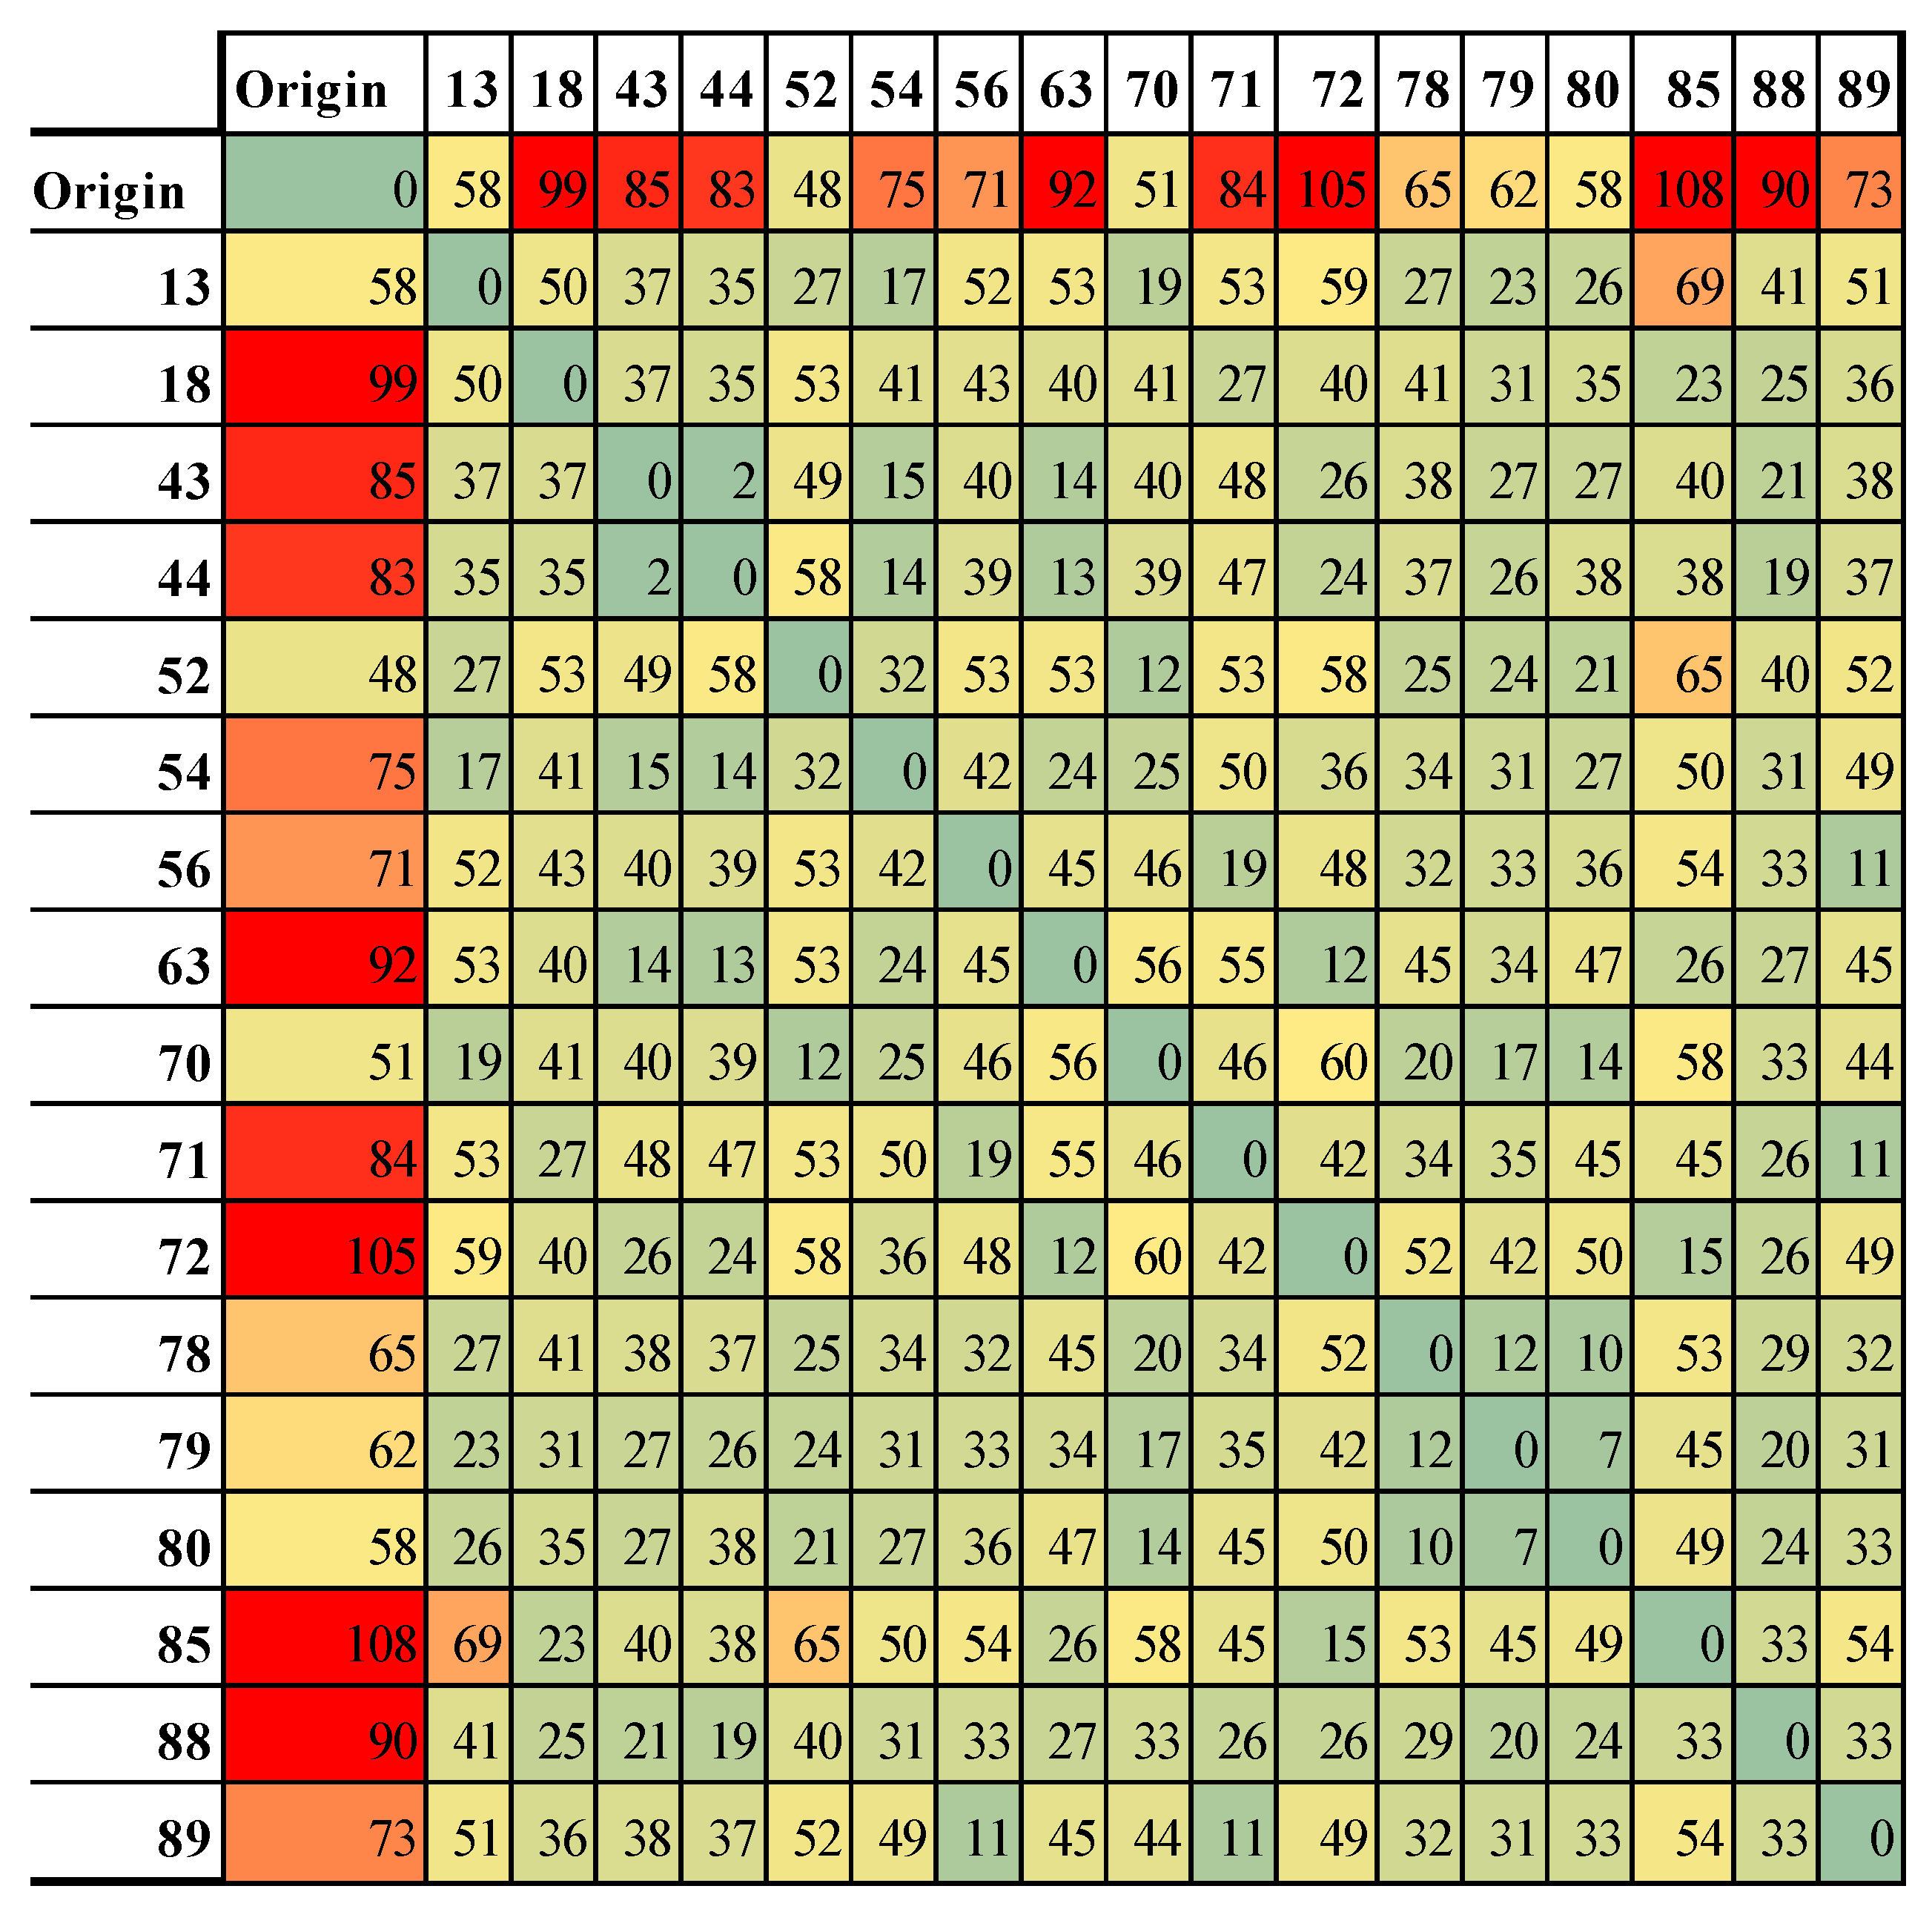
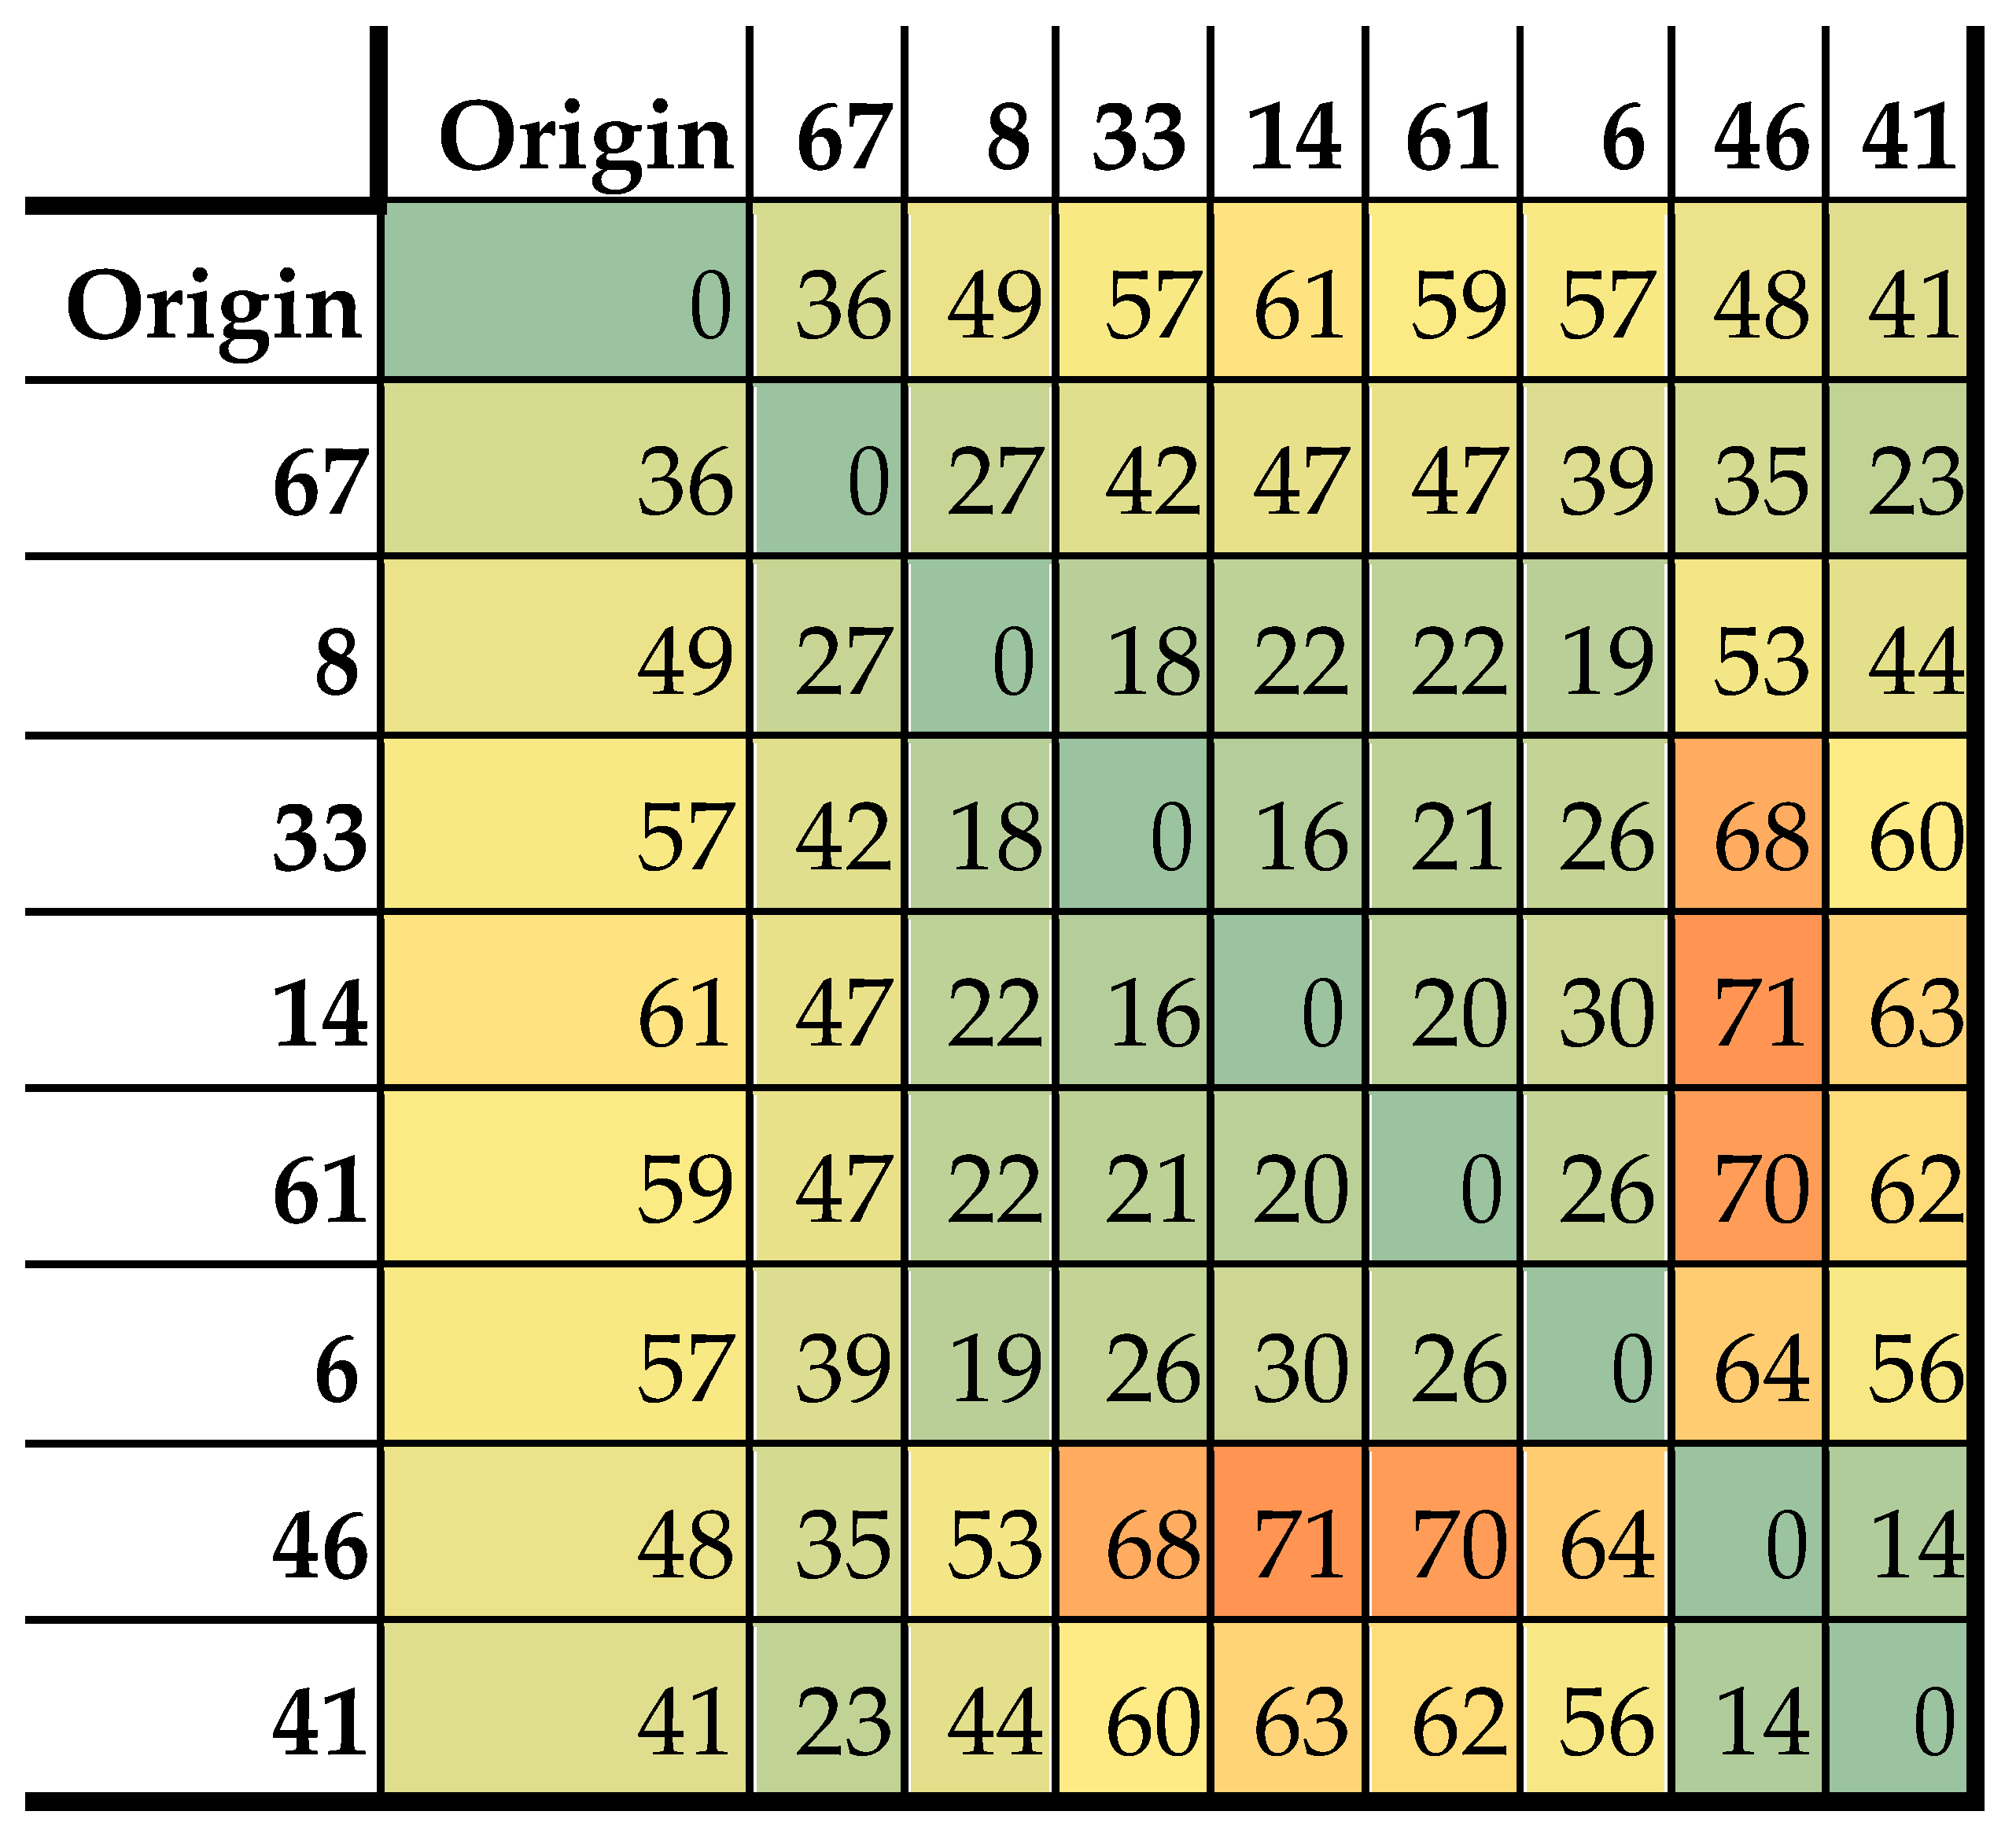
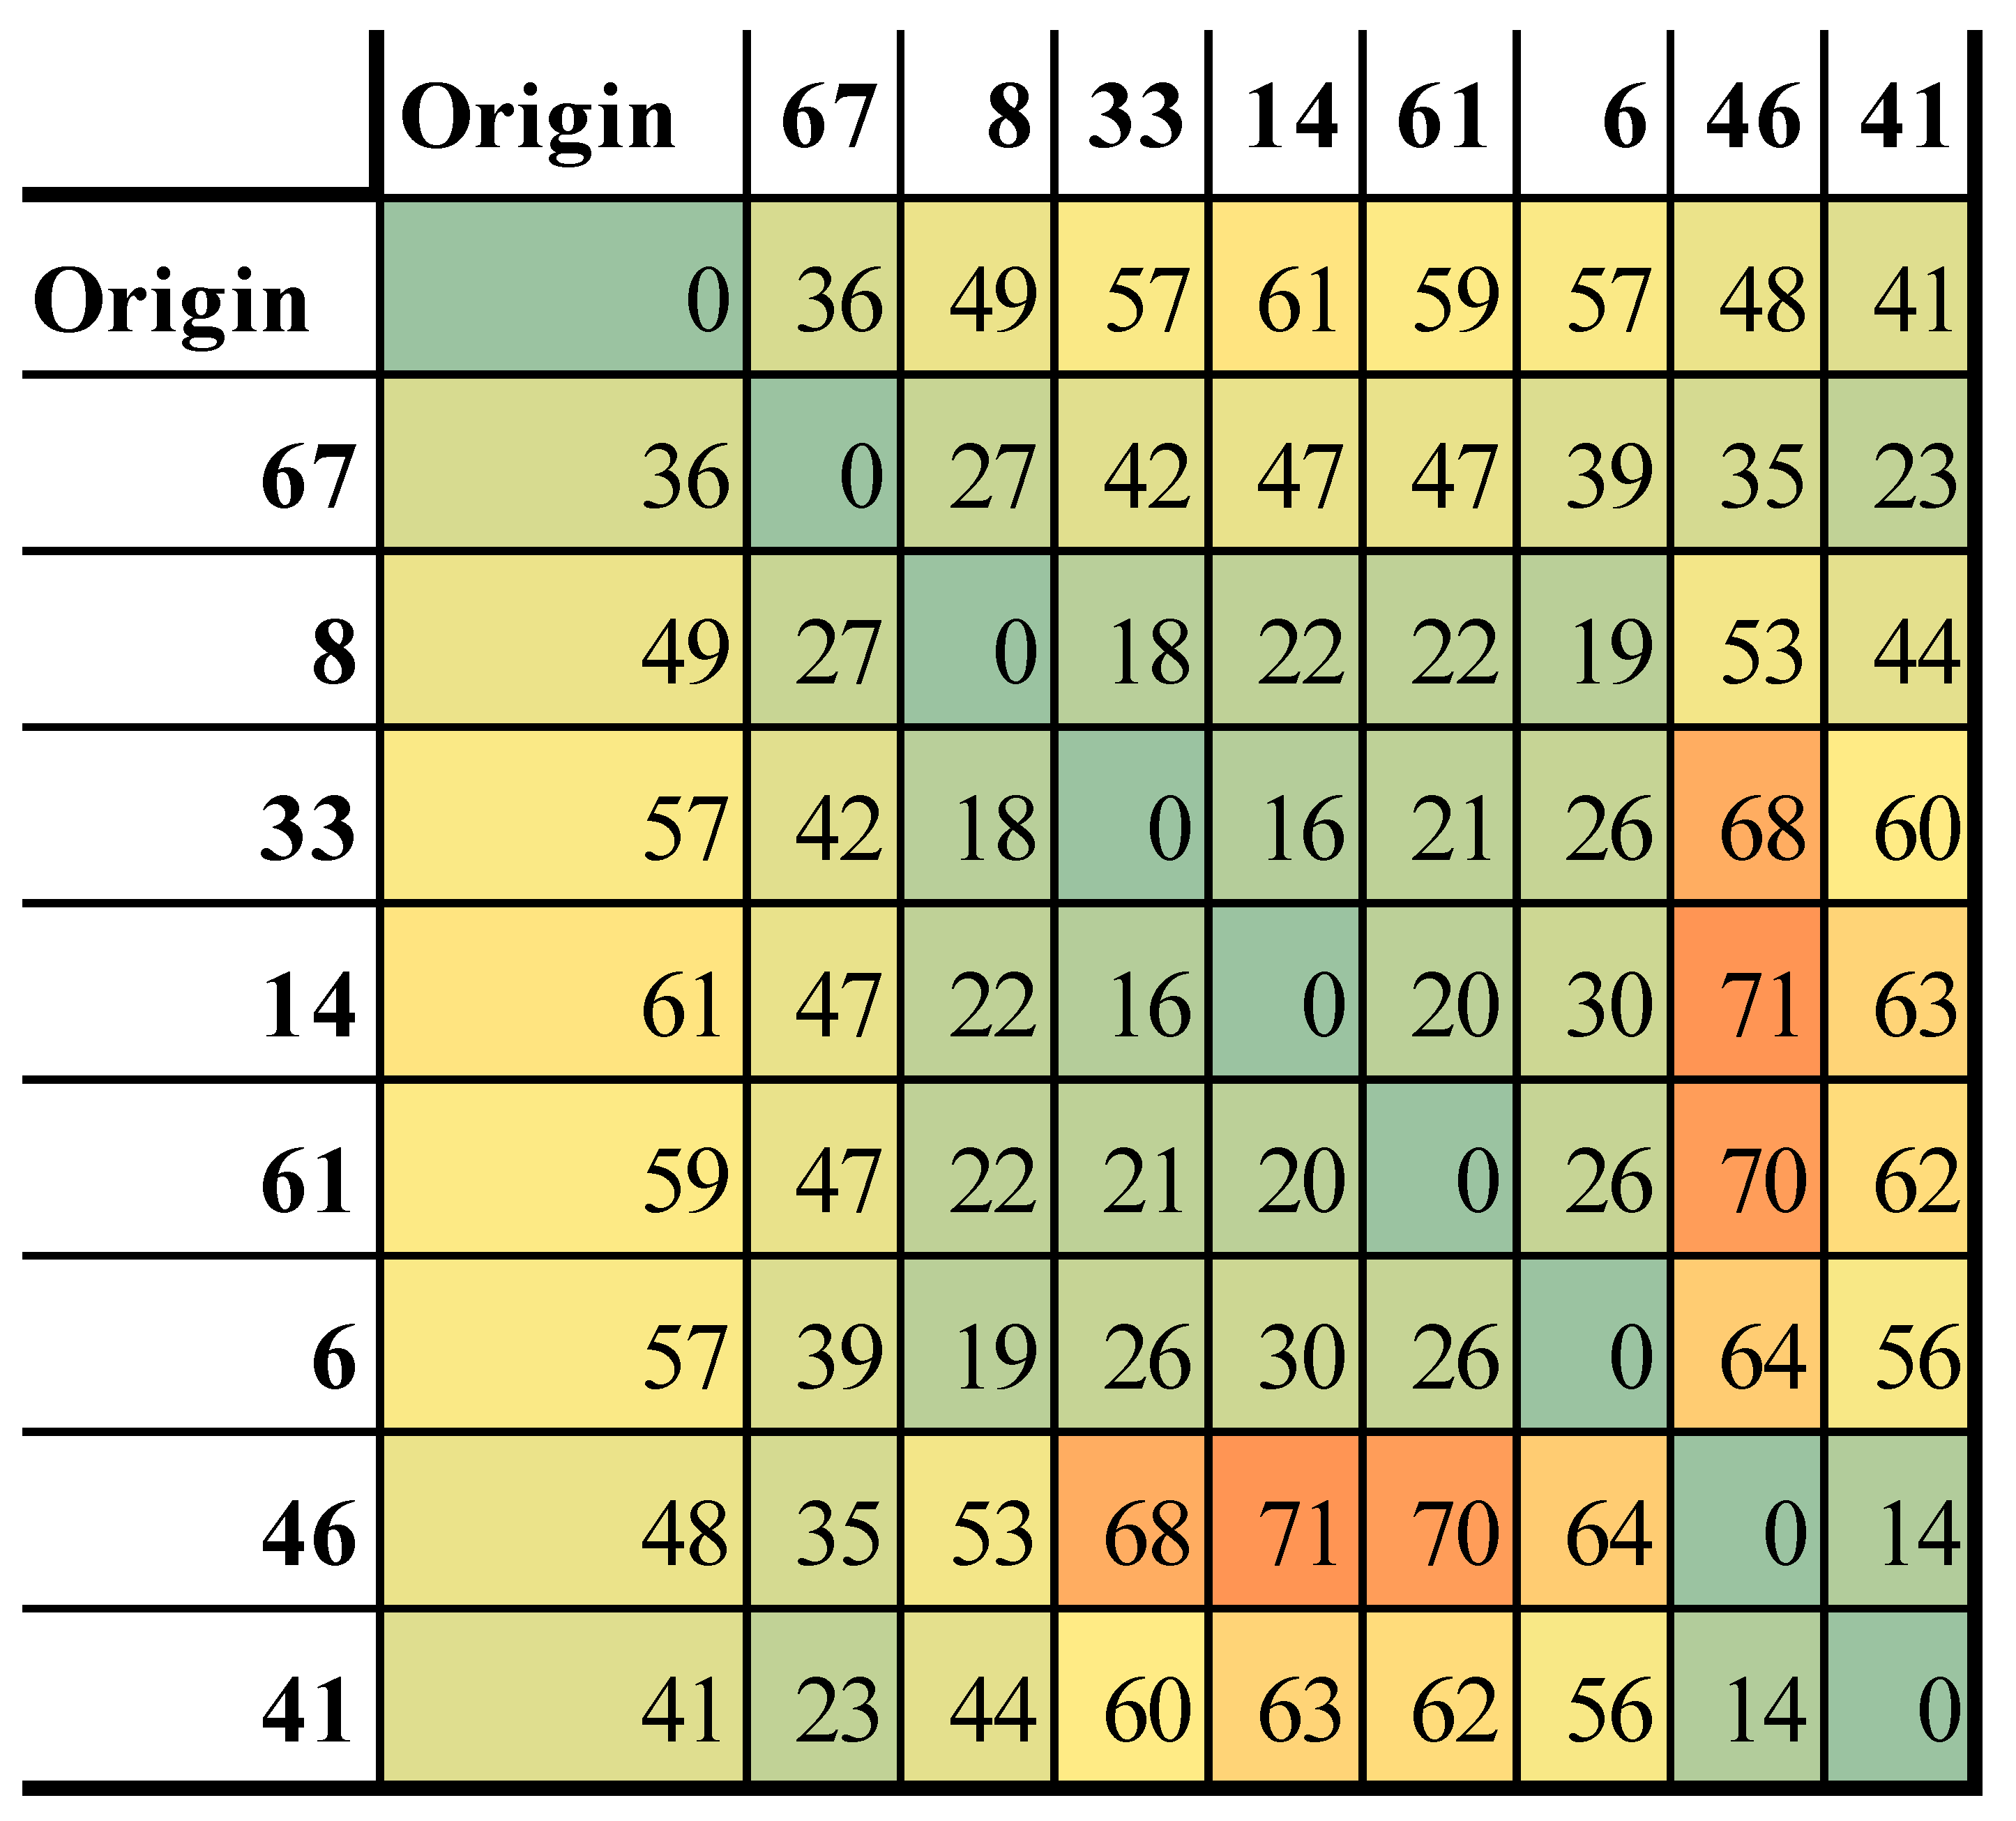
Before starting the iterative process, it was necessary to define the inputs of this algorithm:
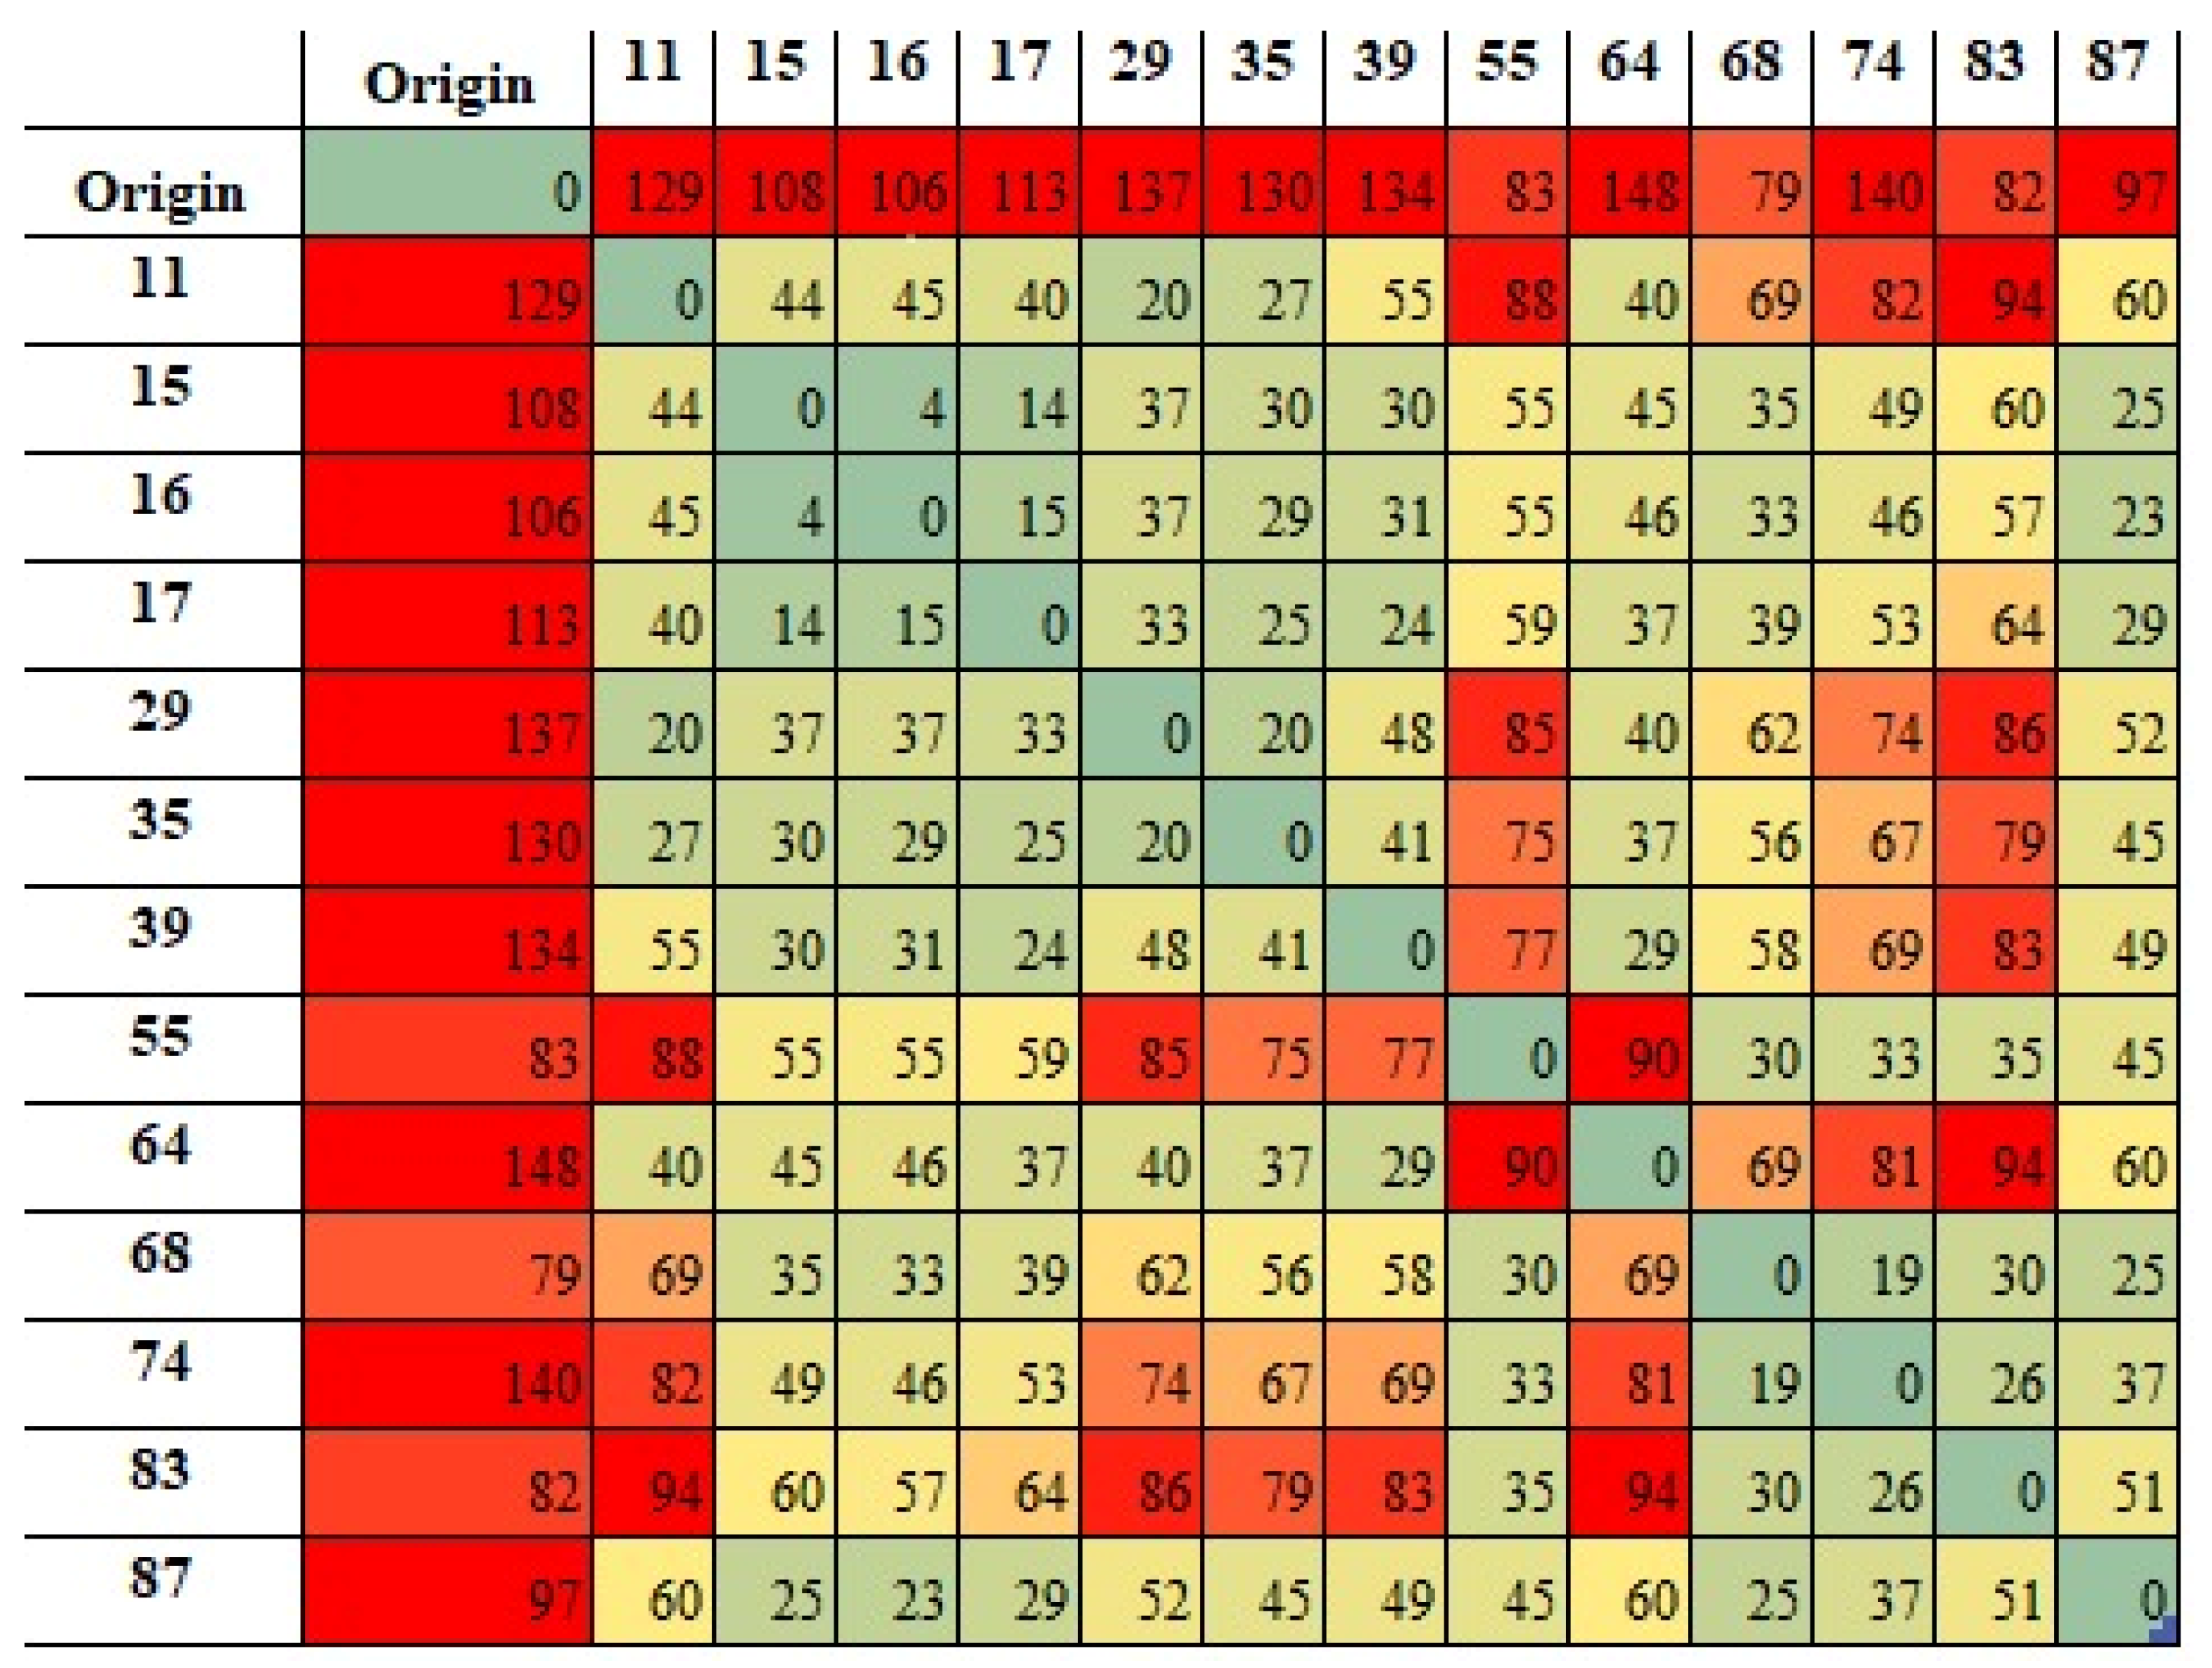
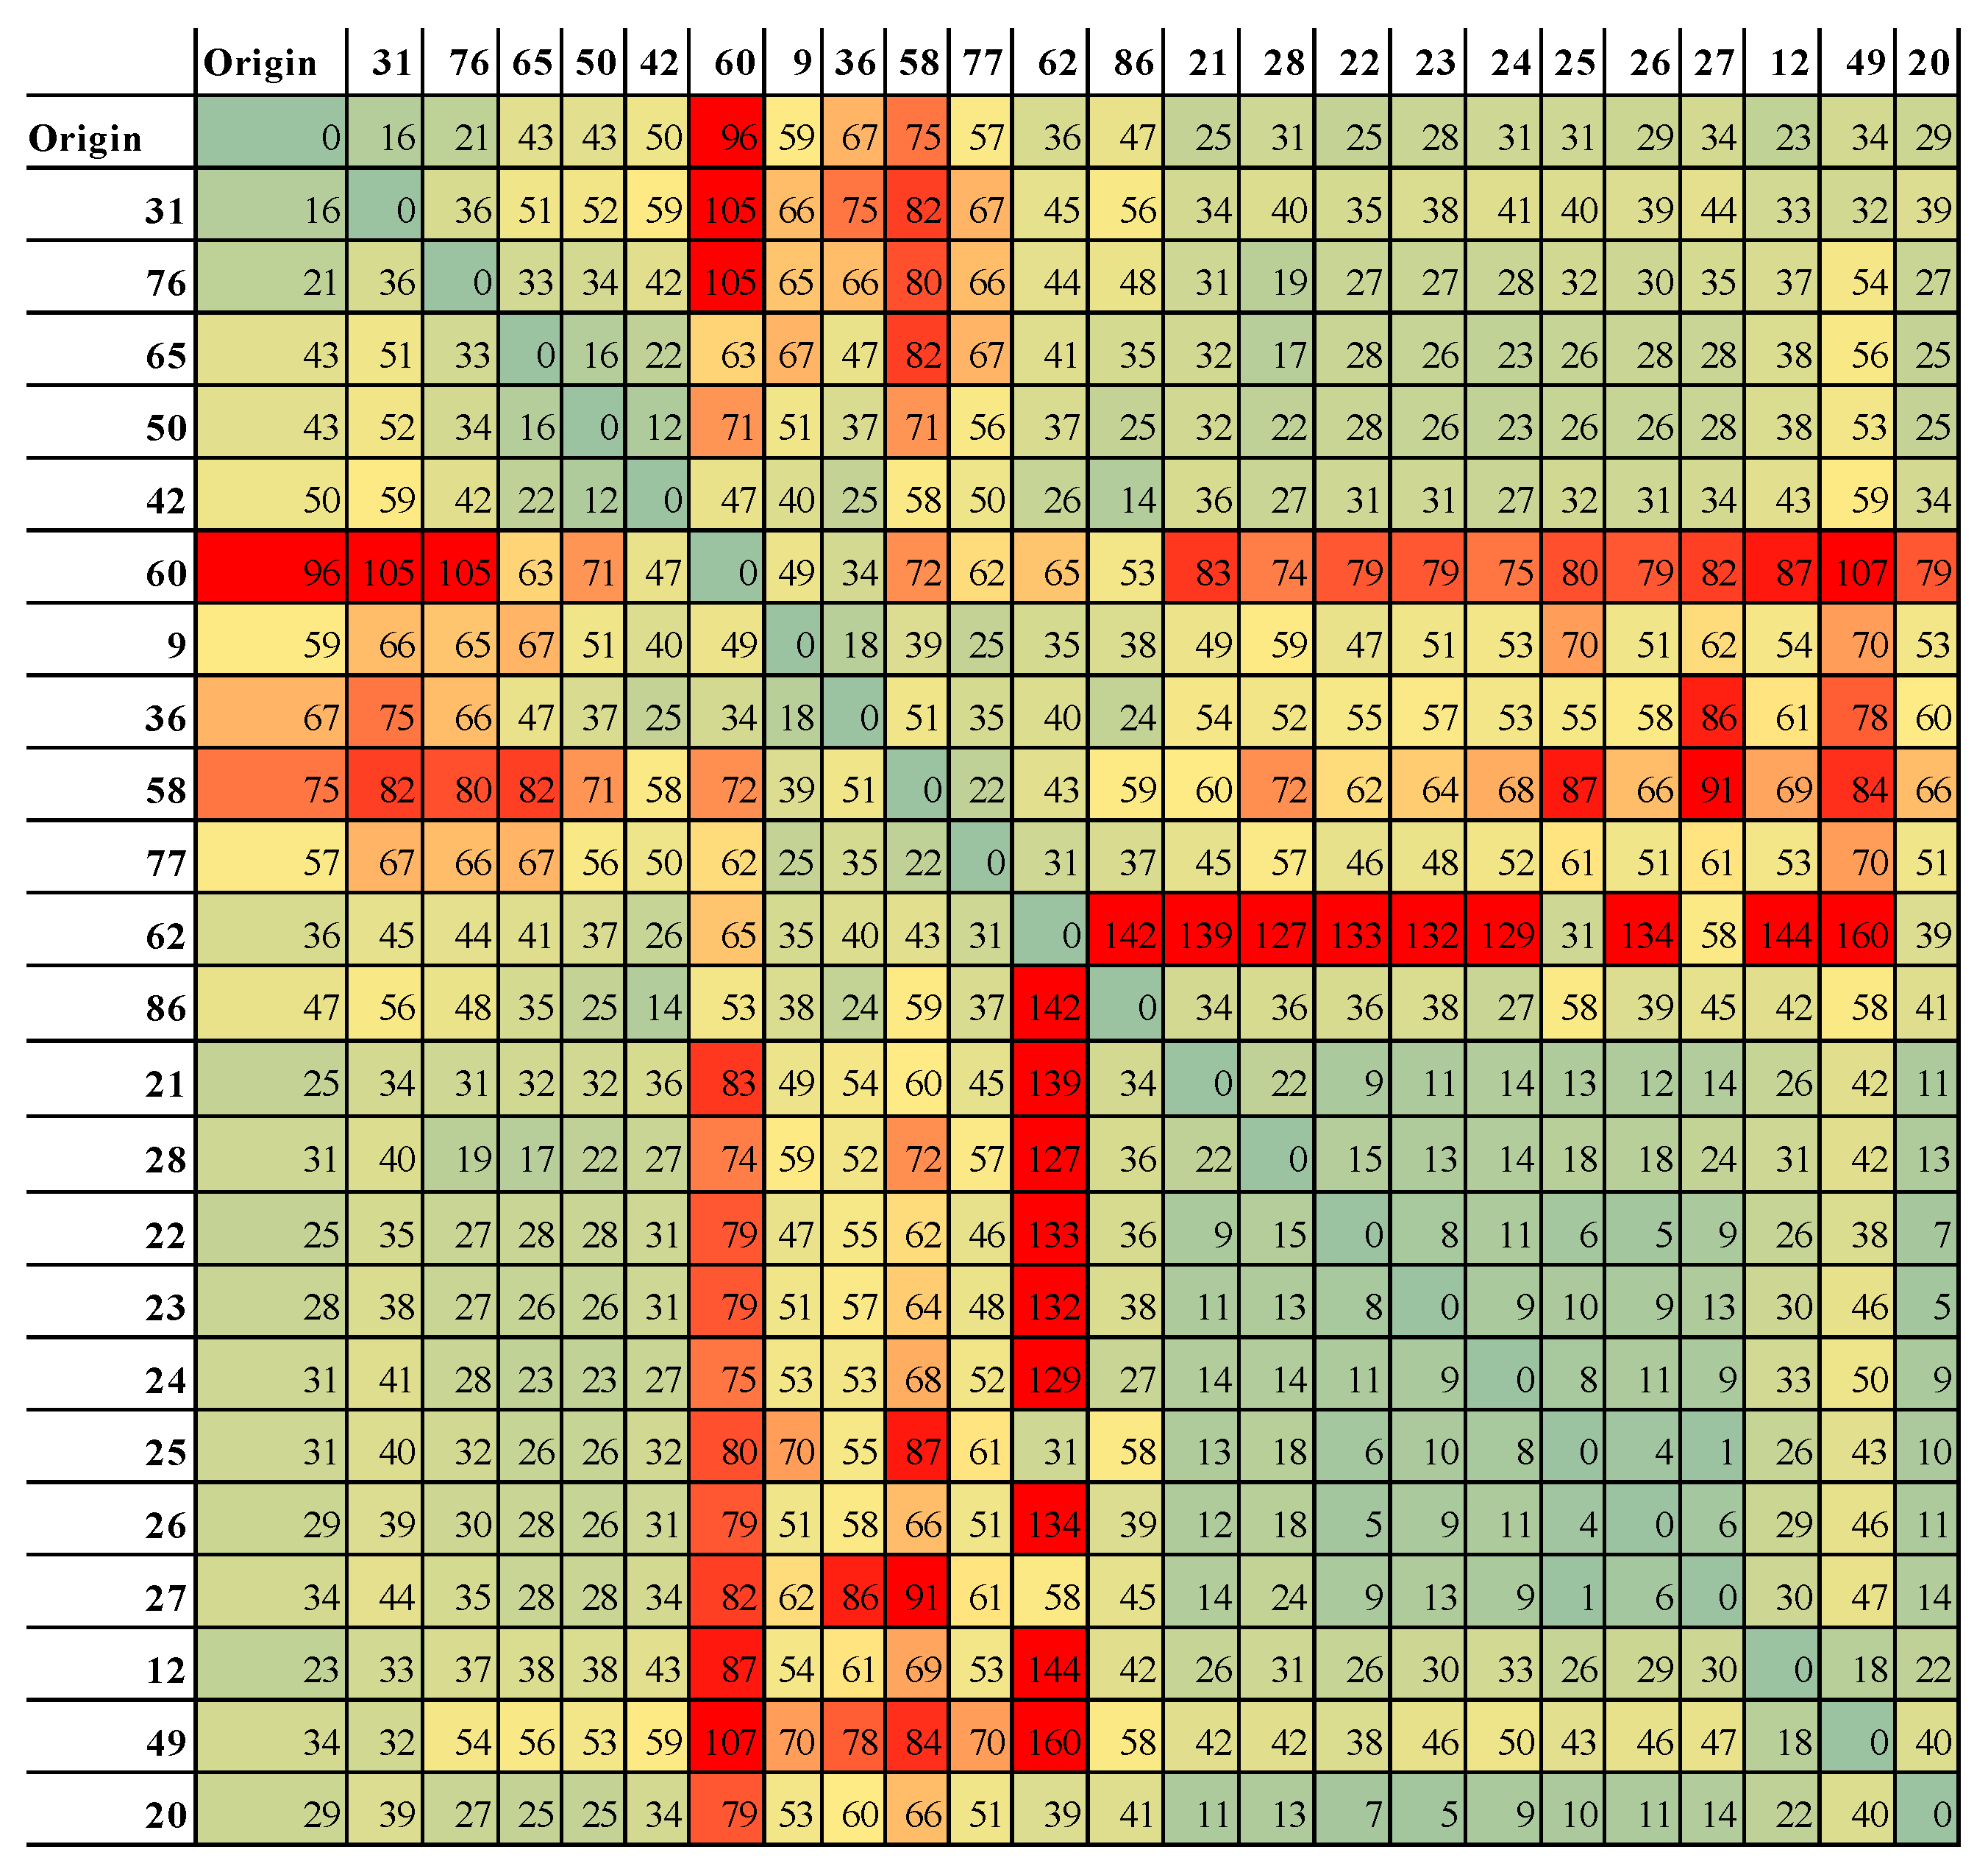
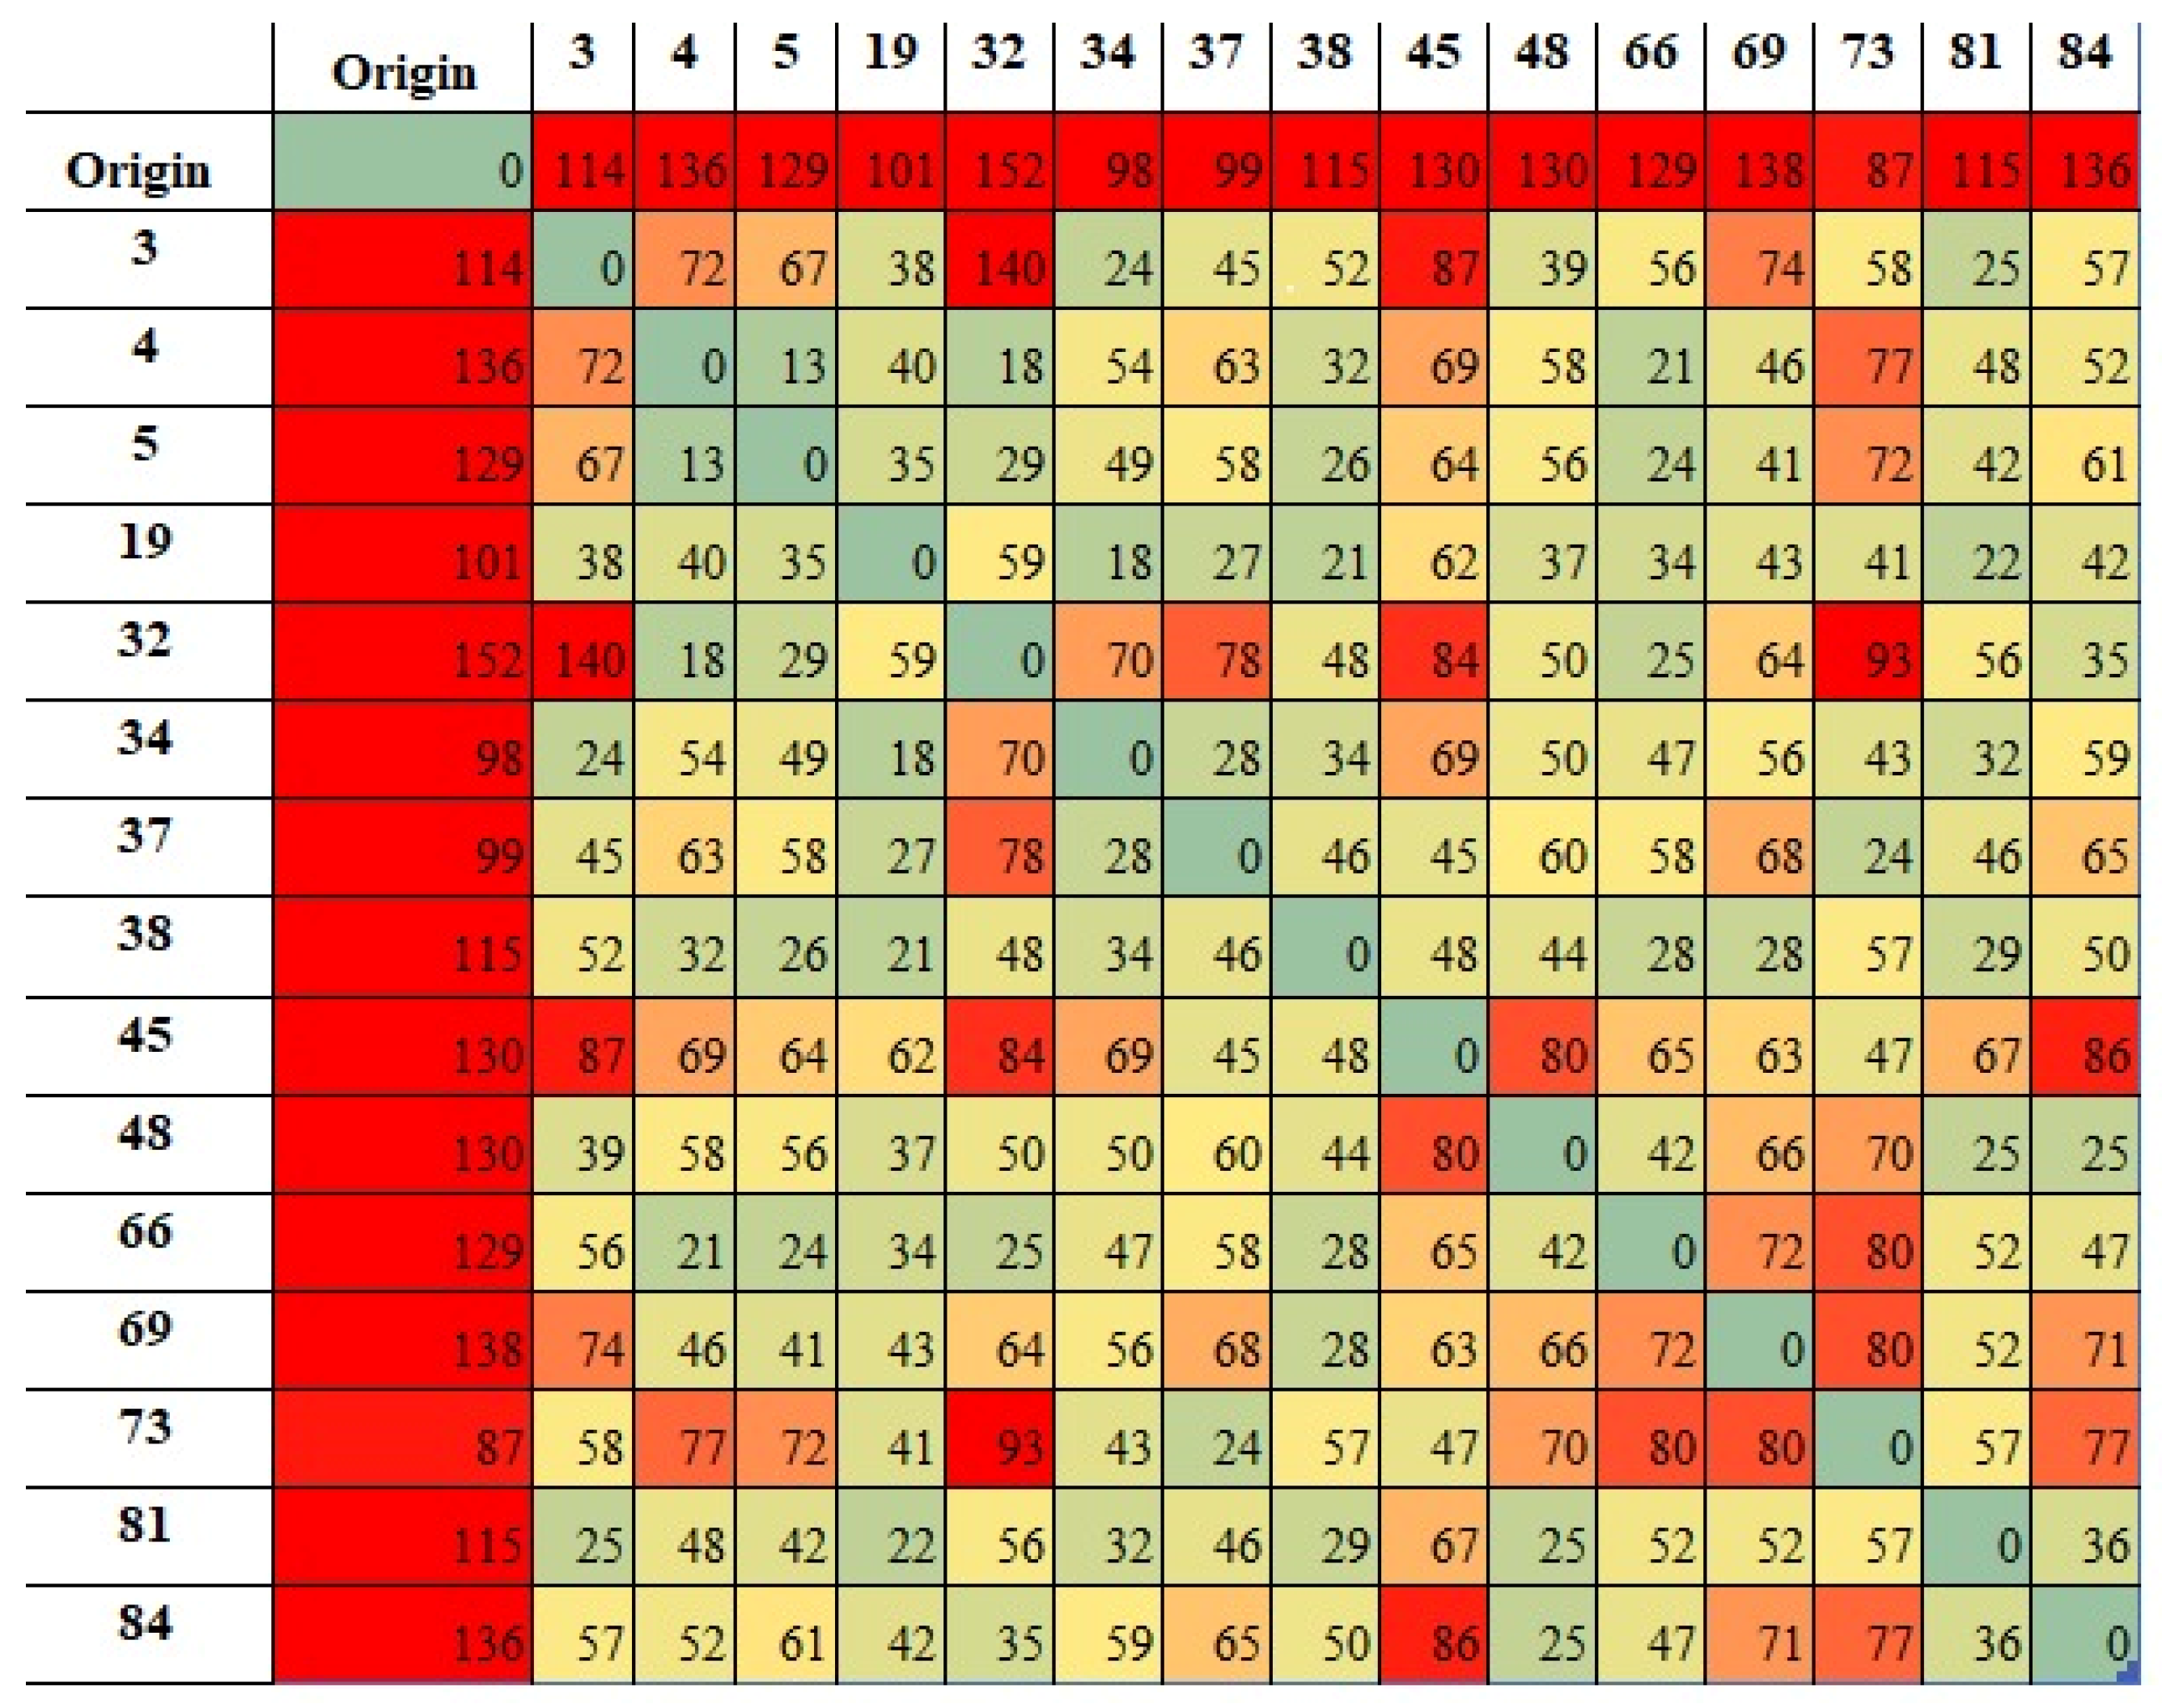
- (1)
Generate time_matrix N x N: the calculated distances were searched on Google Maps and imported into arrays in Microsoft Excel;
- (2)
Generate time_windows: the two scenarios with time windows of (0.480) and (0.585);
- (3)
Generate demands from each vaccination center: the vaccine demand values for each district;
- (4)
Generate vehicle_capacities: the constraint of the maximum load of each vehicle;
- (5)
Insert num_vehicles: the number of vehicles needed to transport the required number of vaccines was tested;
- (6)
Insert depot: the starting point considered is the distribution center, Montemor-O-Velho;
- (7)
Define allow waiting time: the defined waiting time allowed was 0;
- (8)
Set max time per vehicle: two scenarios (480 min and 585 min) were tested.
It was necessary to adjust the algorithm code to add a capacity constraint for each vehicle. The software used was Python 3.10.4.
After defining the inputs, the algorithm returned with a solution for the most optimized routes.
The algorithm was reproduced on an HP Laptop-15-dw2xxx with Intel(R) Core (TM) i7-1065G7 CPU @ 1.30GHz 1.50GHz,16.0 GB RAM, Windows 11 Home with OS 64-bit, the x64-based processor. The response time of the obtained routes was always between 3 and 12 s. Thus, the computation time is acceptable for real-life applications.
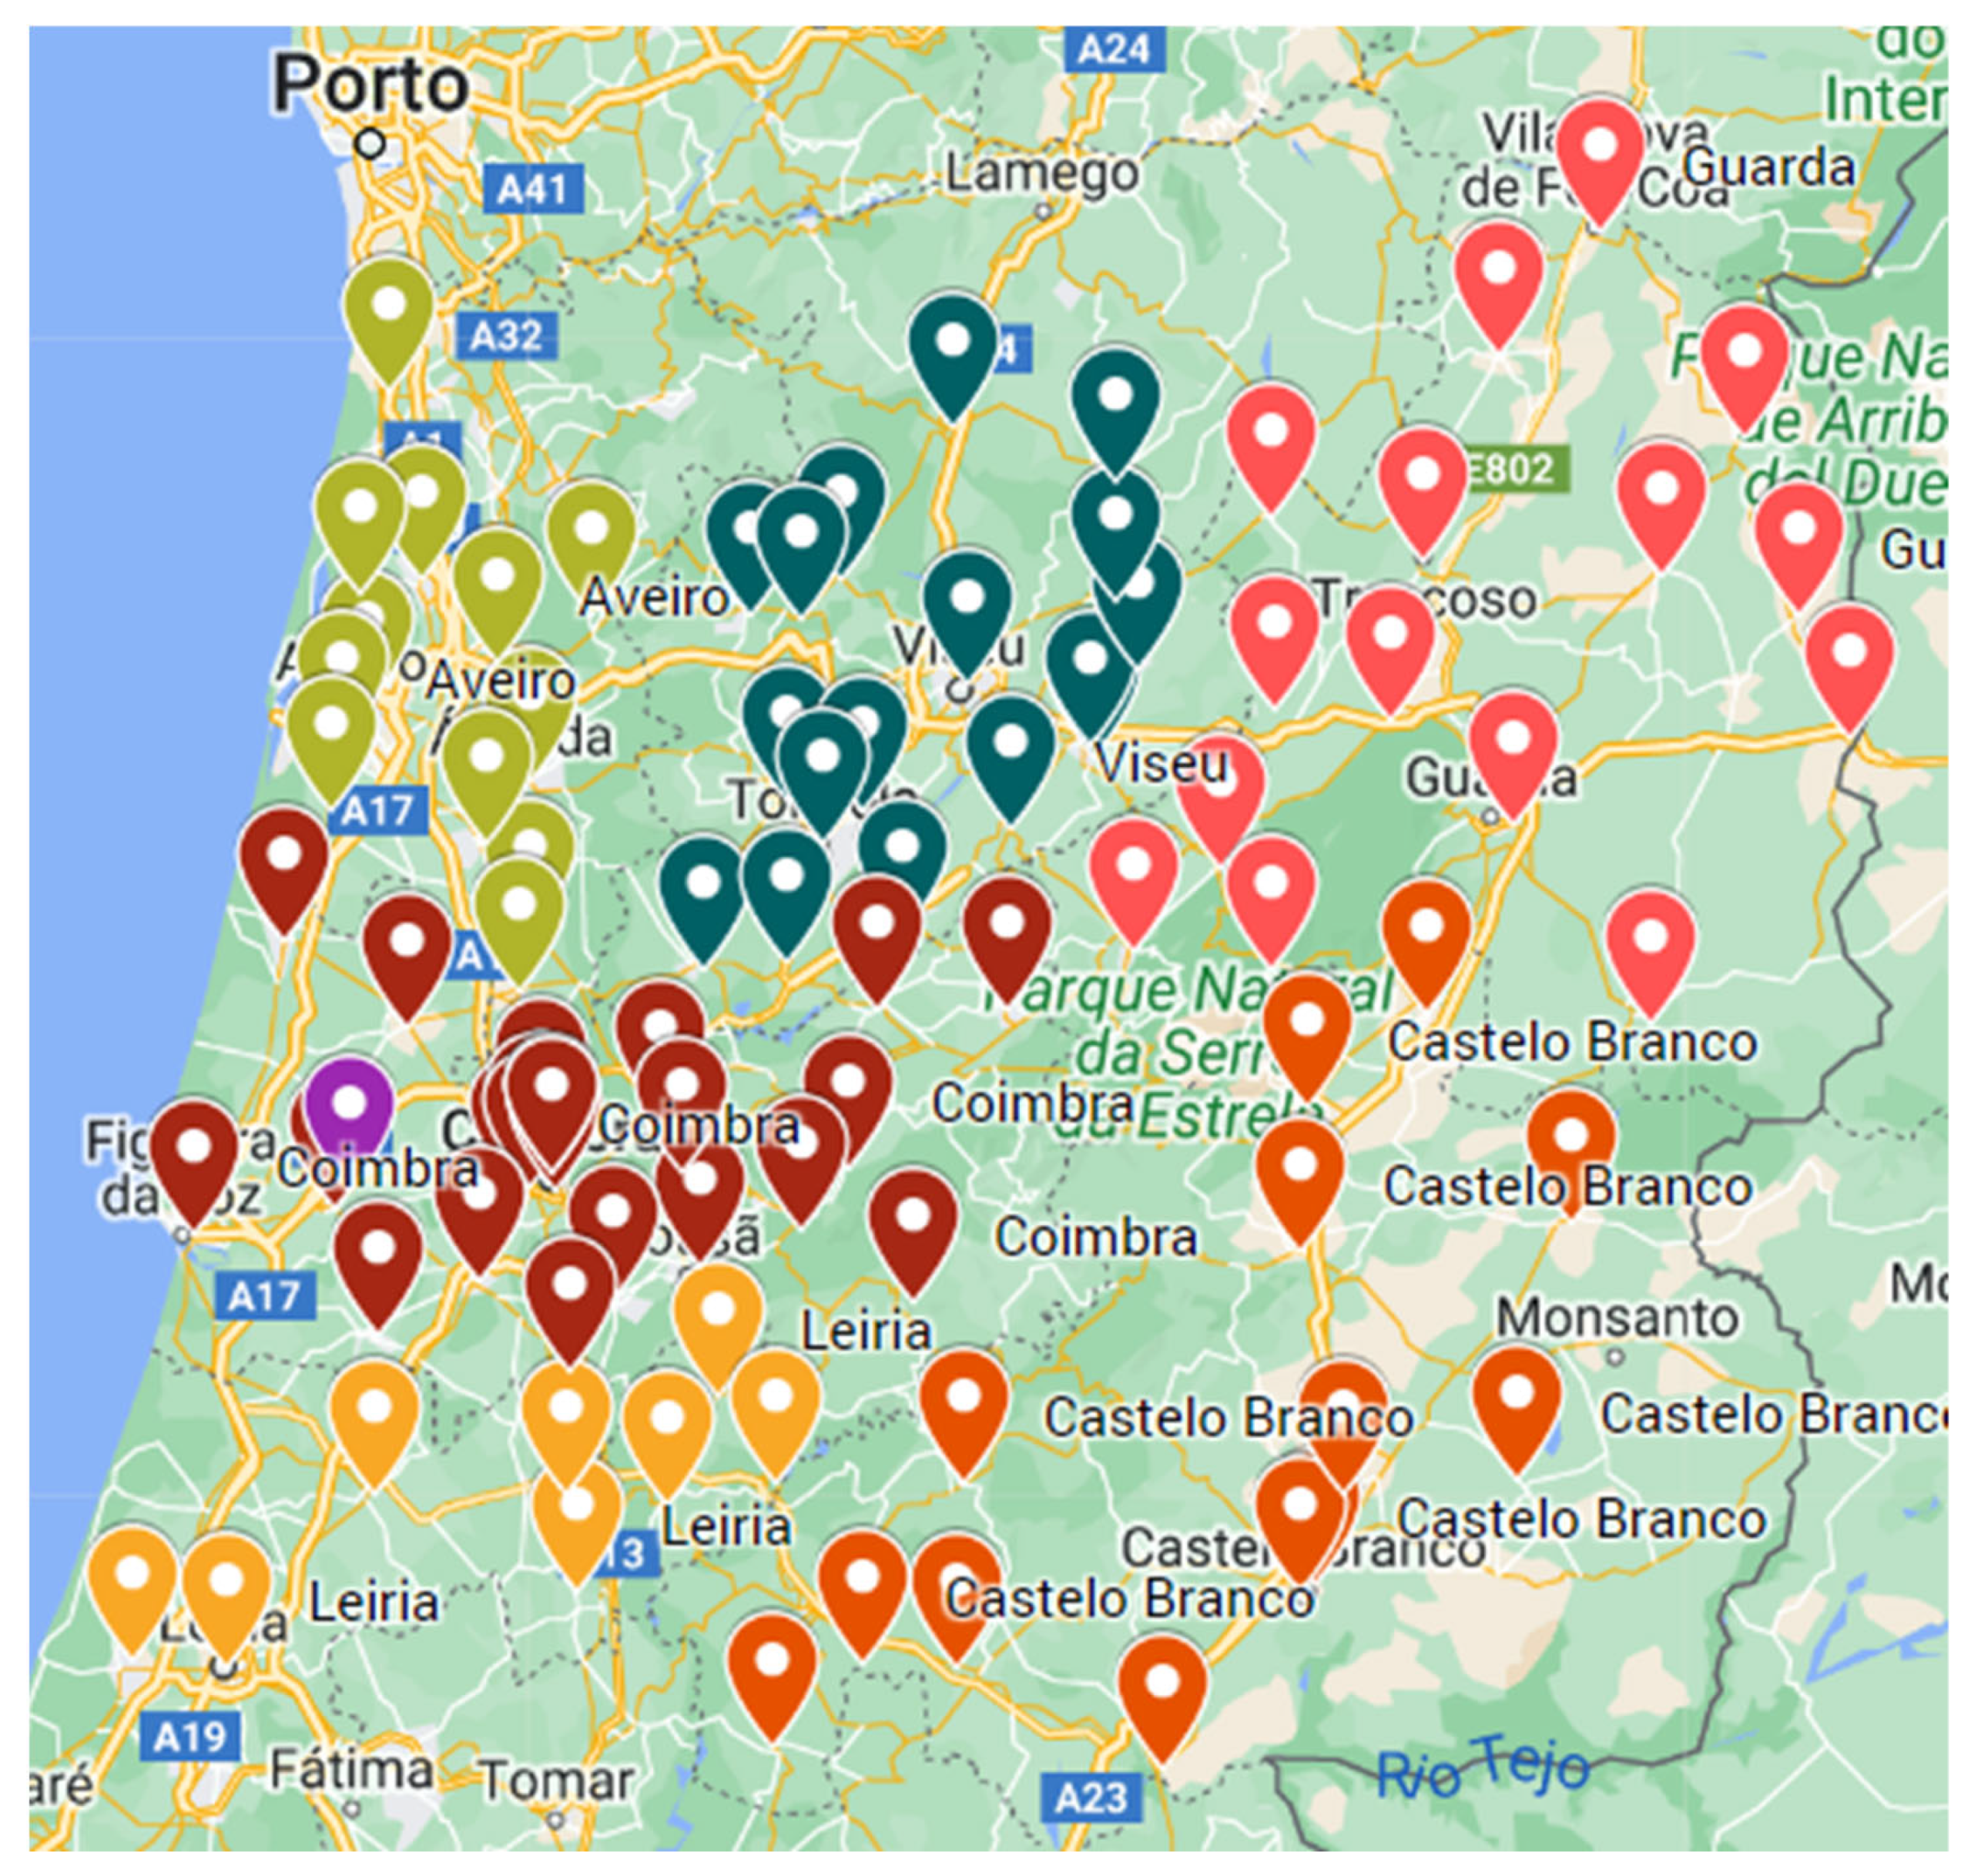
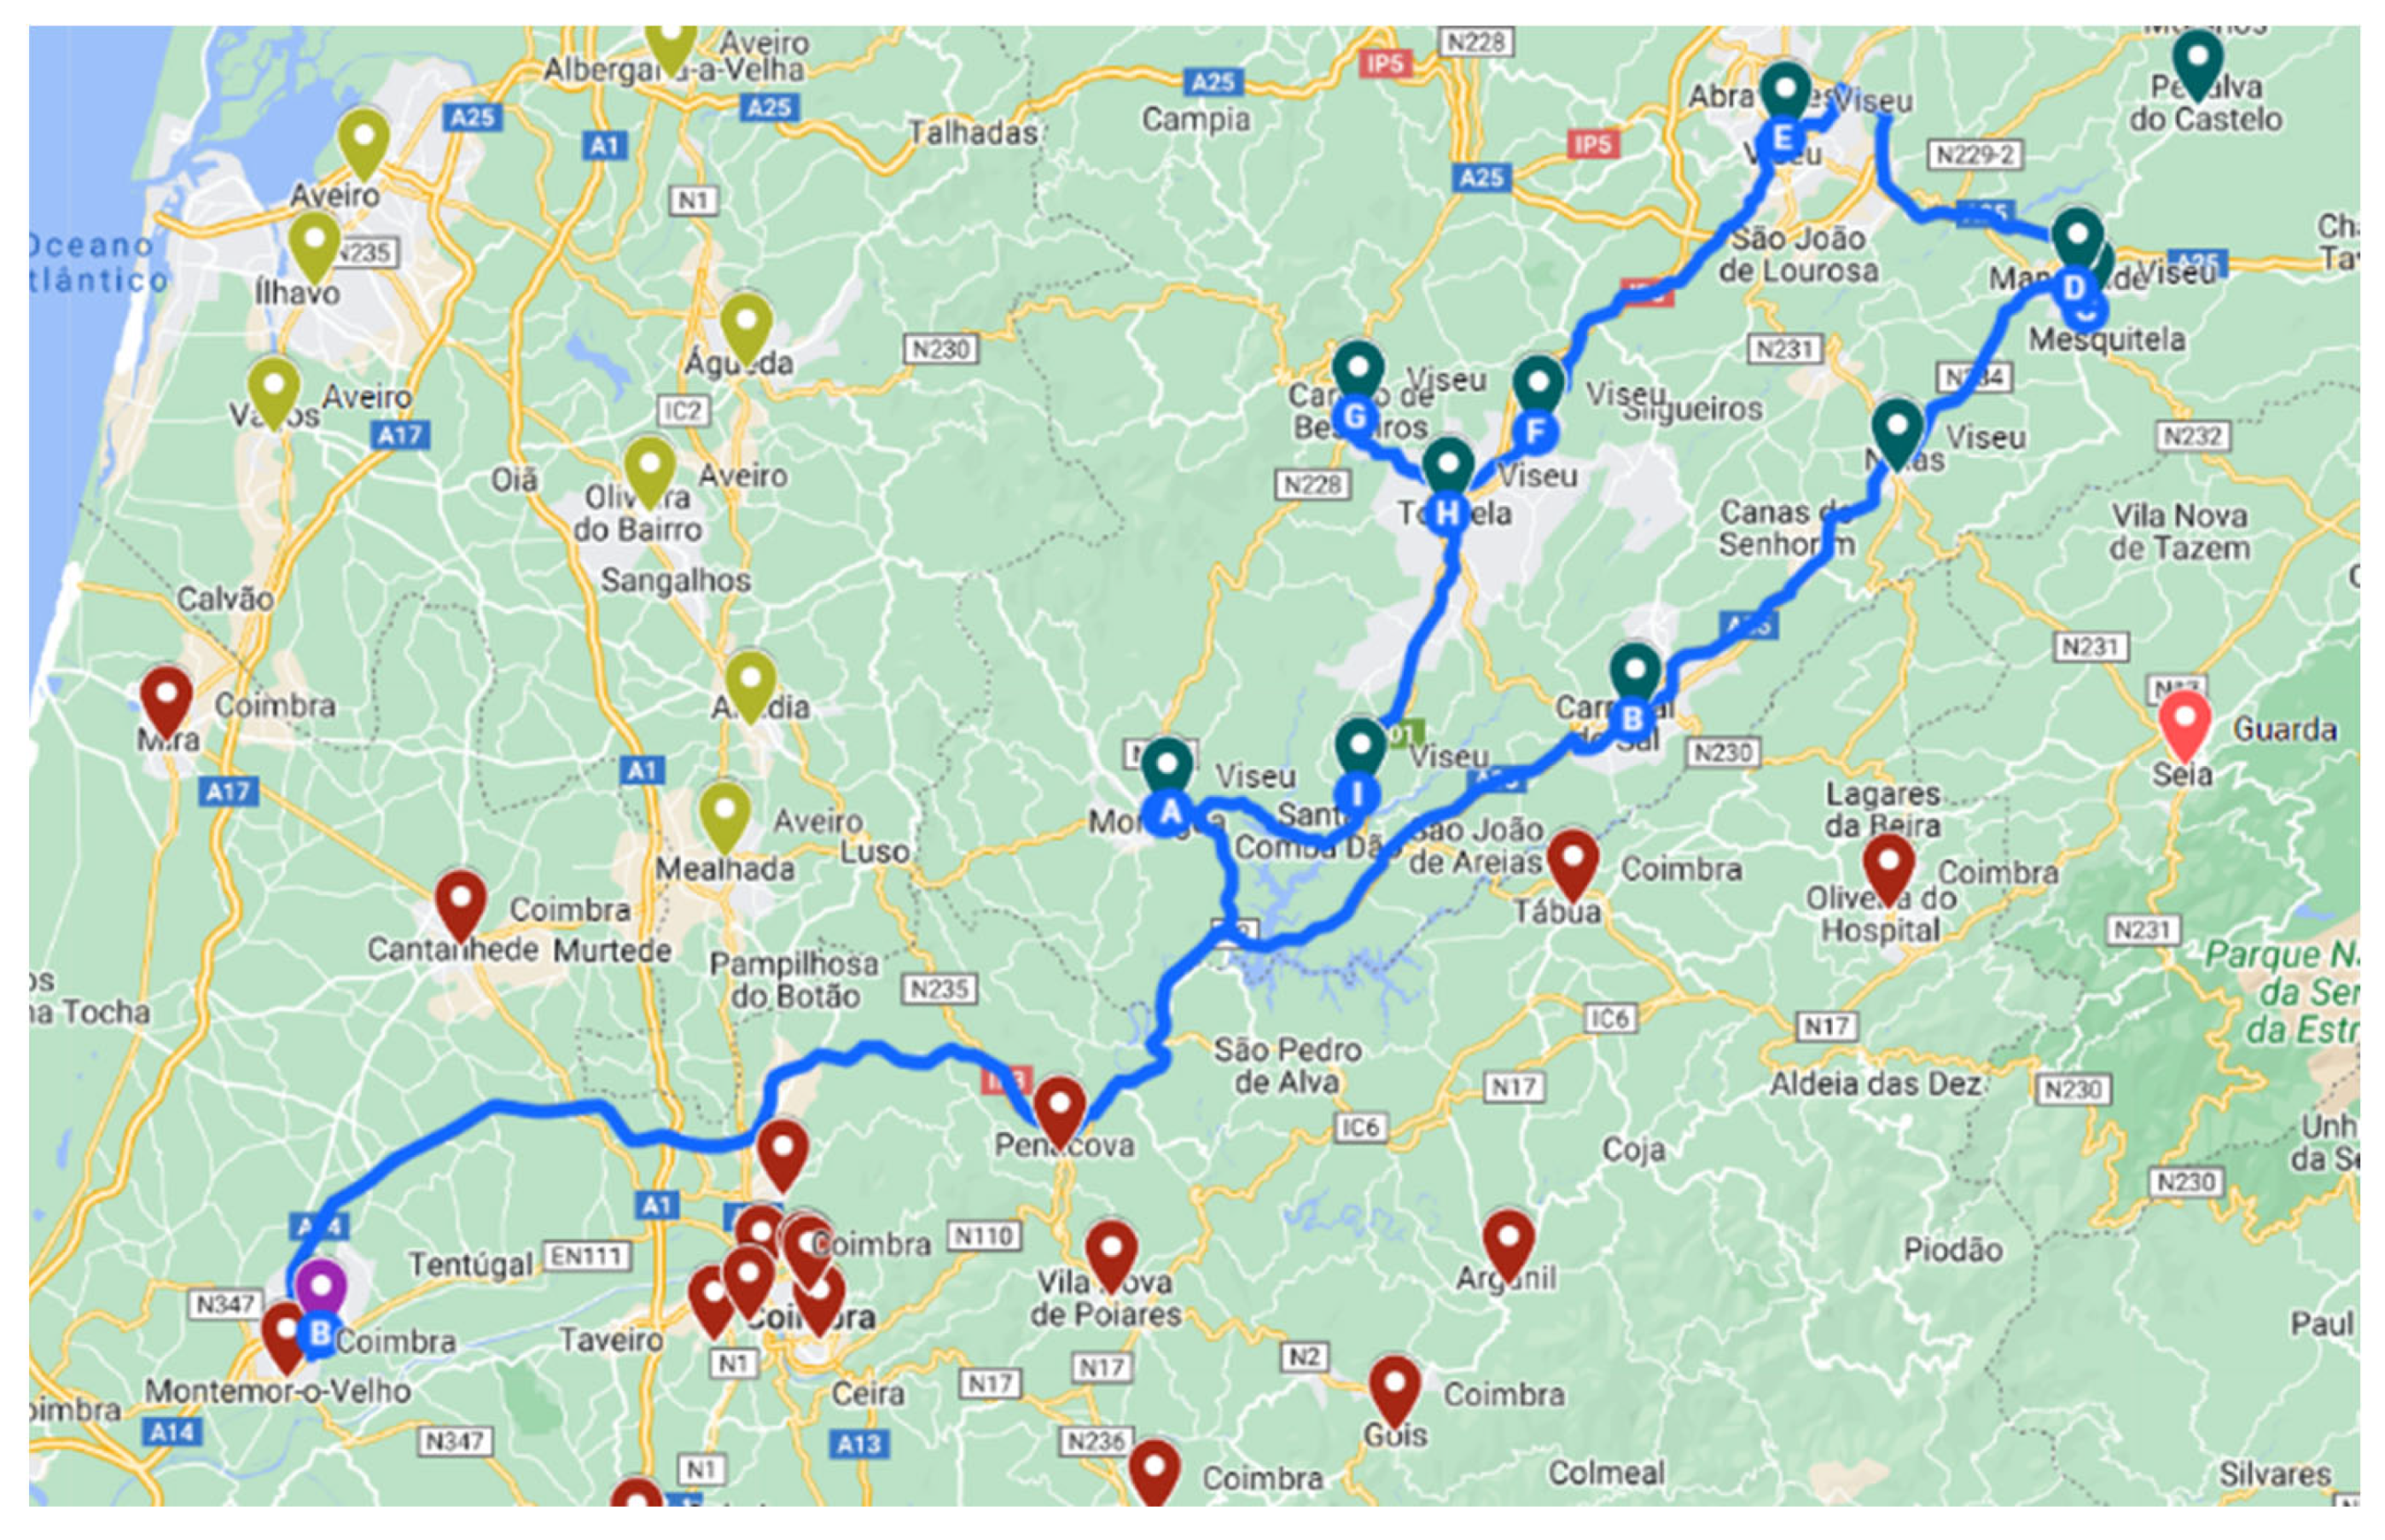
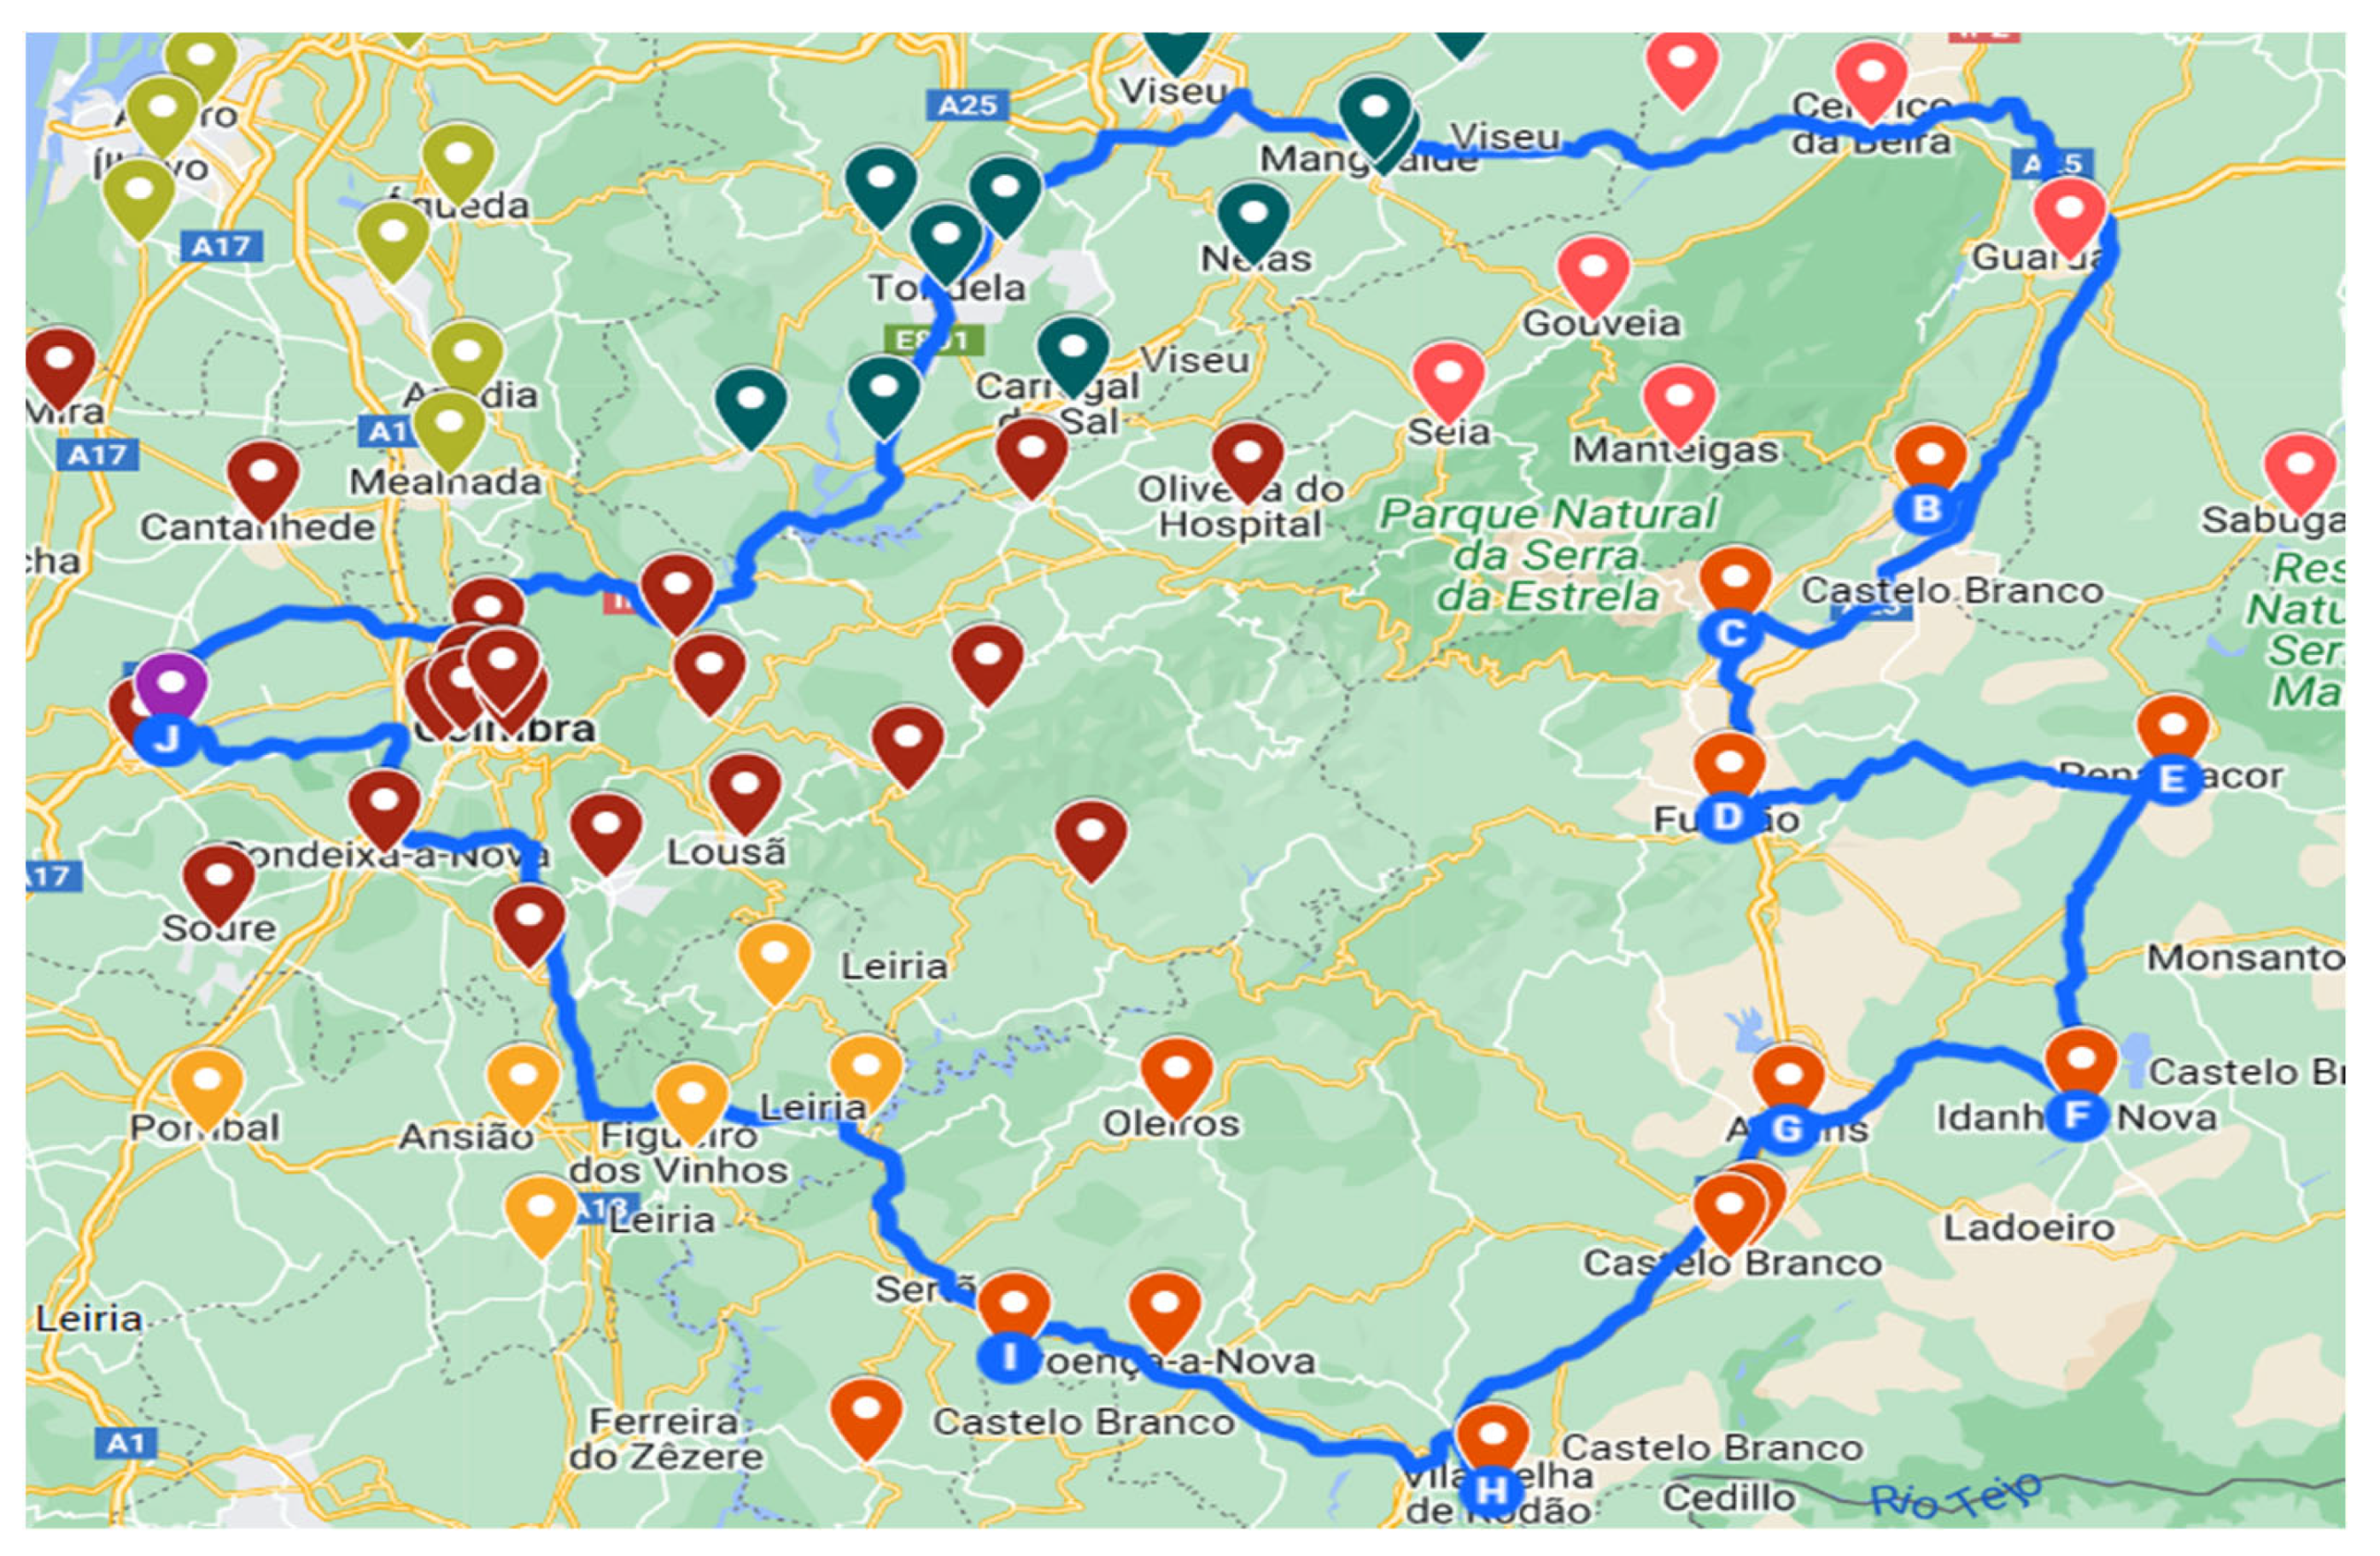
The analysis consists of using a decision support system that allows for the optimization of the distribution process of the COVID-19 vaccine in Central Portugal. Research demonstrated that there are 89 vaccination centers to consider, and their locations are in
Figure 1. This problem requires the use of a decision support method to optimize routes between the vaccination distribution center and the vaccination centers.
This study began with collecting data about the vaccination process in the Central Zone of Portugal. General Health Directorate (DGS) has identified 89 vaccination centers in this area, and their addresses were added to «My Maps» as pins.
2.3. Transportation Conditions
The Comirnaty (Pfizer) vaccine, a concentrated vaccine solution, has an expiration date of 9 months, in which the temperature can vary between −90 °C and −60 °C. The transportation temperature can oscillate between −15 °C and 25 °C for two weeks and then be put back in the aforementioned time window. After the vaccine is unfrozen, it can be stored and transported for a month between 2 °C and 8 °C for 12 h [
23]. Before the dilution, the vaccine can be stored for 2 h at 30 °C. After the dilution, the vaccine must maintain a temperature of 2 °C to 30 °C and be used within 6 h [
24]. In short, refrigerated vaccines are transported with an imposition time of 12 h (720 min) for transport, considering that the characteristics of the vaccines are maintained only during this period.
2.4. Capacity
In this case, the vaccines are transported by refrigeration vans. The maximum capacity of vaccines that each vehicle can transport must be determined, respecting the dimension and maximum weight capacity of the vehicles. Large boxes are placed in the van, in which there are five smaller boxes containing 195 vials of the Pfizer vaccine [
1].
Assuming the dimensions of the Pfizer vaccine distribution boxes, euro pallet dimensions (where vaccines for transport are stored), and standard dimensions of transport vehicles, it is possible to perform the calculations to determine the vehicle capacity in terms of the vaccines.
Two options were considered: placing the length of the box along the length of the euro pallets, or placing the length of the box along the width of the euro pallet. To calculate the number of euro pallets that each vehicle can transport, two options were also considered: the length of the euro pallets along the vehicle’s length and the length of the euro pallets along the vehicle’s width.
The conclusion is that the optimal solution is to use 4-euro pallets, each one with 8 boxes of vaccines, so that each vehicle has a maximum capacity of 32 boxes, or 31,200 vials. This is possible to achieve since each box takes 5 layers of 195 vials, which means each box holds 975 vials. Thus, the refrigeration van’s capacity is 31,200 vials. The calculations to determine the maximum weight that a vehicle can support are performed by defining the van’s payload as approximately 1500 kg, the euro pallet weight as approximately 25 kg, and the weight of each box of vaccines as approximately 36.5 kg. Therefore, the maximum weight limit that the vehicle can carry will not be exceeded when transporting 31,200 vials [
1].
2.5. Determination of the Demand for Vaccines by Each Center
The number of active COVID-19 cases per 100,000 inhabitants on 28 January 2022 was collected and transformed into a percentage to determine the number of vaccines required for transport to each vaccination center. The number of infected people in each municipality was calculated based on that value and the number of residents.
The number of people who needed to be to vaccinate against COVID-19 on 28 June 2022 was estimated from the number of infected people on 28 January 2022 [
25].
From these calculations, it was possible to estimate the number of vaccines that needed to be transported to each vaccination center. Therefore, the number of vaccines each vehicle must transport to the defined clusters.
2.6. Division into Clusters
Due to a large number of vaccination centers, the Central Zone of Portugal was divided into clusters, with each cluster corresponding to a particular district. The division of districts into clusters was determined by a survey collected by municipal authorities which looked at vaccine demand.
The six clusters can be seen in
Figure 1 (created on “My Maps”, coloring the pins by cluster):
Aveiro cluster (centers in green);
Coimbra cluster (centers in red);
Guarda cluster (centers in pink);
Castelo Branco cluster (centers in orange);
Leiria cluster (yellow centers); and
Viseu cluster (blue centers).
2.7. Variables
All necessary variables and constraints were considered to solve this study’s problem. The variables considered were the time between vaccination centers and the national vaccine distribution center, demand in each vaccination center, the depot center (distribution center in Montemor-o-Velho), the set of clients that are at the depot (the vaccination centers), the set of origins and set of clients (initial and final location), the set of customers served by vehicles, the distance between the points of the customers, the demand of each center, number of vehicles, and the total distance run by vehicles.
The most limiting conditions considered were vehicle capacity and the vaccine storage conditions, which determined the maximum time the vaccines could be transported. In addition, it was necessary to consider the time allowed by law for professional drivers.
6. Discussion
Vaccines are vital to guarantee the safety and health of people everywhere. Sometimes, they are crucial and life-changing if taken at the right moment. In addition, vaccines are extremely fragile, and they have a short life span. Additionally, one lost vaccine means a big loss of money. This study proposes a way to deliver the vaccines to their destinations in the quickest and most efficient manner. For this purpose, this study uses a generic VRPTW mathematical formulation and considers several constraints which limit the problem at hand.
An algorithm was developed and run in Python 3.10.4 to solve this paper’s problem and two different scenarios were tested. One considers normal working hours and another uses overtime. It should be noted that both scenarios respect the validity and integrity of the vaccines. Therefore, the optimal routes were obtained for each scenario, and an analysis of the total costs was performed. The cost of normal working hours and/or overtime are considered (depending on the chosen scenario), as well as the fixed costs that a vehicle has when leaving the warehouse, and costs spent on fuel. The route chosen was the one that is economically more viable and has the lowest CO2 emissions, respecting this order of priority. Simultaneous with the cost calculation, the CO2 emission rate was also calculated.
The output of the code is an indication of the order in which the cluster’s centers must be served, the total number of vials for that route/cluster, the arrival time to each center, and the total time to complete each route. All these outputs are shown in
Table 2,
Table 4,
Table 6,
Table 8,
Table 10 and
Table 12. The total number of vials and the total time to complete each route are obtained through capacity and time restrictions, respectively. The order and time of arrivals is an output which the code was designed to produce. It does not refer to a time window constraint to serve each center. The code scans possible solutions and it provides the number of vehicles necessary for each route. Two scenarios were tested to verify which scenario would provide the lowest cost and lowest CO
2 emissions.
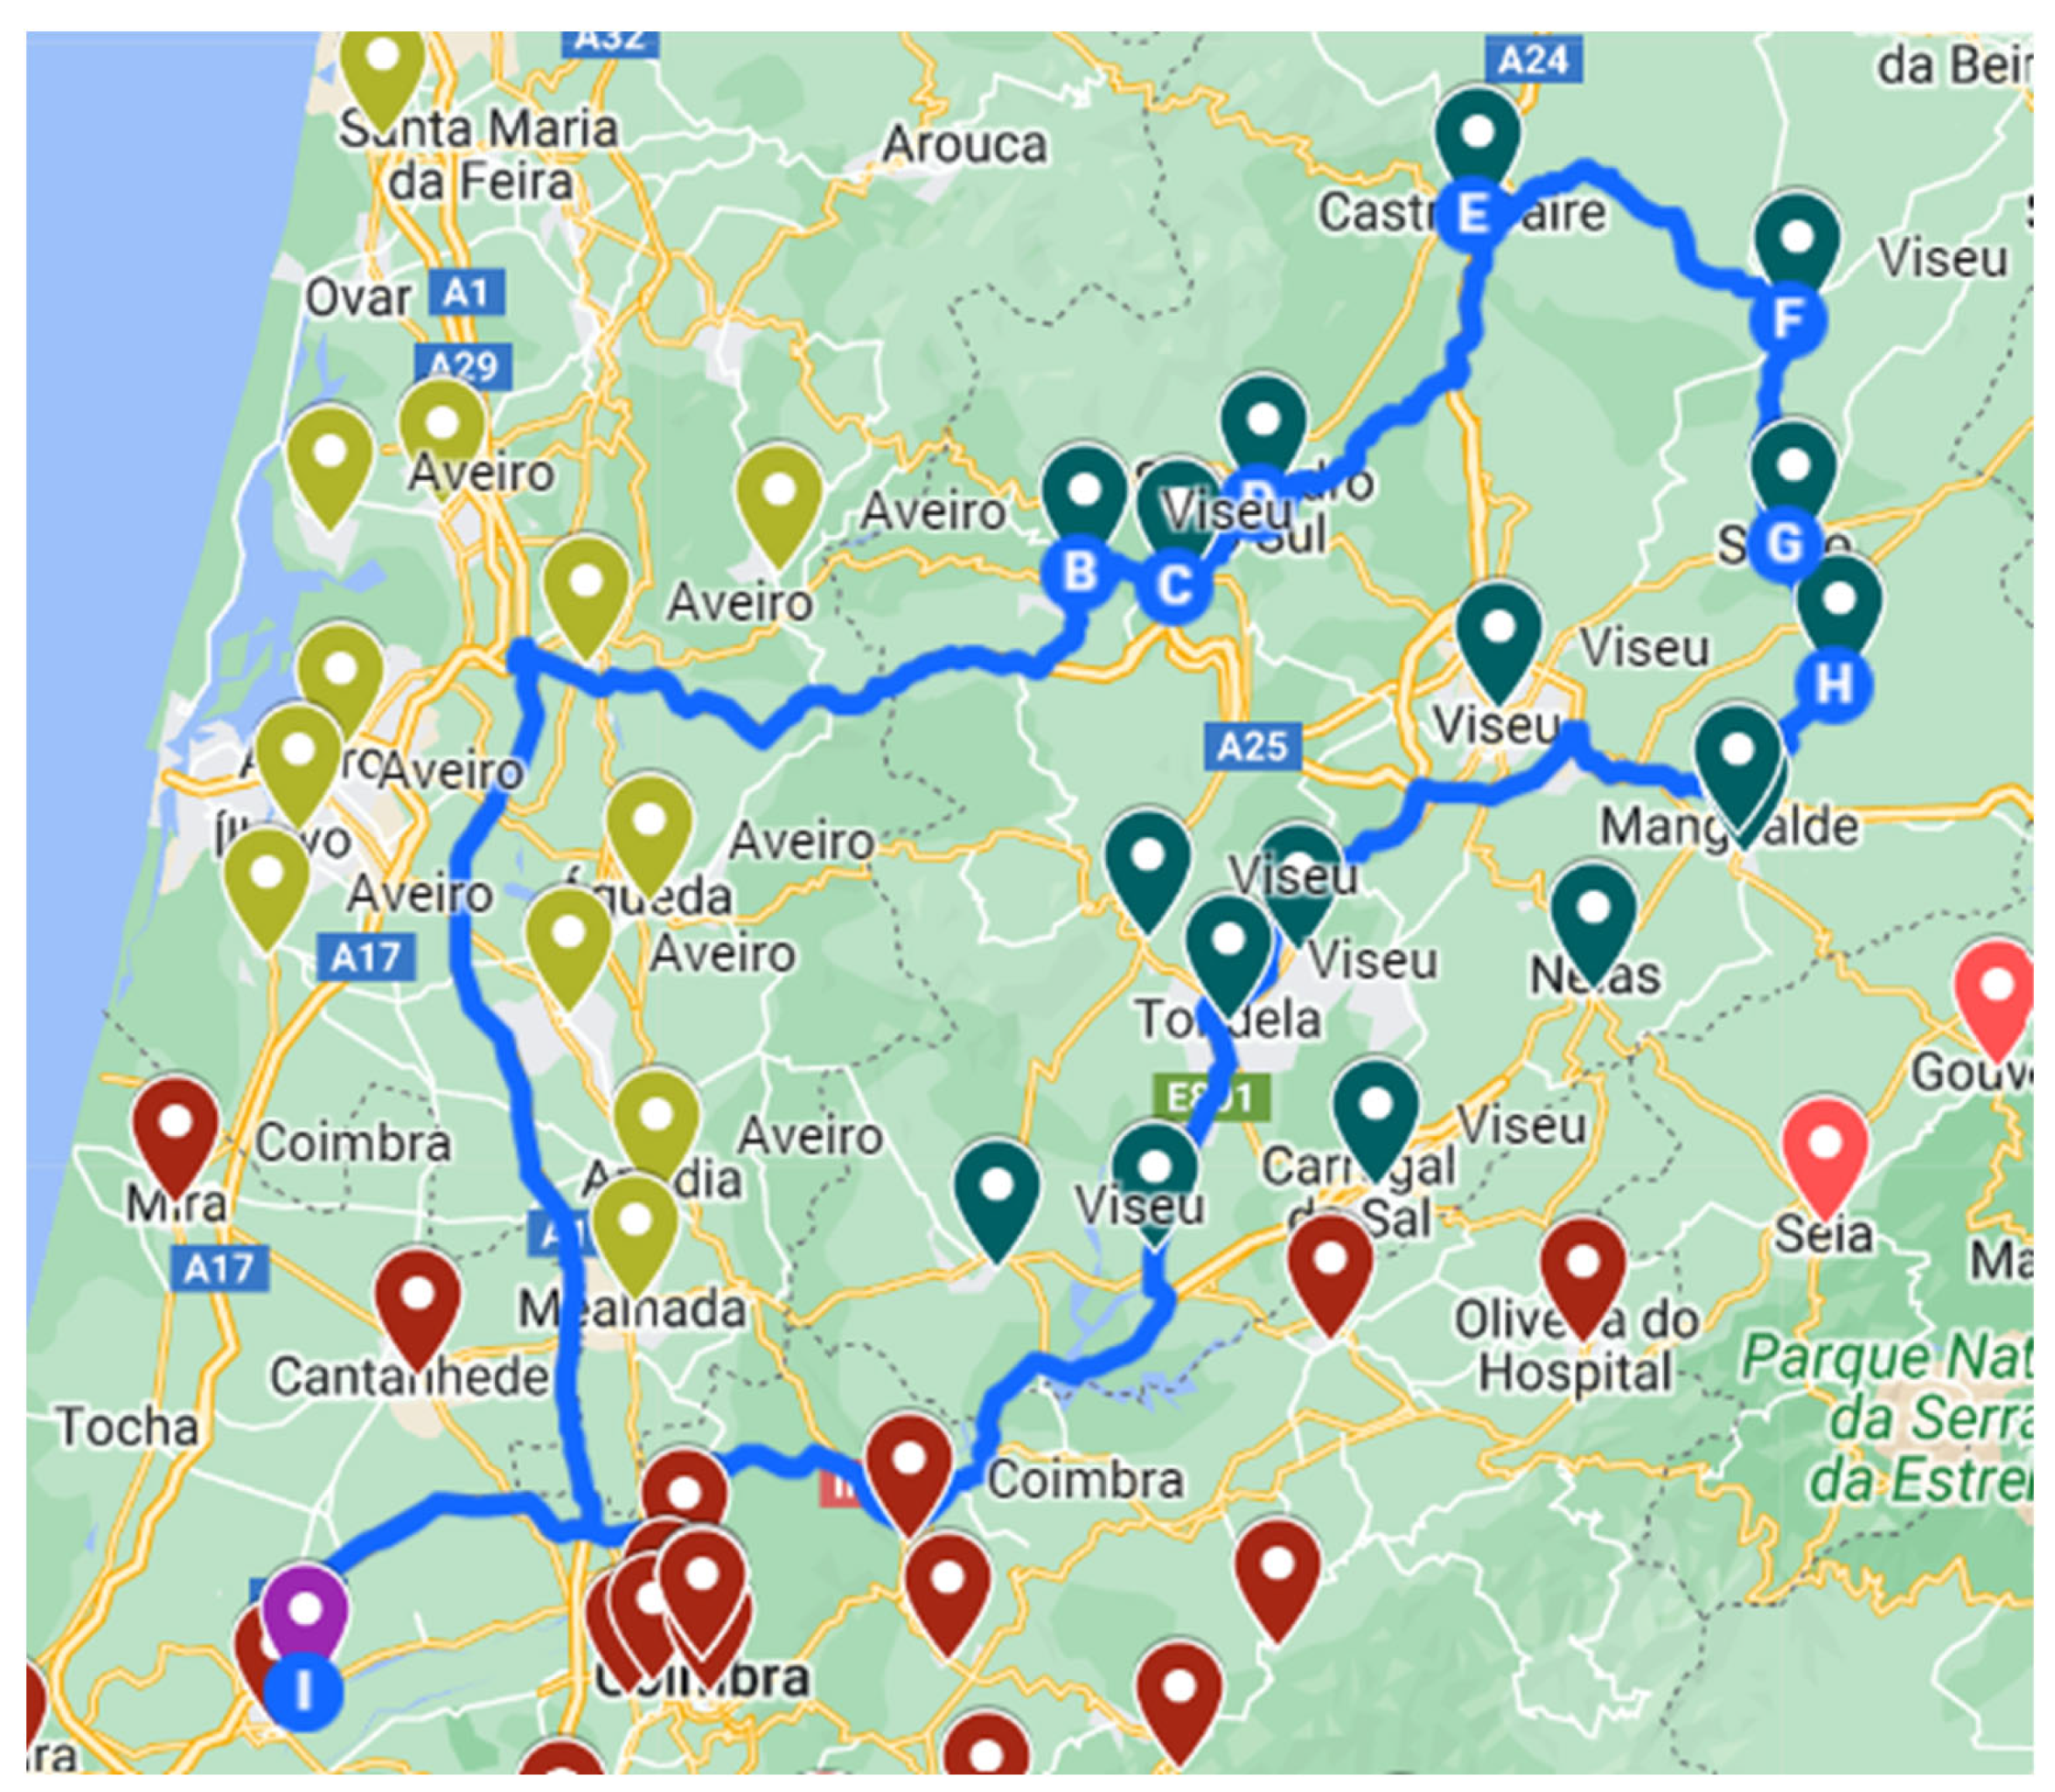
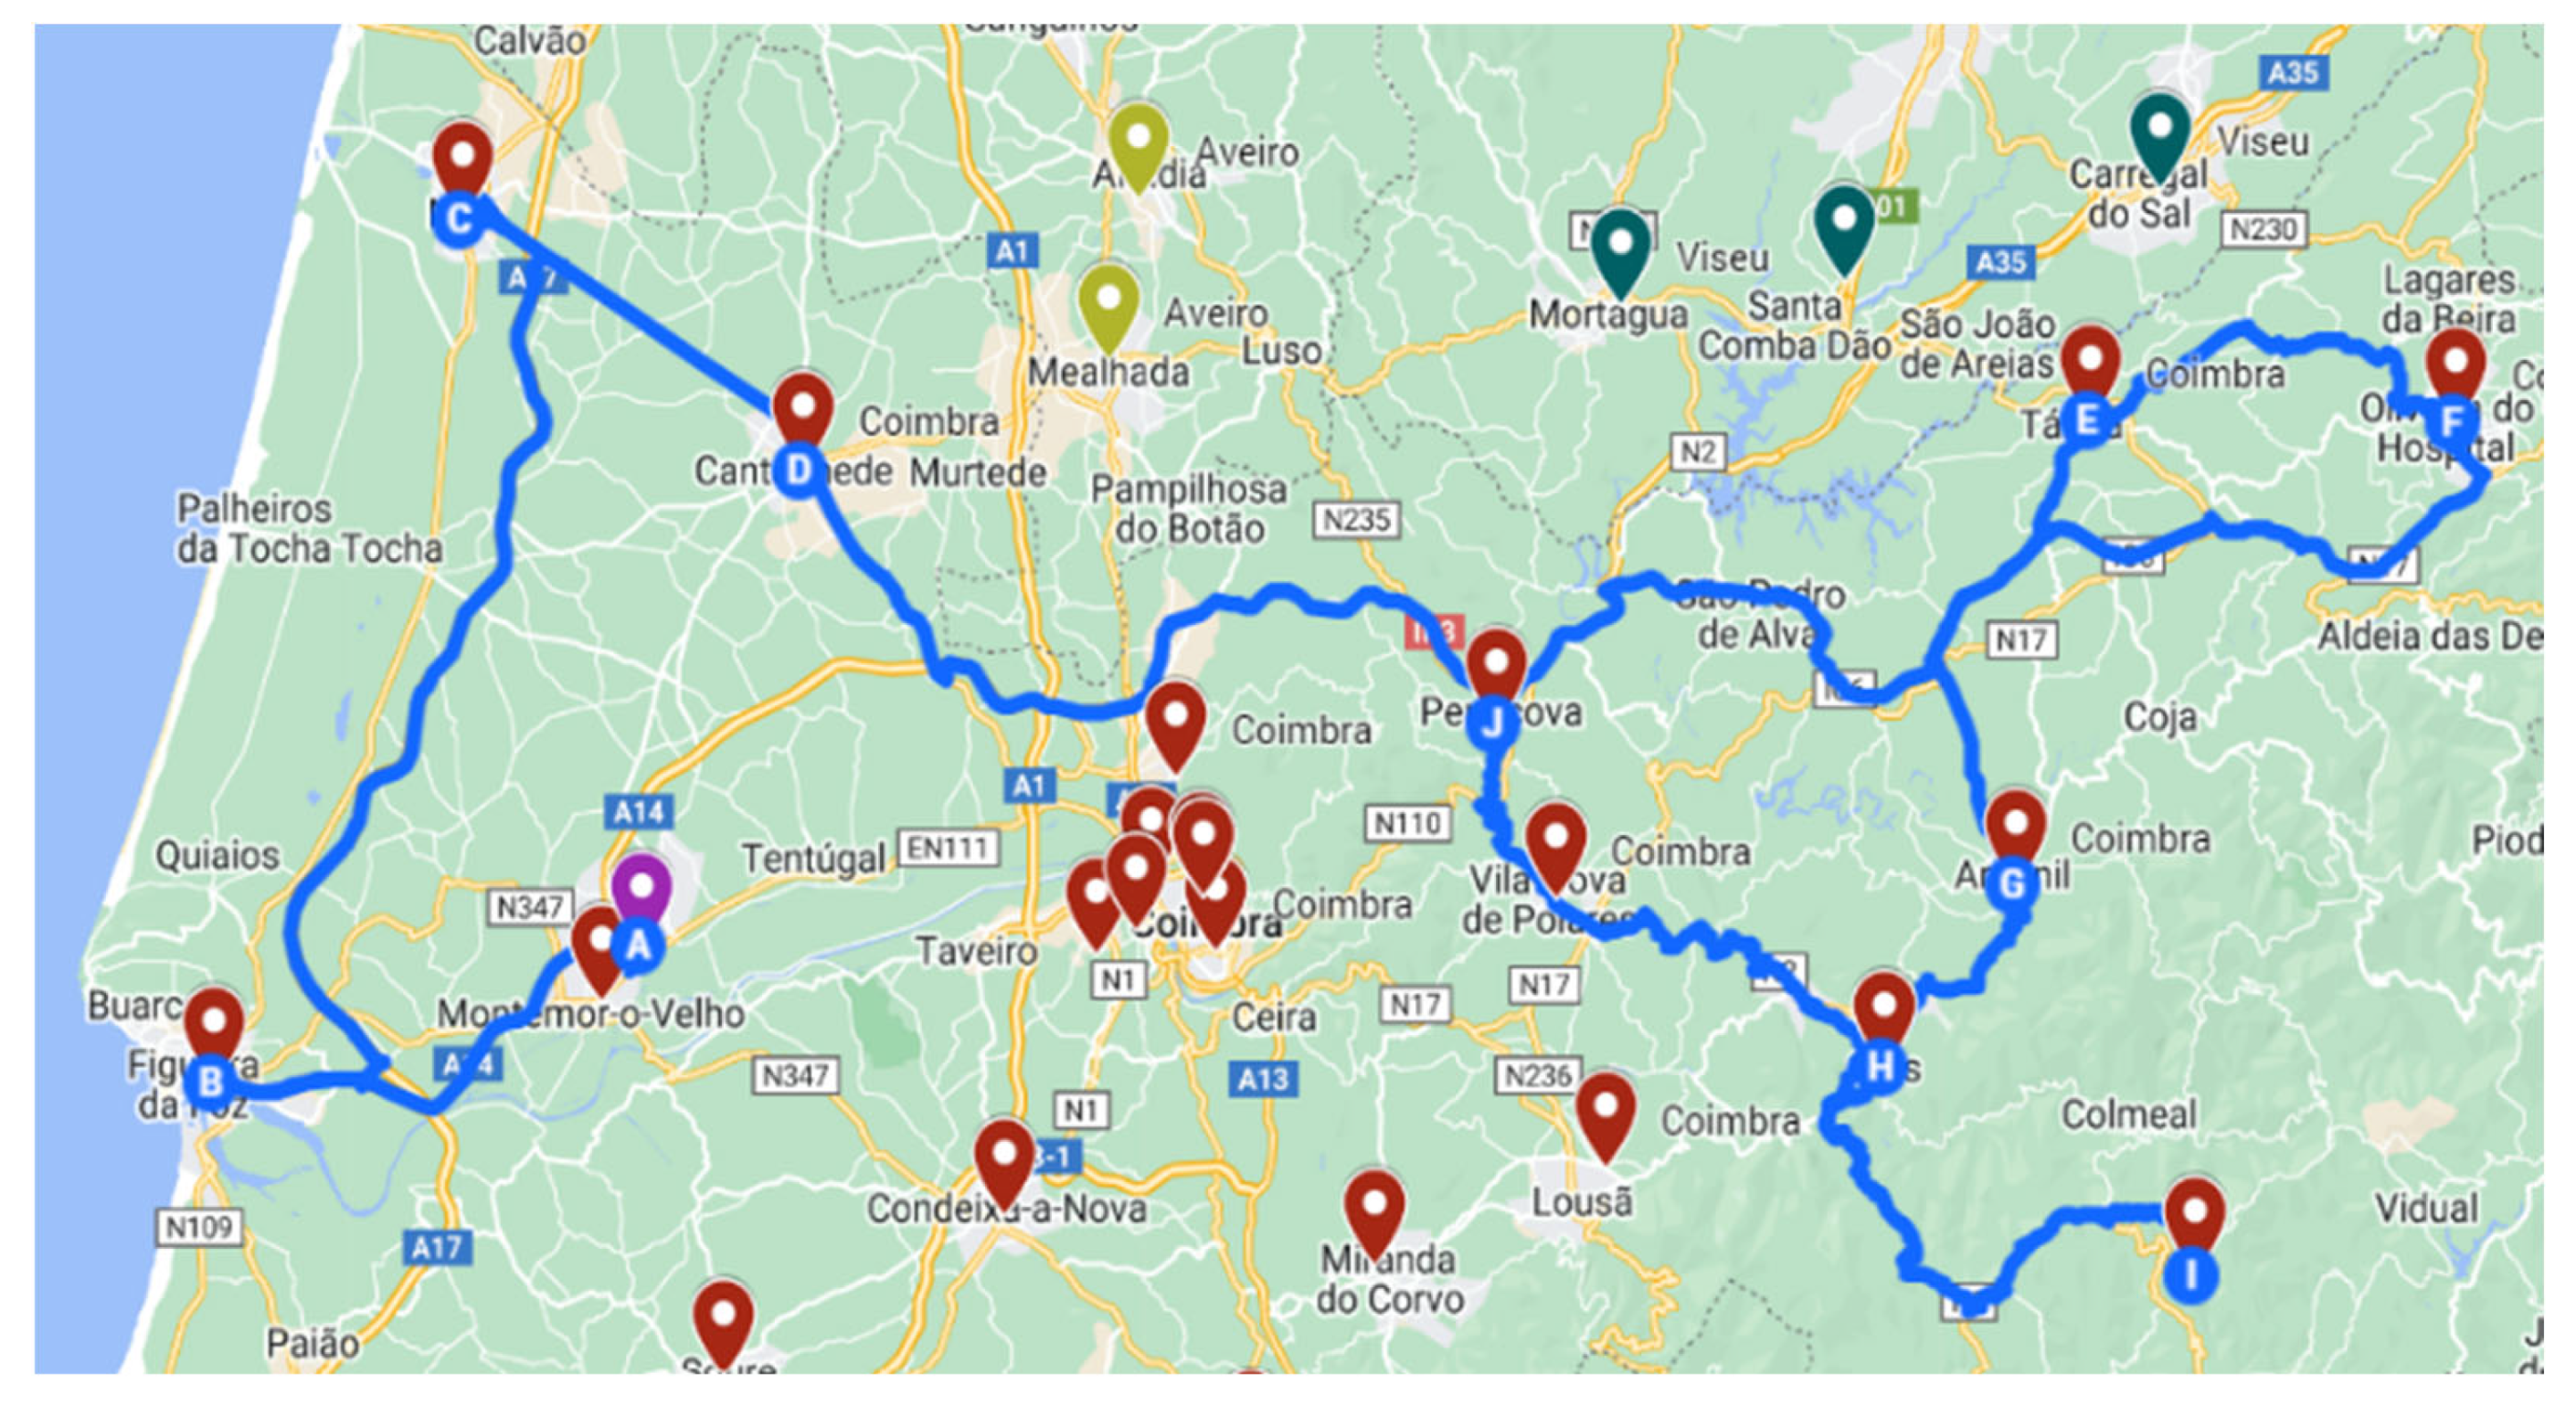
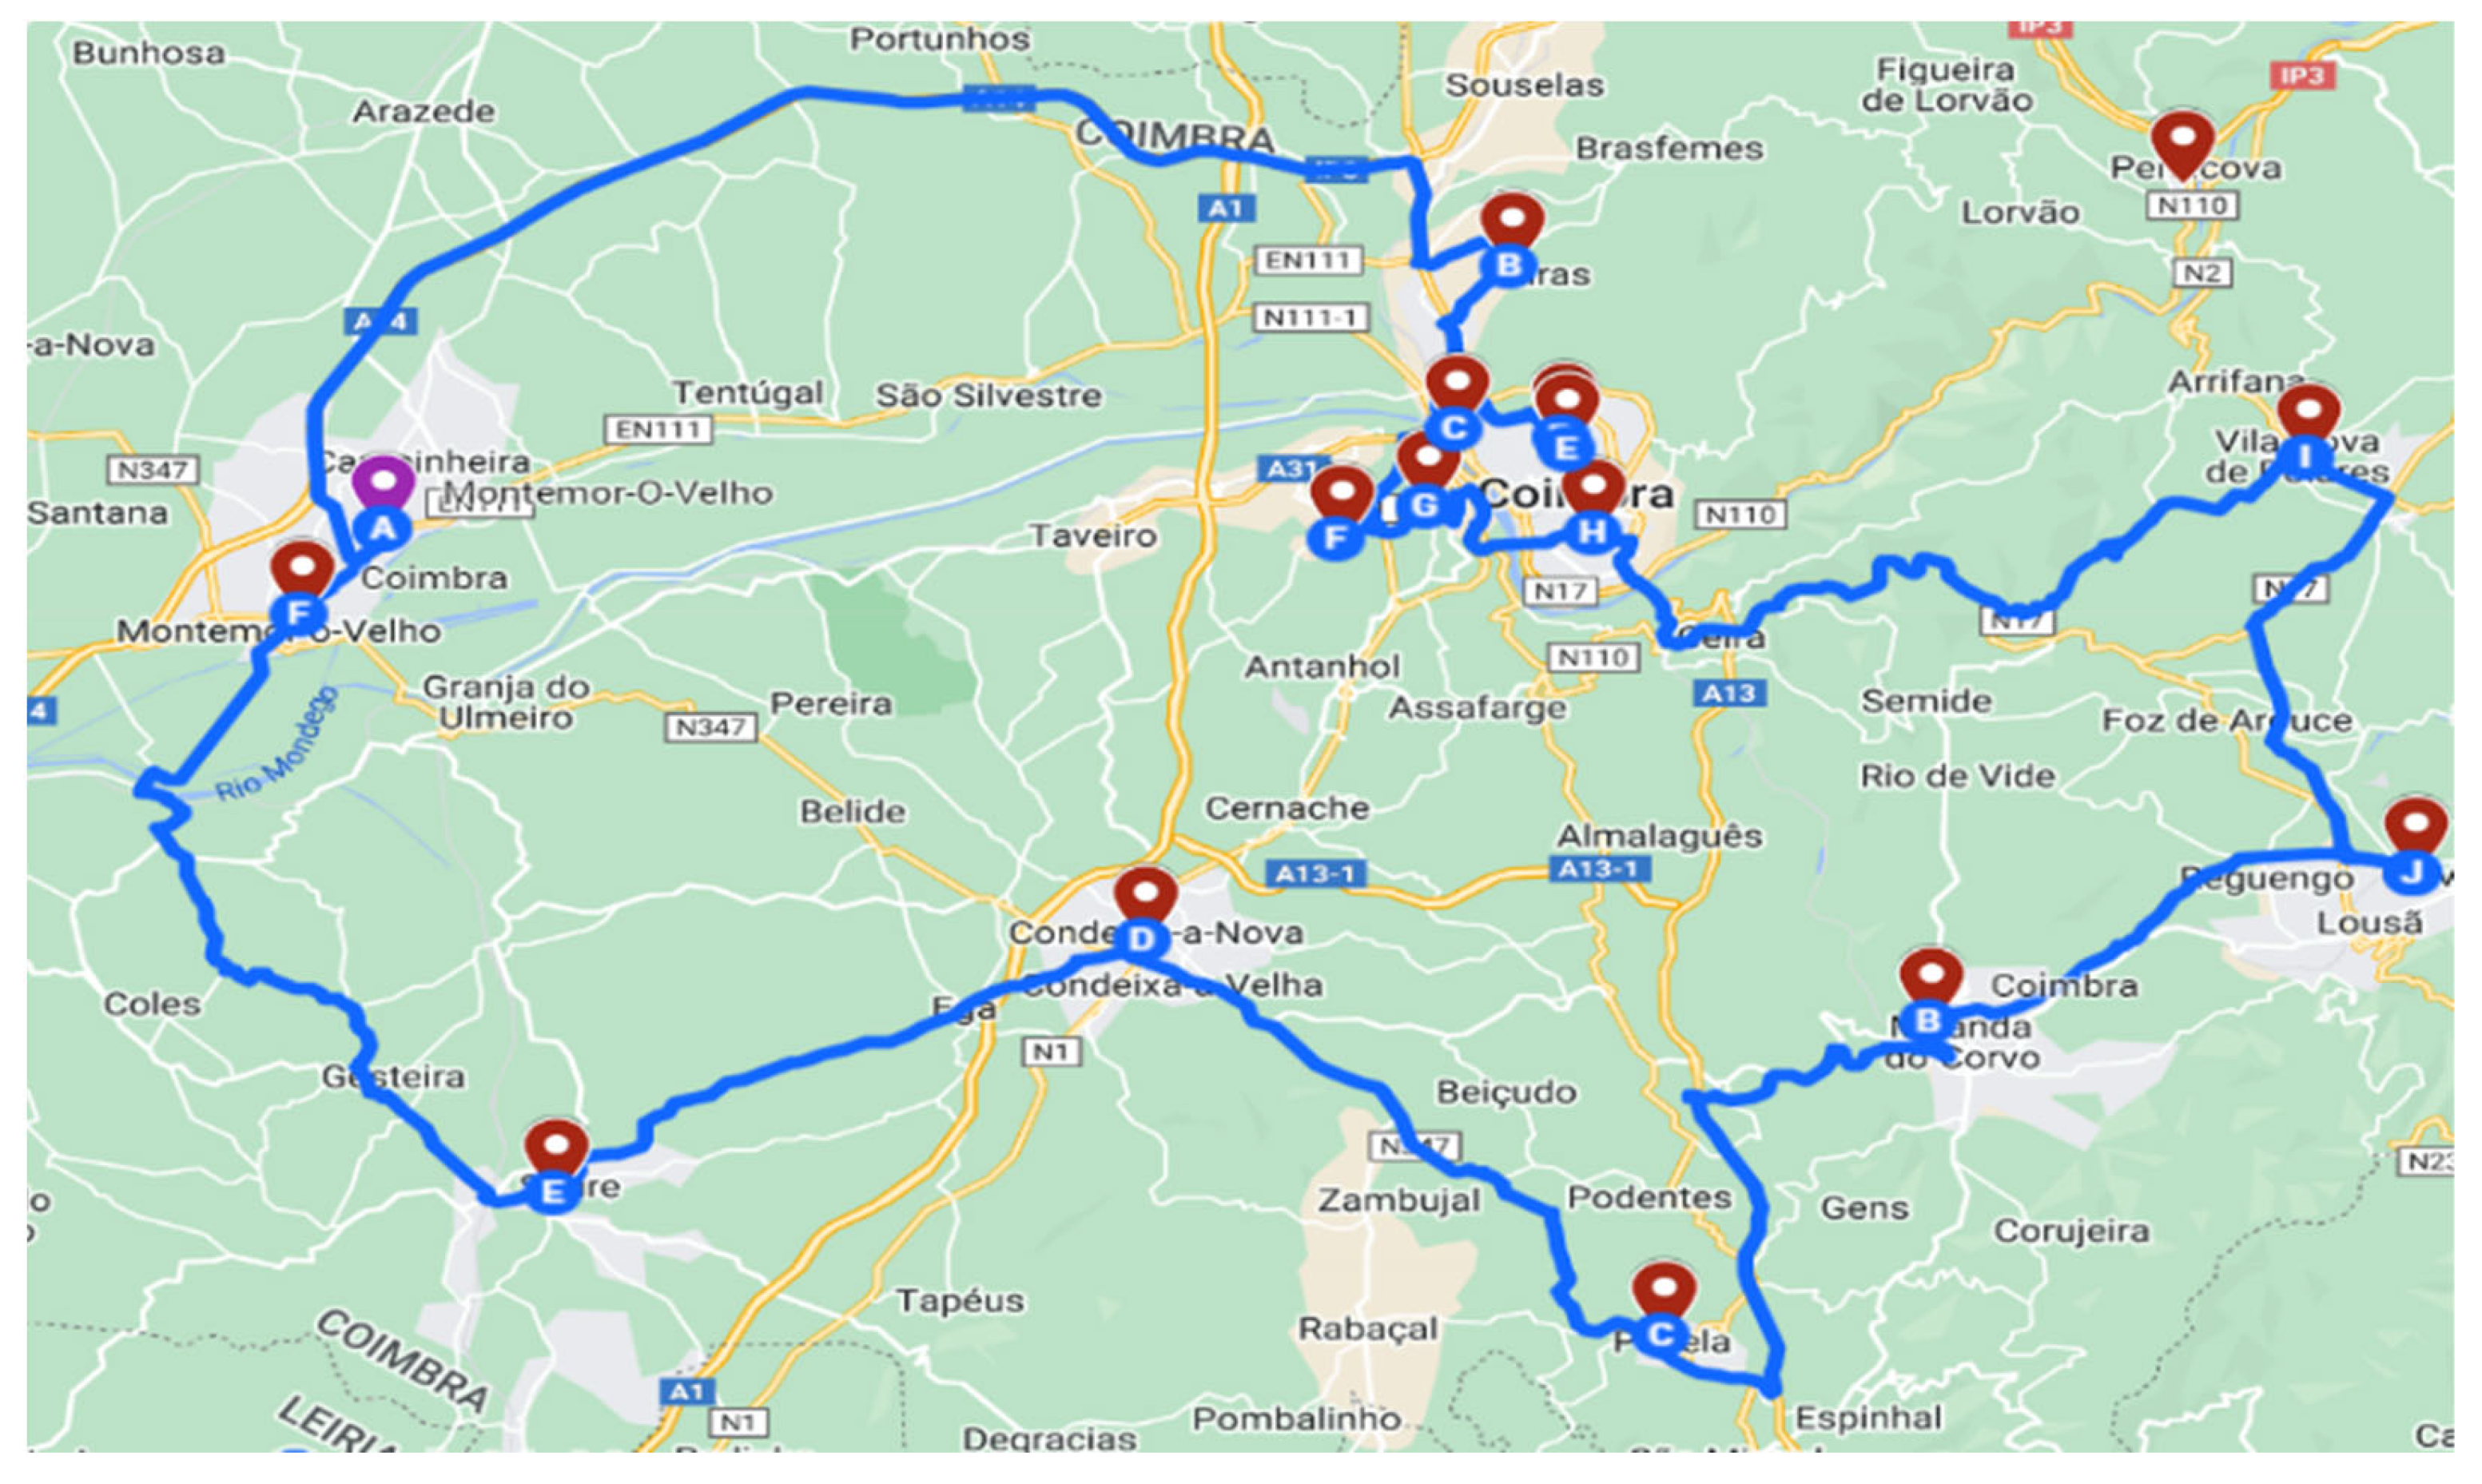
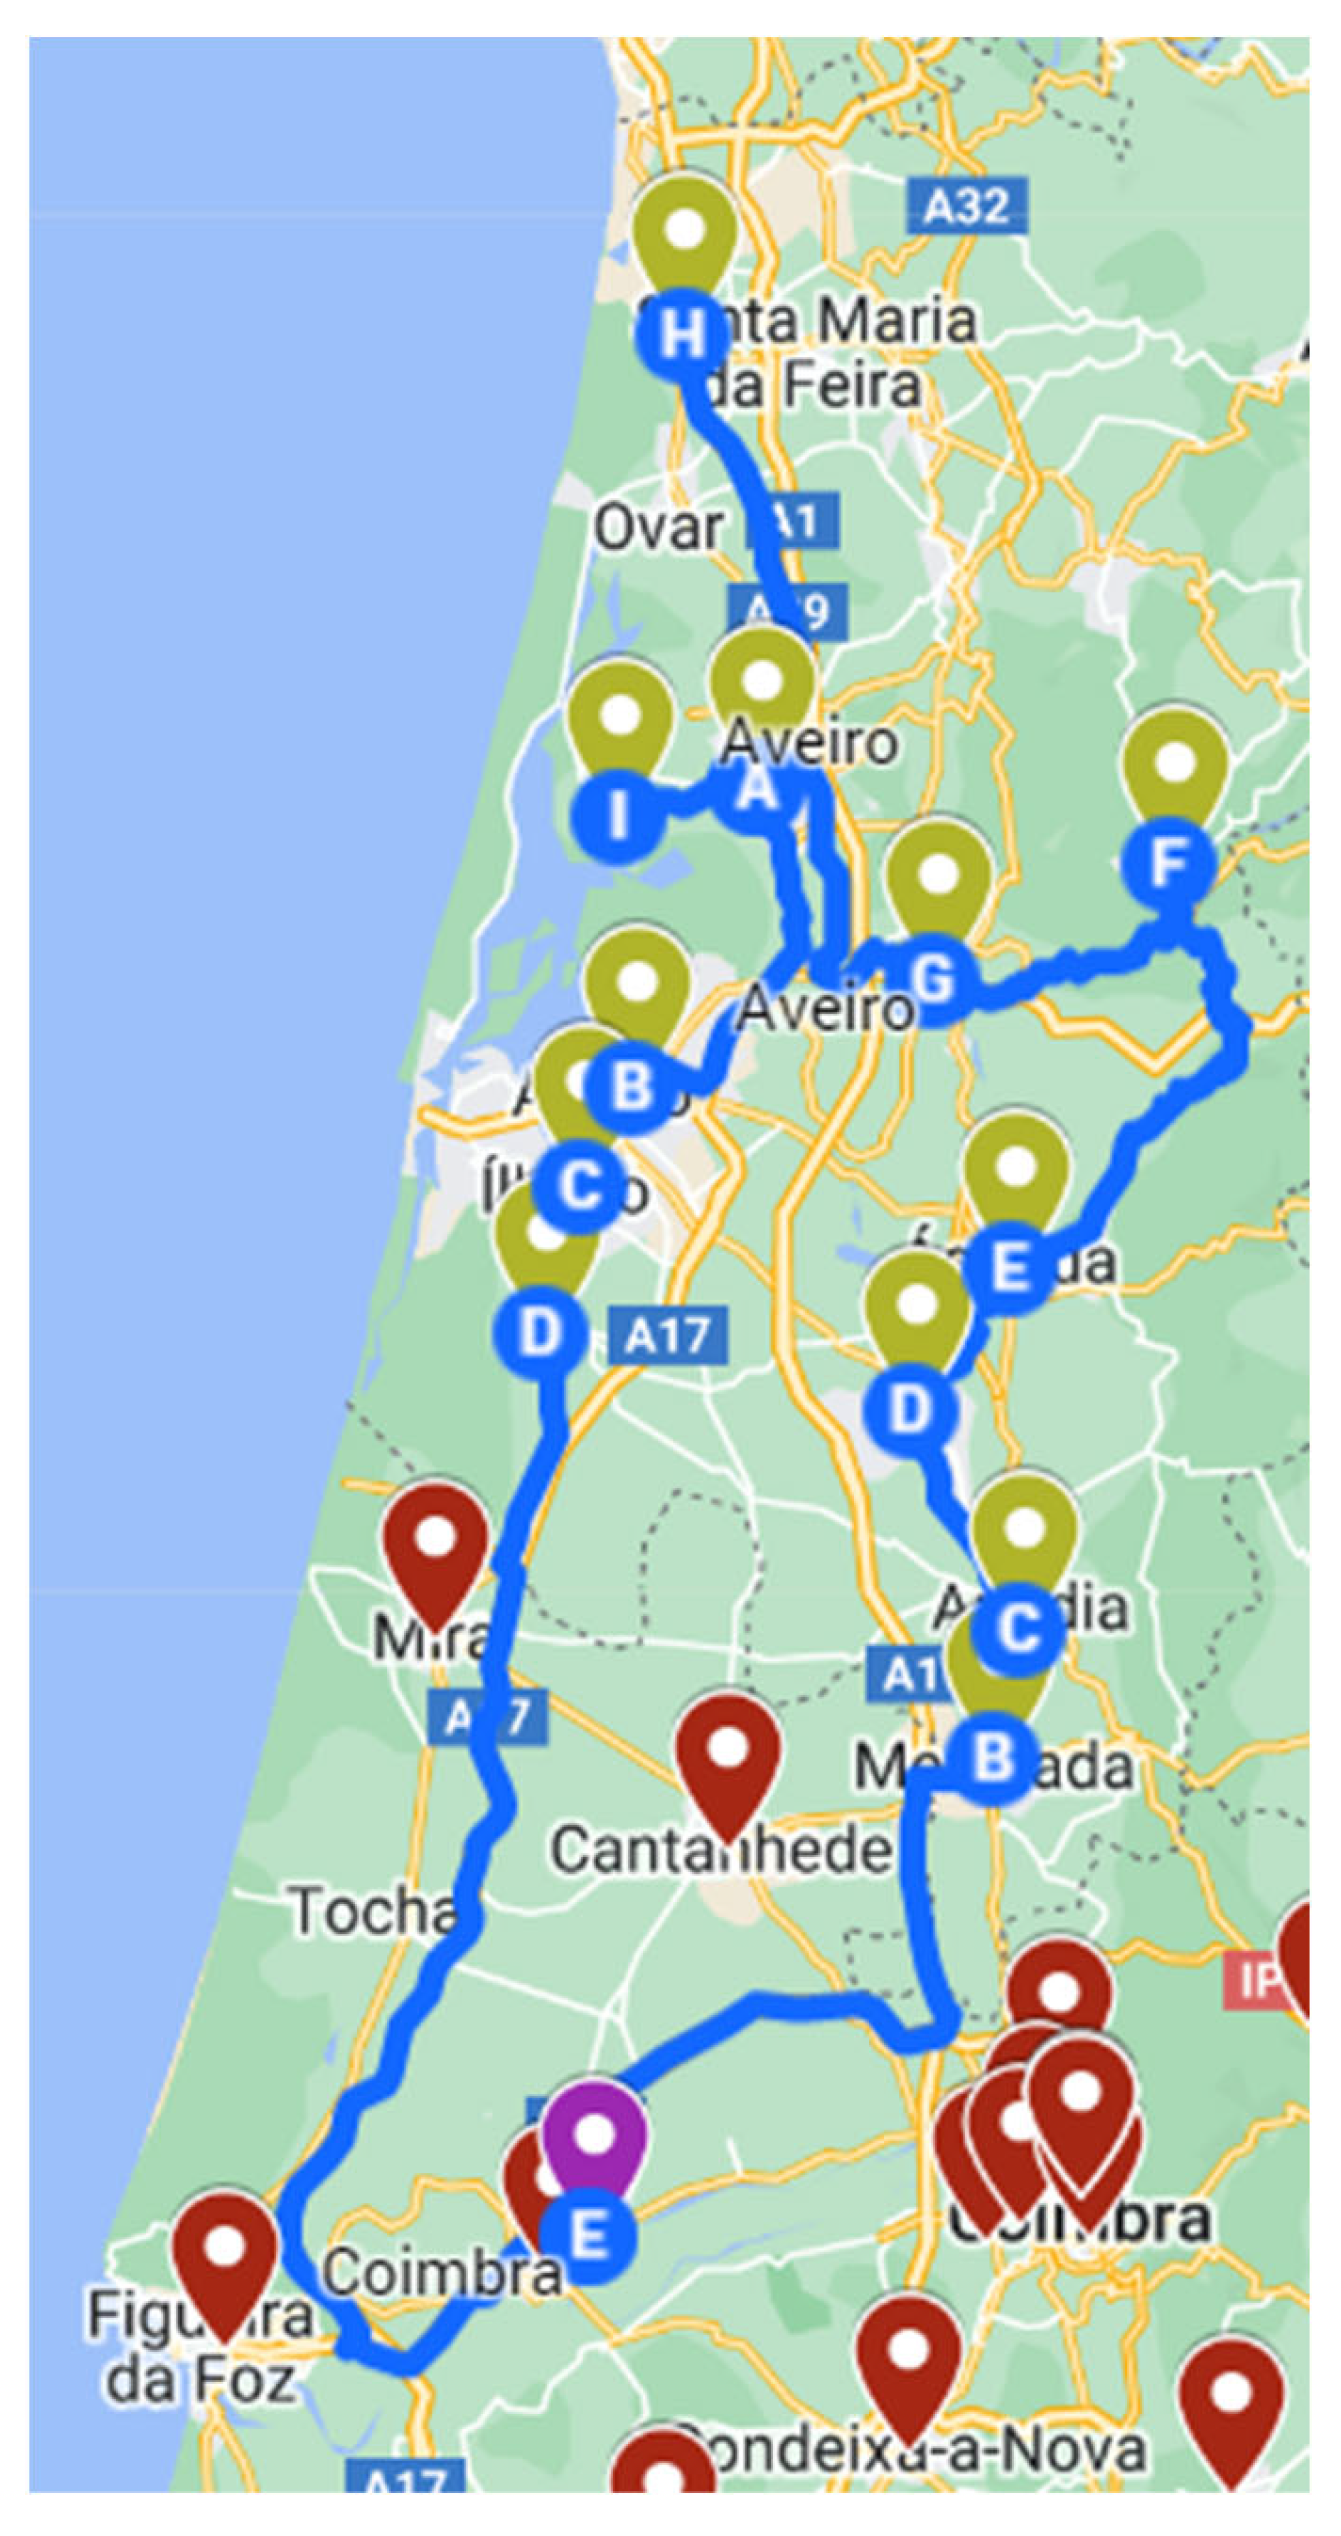
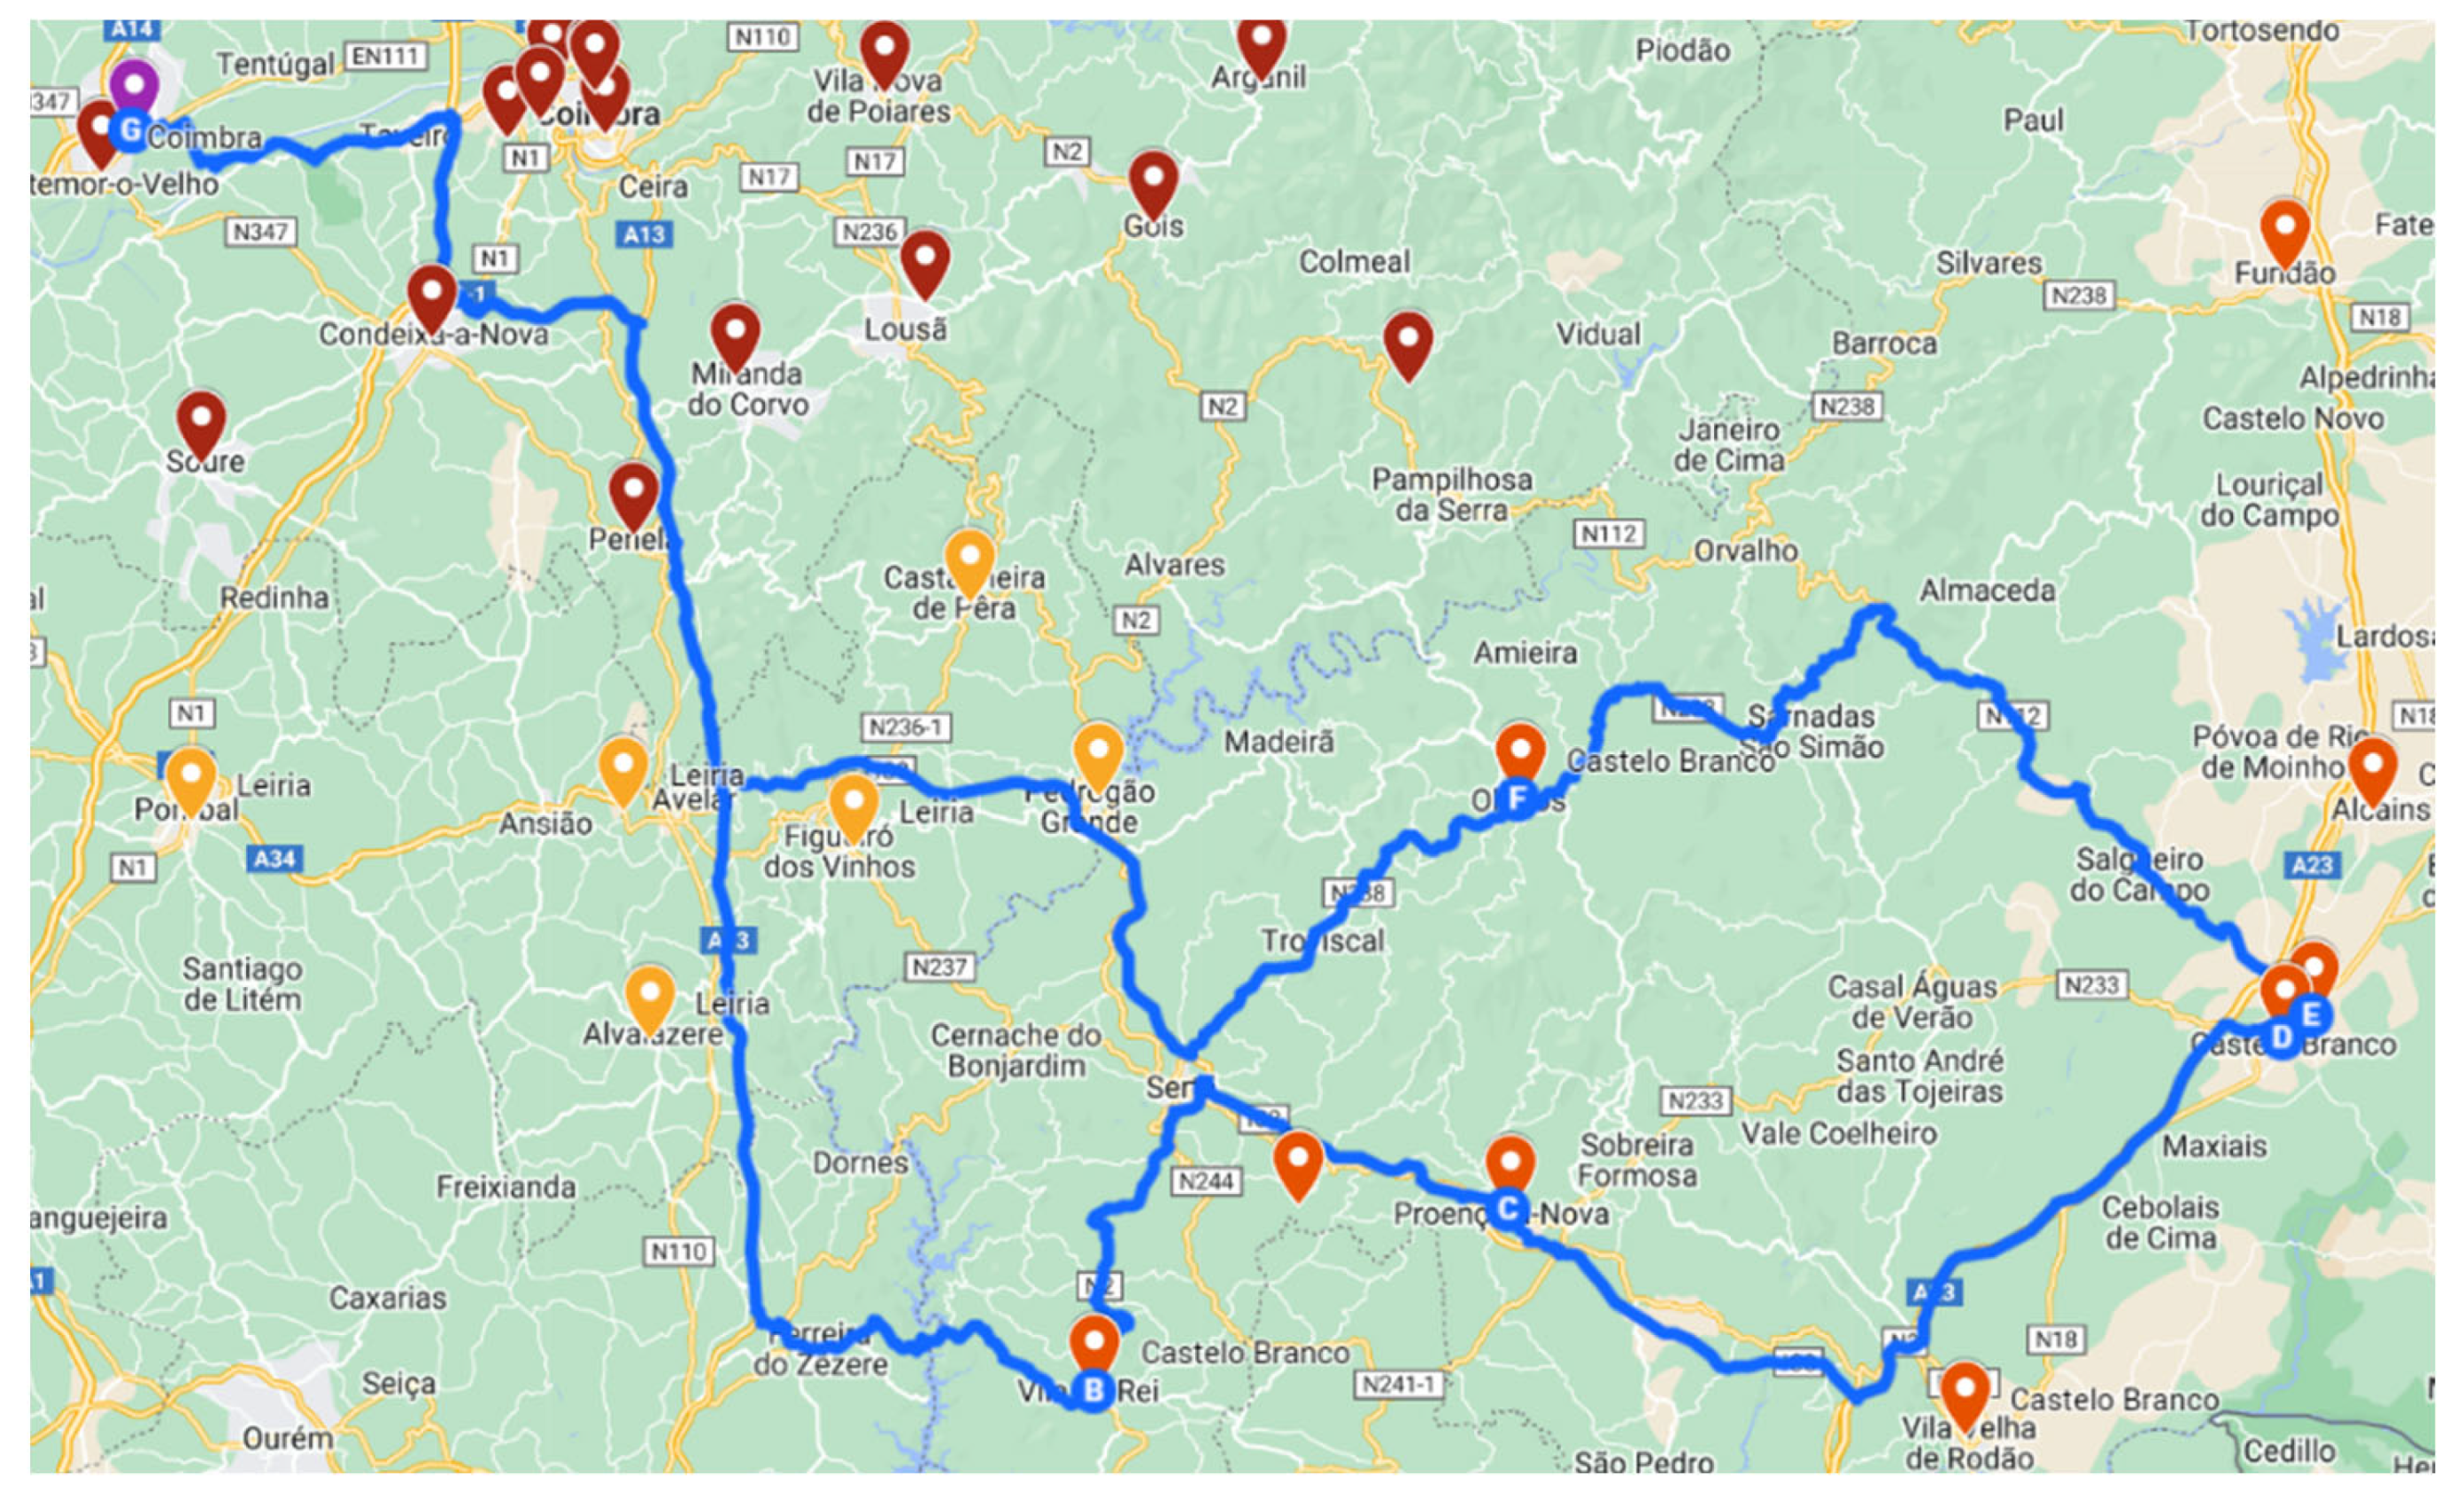
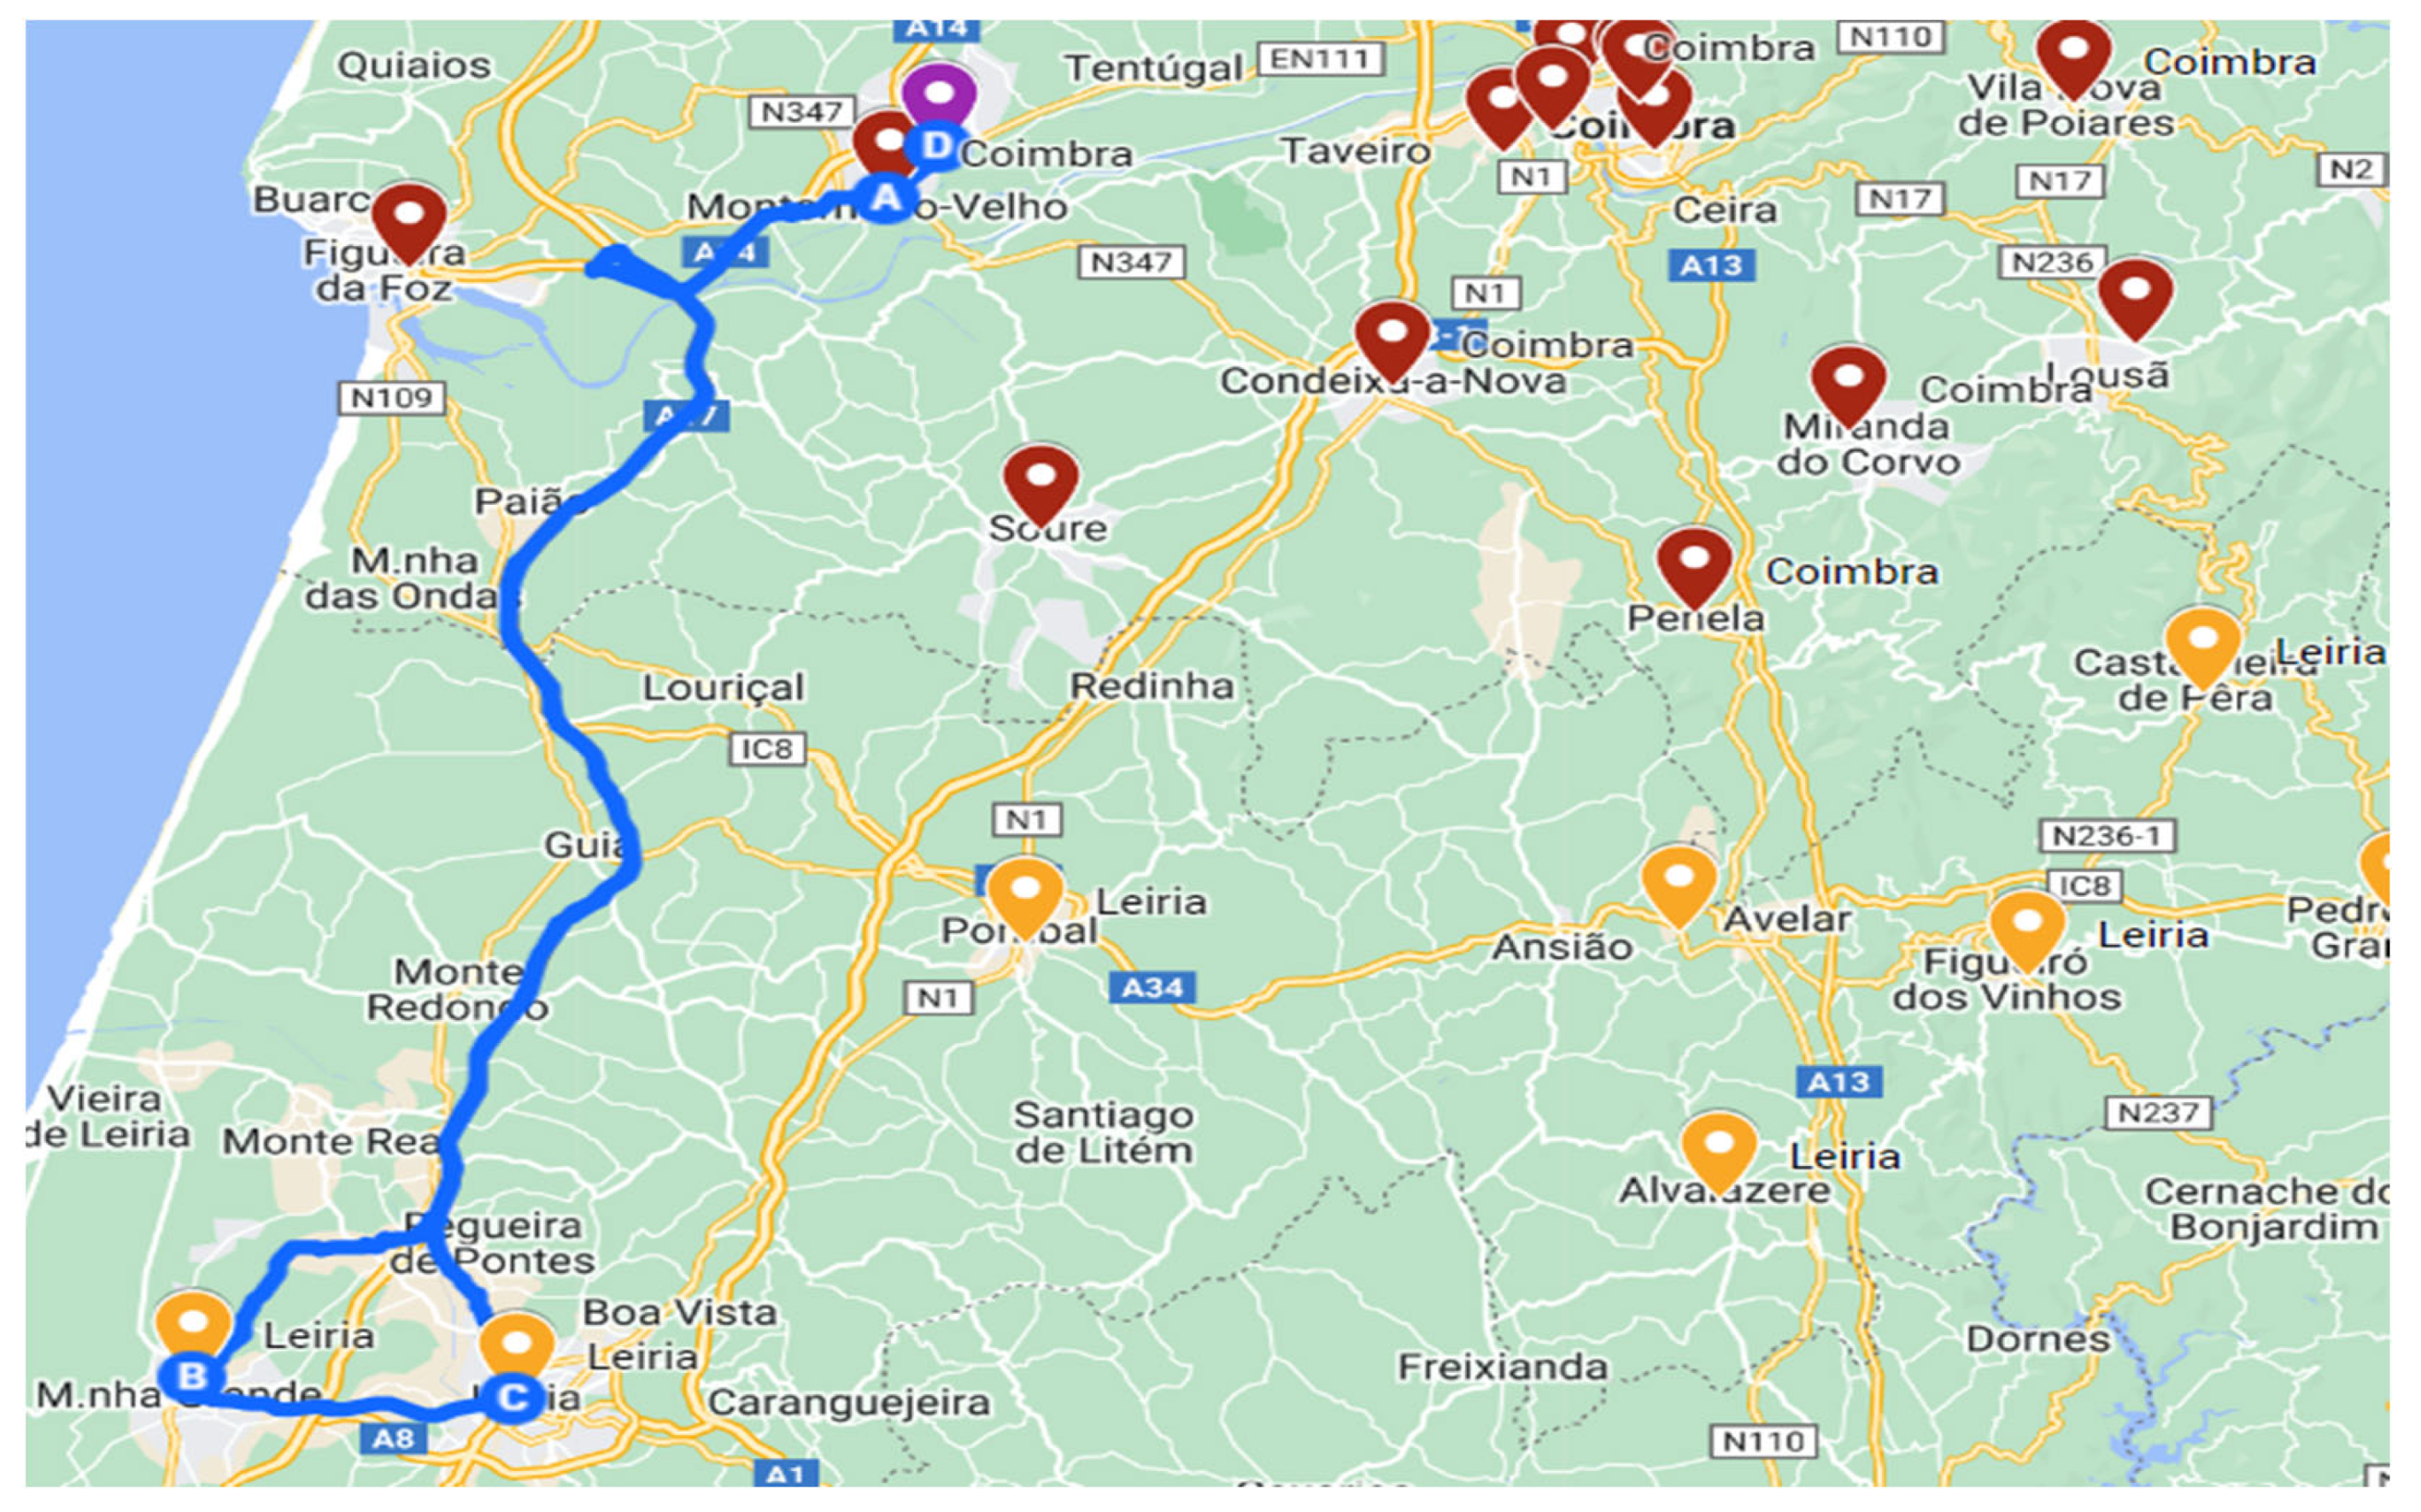
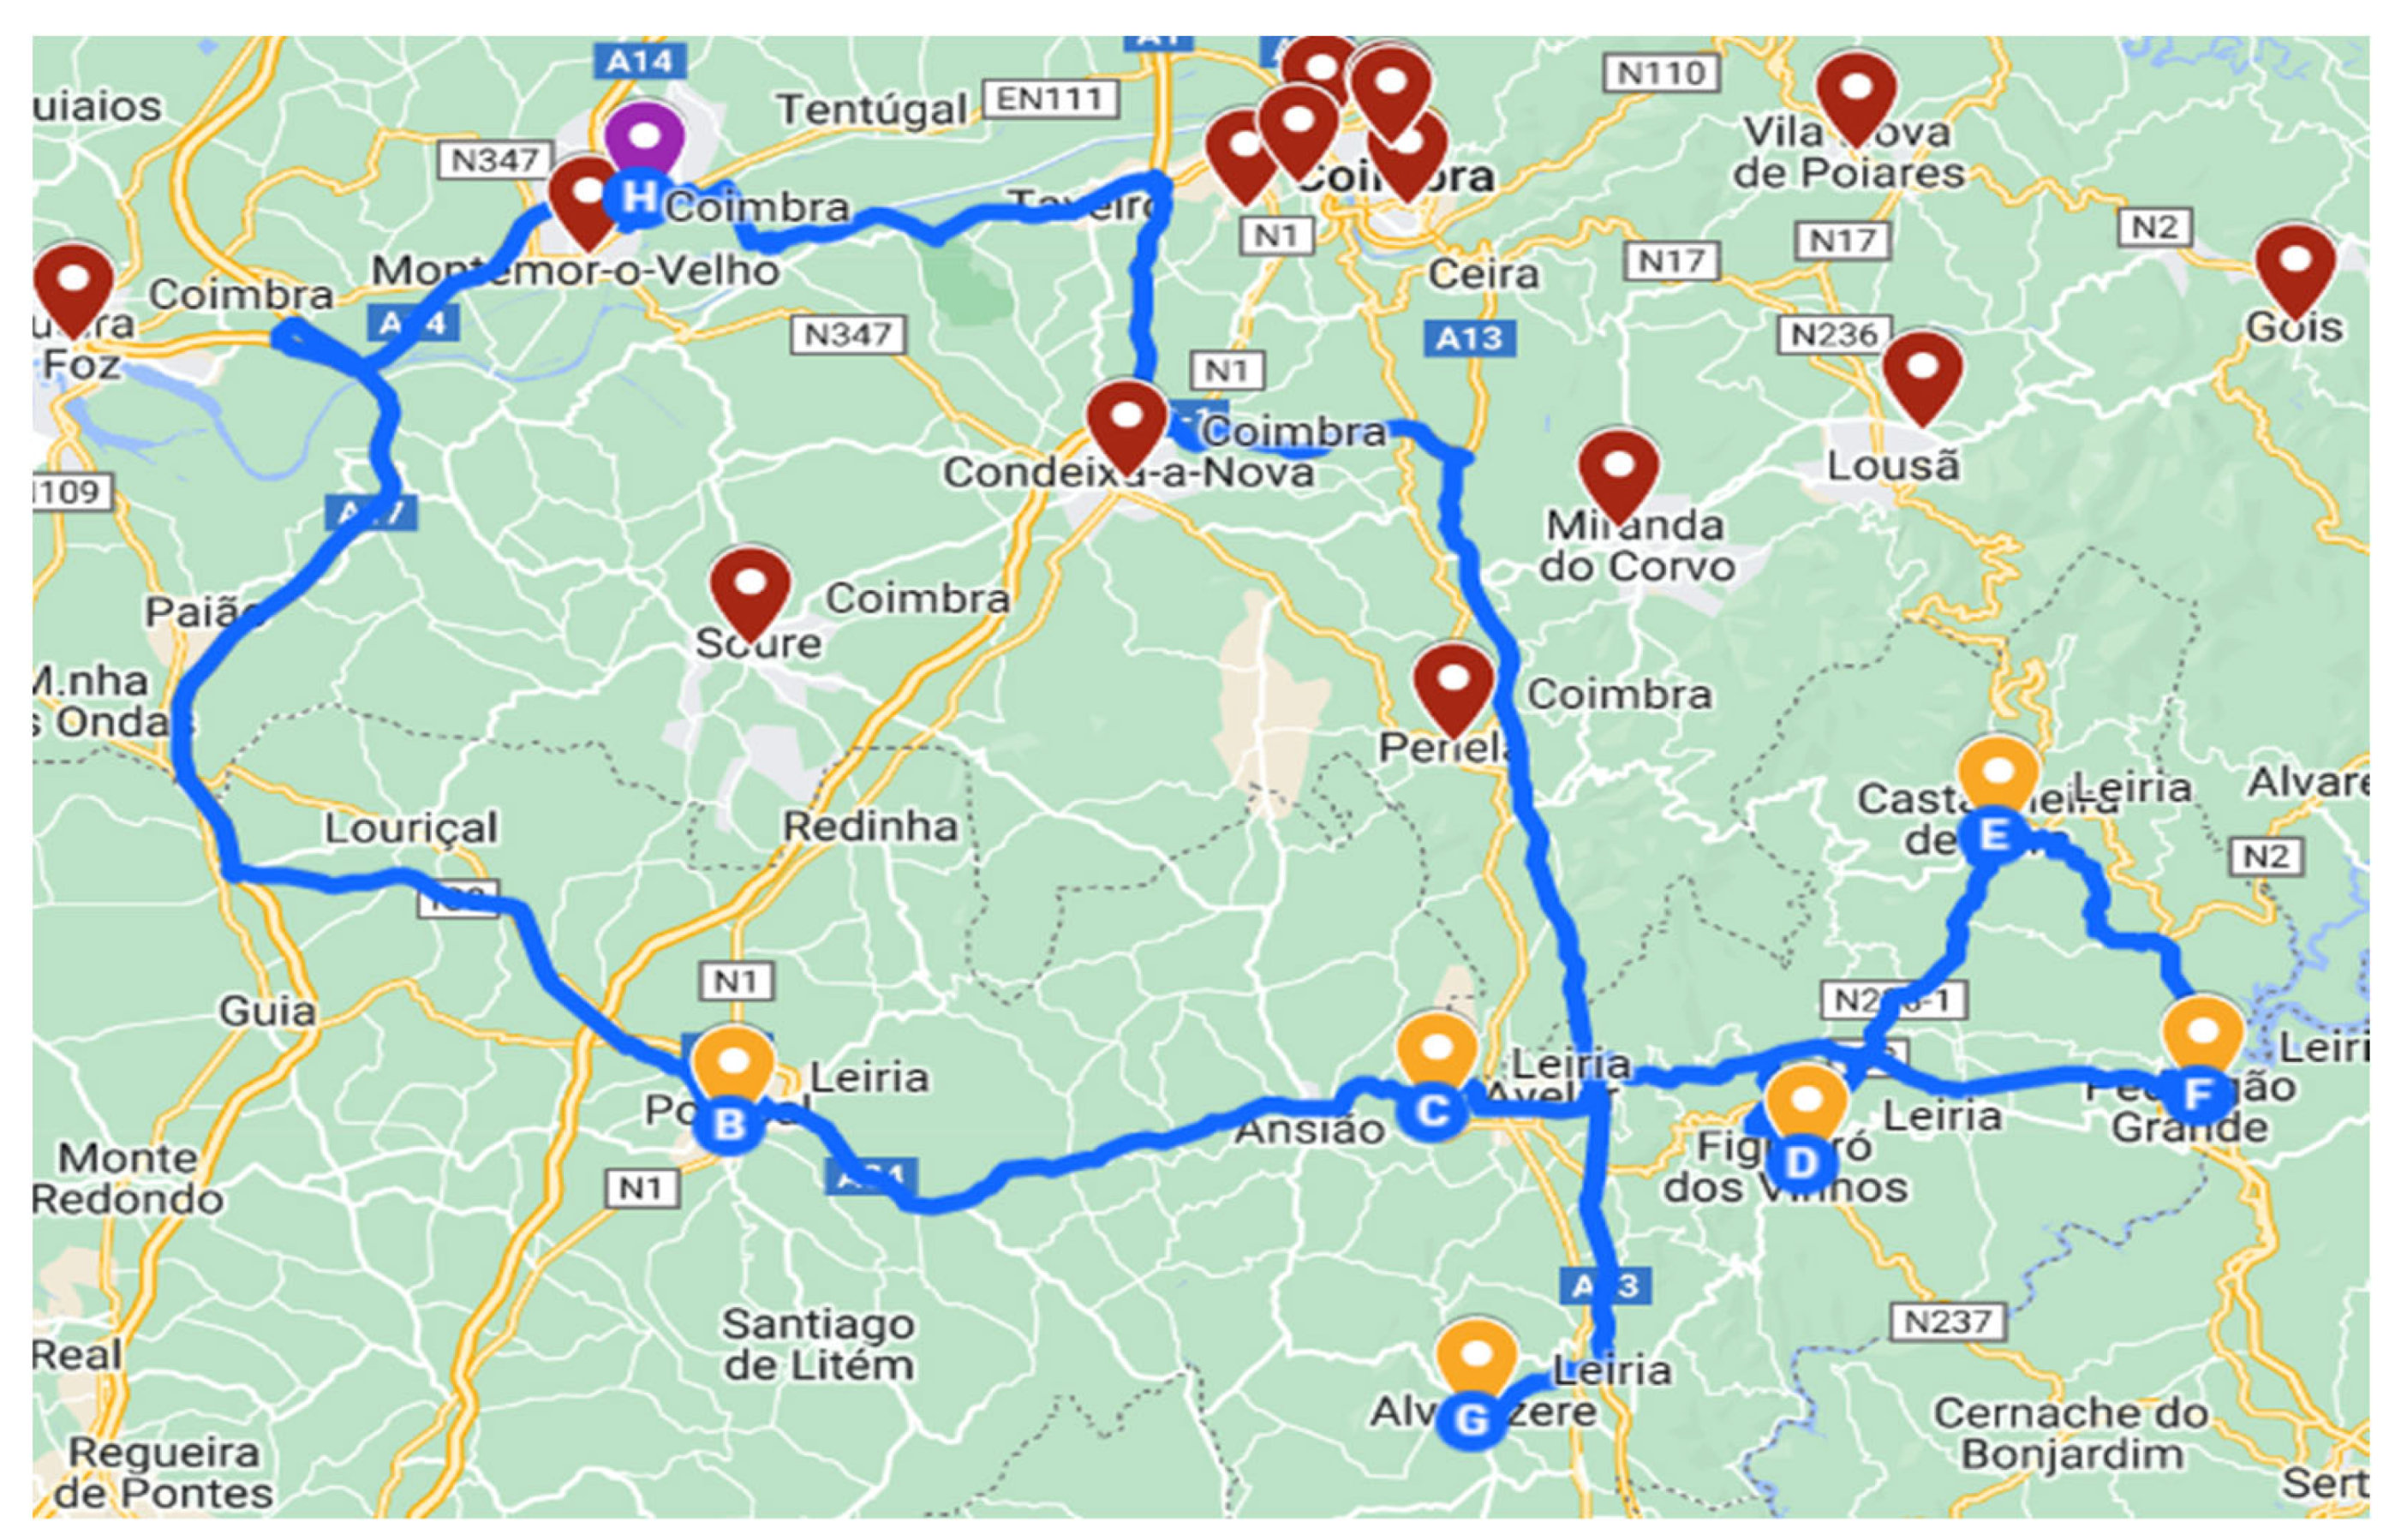
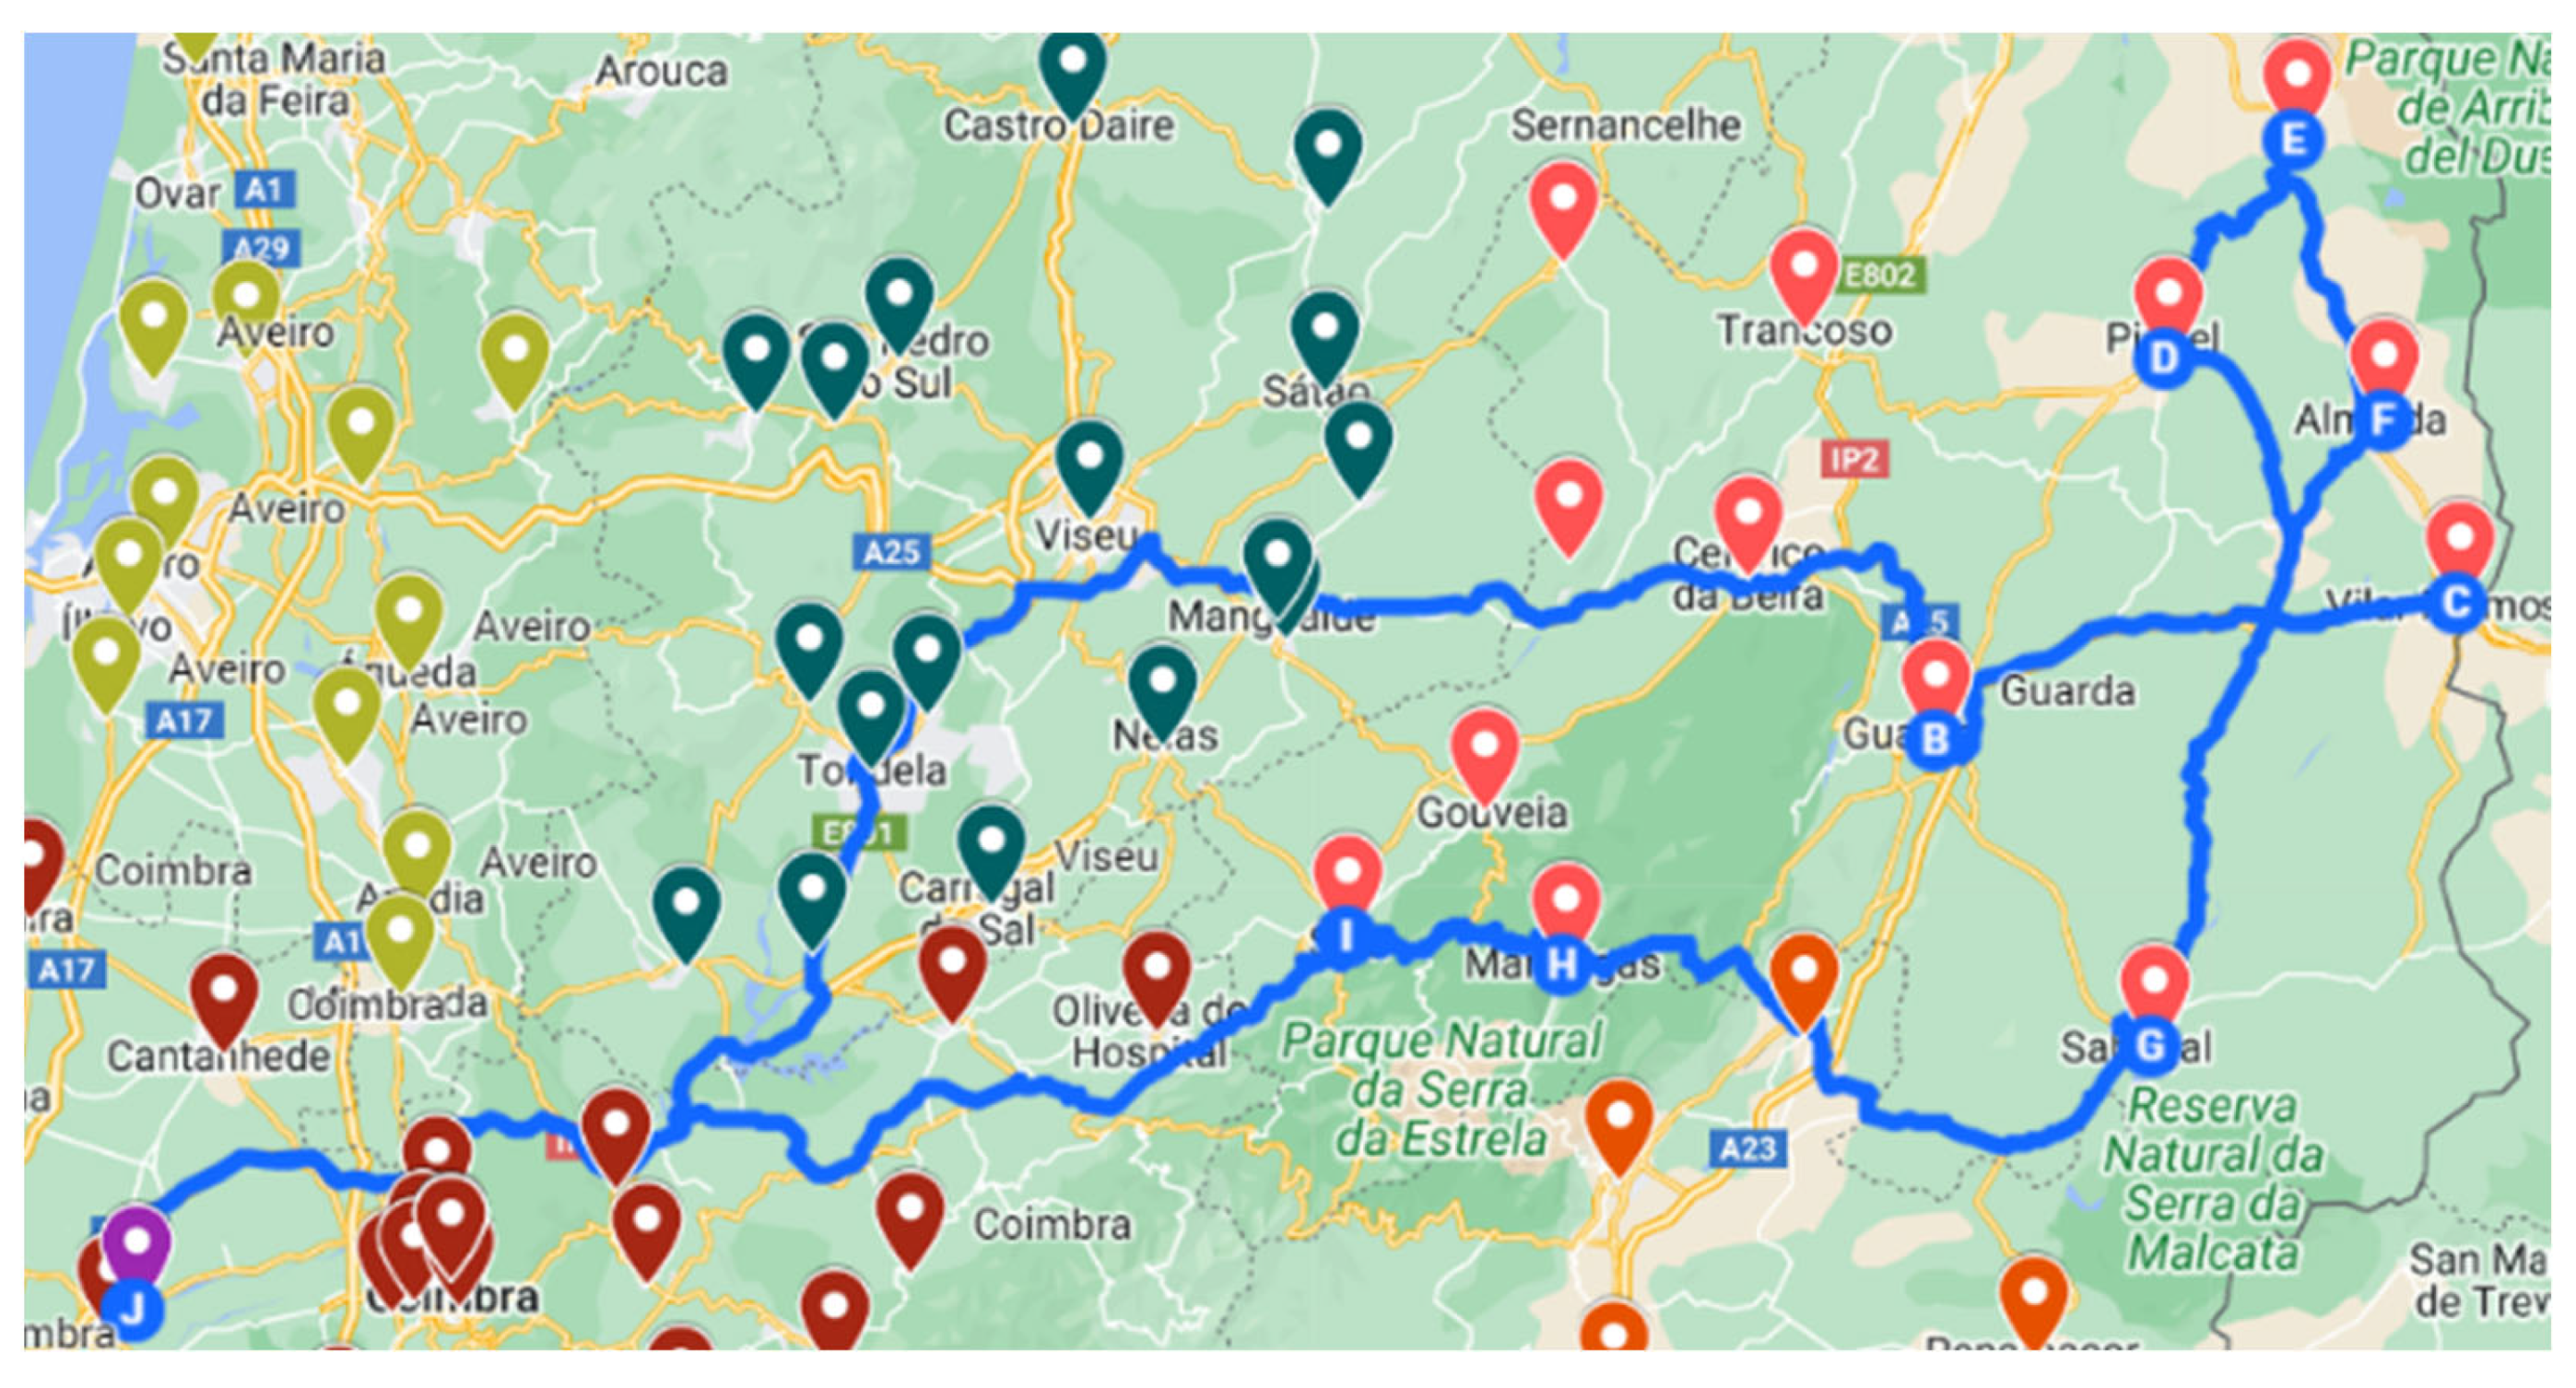
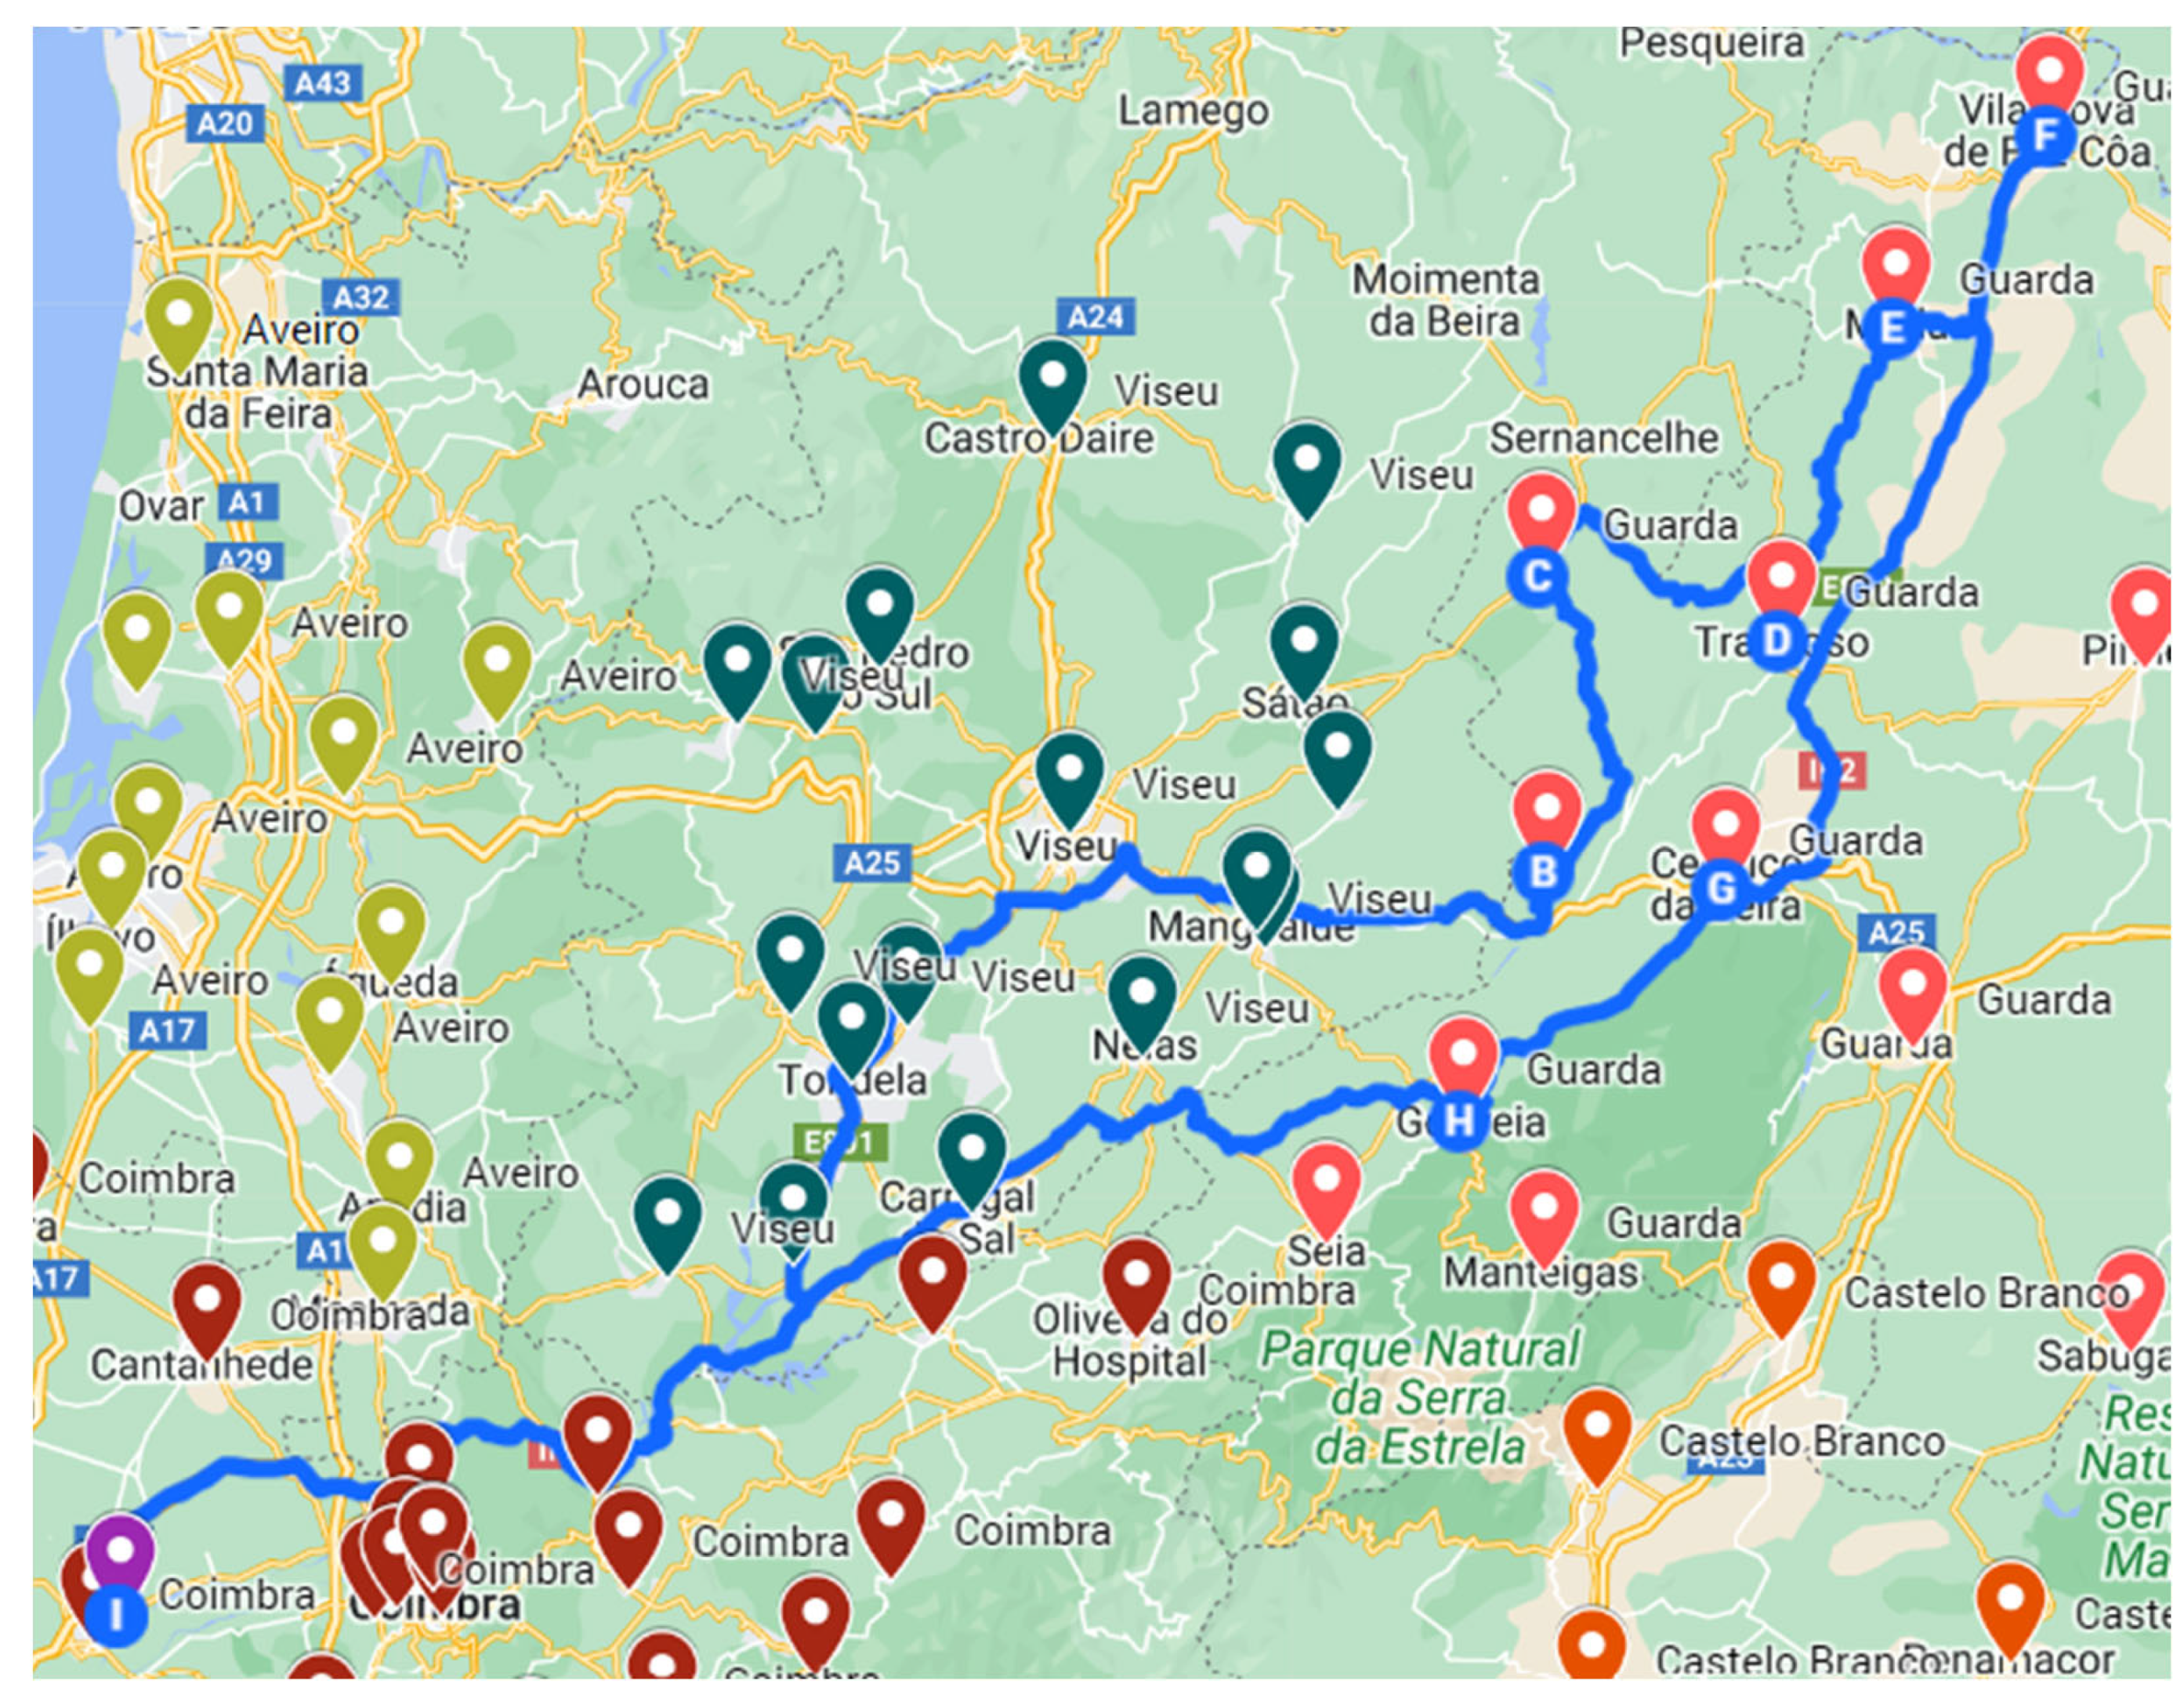
Table 14 provides an overview of the results obtained for the distribution routes of COVID-19 vaccines in Central Portugal. The schematic representation of each route is also presented.
It was concluded that in all clusters except for Viseu, there was a reduction in CO2 emissions. This happens because the shorter the time spent traveling, the shorter the distance travelled, and the less fuel consumed. One of the possible causes as to why Viseu obtained a lower total cost in one of the scenarios and less CO2 emissions in the other scenario was the fact that there was an initial fixed cost.
Hypothesis 1 was accepted for Viseu´s cluster and rejected for Coimbra, Aveiro, Castelo Branco, Guarda and Leiria’s clusters. Hypothesis 2 was accepted for Coimbra, Aveiro, Castelo Branco and Guarda’s clusters and rejected for Leiria and Viseu’s clusters. Hypothesis 3 was accepted for Leiria’s cluster and rejected for Coimbra, Aveiro, Castelo Branco, Guarda and Viseu’s clusters. Hypothesis 4 was accepted for Coimbra, Aveiro, Castelo Branco, Guarda and Leiria’s clusters and rejected for Viseu’s cluster.


