
Understanding the Behavioural Intention to Play the Nintendo Switch: An Extension of the Technology Acceptance Model


Abstract
:1. Introduction
2. Theoretical Background and Hypotheses
2.1. Technology Acceptance Model (TAM)
2.2. Diffusion of Innovation Theory (DOI)
2.3. Perceived Playfulness
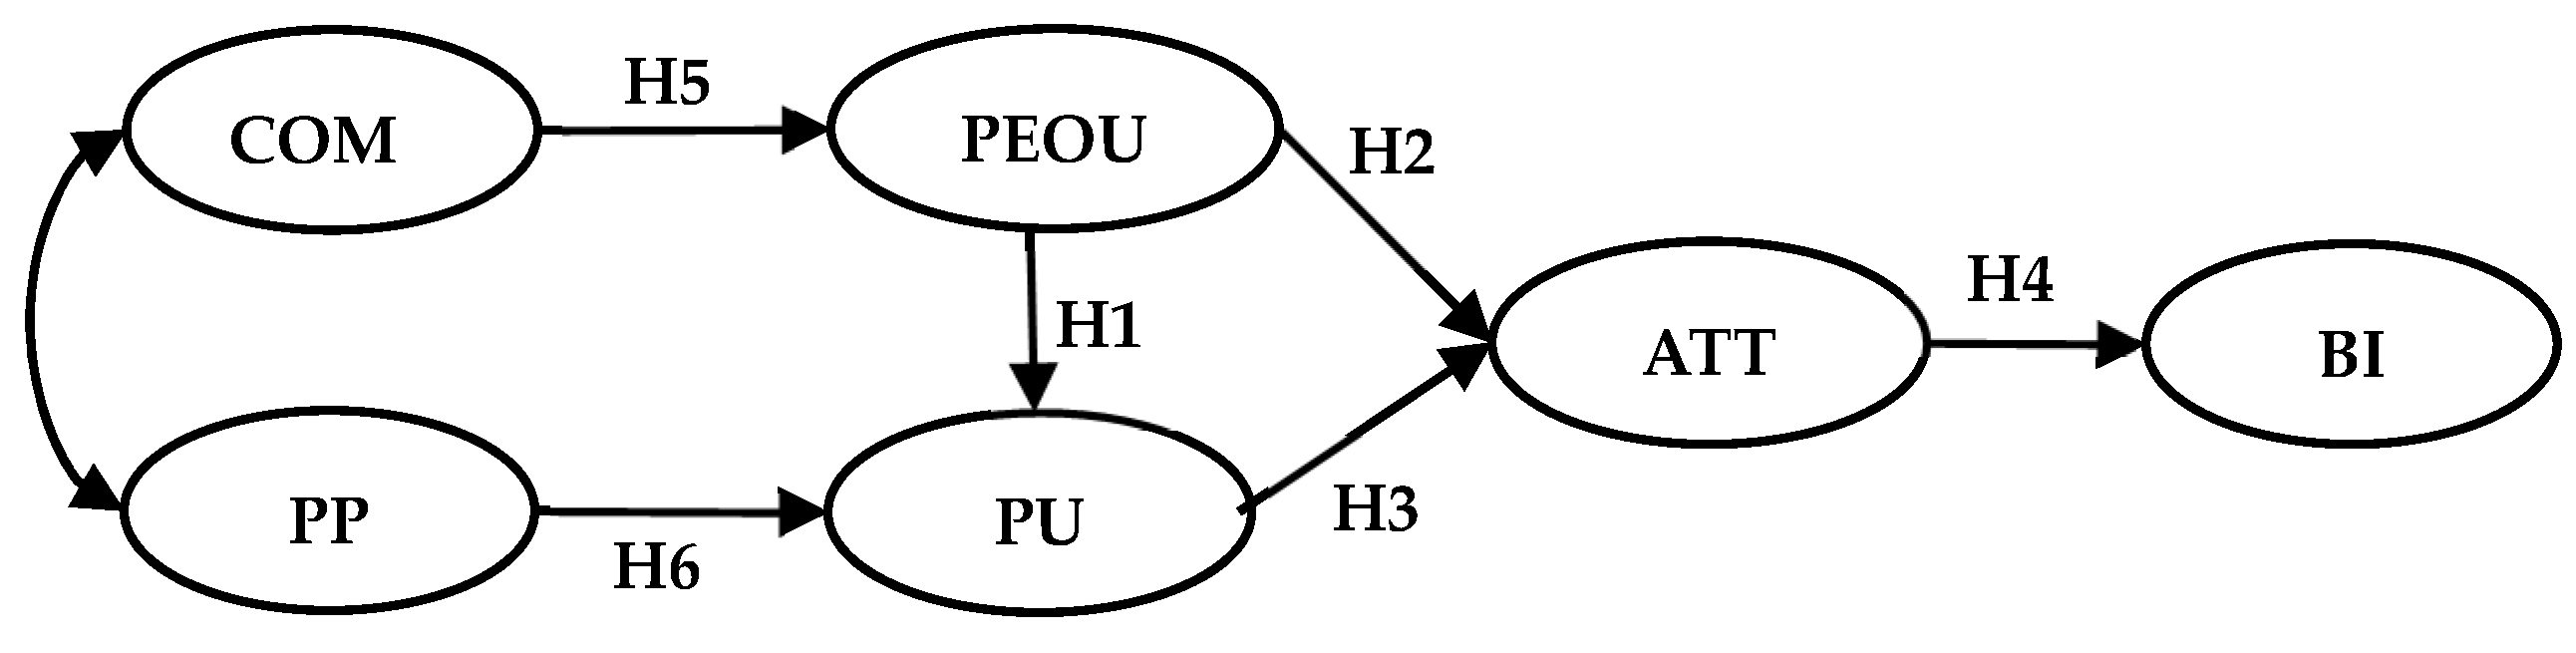
2.4. Research Model
3. Materials and Methods
3.1. Research Participants & Data Collection
3.2. Research Instruments
3.3. Data Analysis
4. Results and Discussion
4.1. Sample Demographics
4.2. Reliability and Validity
4.3. Hypothesis Testing
5. Conclusions
6. Suggestions
6.1. Practical Implications
6.2. Limitations and Future Researches
Author Contributions
Funding
Institutional Review Board Statement
Informed Consent Statement
Data Availability Statement
Conflicts of Interest
References
- Demirbileka, M.; Lema Tamer, S. Math teachers’ perspectives on using educational computer games in math education. Procedia Soc. Behav. Sci. 2010, 9, 709–716. [Google Scholar] [CrossRef] [Green Version]
- Chatfield, T. Fun Inc. Why Gaming with Dominate the 21st Century; Pegasus Books: New York, NY, USA, 2010. [Google Scholar]
- Lee, S.S.; Lin, H.Y.; Teo, K.H.; Tan, W.P.; Lin, C.W. Discussion on The Consumers Motivation to Watch E-sports Game and The Follow-up Behaviors Intention. In Proceedings of the 2018 2nd International Conference on Education and E-Learning, Bali, Indonesia, 5–7 November 2018; pp. 181–186. [Google Scholar] [CrossRef]
- Vega, N. The Nintendo Switch just became the fastest-selling video game console in US history. New York Post, 4 January 2018. Available online: https://www.nytimes.com/2020/08/12/climate/tropical-soils-climate-change.html (accessed on 1 January 2022).
- Moore, L. Nintendo Switch Has Surpassed 32 Million Units Sold as Mario Kart 8 Deluxe Becomes the Platform’s Best-Selling Game. DualShockers, 31 January 2019. Available online: https://www.dualshockers.com/nintendo-switch-32-million-units-sold/ (accessed on 1 January 2022).
- Bhattacherjee, A. Understanding information systems continuance: An expectation-confirmation model. MIS Q. 2001, 25, 351–370. [Google Scholar] [CrossRef]
- Davis, F.D. A Technology Acceptance Model for Empirically Testing New End-User Information Systems: Theory and Results; Sloan School of Management, Massachusetts Institute of Technology: Cambridge, MA, USA, 1986. [Google Scholar]
- Moon, J.W.; Kim, Y.G. Extending the TAM for a World-Wide-Web context. Inf. Manag. 2001, 4, 217–230. [Google Scholar] [CrossRef]
- Davis, F.D. Perceived usefulness, perceived ease of use, and user acceptance of information technology. MIS Q. 1989, 13, 319–340. [Google Scholar] [CrossRef] [Green Version]
- Davis, F.D.; Bagozzi, R.P.; Warshaw, P.R. Extrinsic and intrinsic motivation to use computers in the workplace. J. Appl. Soc. Psychol. 1992, 14, 1111–1132. [Google Scholar] [CrossRef]
- Rogers, E.M. Diffusion of Innovation, 3rd ed.; The Free Press of Glencoe: New York, NY, USA, 1983. [Google Scholar]
- Moore, G.C.; Benbasat, I. Development of an Instrument to Measure the Perceptions of Adopting and Information Technology Innovation. Inf. Syst. Res. 1991, 3, 192–222. [Google Scholar] [CrossRef] [Green Version]
- Tornatzky, L.G.; Klein, K.J. Innovation characteristics and innovation adoption-implementation: A meta-analysis of findings, IEEE Trans. Eng. Manag. 1982, 1, 28–45. [Google Scholar] [CrossRef]
- Li, X.; Troutt, M.D.; Brandyberry, A.; Wang, T. Decision factors for the adoption and continued use of online direct sales channels among SMEs. J. Assoc. Inf. Syst. 2011, 1, 1–31. [Google Scholar] [CrossRef] [Green Version]
- Fishbein, M.; Ajzen, I. Belief, Attitude, Intention and Behaviour: An Introduction to Theory and Research; Addison-Wesley: Reading, MA, USA, 1975. [Google Scholar]
- Pavlou, P.A. Consumer acceptance of electronic commerce: Integrating trust and risk with the technology acceptance model. Int. J. Electron. Commer. 2003, 3, 101–134. [Google Scholar]
- Cho, H.; Wang, Y. Cultural comparison for the acceptance of online apparel customization. J. Consum. Mark. 2010, 27, 550–557. [Google Scholar] [CrossRef]
- Kim, J.; Ma, Y.J.; Park, J. Are US consumers ready to adopt mobile technology for fashion goods? An integrated theoretical approach. J. Fash. Mark. Manag. Int. J. 2009, 2, 215–230. [Google Scholar]
- Chou, C.Y.; Lu, L. Exploring the Attitude Differentiation on e-Learning Systems Based on TAM: The Strength of Growth Need as A Moderator. J. Inf. Manag. 2014, 1, 83–106. [Google Scholar]
- Hsu, L.Y.; Mou, C.F. Using the Technology Acceptance Model and Innovative Features to Explore the Intention of using Nike+ Running App. J. Leis. Holisic Wellness 2018, 20, 17–49. [Google Scholar]
- Chang, C.M.; Chen, N.C.; Lin, C.C. The Application of Technology Acceptance Model and Theory of Planned Behavior to Discuss the Behavioral Intention of Wii Sports Gaming Participation. J. Sport Recreat. Res. 2012, 1, 53–67. [Google Scholar]
- Wu, T.M.; Chang, C.M. The study on how technological acceptance model functioned at collegiate sports equipments check-out system-a case study at National Taichung University of Science and Technology. J. Tai Zhong Xue Yuan Ti Yu 2014, 10, 5–20. [Google Scholar]
- Hardgrave, B.C.; Davis, F.D.; Riemenschneider, C.K. Investigating determinants of software developers’ intentions to follow methodologies. J. Manag. Inf. Syst. 2003, 1, 123–151. [Google Scholar]
- Lee, Y.H.; Hsieh, Y.C.; Hsu, C.N. Adding innovation diffusion theory to the technology acceptance model: Supporting employees’ intentions to use e-learning systems. J. Educ. Technol. Soc. 2011, 4, 124–137. [Google Scholar]
- Rogers, E.M. Diffusion of Innovations; Free Press: New York, NY, USA, 1995. [Google Scholar]
- Rogers, E.M.; Shoemaker, F. Diffusion of Innovation: A Cross-Cultural Approach; Free Press: New York, NY, USA, 1983. [Google Scholar]
- Chen, L.; Gillenson, M.; Sherrell, D. Consumer acceptance of virtual stores: A Theoretical Model and Critical Success Factors for Virtual Stores. ACM SIGMIS Database 2004, 2, 8–31. [Google Scholar] [CrossRef]
- Ndubisi, N.O.; Sinti, Q. Consumer attitudes, system’s characteristics and internet banking adoption in Malaysia. Manag. Res. News 2006, 29, 16–27. [Google Scholar] [CrossRef]
- Al-Gahtani, S.S. Computer technology adoption in Saudi Arabia: Correlates of perceived innovation attributes. Inf. Technol. Dev. 2003, 1, 57–69. [Google Scholar] [CrossRef]
- Hoffman, D.; Novak, T. Marketing in hypermedia computer-mediated environments: Conceptual foundations. J. Mark. 1996, 3, 50–68. [Google Scholar] [CrossRef]
- Chen, L.d.; Gillenson, M.; Sherrell, D. Enticing online consumers: An extended technology acceptance perspective. Inf. Manag. 2002, 39, 705–719. [Google Scholar] [CrossRef]
- Hung, S.Y.; Tsai, J.C.A.; Chou, S.T. Decomposing perceived playfulness: A contextual examination of two social networking sites. Inf. Manag. 2016, 6, 698–716. [Google Scholar] [CrossRef]
- Igbaria, M.; Guimaraes, T.; Davis, G.B. Testing the Determinants of Microcomputer Usage via a Structural Equation Model. J. Manag. Inf. Syst. 1995, 4, 87–114. [Google Scholar] [CrossRef]
- Teo, T.; Lim, V.; Lai, R. Intrinsic and Extrinsic motivation in Internet Usage. Omega Int. J. Manag. Sci. 1999, 27, 25–37. [Google Scholar] [CrossRef]
- Wu, M.Y.; Jiang, P.S. A Study of Usage Intention of Digital TV Based on Decomposed Theory of Planned Behavior. J. Data Anal. 2014, 1, 147–168. [Google Scholar]
- Bhattacherjee, A. Acceptance of e-commerce services: The case of electronic brokerages. IEEE Trans. Syst. Man Cybern.-Part A. Syst. Hum. 2000, 4, 411–420. [Google Scholar] [CrossRef] [Green Version]
- Taylor, S.; Todd, P. Understanding Information Technology Usage: A Test of Competing Models. Inf. Syst. Res. 1995, 2, 144–176. [Google Scholar] [CrossRef]
- Dash, G.; Kiefer, K.; Paul, J. Marketing-to-Millennials: Marketing 4.0, customer satisfaction and purchase intention. J. Bus. Res. 2021, 122, 608–620. [Google Scholar] [CrossRef]
- Kline, R.B. Principles and Practice of Structural Equation Modeling; Guildford Press: New York, NY, USA, 2015. [Google Scholar]
- Tabachnick, B.G.; Fidell, L.S. Using Multivariate Statistics, 5th ed.; Pearson Education: Boston, MA, USA, 2007. [Google Scholar]
- Fornell, C.; Larker, D. Evaluating Structural Equation Models with Unobserved Variables and Measurement Errors. J. Res. Mark. 1981, 27, 445–466. [Google Scholar]
- Hair, J.F., Jr.; Black, W.C.; Babin, B.J.; Anderson, R.E.; Tatham, R.L. Multivariate Data Analysis, 6th ed.; Prentice-Hall: Hoboken, NJ, USA, 2006. [Google Scholar]
- Lin, C.W.; Tsai, Y.X.; Chang, Y.S.; Ding, Y.J.; Liu, J.C.; Lin, Y.S. Applying the Decomposed Theory of Planned Behavior to Explore the Influencing Factors of NTC App Usage Intention. J. Funct. Spaces 2021, 2021, 7045242. [Google Scholar] [CrossRef]
- Unal, E.; Uzun, A.M. Understanding university students’ behavioral intention to use Edmodo through the lens of an extended technology acceptance model. Br. J. Educ. Technol. 2021, 52, 619–637. [Google Scholar] [CrossRef]
- Kasilingam, D.L. Understanding the attitude and intention to use smartphone chatbots for shopping. Technol. Soc. 2020, 62, 101280. [Google Scholar] [CrossRef]
- Singh, R.; Tewari, A. Modeling factors affecting online learning adoption: Mediating role of attitude. Int. J. Educ. Manag. 2021, 35, 1405–1420. [Google Scholar] [CrossRef]
- Yang, X. Determinants of consumers’ continuance intention to use social recommender systems: A self-regulation perspective. Technol. Soc. 2021, 64, 101464. [Google Scholar] [CrossRef]
- Hoi, V.N. Understanding higher education learners’ acceptance and use of mobile devices for language learning: A Rasch-based path modeling approach. Comput. Educ. 2020, 146, 103761. [Google Scholar] [CrossRef]
- Lai, Y.; Saab, N.; Admiraal, W. University students’ use of mobile technology in self-directed language learning: Using the integrative model of behavior prediction. Comput. Educ. 2022, 179, 104413. [Google Scholar] [CrossRef]
- Sheu, D.F.; Kao, Y.P.; Chuang, Y.T. Applied TAM to Probe on Factors of Electronic Purse Payment Service. J. Innov. Manag. 2011, 8, 95–117. [Google Scholar]
- Altin Gumussoy, C.; Kaya, A.; Ozlu, E. Determinants of Mobile Banking Use: An Extended TAM with Perceived Risk, Mobility Access, Compatibility, Perceived Self-Efficacy and Subjective Norms; Springer: Cham, Switzerland, 2018; pp. 225–238. [Google Scholar]
- Chih, W.H.; Lin, C.; Wang, Z.Y.; Chang, M.W. The Study of the Users’ Behavioral Intention of Using GPS Technological Products. J. Innov. Manag. 2011, 2, 29–60. [Google Scholar]
- Lin, C.W.; Lin, Y.S.; Liao, C.C.; Chen, C.C. Utilizing Technology Acceptance Model for Influences of Smartphone Addiction on Behavioural Intention. Math. Probl. Eng. 2021, 2021, 5592187. [Google Scholar] [CrossRef]
- Lin, P.H.; Yeh, S.C. How motion-control influences a VR-supported technology for mental rotation learning: From the perspectives of playfulness, gender difference and technology acceptance model. Int. J. Hum.–Comput. Interact. 2019, 18, 1736–1746. [Google Scholar] [CrossRef]
- Gao, B.W.; Jiang, J.; Tang, Y. The effect of blended learning platform and engagement on students’ satisfaction-the case from the tourism management teaching. J. Hosp. Leis. Sport Tour. Educ. 2020, 27, 100272. [Google Scholar] [CrossRef]
- Astle, A. Mobile Gaming to Exceed 60% of Entire Games Market in 2022. Beyond Games. San Francisco, USA. 26 May 2022. Available online: https://www.beyondgames.biz/22748/mobile-gaming-to-exceed-60-of-entire-games-market-in-2022/ (accessed on 5 December 2022).
- Bose, I.; Yang, X. Enter the Dragon: Khillwar’s foray into the mobile gaming market of China. Commun. Assoc. Inf. Syst. 2011, 29, 551–564. [Google Scholar] [CrossRef]


| Description | Items | Freq. | % |
|---|---|---|---|
| Gender | Male | 188 | 70.7 |
| Female | 78 | 29.3 | |
| Age | Under 20 | 49 | 18.4 |
| 21–30 | 135 | 50.8 | |
| 31–40 | 60 | 22.6 | |
| 41–50 | 22 | 8.3 | |
| Occupation | Student | 107 | 40.2 |
| Government employees | 16 | 6.0 | |
| Professional | 45 | 16.9 | |
| Service Sector | 68 | 25.6 | |
| Others | 30 | 11.3 | |
| Average Monthly Income | <NT$22,000 | 87 | 32.7 |
| NT$22,001–30,000 | 42 | 15.8 | |
| NT$30,001–40,000 | 69 | 25.9 | |
| NT$40,001–50,000 | 30 | 11.3 | |
| >NT$50,001 | 38 | 14.3 | |
| Reason to buy A Nintendo Switch | Interesting and fun games | 204 | 76.7 |
| Recommendation of friends | 22 | 8.3 | |
| Gift from others | 26 | 9.8 | |
| Others | 14 | 5.3 |
| Construct | PU | PEOU | COM | PP | ATT | BI |
|---|---|---|---|---|---|---|
| PU | - | |||||
| PEOU | 0.503 * | - | ||||
| COM | 0.745 * | 0.413 * | - | |||
| PP | 0.890 * | 0.517 * | 0.696 * | - | ||
| ATT | 0.807 * | 0.614 * | 0.726 * | 0.930 * | - | |
| BI | 0.817 * | 0.527 * | 0.711 * | 0.828 * | 0.921 * | - |
| Hypothesis | Effects | Estimate | CR (t) | p | Remarks |
|---|---|---|---|---|---|
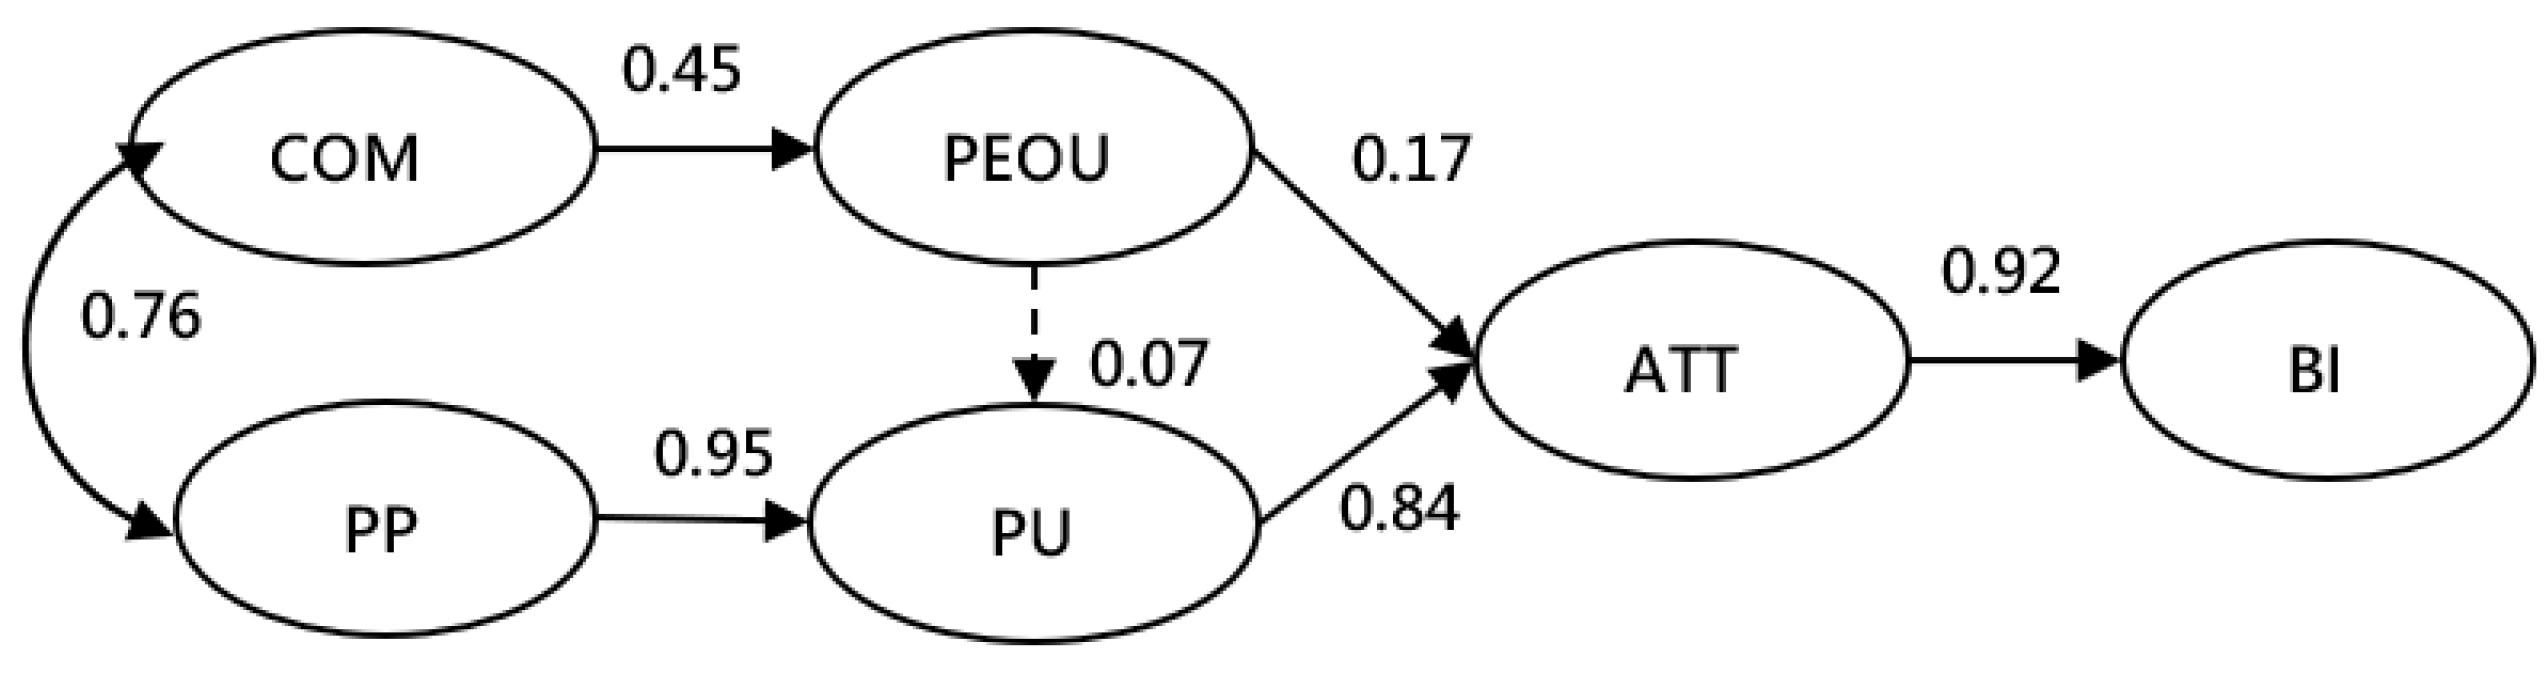
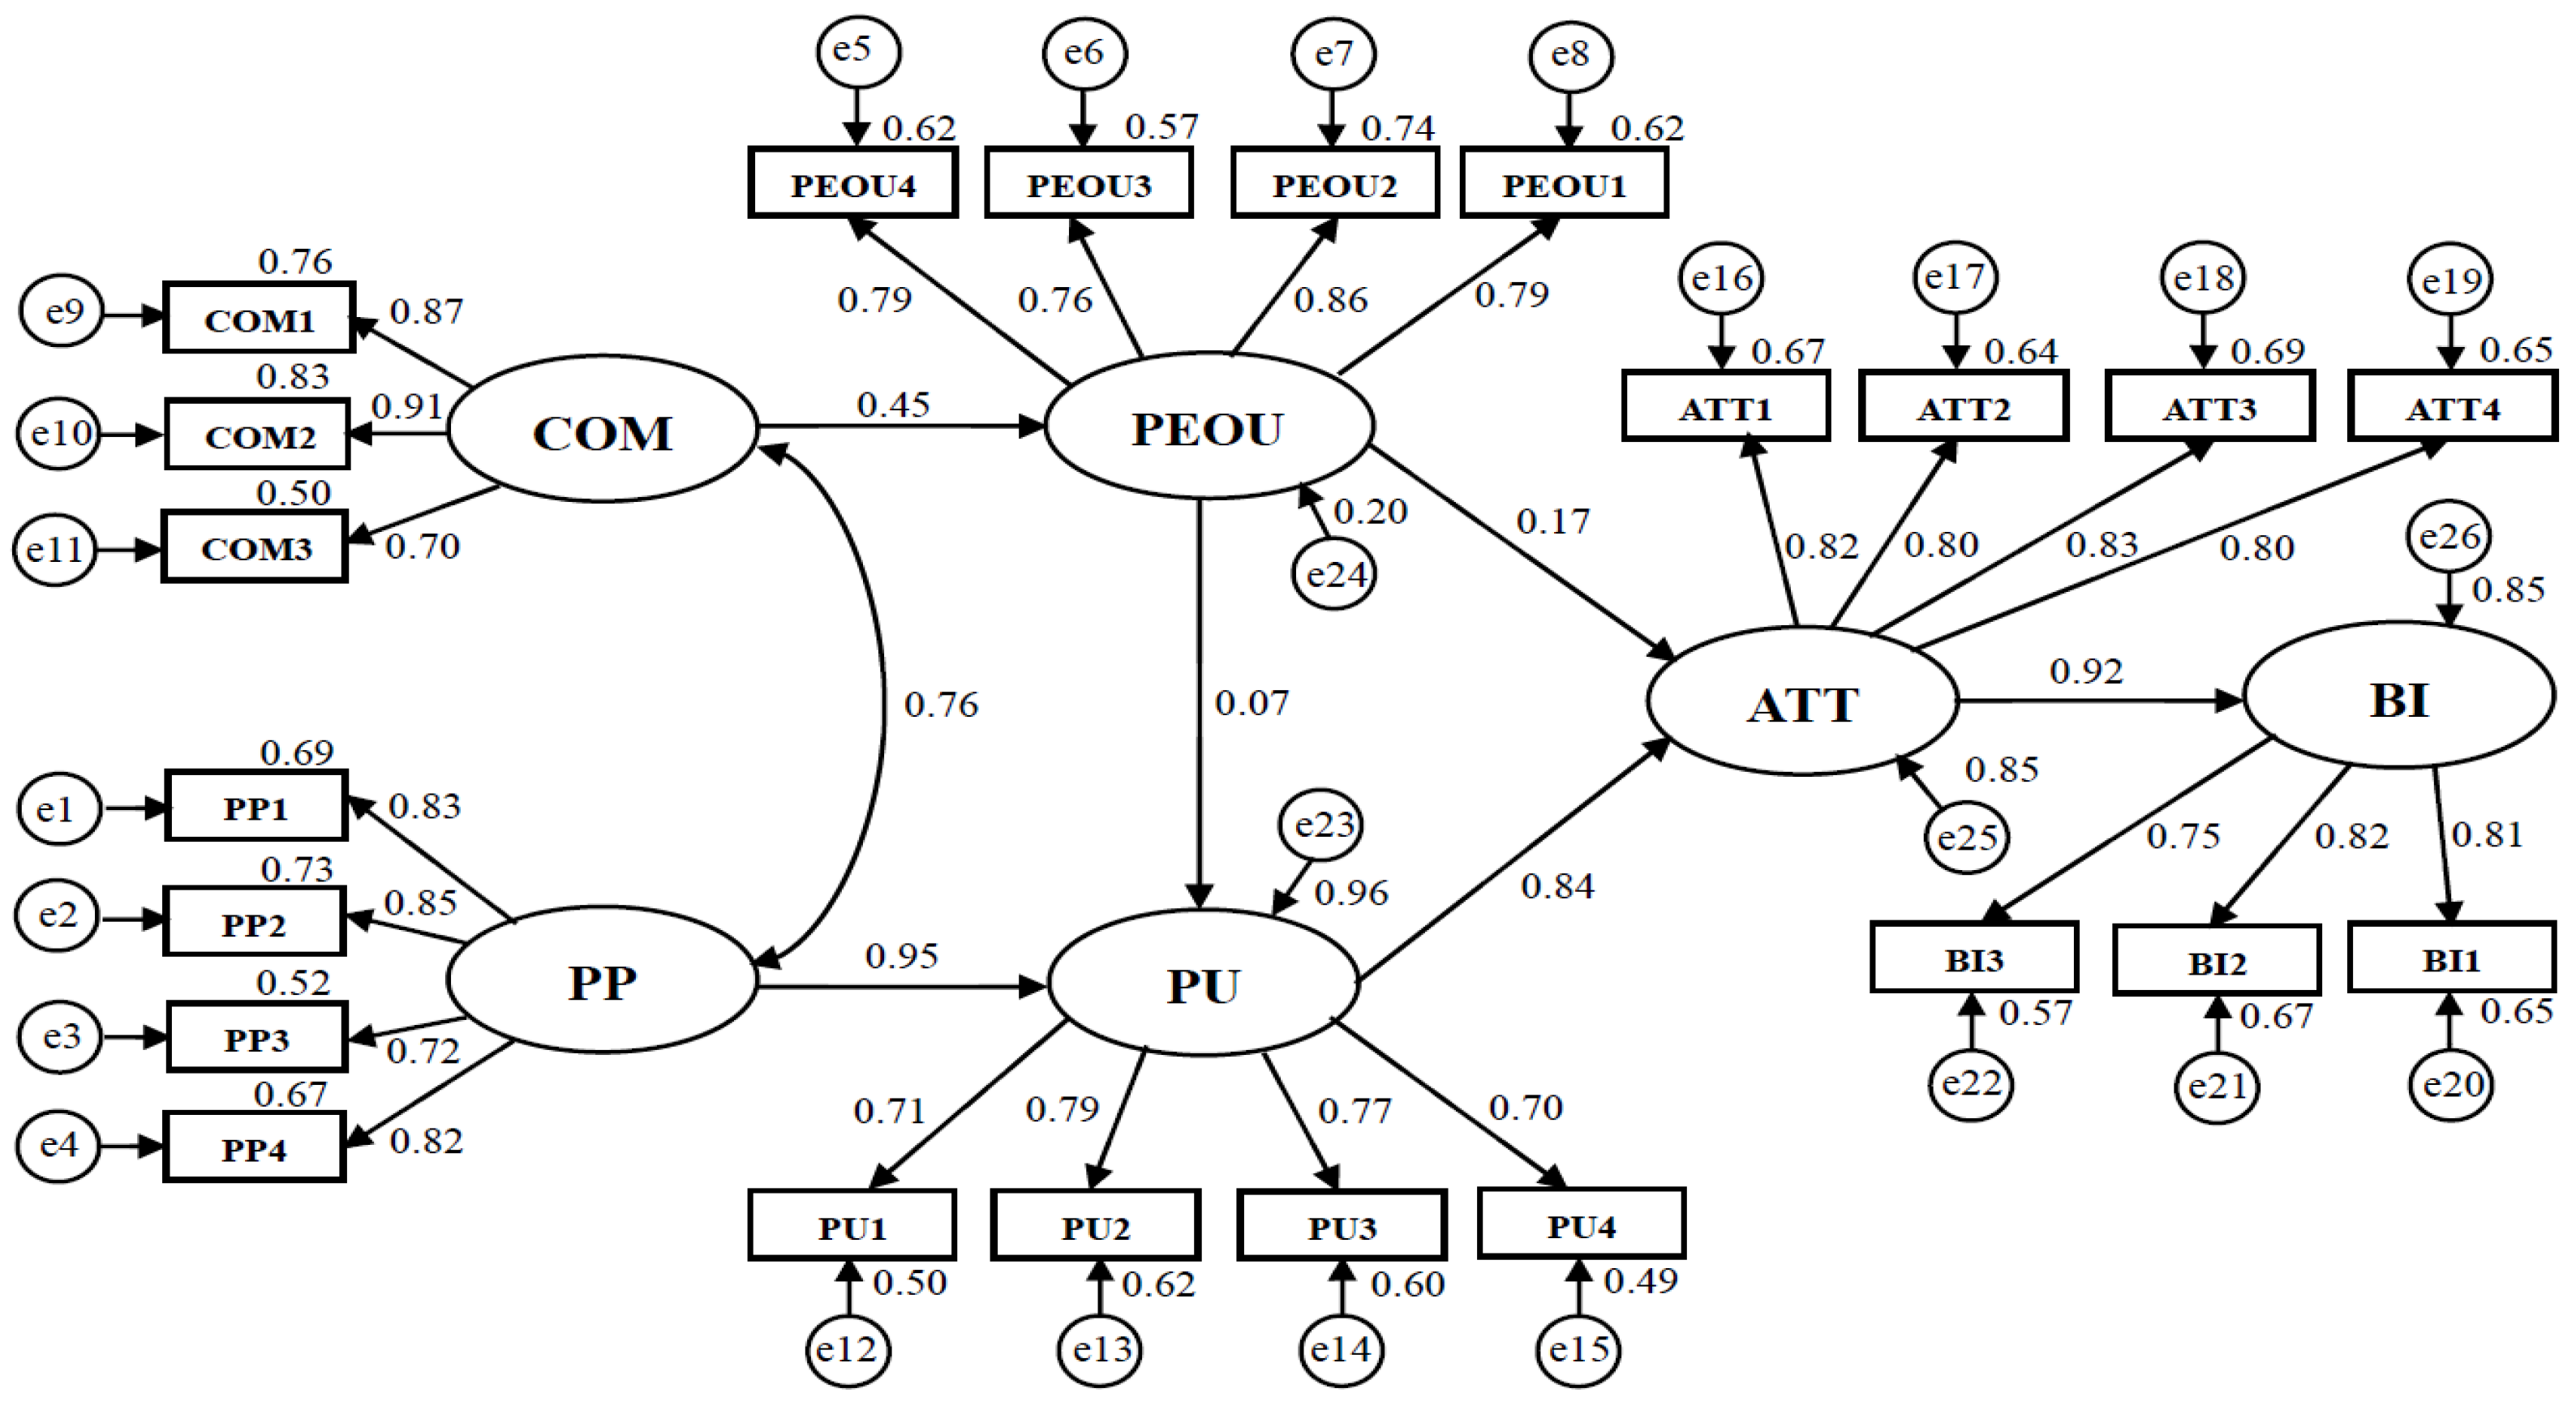
| H1 | PEOU→PU | 0.07 | 1.55 | 0.12 | Not Supported |
| H2 | PEOU→ATT | 0.17 | 3.30 | 0.00 | Supported |
| H3 | PU→ATT | 0.84 | 10.64 | 0.00 | Supported |
| H4 | ATT→BI | 0.92 | 14.09 | 0.00 | Supported |
| H5 | COM→PEOU | 0.45 | 6.17 | 0.00 | Supported |
| H6 | PP→PU | 0.95 | 11.66 | 0.00 | Supported |
Publisher’s Note: MDPI stays neutral with regard to jurisdictional claims in published maps and institutional affiliations. |
© 2022 by the authors. Licensee MDPI, Basel, Switzerland. This article is an open access article distributed under the terms and conditions of the Creative Commons Attribution (CC BY) license (https://creativecommons.org/licenses/by/4.0/).
Share and Cite
Lin, C.-W.; Lin, Y.-S.; Xie, Y.-S.; Chang, J.-H. Understanding the Behavioural Intention to Play the Nintendo Switch: An Extension of the Technology Acceptance Model. Appl. Syst. Innov. 2022, 5, 124. https://doi.org/10.3390/asi5060124
Lin C-W, Lin Y-S, Xie Y-S, Chang J-H. Understanding the Behavioural Intention to Play the Nintendo Switch: An Extension of the Technology Acceptance Model. Applied System Innovation. 2022; 5(6):124. https://doi.org/10.3390/asi5060124
Chicago/Turabian StyleLin, Chih-Wei, Yu-Sheng Lin, Yi-Sheng Xie, and Jui-Hsiu Chang. 2022. "Understanding the Behavioural Intention to Play the Nintendo Switch: An Extension of the Technology Acceptance Model" Applied System Innovation 5, no. 6: 124. https://doi.org/10.3390/asi5060124