Mechanical Properties of 3D-Printed Components Using Fused Deposition Modeling: Optimization Using the Desirability Approach and Machine Learning Regressor

 ,
,
Abstract
:1. Introduction
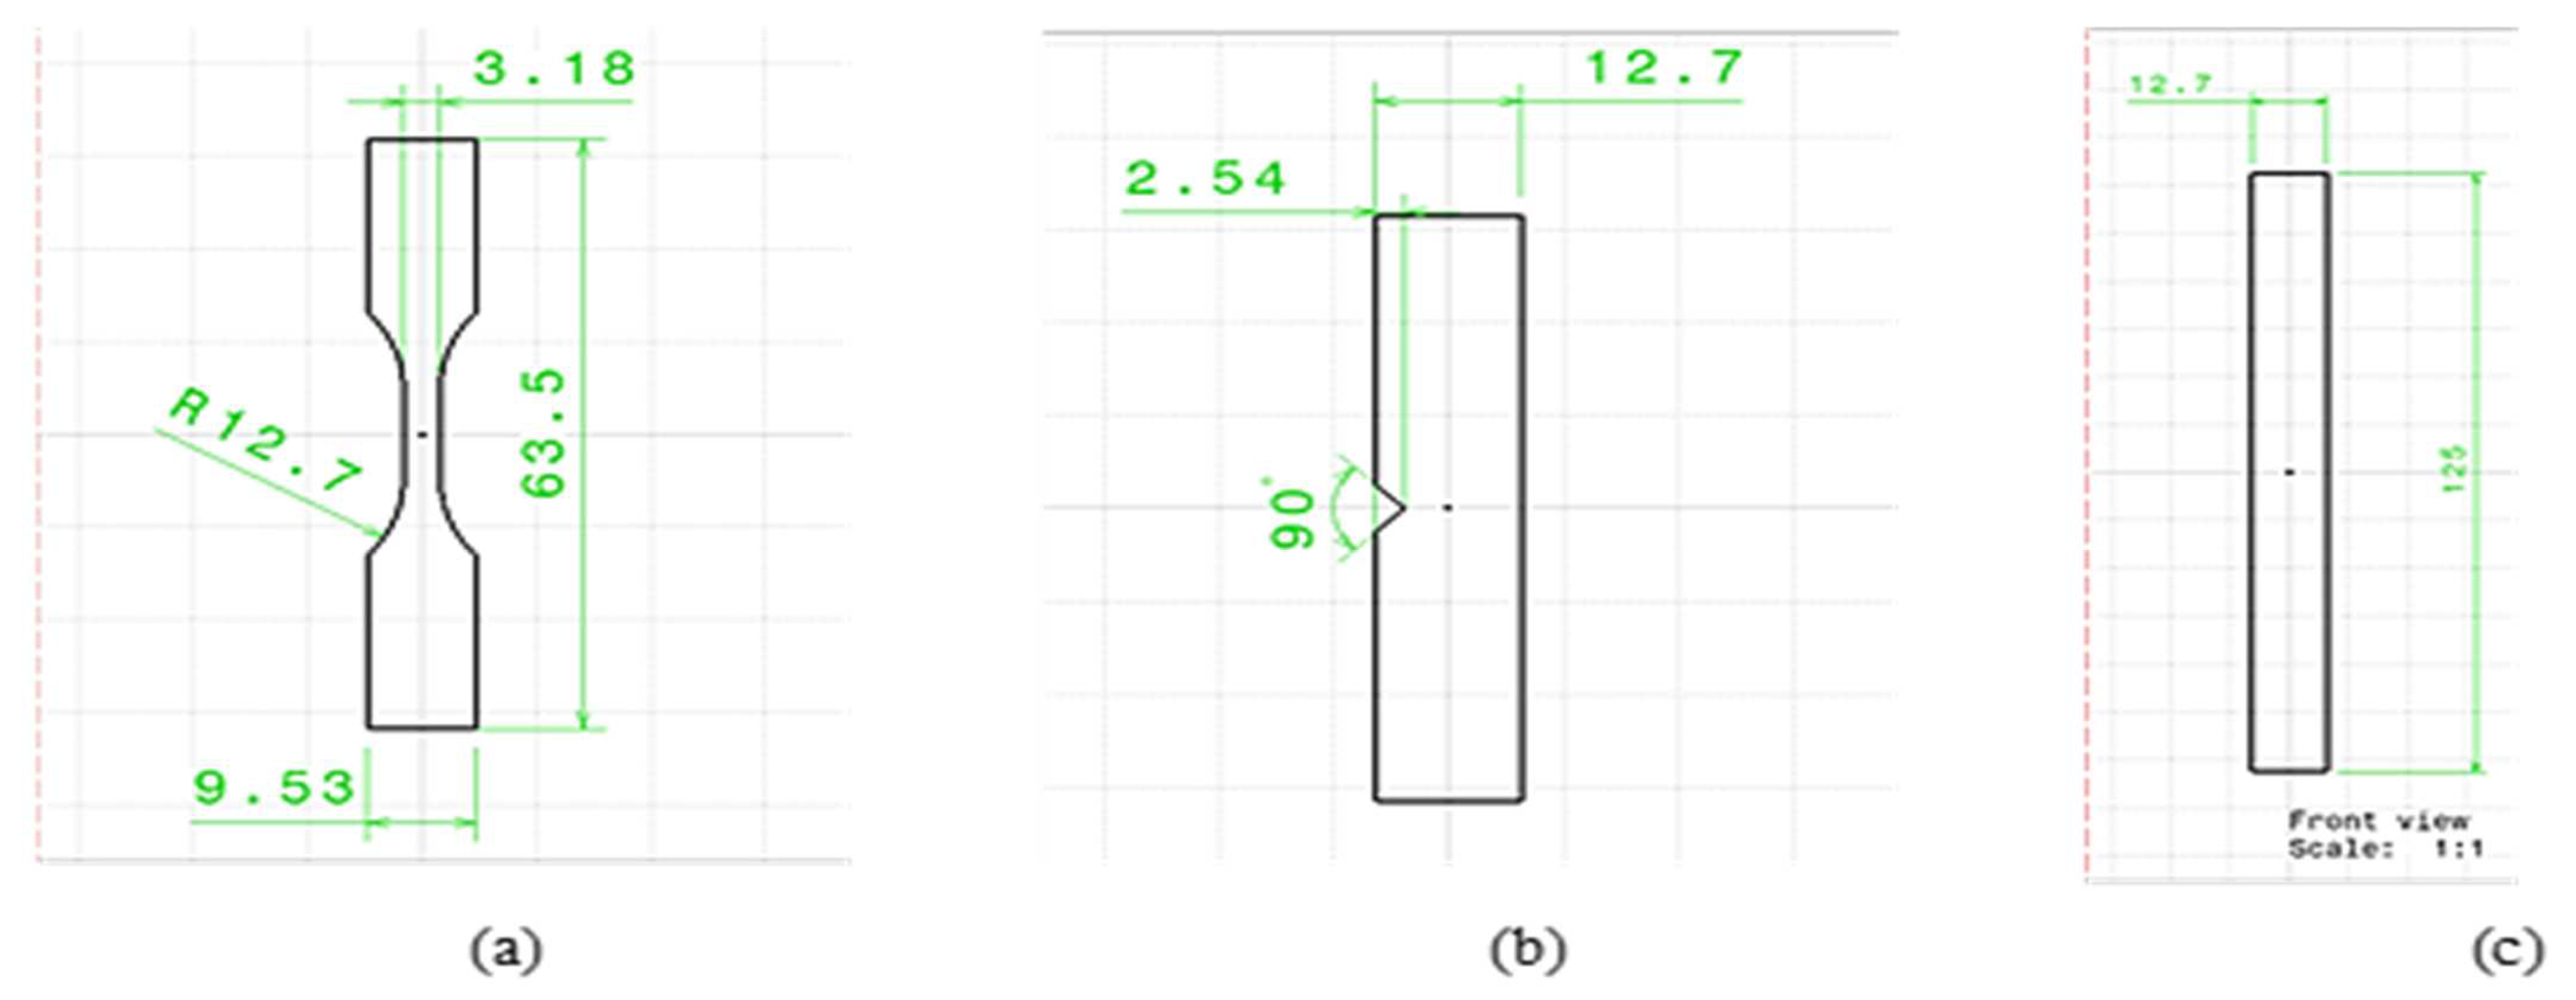
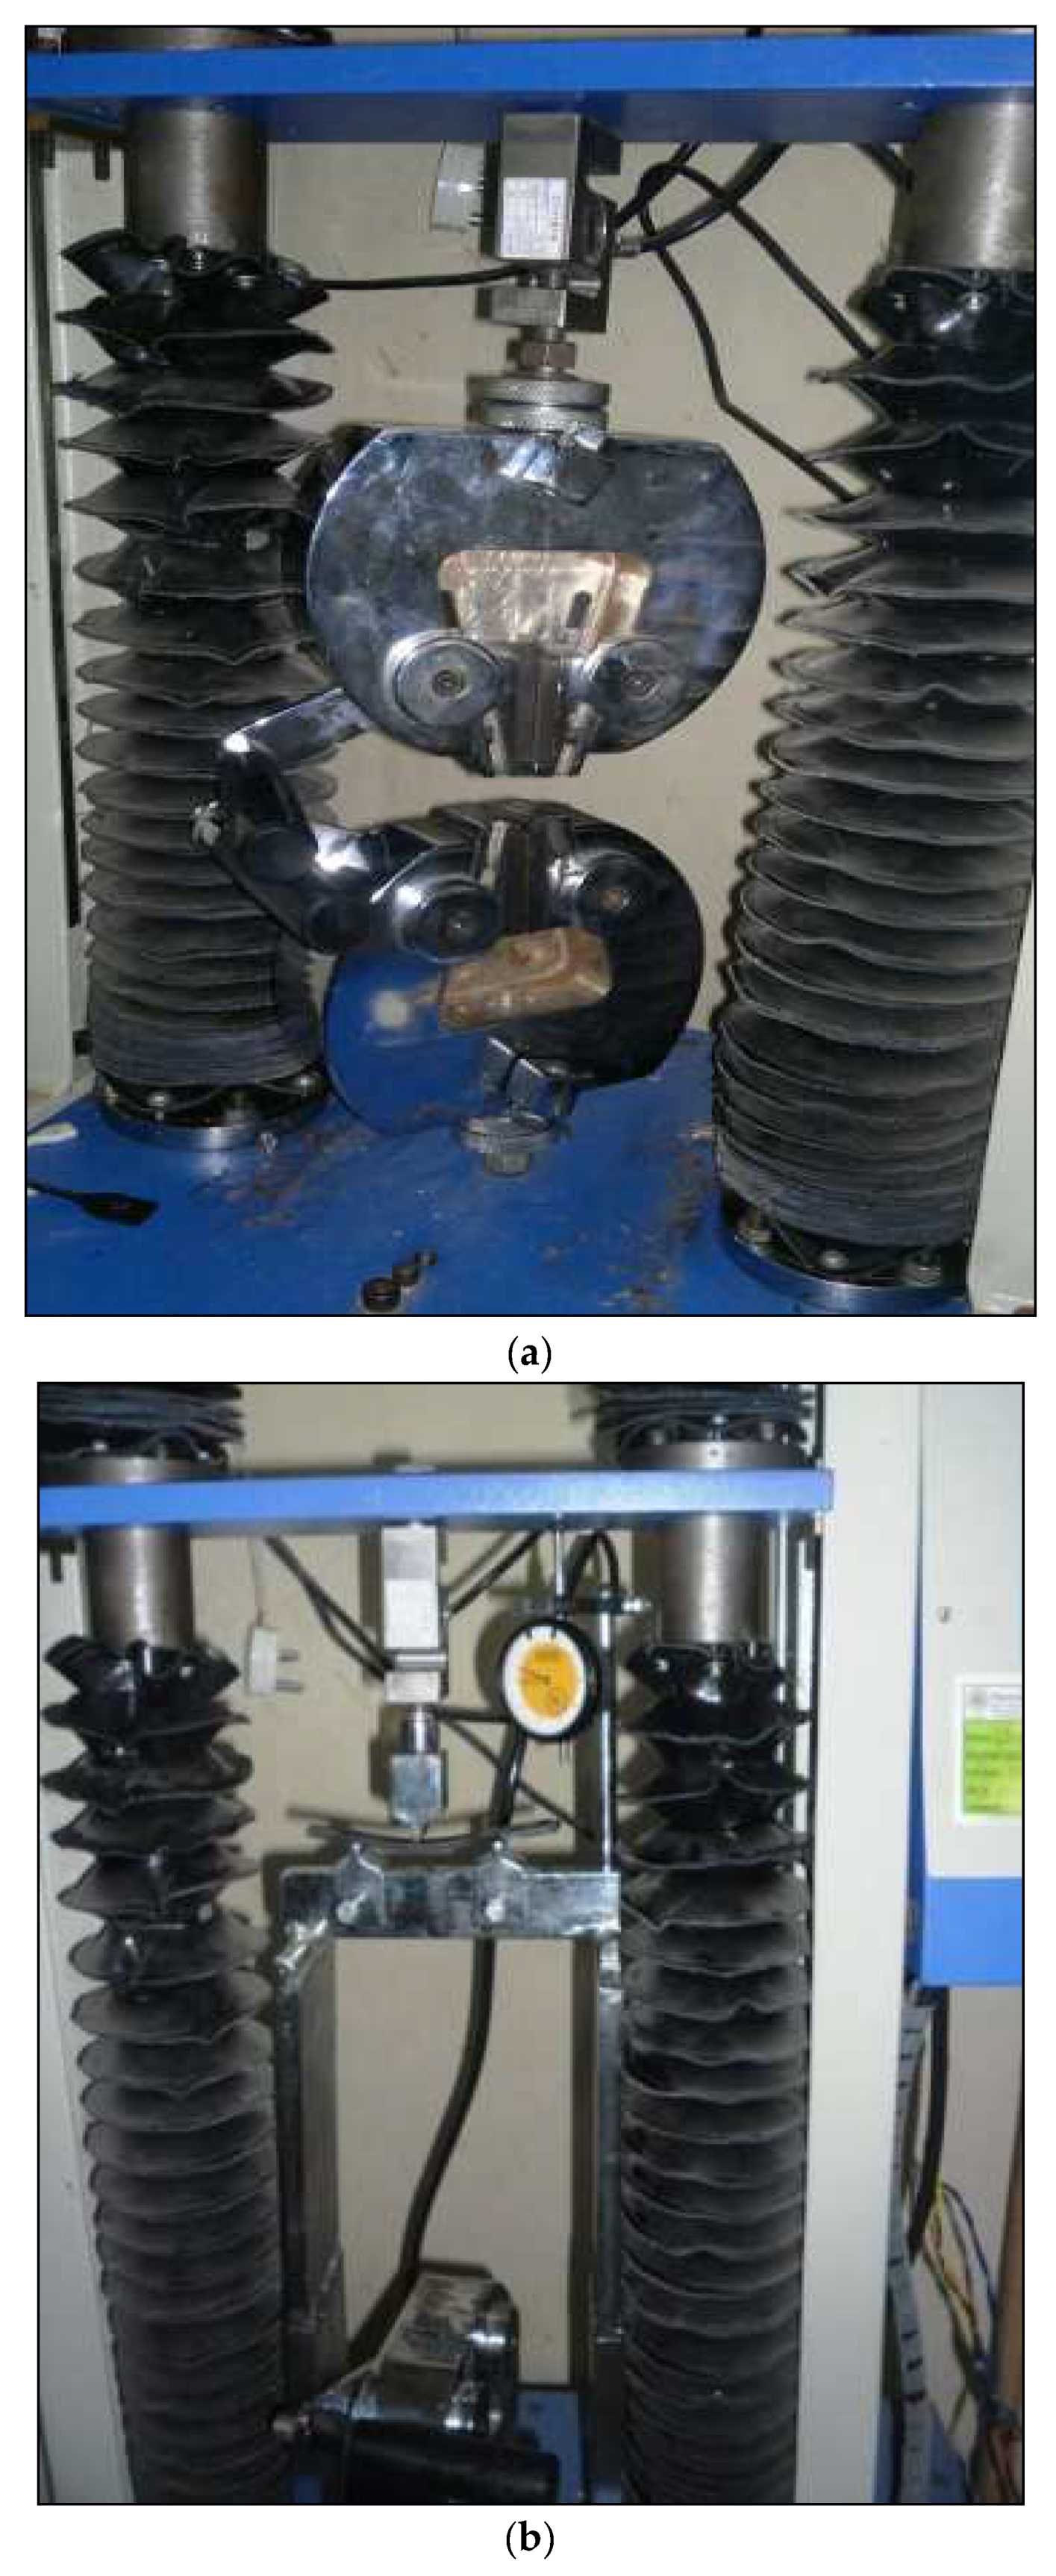
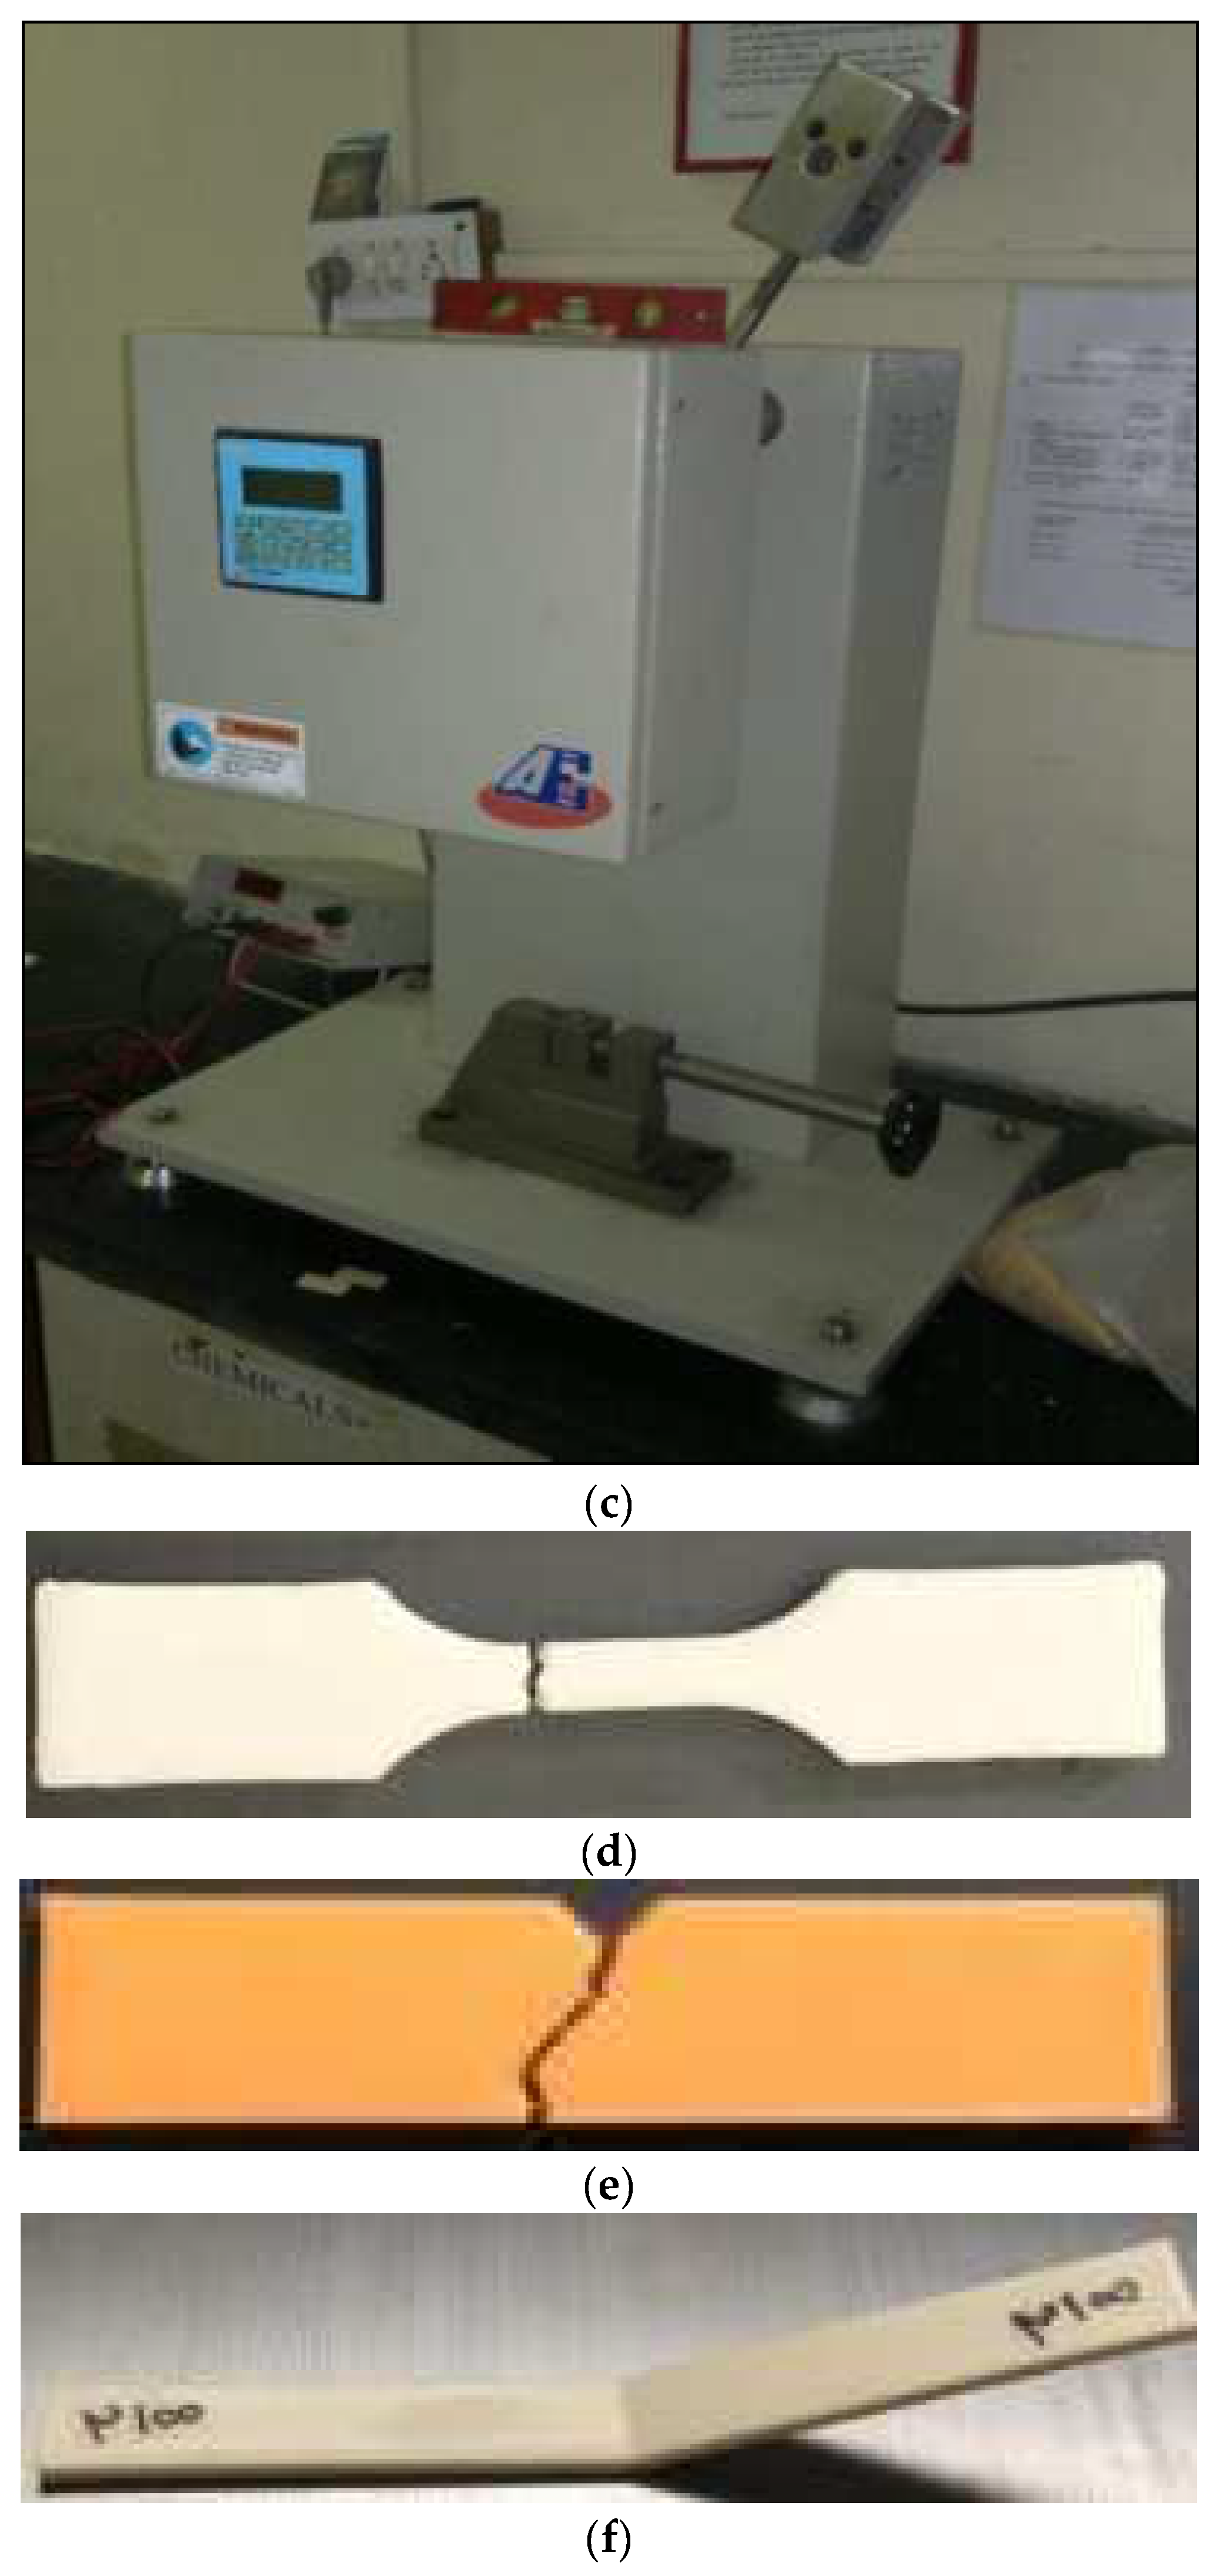
2. Materials and Methods
- Infill Percentage—The infill percentage measures the amount of material inside the fabricated part. It represents the density of the part. The infill percentage is set according to the part’s requirement. The values for the infill percentage are chosen as 10, 33, 55, 78, and 100%.
- Layer Thickness—In FDM, the thickness of a single layer deposited by the nozzle is the layer thickness. The type of nozzle used decides the paper thickness. The nozzle diameter used in this case is 0.4 mm. The values for the layer height are chosen as 0.08 mm, 0.16 mm, 0.24 mm, 0.32 mm, and 0.4 mm.
- Print Speed—The speed of the nozzle with which the material will be deposited is denoted as the print speed. A very high printing speed will cause the wear and tear of physical parts and lead to improper distribution of materials. Moreover, a low printing speed is not suitable as it will increase the time required to print one specimen. Hence, the values for print speed are set as 20, 35, 50, 65, and 80 mm/s.
- Extrusion Temperature—The extrusion temperature is the temperature at which the material is extruded from the nozzle. The extruder contains a heater that heats the material up to a semi-liquid state. As the temperature increases, the viscosity of the material increases. As a result, it is necessary to set the extruder temperature within the limits where semi-liquid materials can be kept. The capacity of the heating system decides the temperatures at which materials are extruded. Temperatures are set at 190, 200, 210, 220, and 230 °C.
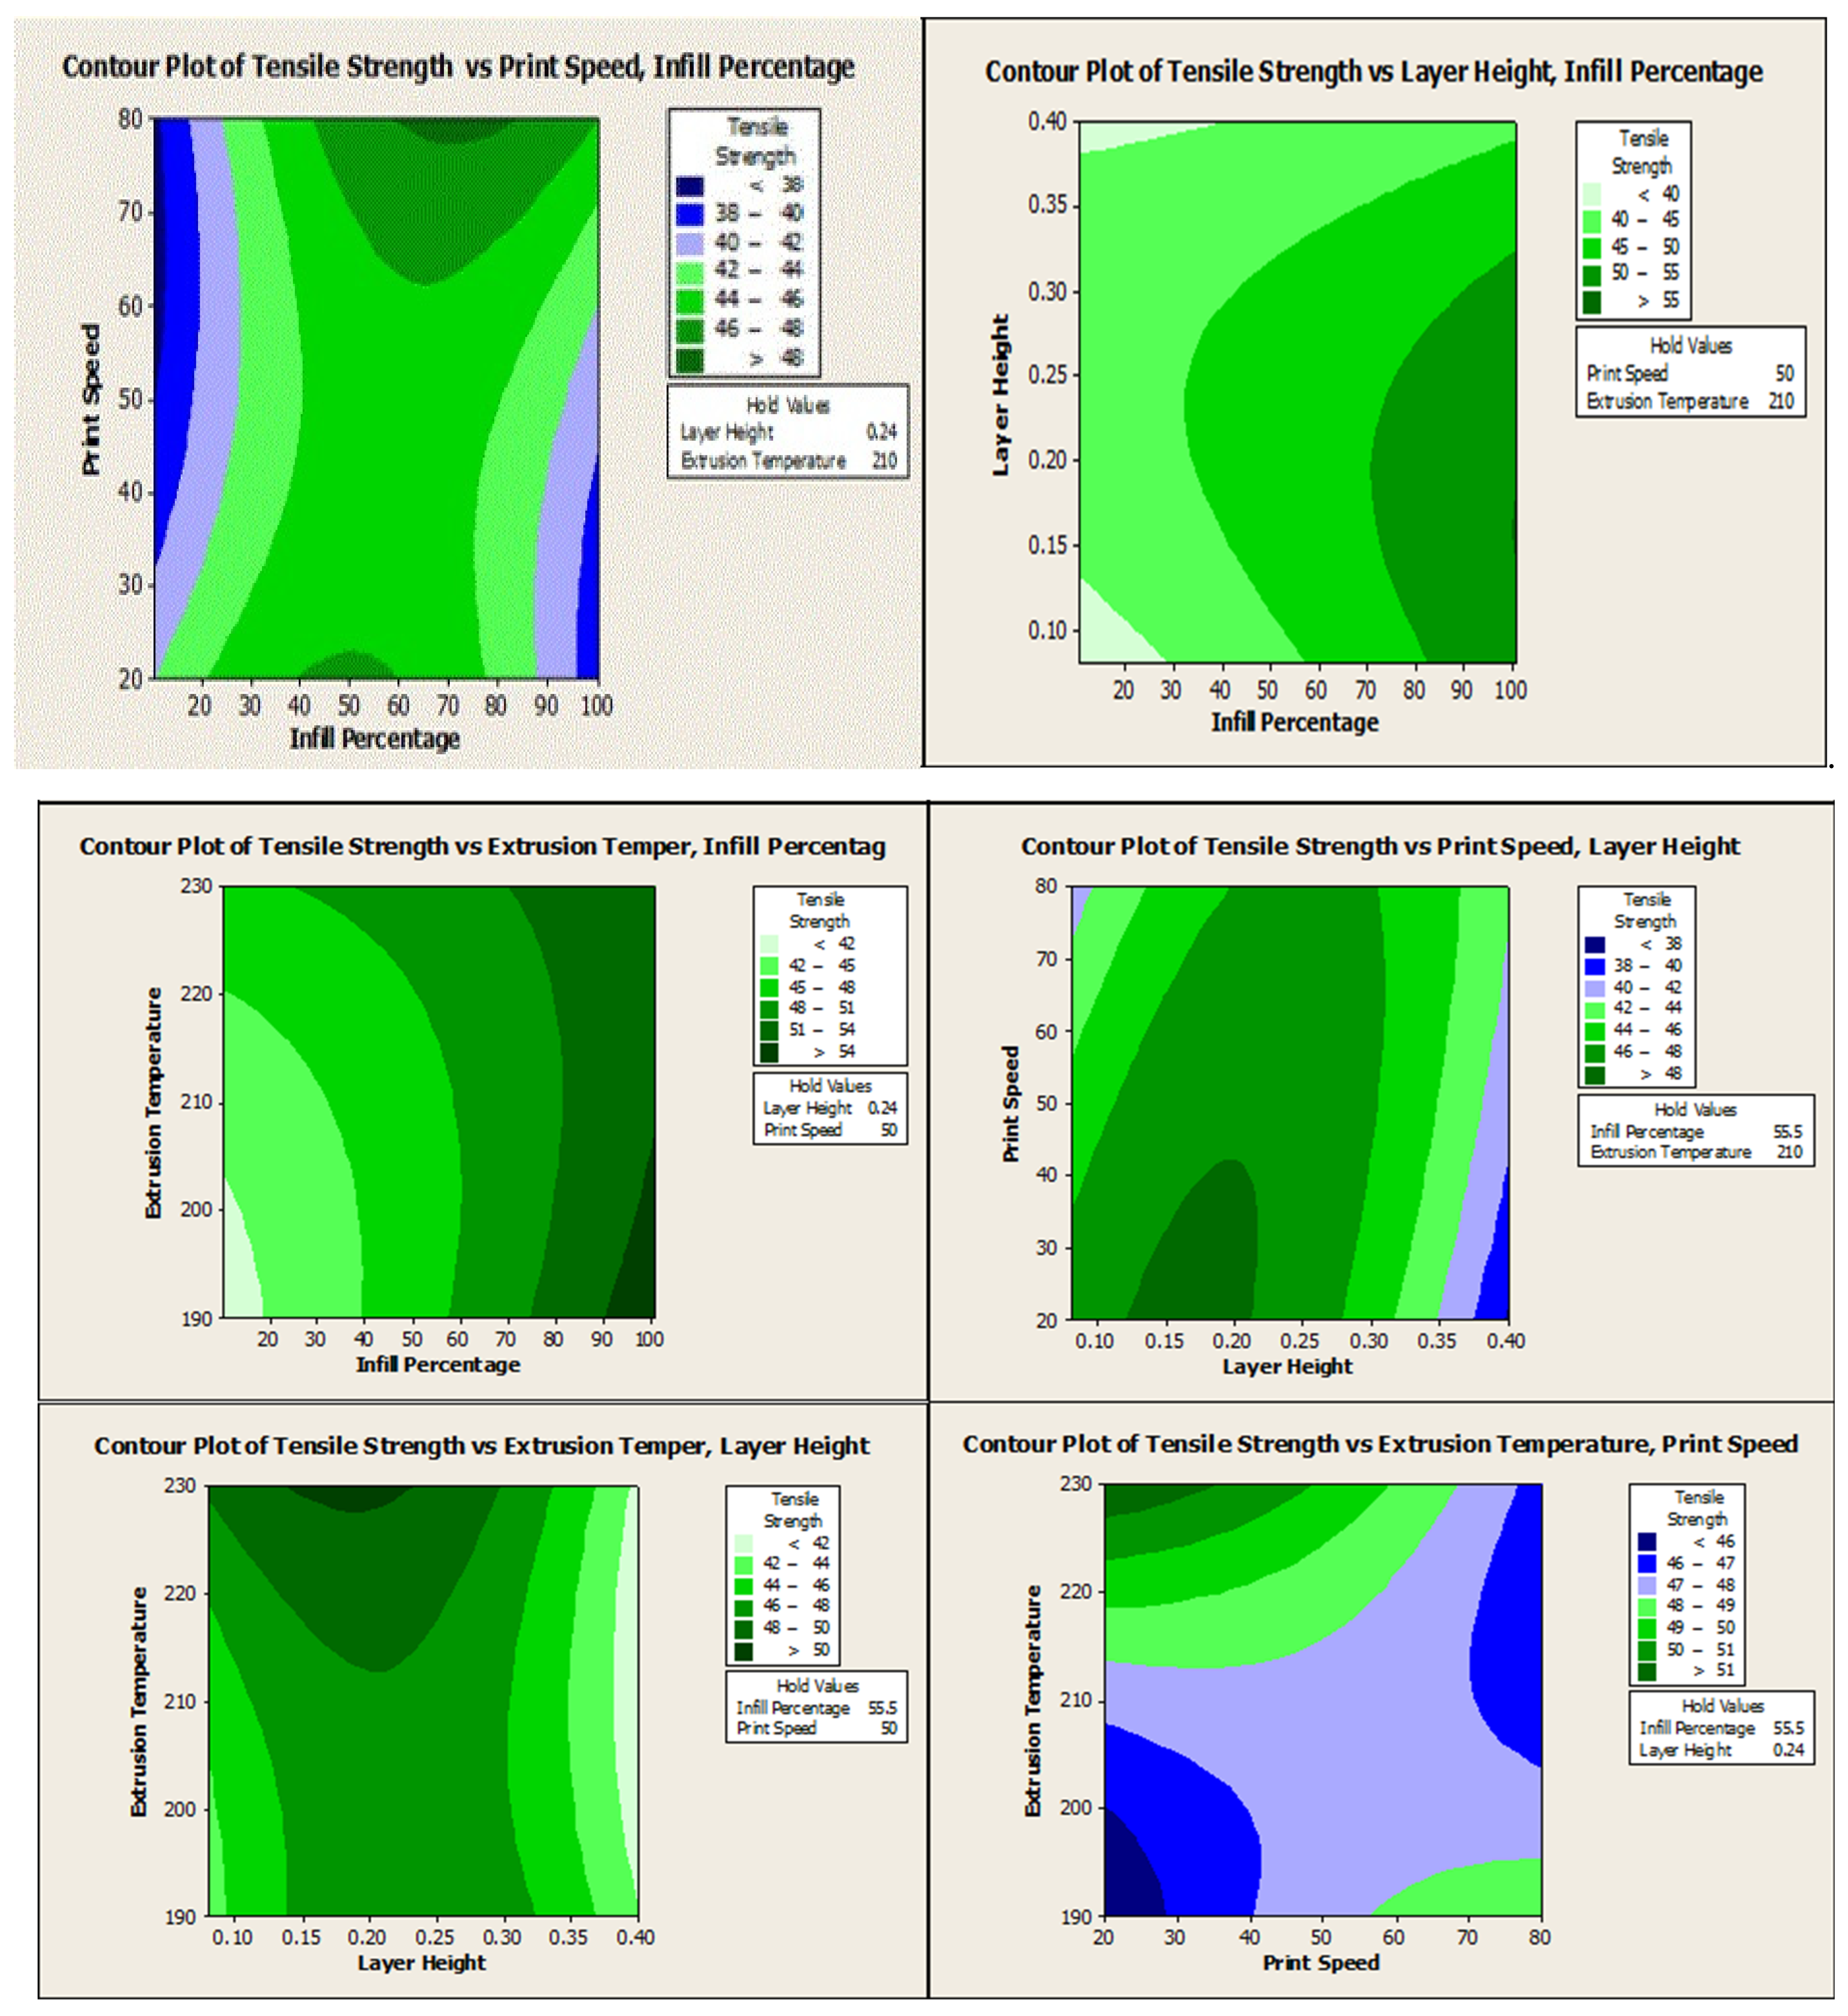
3. Results and Discussion
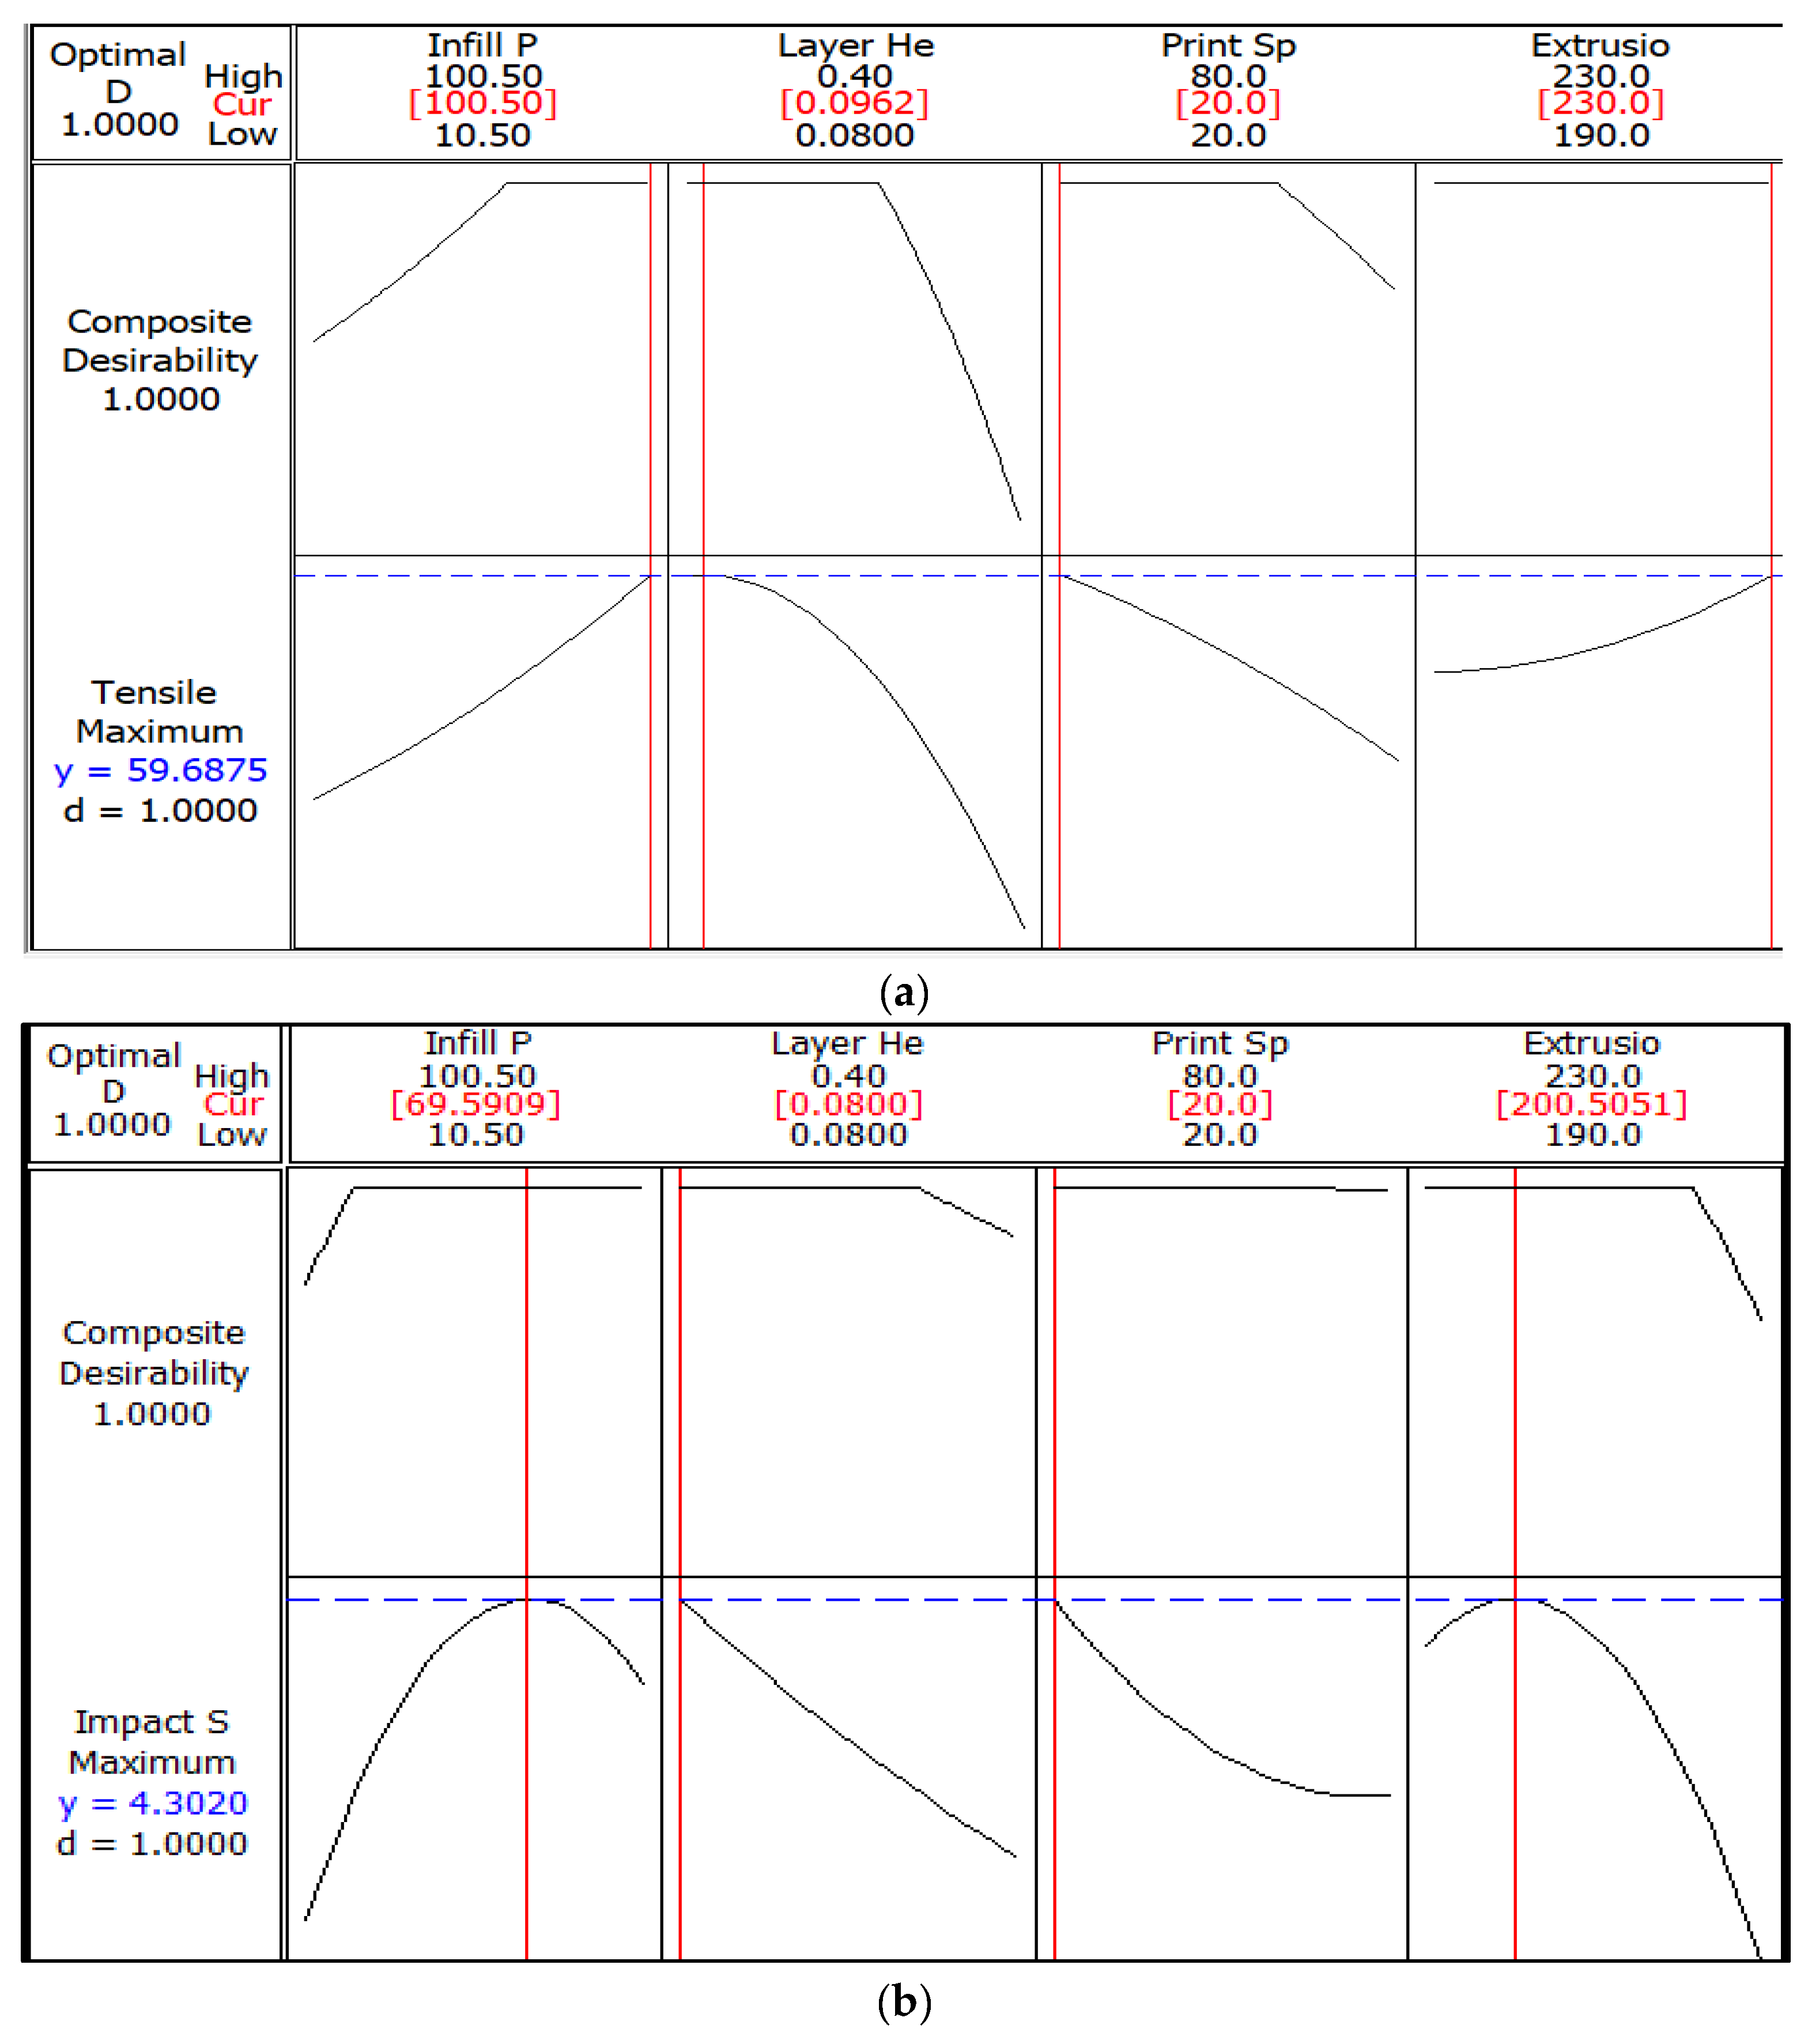
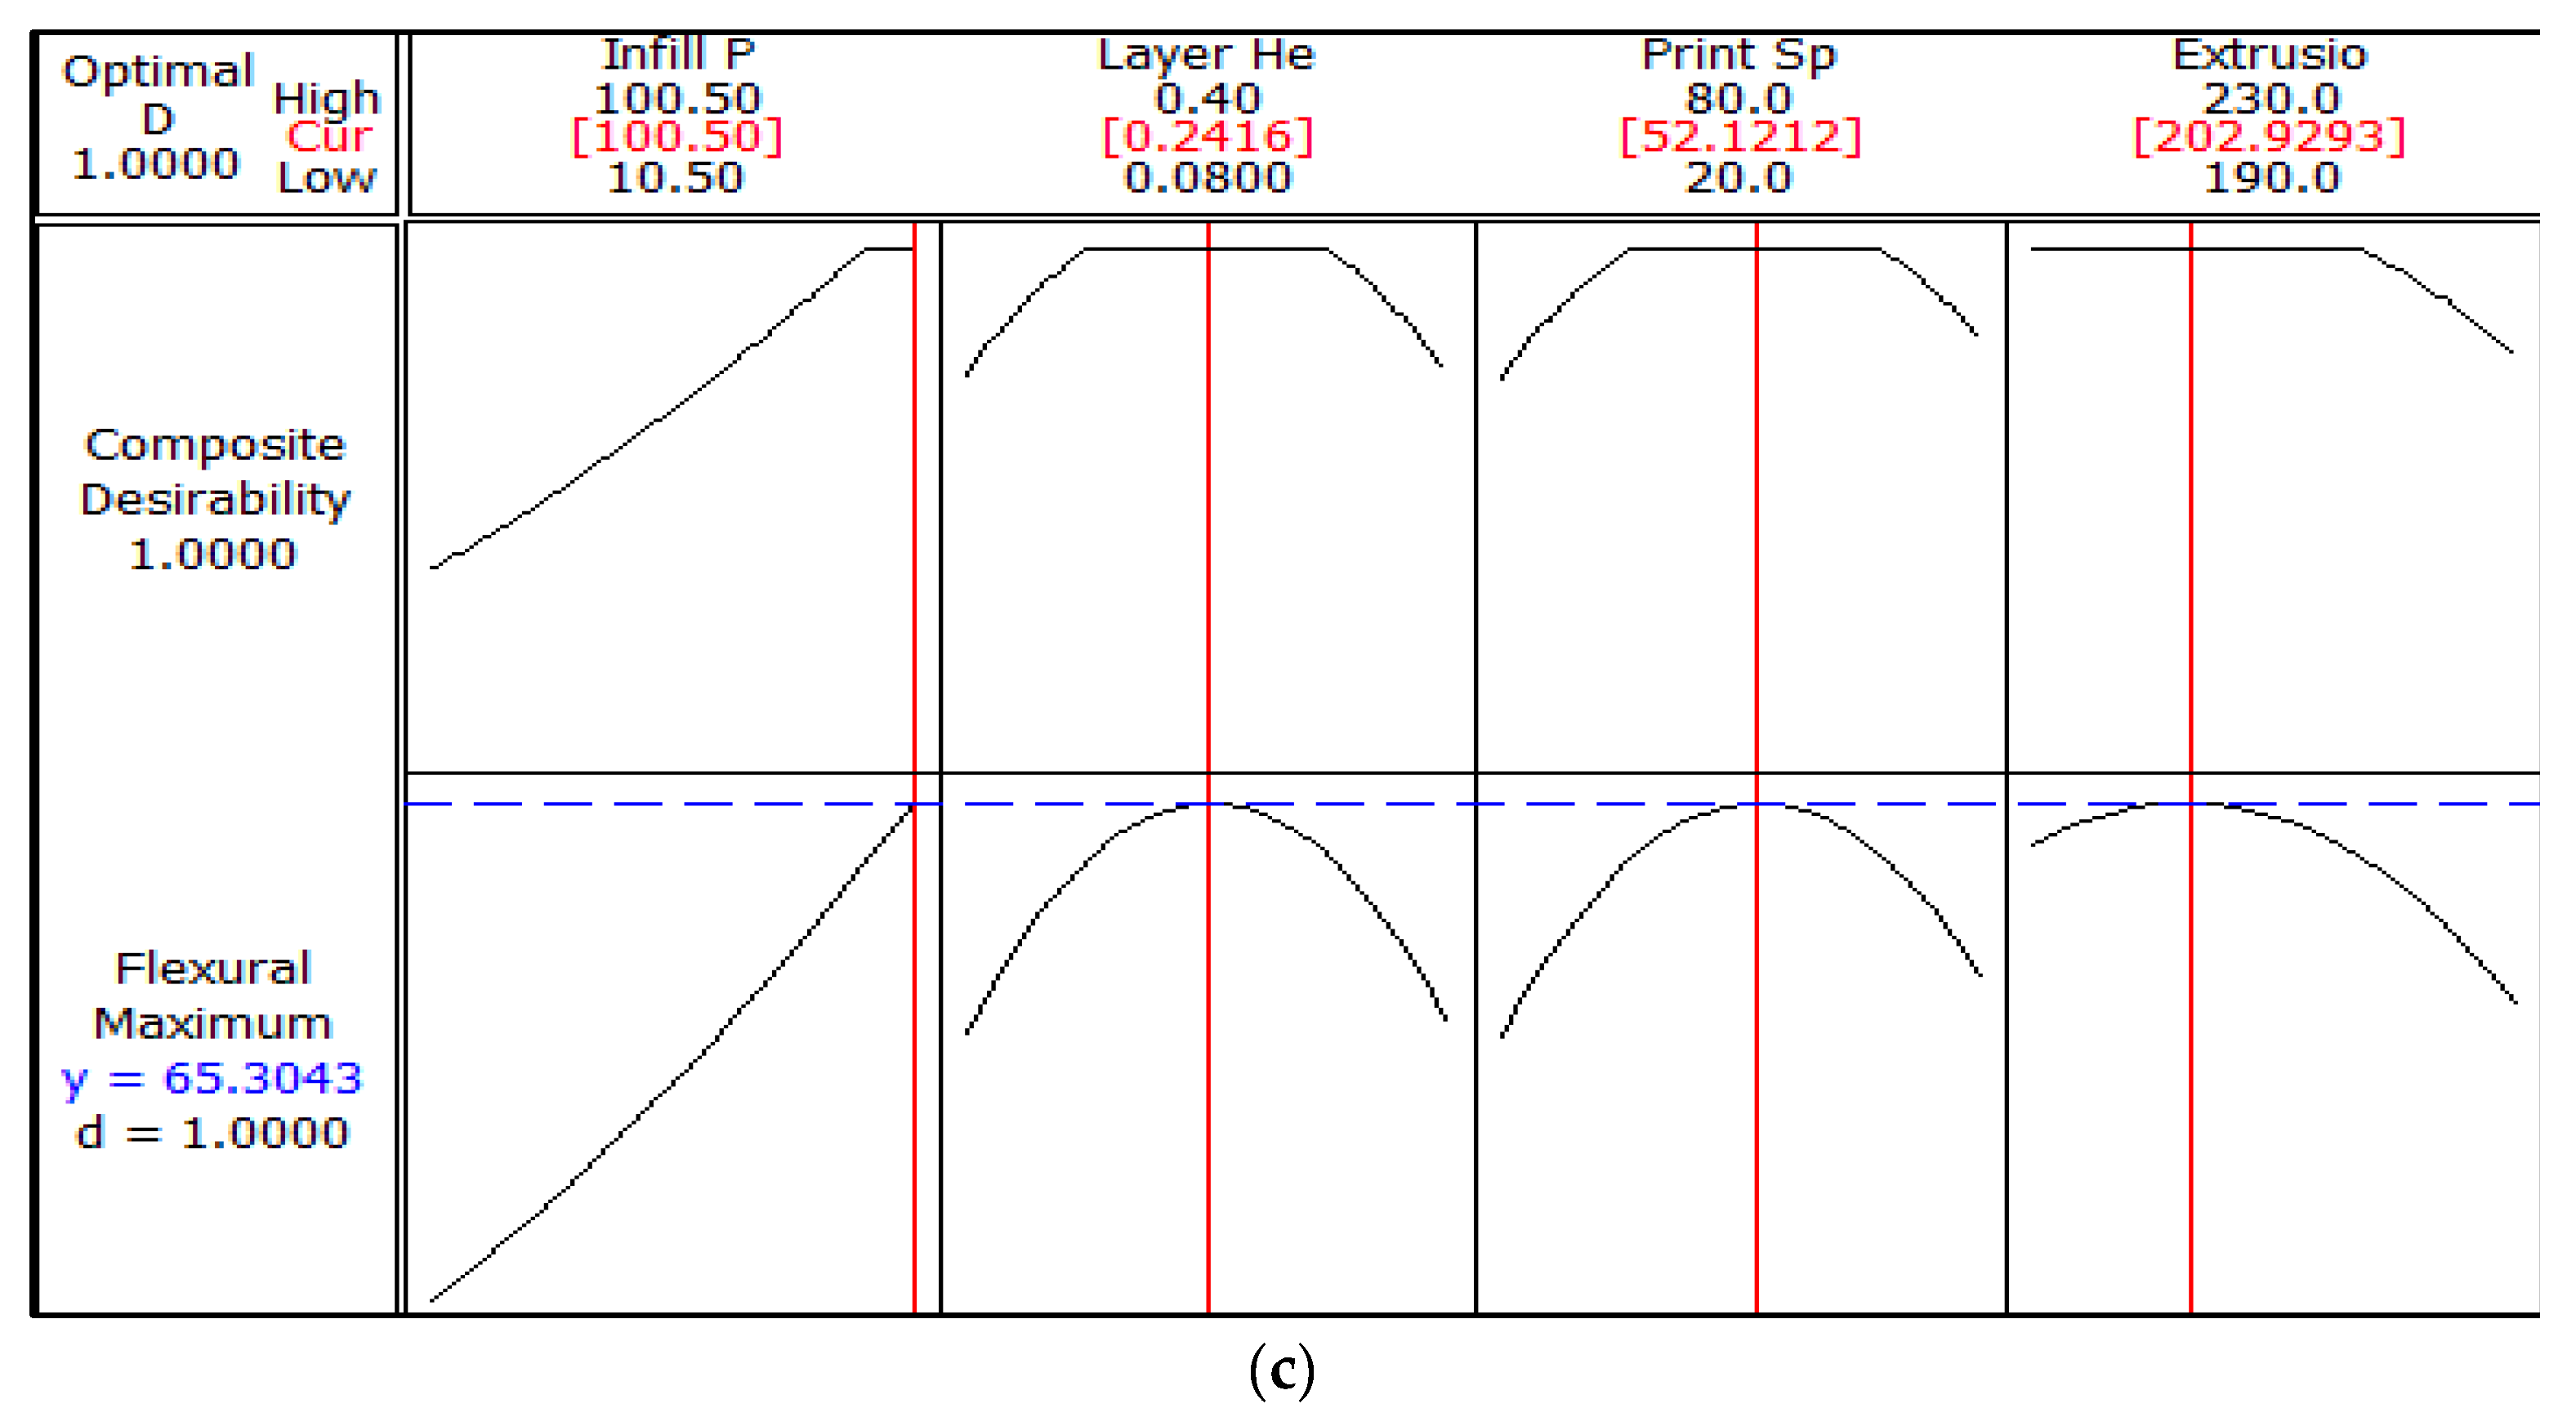
3.1. Analysis Using Desirability Approach
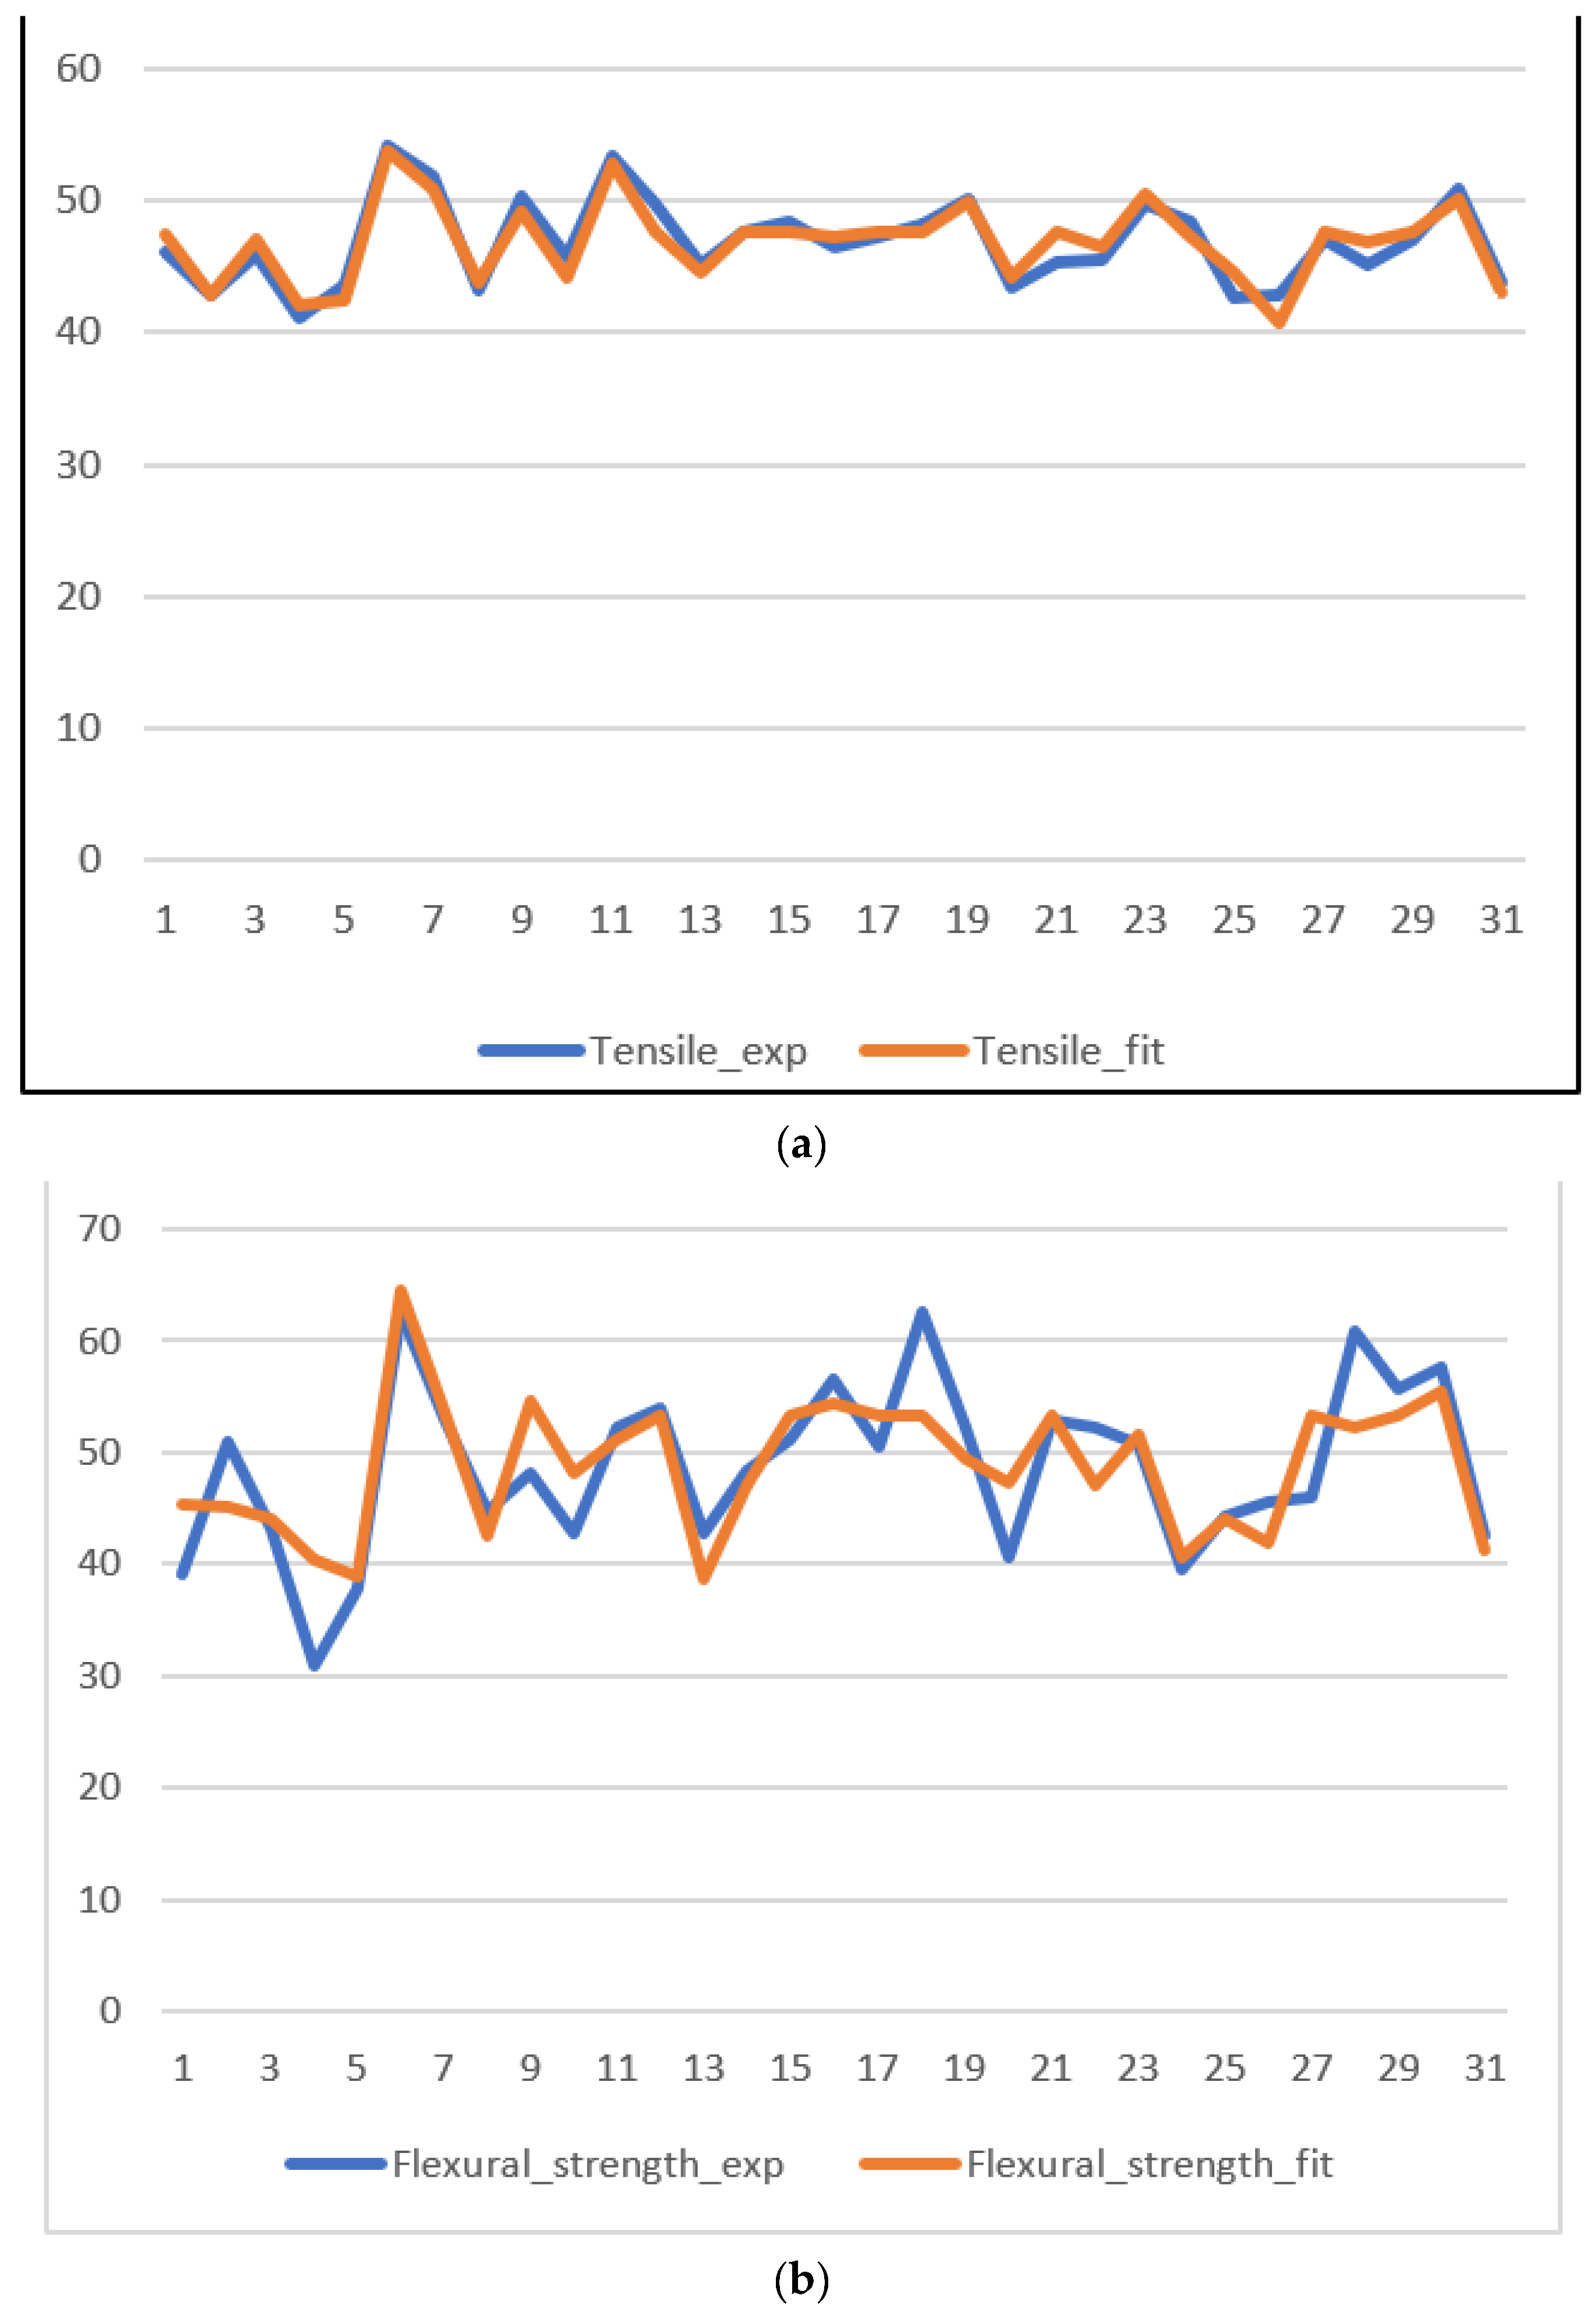
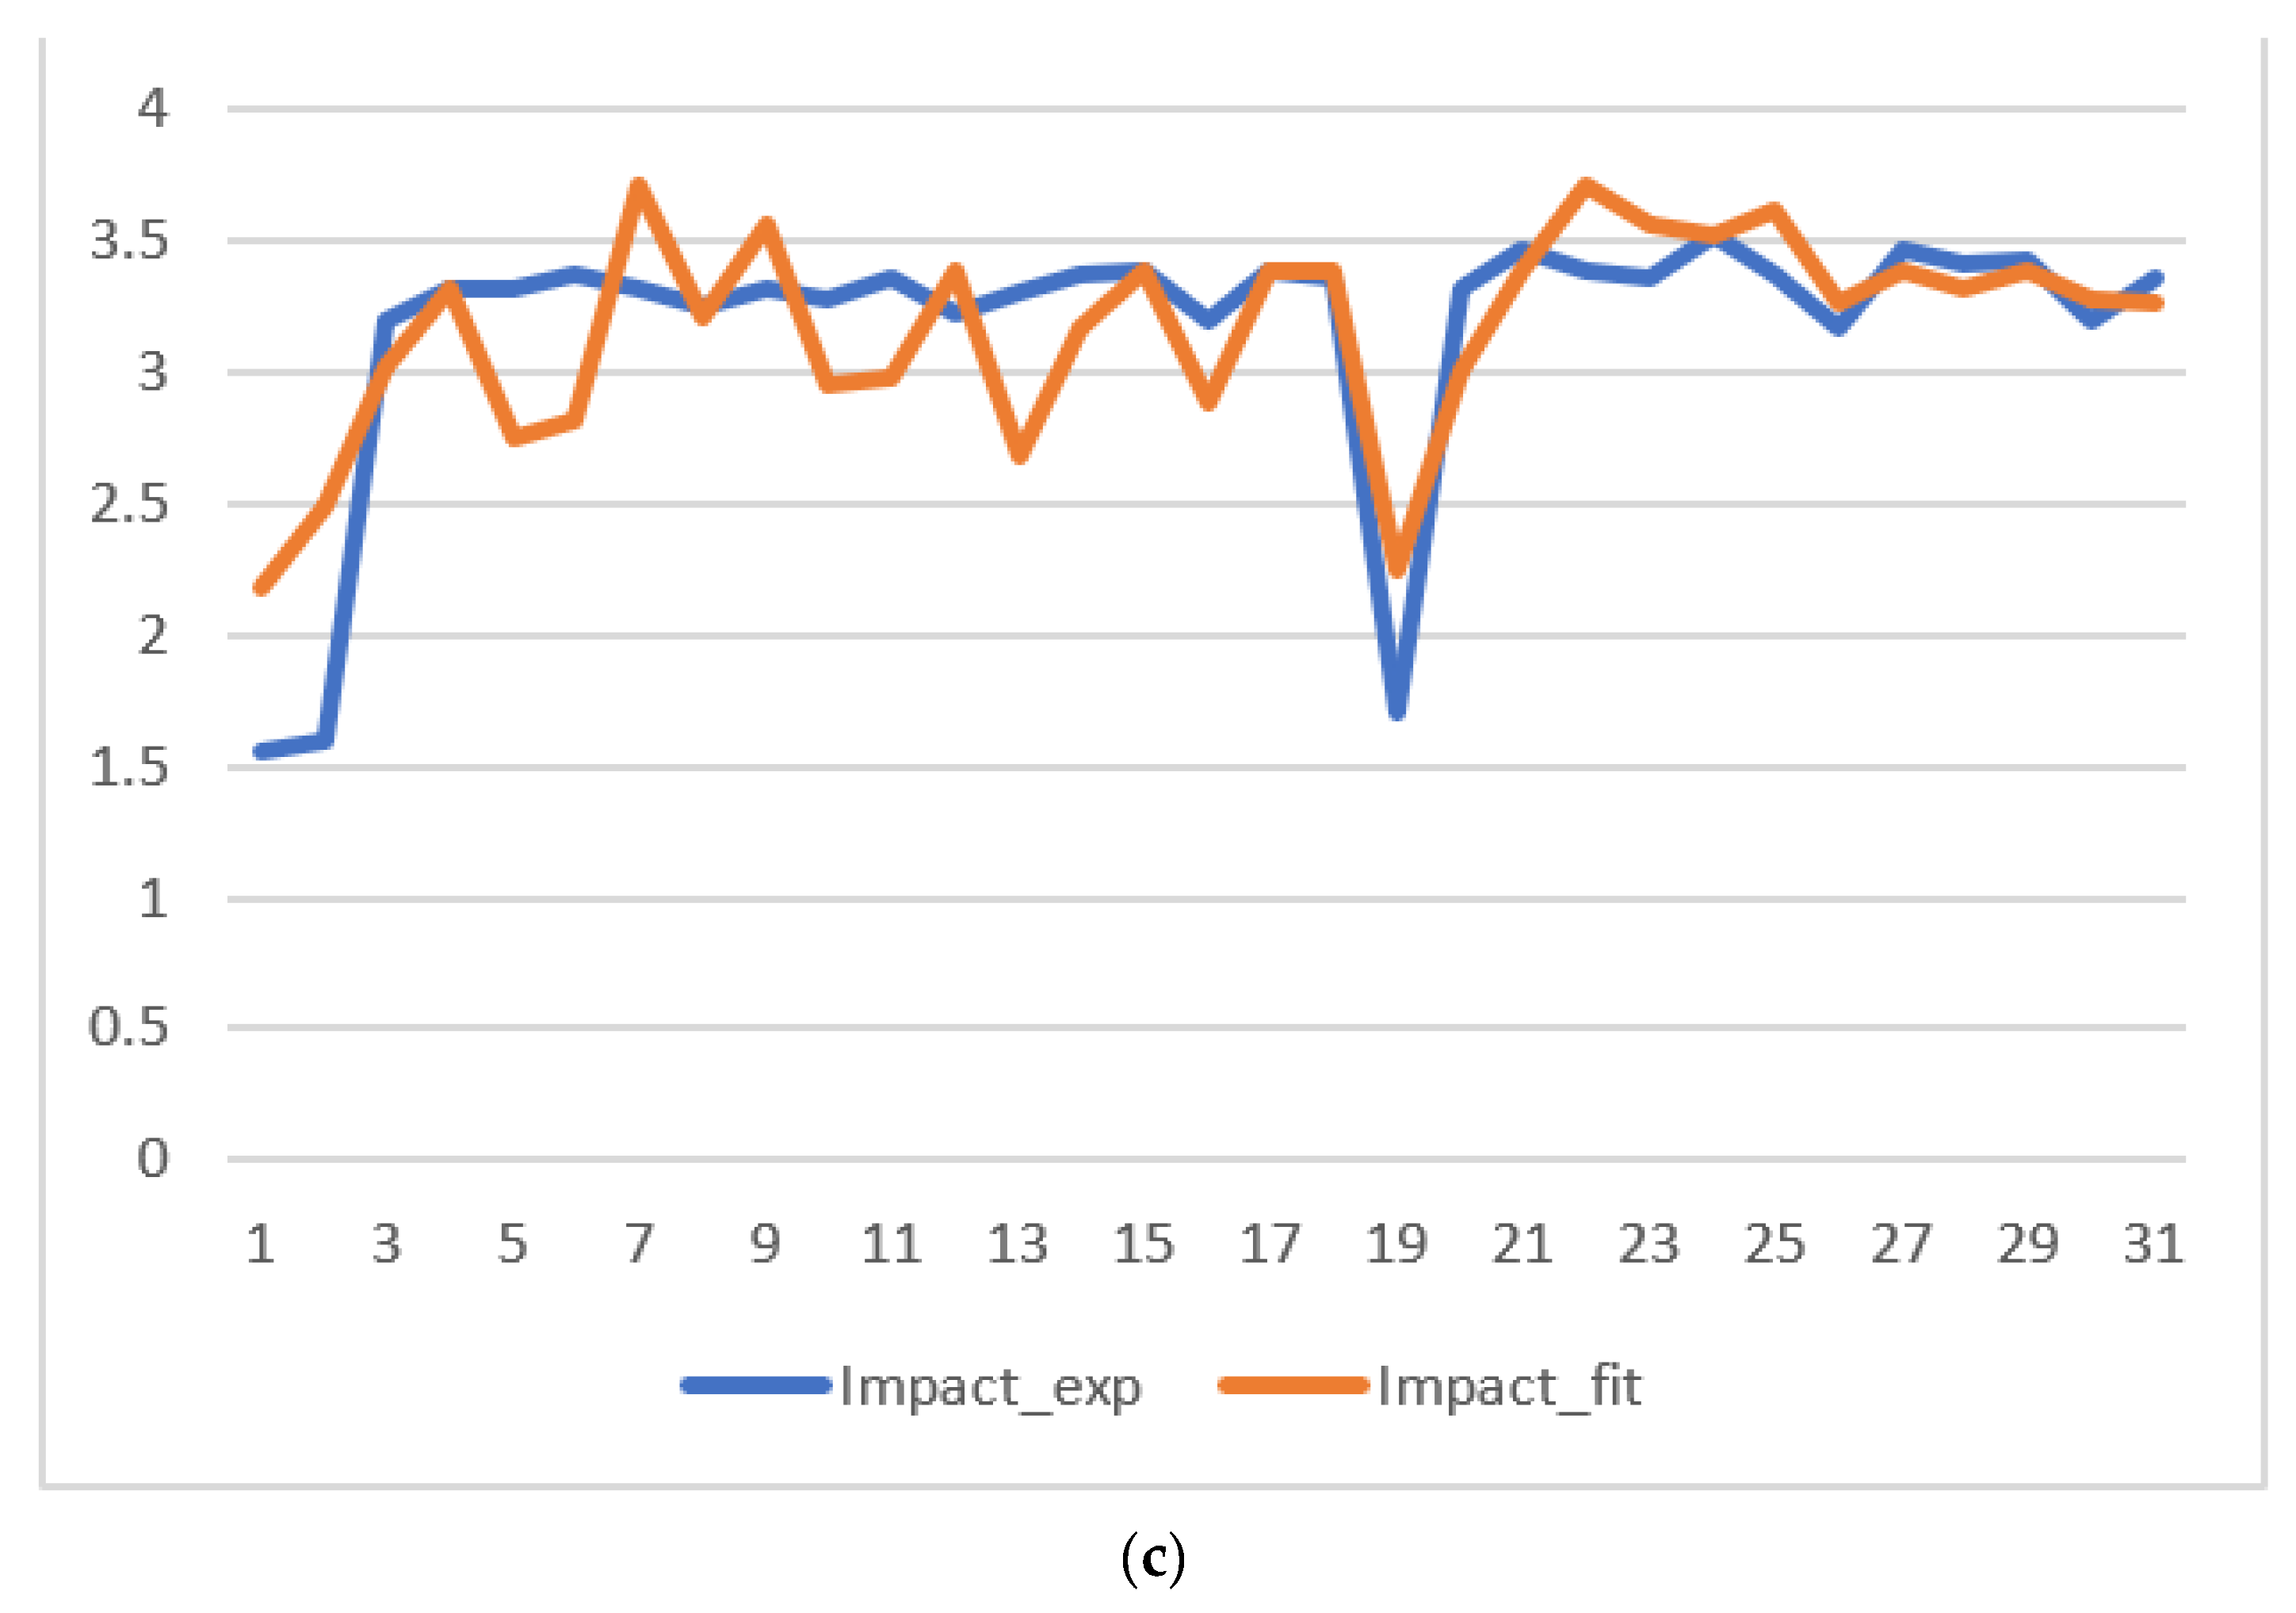
3.2. Analysis by Machine Learning Using a Nonlinear Regressor
3.3. Comparison of Results
4. Conclusions
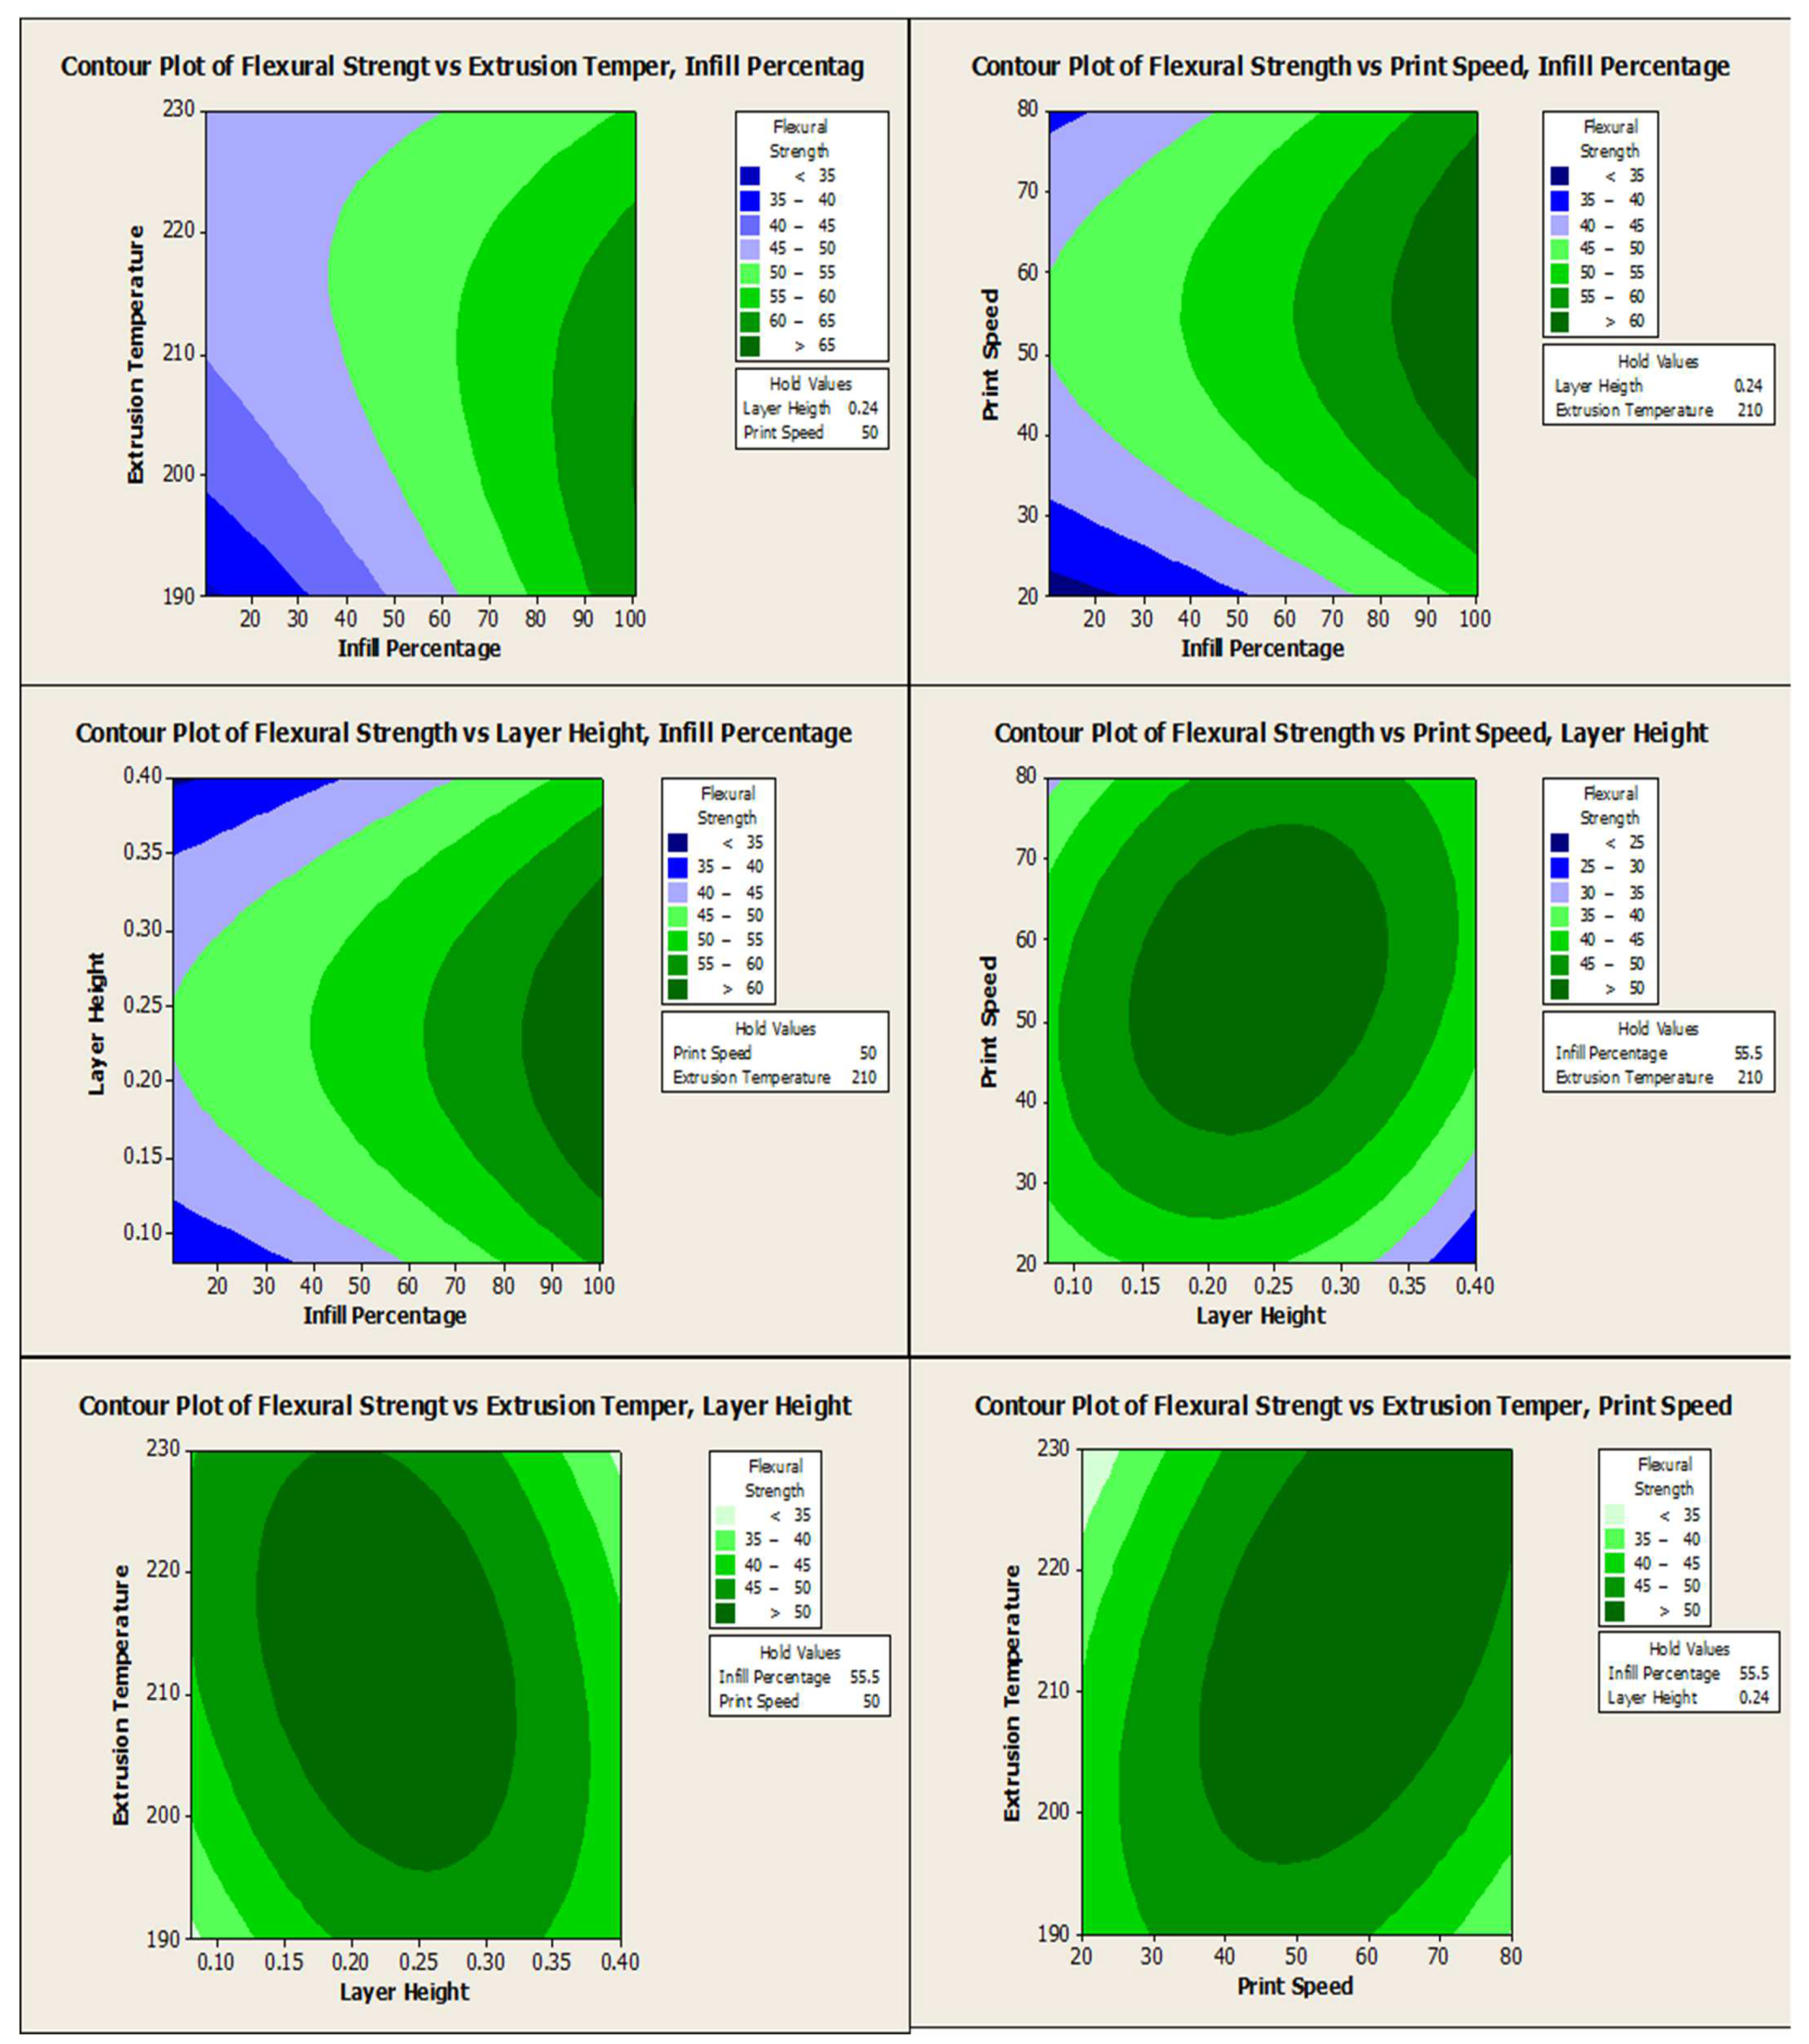
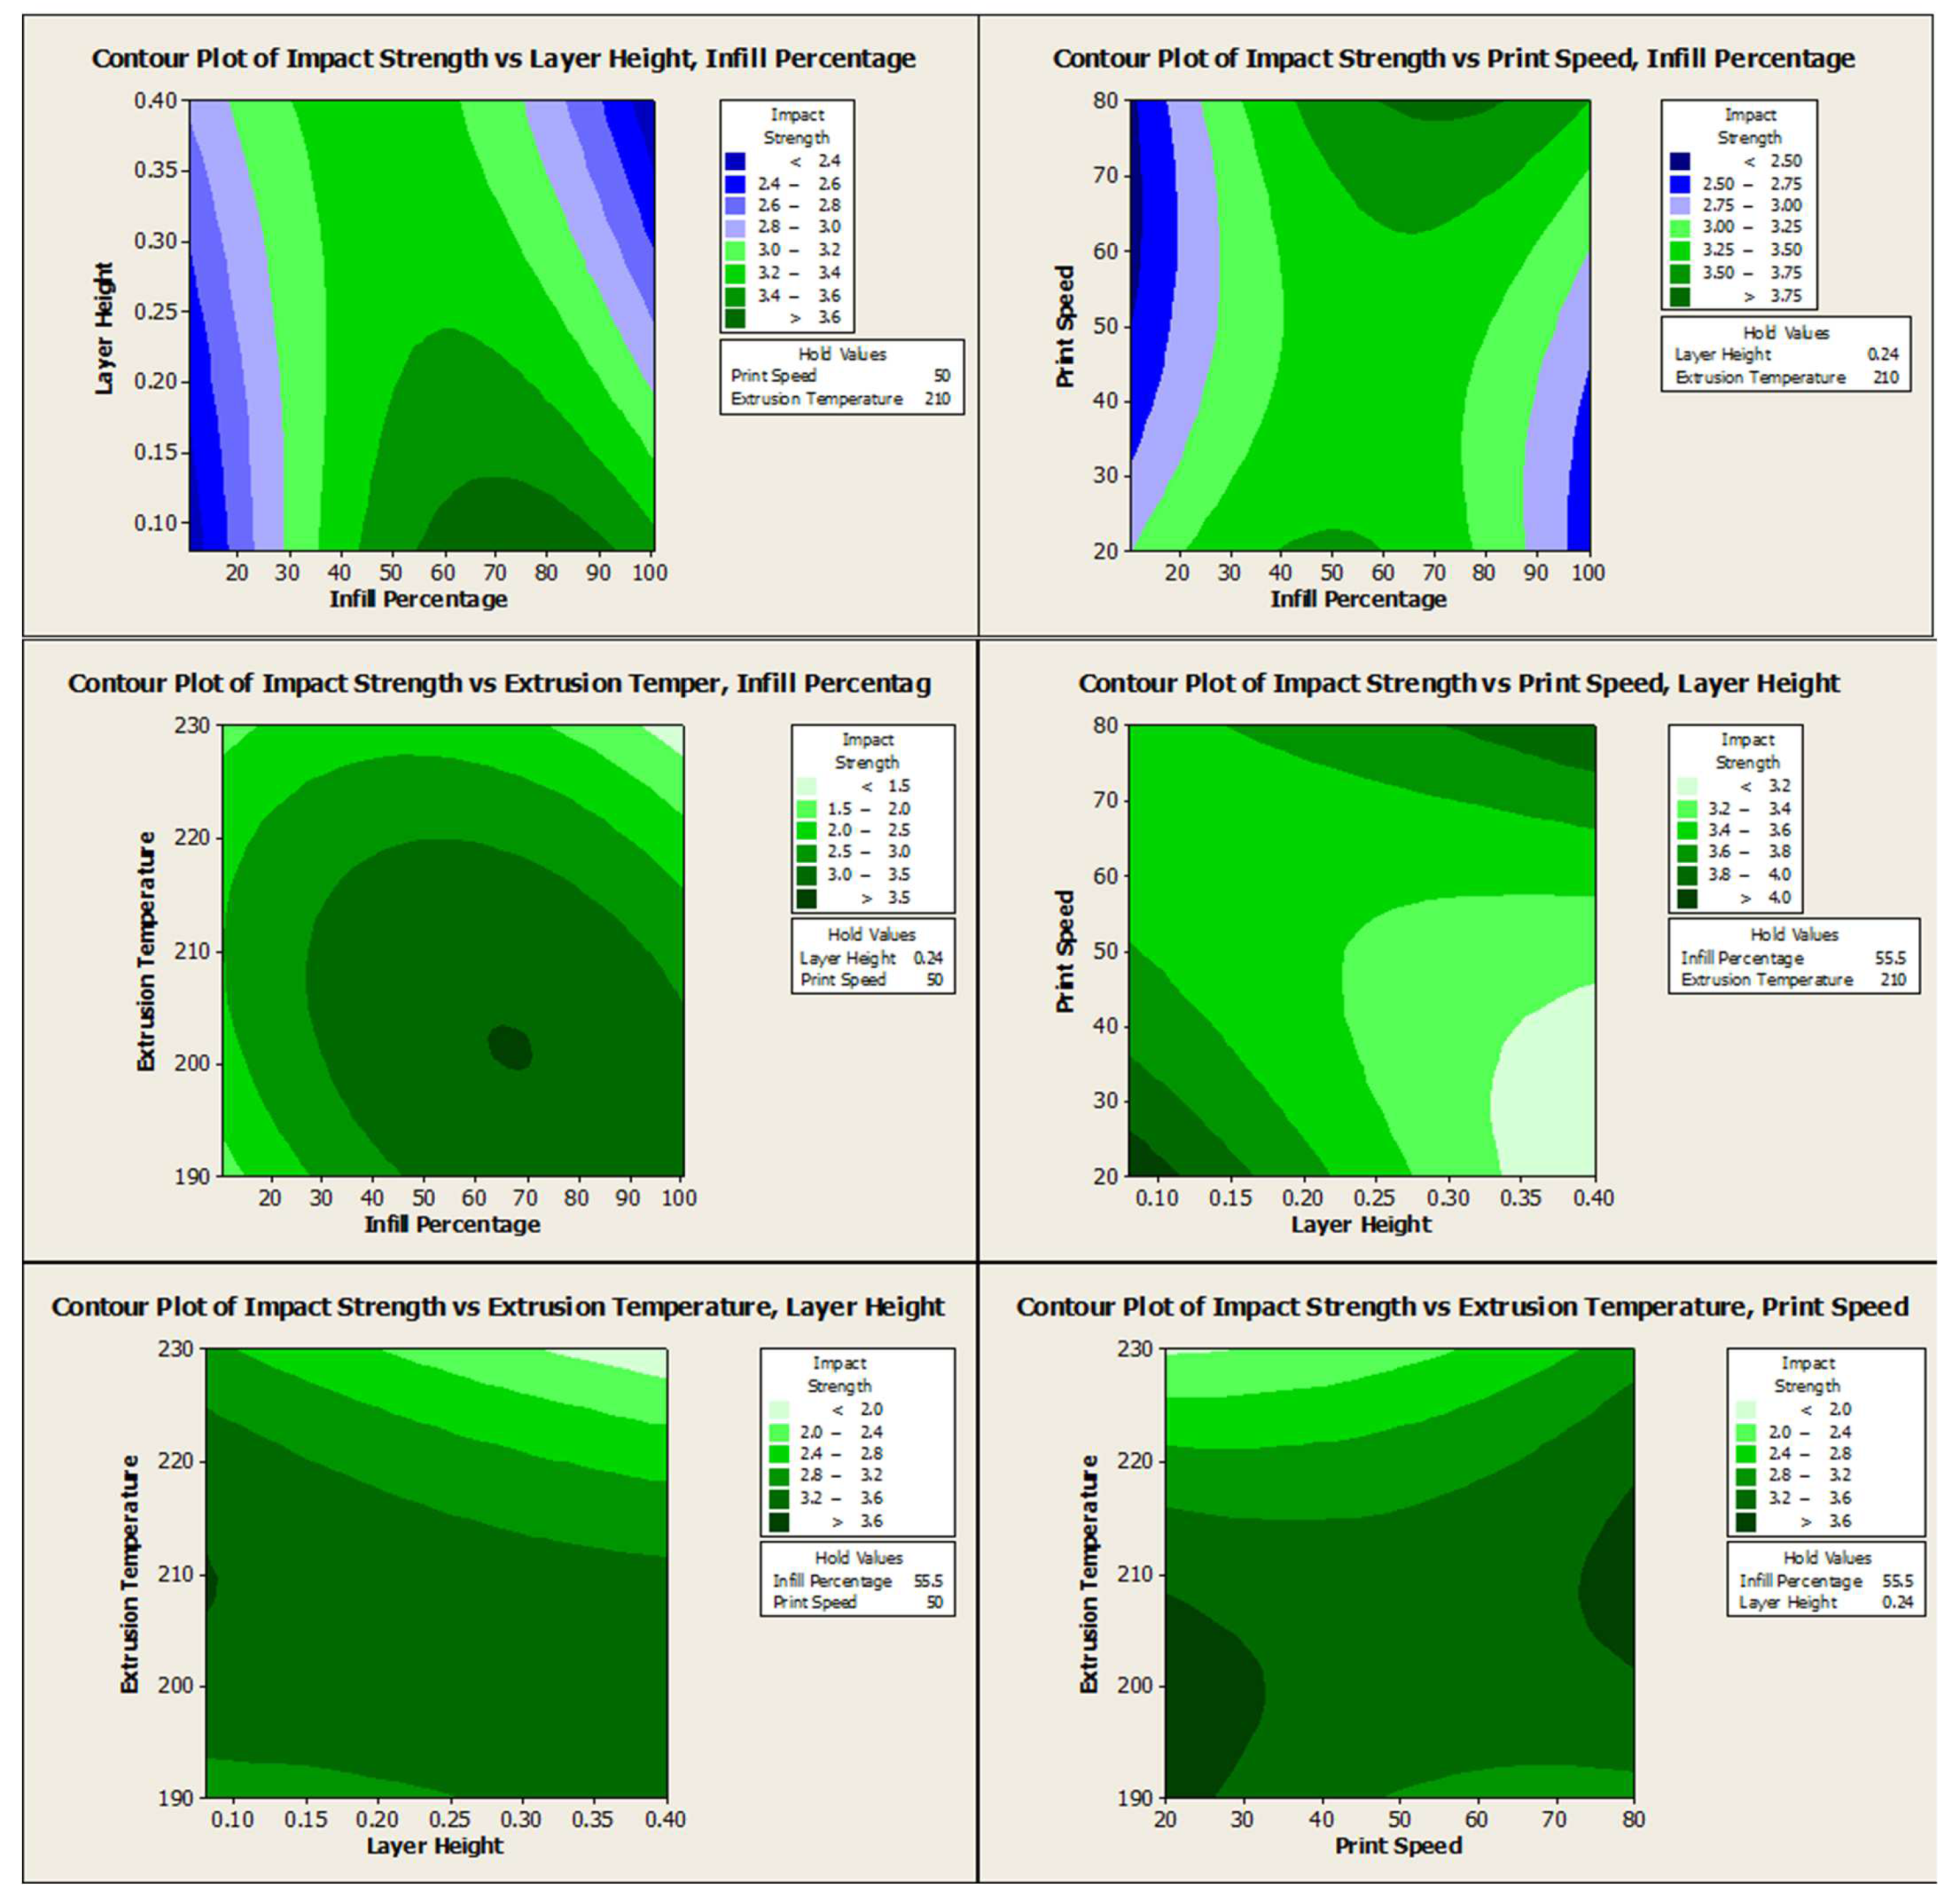
- It was found that the infill percentage has a maximum effect on tensile strength and flexural strength, while extrusion temperature has a maximum effect on impact strength.
- Mathematical models for tensile strength, impact strength, and flexural strength were developed using nonlinear regression.
- Eventually, optimum values of tensile strength, impact strength, and flexural strength were found using the desirability approach and nonlinear regression and were validated experimentally.
- The desirability approach predicts the tensile strength, impact strength, and flexural strength with a percentage error of less than 3.109, 6.532, and 3.712, respectively.
- The nonlinear regression approach predicts the tensile strength, impact strength, and flexural strength with a percentage error of less than 2.977, 6.532, and 3.474, respectively.
Author Contributions
Funding
Institutional Review Board Statement
Informed Consent Statement
Data Availability Statement
Acknowledgments
Conflicts of Interest
References
- Masood, S.H. Advances in fused deposition modelling. Compr. Mater. Process. 2014, 10, 69–91. [Google Scholar] [CrossRef]
- Dudescu, C.; Racz, L. Effects of raster orientation, infill rate and infill pattern on the mechanical properties of 3D printed materials. ACTA Uiversitatis Cibiniensis Tech. Ser. 2017, 69, 23–30. [Google Scholar] [CrossRef] [Green Version]
- Fernandes, J.; Deus, A.M.; Reis, L.; Vaz, M.F.; Leite, M. Study of the influence of 3D printing parameters on the mechanical properties of PLA. In Proceedings of the 3rd International Conference on Progress in Additive Manufacturing (Pro-AM 2018), Singapore, 14–17 May 2018; pp. 547–552. [Google Scholar] [CrossRef]
- Bähr, F.; Westkämper, E. Correlations between influencing parameters and quality properties of components produced by fused deposition modeling. Procedia Cirp. 2018, 72, 1214–1219. [Google Scholar] [CrossRef]
- Kantaros, A.; Karalekas, D. Fiber Bragg grating based investigation of residual strains in ABS parts fabricated by fused deposition modeling process. Mater. Des. 2013, 50, 44–50. [Google Scholar] [CrossRef]
- Sood, A.K.; Ohdar, R.K.; Mahapatra, S.S. Improving dimensional accuracy of Fused Deposition Modelling processed part using grey Taguchi method. Mater. Des. 2009, 30, 4243–4252. [Google Scholar] [CrossRef]
- Sood, A.K.; Ohdar, R.K.; Mahapatra, S.S. Parametric appraisal of mechanical property of fused deposition modelling processed parts. Mater. Des. 2010, 31, 287–295. [Google Scholar] [CrossRef]
- Es-Said, O.S.; Foyos, J.; Noorani, R.; Mendelson, M.; Marloth, R.; Pregger, B.A. Effect of Layer Orientation on Mechanical Properties of Rapid Prototyped Samples. Mater. Manuf. Process. 2007, 15, 107–122. [Google Scholar] [CrossRef]
- Kantaros, A.; Karalekas, D. Employing a Low-Cost Desktop 3D Printer: Challenges, and How to Overcome Them by Tuning Key Process Parameters. Int. J. Mech. Appl. 2021, 10, 11–19. [Google Scholar] [CrossRef]
- Vasudevarao, B.; Natarajan, D.P.; Henderson, M.; Razdan, A. Sensitivity of rp surface finish to process parameter variation. Int. Solid Free. Fabr. Symp. 2000, 1, 251–258. [Google Scholar] [CrossRef]
- Kantaros, A.; Karalekas, D. FBG Based In Situ Characterization of Residual Strains in FDM Process. In Residual Stress, Thermomechanics & Infrared Imaging, Hybrid Techniques and Inverse Problems; Conference Proceedings of the Society for Experimental Mechanics Series; Springer: Cham, Switzerland, 2014; Volume 8, p. 8. [Google Scholar] [CrossRef]
- Tran, N.H.; Nguyen, V.N.; Ngo, A.V.; Nguyen, V.C. Study on the effect of fused deposition modeling (FDM) process parameters on the printed part quality. Int. J. Eng. Res. Appl. 2017, 7, 71–77. [Google Scholar] [CrossRef]
- Popescu, D.; Zapciu, A.; Amza, C.; Baciu, F.; Marinescu, R. FDM process parameters influence over the mechanical properties of polymer specimens: A review. Polym. Test. 2018, 69, 157–166. [Google Scholar] [CrossRef]
- Ding, S.; Zou, B.; Wang, P.; Ding, H. Effects of nozzle temperature and building orientation on mechanical properties and microstructure of PEEK and PEI printed by 3D-FDM. Polym. Test. 2019, 78, 105948. [Google Scholar] [CrossRef]
- Peng, A.; Xiao, X.; Yue, R. Process parameter optimization for fused deposition modeling using response surface methodology combined with fuzzy inference system. Int. J. Adv. Manuf. Technol. 2014, 73, 87–100. [Google Scholar] [CrossRef]
- Zhang, J.W.; Peng, A.H. Process-parameter optimization for fused deposition modeling based on Taguchi method. Adv. Mater. Res. 2012, 538, 444–447. [Google Scholar] [CrossRef]
- Gao, G.; Xu, F.; Xu, J.; Tang, G.; Liu, Z. A Survey of the Influence of Process Parameters on Mechanical Properties of Fused Deposition Modeling Parts. Micromachines 2022, 13, 553. [Google Scholar] [CrossRef] [PubMed]
- Alhazmi, M.W.; Backar, A.; Backar, A.H. Influence of infill density and orientation on the mechanical response of PLA+ specimens produced using FDM 3D printing. Int. J. Adv. Sci. Technol. 2020, 29, 3362–3371. [Google Scholar]
- Ayatollahi, M.R.; Nabavi-Kivi, A.; Bahrami, B.; Yahya, M.Y.; Khosravani, M.R. The influence of in-plane raster angle on tensile and fracture strengths of 3D-printed PLA specimens. Eng. Fract. Mech. 2020, 237, 107225. [Google Scholar] [CrossRef]
- Banerjee, D.; Mishra, S.B.; Khan, M.S.S.; Ajay Kumar, M.A. Mathematical approach for the geometrical deformation of fused deposition modelling build parts. Mater. Today Proc. 2020, 33, 5051–5054. [Google Scholar] [CrossRef]
- Dave, H.K.; Prajapati, A.R.; Rajpurohit, S.R.; Patadiya, N.H.; Raval, H.K. Investigation on tensile strength and failure modes of FDM printed part using in-house fabricated PLA filament. Adv. Mater. Process. Technol. 2020. [Google Scholar] [CrossRef]
- Deshwal, S.; Kumar, A.; Chhabra, D. Exercising hybrid statistical tools GA-RSM, GA-ANN and GA-ANFIS to optimize FDM process parameters for tensile strength improvement. CIRP J. Manuf. Sci. Technol. 2020, 31, 189–199. [Google Scholar] [CrossRef]
- Heidari-Rarani, M.; Ezati, N.; Sadeghi, P.; Badrossamay, M.R. Optimization of FDM process parameters for tensile properties of polylactic acid specimens using Taguchi design of experiment method. J. Thermoplast. Compos. Mater. 2020, 2020, 560. [Google Scholar] [CrossRef]
- Omiyale, P.K.; Omiyale, B.O. Mechanical behaviour of polylactic acid parts fabricated via material extrusion process: A taguchi-grey relational analysis approach. Int. J. Eng. Res. Afr. 2020, 46, 32–44. [Google Scholar]
- Fountas, N.A.; Kostazos, P.; Pavlidis, H.; Antoniou, V.; Manolakos, D.E.; Vaxevanidis, N.M. Experimental investigation and statistical modelling for assessing the tensile properties of FDM fabricated parts. Procedia Struct. Integr. 2020, 26, 139–146. [Google Scholar] [CrossRef]
- Srinivasu, K.K.; Srinivasu, G. Effect of post treatment on tensile properties of carbon reinforced PLA composite by 3D printing. Mater. Today Proc. 2020, 33, 5403–5407. [Google Scholar]
- Gunasekaran, K.N.; Aravinth, V.; Kumaran, C.B.M.; Madhankumar, K.; Pradeep Kumar, S. Investigation of mechanical properties of PLA printed materials under varying infill density. Mater. Today Proc. 2020, 45, 1849–1856. [Google Scholar] [CrossRef]
- Kamaal, M.; Anas, M.; Rastogi, H.; Bhardwaj, N.; Rahaman, A. Effect of FDM process parameters on mechanical properties of 3D-printed carbon fibre-PLA composite. Prog. Addit. Manuf. 2021, 6, 63–69. [Google Scholar] [CrossRef]
- Kozior, T.; Mamun, A.; Trabelsi, M.; Sabantina, L.; Ehrmann, A. Quality of the surface texture and mechanical properties of FDM printed samples after thermal and chemical treatment. Stroj. Vestn. J. Mech. Eng. 2020, 66, 105–113. [Google Scholar]
- Kumar, M.A.; Khan, M.S.; Mishra, S.B. Effect of fused deposition machine parameters on tensile strength of printed carbon fiber reinforced pla thermoplastics. Mater. Today Proc. 2020, 27, 1505–1510. [Google Scholar] [CrossRef]
- Lee, D.; Wu, G.Y. Parameters affecting the mechanical properties of three-dimensional (3D) printed carbon fiberreinforced polylactide composites. Polymers 2020, 12, 2456. [Google Scholar] [CrossRef]
- Blessie, J. Optimization of process parameters for improving mechanical strength of pla plastics using Taguchi method. Int. Res. J. Eng. Technol. 2020, 35, 6264–6268. [Google Scholar]
- Son, T.A.; Minh, P.S.; Thanh, T.D. Effect of 3D printing parameters on the tensile strength of products. Key Eng. Mater. 2020, 863, 103–108. [Google Scholar] [CrossRef]
- Tang, C.; Liu, J.; Yang, Y.; Liu, Y.; Jiang, S.; Hao, W. Effect of process parameters on mechanical properties of 3D printed PLA lattice structures. Compos. Part C Open Access 2020, 3, 100076. [Google Scholar] [CrossRef]
- Vǎlean, C.; Mars¸avina, L.; Mǎrghitas, M.; Linul, E.; Razavi, J.; Berto, F. Effect of manufacturing parameters on tensile properties of FDM printed specimens. Procedia Struct. Integr. 2020, 26, 313–320. [Google Scholar] [CrossRef]
- Vardhan, H.; Kumar, R.; Chohan, J.S. Investigation of tensile properties of sprayed aluminium based PLA composites fabricated by FDM technology. Mater. Today Proc. 2020, 33, 1599–1604. [Google Scholar] [CrossRef]
- Waseem, M. Multi-response optimization of tensile creep behavior of PLA 3D printed parts using categorical response surface methodology. Polymers 2020, 12, 2962. [Google Scholar] [CrossRef]
- Yao, T.; Ye, J.; Deng, Z.; Zhang, K.; Ma, Y.; Ouyang, H. Tensile failure strength and separation angle of FDM 3D printing PLA material: Experimental and theoretical analyses. Compos. Part B Eng. 2020, 188, 107894. [Google Scholar] [CrossRef]
- Zandi, M.D.; Jerez-Mesa, R.; Lluma-Fuentes, J.; Jorba-Peiro, J.; Travieso-Rodriguez, J.A. Study of the manufacturing process effects of fused filament fabrication and injection molding on tensile properties of composite PLA-wood parts. Int. J. Adv. Manuf. Technol. 2020, 108, 1725–1735. [Google Scholar] [CrossRef]
- Algarni, M. The influence of raster angle and moisture content on the mechanical properties of pla parts produced by fused deposition modeling. Polymers 2021, 13, 237. [Google Scholar] [CrossRef]
- Dou, H.; Cheng, Y.; Ye, W.; Zhang, D.; Li, J.; Miao, Z.; Rudykh, S. Effect of process parameters on tensile mechanical properties of 3D printing continuous carbon fiber-reinforced PLA composites. Materials 2020, 13, 3850. [Google Scholar] [CrossRef]
- Reverte, J.M.; Caminero, M.Á.; Chacón, J.M.; García-Plaza, E.; Núñez, P.J.; Becar, J.P. Mechanical and geometric performance of PLA-based polymer composites processed by the fused filament fabrication additive manufacturing technique. Materials 2020, 13, 1924. [Google Scholar] [CrossRef] [Green Version]
- Mustafa, M.S.; Zafar, M.Q.; Muneer, M.A.; Arif, M.; Siddiqui, F.A.; Javed, H.M.A. Process parameter optimization in fused deposition modeling using response surface methodology. Res. Sq. 2020, 19. [Google Scholar] [CrossRef]
- Awasthi, P.; Banerjee, S.S. Fused deposition modeling of thermoplastic elastomeric materials: Challenges and opportunities. Addit. Manuf. 2021, 46, 102177. [Google Scholar] [CrossRef]
- Cuan-Urquizo, E.; Barocio, E.; Tejada-Ortigoza, V.; Pipes, R.B.; Rodriguez, C.A.; Roman-Flores, A. Characterization of the Mechanical Properties of FFF Structures and Materials: A Review on the Experimental, Computational and Theoretical Approaches. Materials 2019, 12, 895. [Google Scholar] [CrossRef] [PubMed]
- Verma, N.; Aiswarya, S.; Banerjee, S.S. Development of material extrusion 3D printable ABS/PC polymer blends: Influence of styrene–isoprene–styrene copolymer on printability and mechanical properties. Polym. Plast. Technol. Mater. 2022, 2022, 218. [Google Scholar] [CrossRef]


| Reference No. | Input Process Parameters | Filament Material | Method/Technique | Output Parameters |
|---|---|---|---|---|
| [18] | Infill density, infill pattern, print speed, and print temperature | PLA, ABS, CFR-PLA, CFR-ABS, CNT-ABS | One-variable-at-a-time | Tensile, compressive, flexural |
| [19] | Infill density and angle of orientation | PLA | Full factorial | Tensile |
| [20] | Raster angle | PLA | One-variable-at-a-time | Tensile, fracture |
| [21] | Layer thickness, raster width, airgap, and part orientation | PLA, ABS | Response surface methodology | Geometrical deformation, surface roughness |
| [22] | Raster angle, raster width, and layer height | PLA | Adaptive neuro-fuzzy interface system | Tensile |
| [23] | Infill density, speed, and print temperature | PLA | Central compoiste design, genetic algorithm, adaptive neuro-fuzzy interface system, artifical neural network | Tensile |
| [24] | Infill density, print speed, and layer thickness | PLA | Taguchi method | Tensile |
| [25] | Infill density, layer thickness, and extrusion temperature | PLA | Taguchi method | Tensile, impact, and hardness |
| [26] | Layer height, shell thickness, infill density, orientation angle, and print speed | PLA | Taguchi method | Tensile |
| [27] | Layer thickness, airgap, orientation, temperature | PLA | One-variable-at-a-time, chemical treatment | Tensile |
| [28] | Infill density | PLA | Full factorial | Tensile, hardness, impact, flexural |
| [29] | Build direction, infill percentage, and layer thickness | CFR-PLA | The technique for order of preference by similarity to ideal solution | Tensile, izod impact |
| [30] | Layer thickness, nozzle temperature, bed temperature, infill density | PLA | One-variable-at-a-time | Tensile |
| [31] | Infill density, print speed, and layer height | CFR-PLA | Taguchi | Tensile |
| [32] | Print orientation, bed temperature, nozzle temperature, print speed, infill density | CFR-PLA | Taguchi | Tensile, impact |
| [33] | Infill density and print pattern | PLA | Taguchi | Tensile |
| [34] | Infill density and infill pattern | PLA, ABS, PETG | Full factorial | Tensile |
| [35] | Print speed and print temperature | PLA | Full factorial | Tensile |
| [36] | Print orientation and layer thickness | PLA | Full factorial | Tensile |
| [37] | Infill density number of aluminum layer and bed temperature | PLA | Taguchi method | Tensile |
| [38] | Layer height, infill percentage, and infill pattern | PLA | Central composite design | Tensile |
| [39] | Layer thickness, print orientation | PLA | Generalized-relative root-mean-square error | Tensile |
| [40] | Layer height, fill density, printing velocity, and orientation | PLA | Taguchi method | Tensile |
| [41] | Raster angle and moisture content | PLA | Design of experiments | Tensile, strain, modulus of elasticity |
| [42] | Layer height, extrusion width, printing temperature, printing speed | FR-PLA | Central composite design | Tensile |
| [43] | Bed temperature, extrusion temperature | PLA, CF-PLA | Central composite design | Tensile, flexural, shear |
| Run Nos. | Infill Percentage | Layer Height (mm) | Print Speed (mm/s) | Extrusion Temp (°C) | Tensile Strength (N/mm2) | Impact Strength (kJ/m2) | Flexural Strength (N/mm2) |
|---|---|---|---|---|---|---|---|
| 1 | 78 | 0.32 | 35 | 220 | 46.17 | 1.55 | 39.07 |
| 2 | 10.5 | 0.24 | 50 | 210 | 42.78 | 1.59 | 51.01 |
| 3 | 33 | 0.16 | 35 | 220 | 45.87 | 3.2 | 43.13 |
| 4 | 33 | 0.32 | 35 | 200 | 41.18 | 3.32 | 30.9 |
| 5 | 33 | 0.16 | 65 | 200 | 43.59 | 3.31 | 37.8 |
| 6 | 100.5 | 0.24 | 50 | 210 | 54.20 | 3.37 | 62.51 |
| 7 | 78 | 0.16 | 35 | 200 | 51.88 | 3.31 | 53.06 |
| 8 | 33 | 0.32 | 65 | 200 | 43.19 | 3.25 | 44.74 |
| 9 | 78 | 0.32 | 65 | 200 | 50.34 | 3.31 | 48.2 |
| 10 | 33 | 0.16 | 65 | 220 | 45.72 | 3.27 | 42.79 |
| 11 | 78 | 0.16 | 35 | 220 | 53.35 | 3.35 | 52.27 |
| 12 | 55.5 | 0.24 | 50 | 210 | 49.67 | 3.22 | 53.93 |
| 13 | 33 | 0.32 | 35 | 220 | 45.08 | 3.3 | 42.88 |
| 14 | 55.5 | 0.24 | 50 | 190 | 47.56 | 3.37 | 48.38 |
| 15 | 55.5 | 0.24 | 50 | 210 | 48.39 | 3.38 | 51.15 |
| 16 | 78 | 0.32 | 65 | 220 | 46.49 | 3.2 | 56.59 |
| 17 | 55.5 | 0.24 | 50 | 210 | 47.21 | 3.38 | 50.53 |
| 18 | 55.5 | 0.24 | 50 | 210 | 48.30 | 3.36 | 62.67 |
| 19 | 55.5 | 0.24 | 50 | 230 | 50.15 | 1.71 | 52.21 |
| 20 | 33 | 0.32 | 65 | 220 | 43.35 | 3.32 | 40.58 |
| 21 | 55.5 | 0.24 | 50 | 210 | 45.33 | 3.47 | 53 |
| 22 | 55.5 | 0.24 | 80 | 210 | 45.56 | 3.38 | 52.18 |
| 23 | 78 | 0.16 | 65 | 200 | 49.84 | 3.35 | 50.73 |
| 24 | 55.5 | 0.24 | 20 | 210 | 48.51 | 3.52 | 39.54 |
| 25 | 55.5 | 0.08 | 50 | 210 | 42.63 | 3.37 | 44.21 |
| 26 | 55.5 | 0.4 | 50 | 210 | 42.87 | 3.17 | 45.64 |
| 27 | 55.5 | 0.24 | 50 | 210 | 47.14 | 3.47 | 46.05 |
| 28 | 78 | 0.32 | 35 | 200 | 45.17 | 3.41 | 60.88 |
| 29 | 55.5 | 0.24 | 50 | 210 | 47.07 | 3.43 | 55.67 |
| 30 | 78 | 0.16 | 65 | 220 | 50.99 | 3.2 | 57.67 |
| 31 | 33 | 0.16 | 35 | 200 | 43.75 | 3.35 | 42.55 |
| Responses (Output Parameter) | Desirability Approach | Nonlinear Regression | Experimental | Error (%) Desirability Approach | Error (%) Nonlinear Regression |
|---|---|---|---|---|---|
| Tensile Strength (N/mm2) | 59.6875 | 59.6069 | 57.832 | 3.109 | 2.977 |
| Impact Strength (kJ/m2) | 4.3020 | 4.3020 | 4.021 | 6.532 | 6.532 |
| Flexural Strength (N/mm2) | 65.3043 | 65.1432 | 62.88 | 3.712 | 3.474 |
Publisher’s Note: MDPI stays neutral with regard to jurisdictional claims in published maps and institutional affiliations. |
© 2022 by the authors. Licensee MDPI, Basel, Switzerland. This article is an open access article distributed under the terms and conditions of the Creative Commons Attribution (CC BY) license (https://creativecommons.org/licenses/by/4.0/).
Share and Cite
Jatti, V.S.; Sapre, M.S.; Jatti, A.V.; Khedkar, N.K.; Jatti, V.S. Mechanical Properties of 3D-Printed Components Using Fused Deposition Modeling: Optimization Using the Desirability Approach and Machine Learning Regressor. Appl. Syst. Innov. 2022, 5, 112. https://doi.org/10.3390/asi5060112
Jatti VS, Sapre MS, Jatti AV, Khedkar NK, Jatti VS. Mechanical Properties of 3D-Printed Components Using Fused Deposition Modeling: Optimization Using the Desirability Approach and Machine Learning Regressor. Applied System Innovation. 2022; 5(6):112. https://doi.org/10.3390/asi5060112
Chicago/Turabian StyleJatti, Vijaykumar S., Mandar S. Sapre, Ashwini V. Jatti, Nitin K. Khedkar, and Vinaykumar S. Jatti. 2022. "Mechanical Properties of 3D-Printed Components Using Fused Deposition Modeling: Optimization Using the Desirability Approach and Machine Learning Regressor" Applied System Innovation 5, no. 6: 112. https://doi.org/10.3390/asi5060112