
Late Quaternary Dynamics of Landscape and Climate in the North of the West Siberian Plain Revealed by Paleoecological Studies of Peat and Lake Sediments
Abstract
:1. Introduction
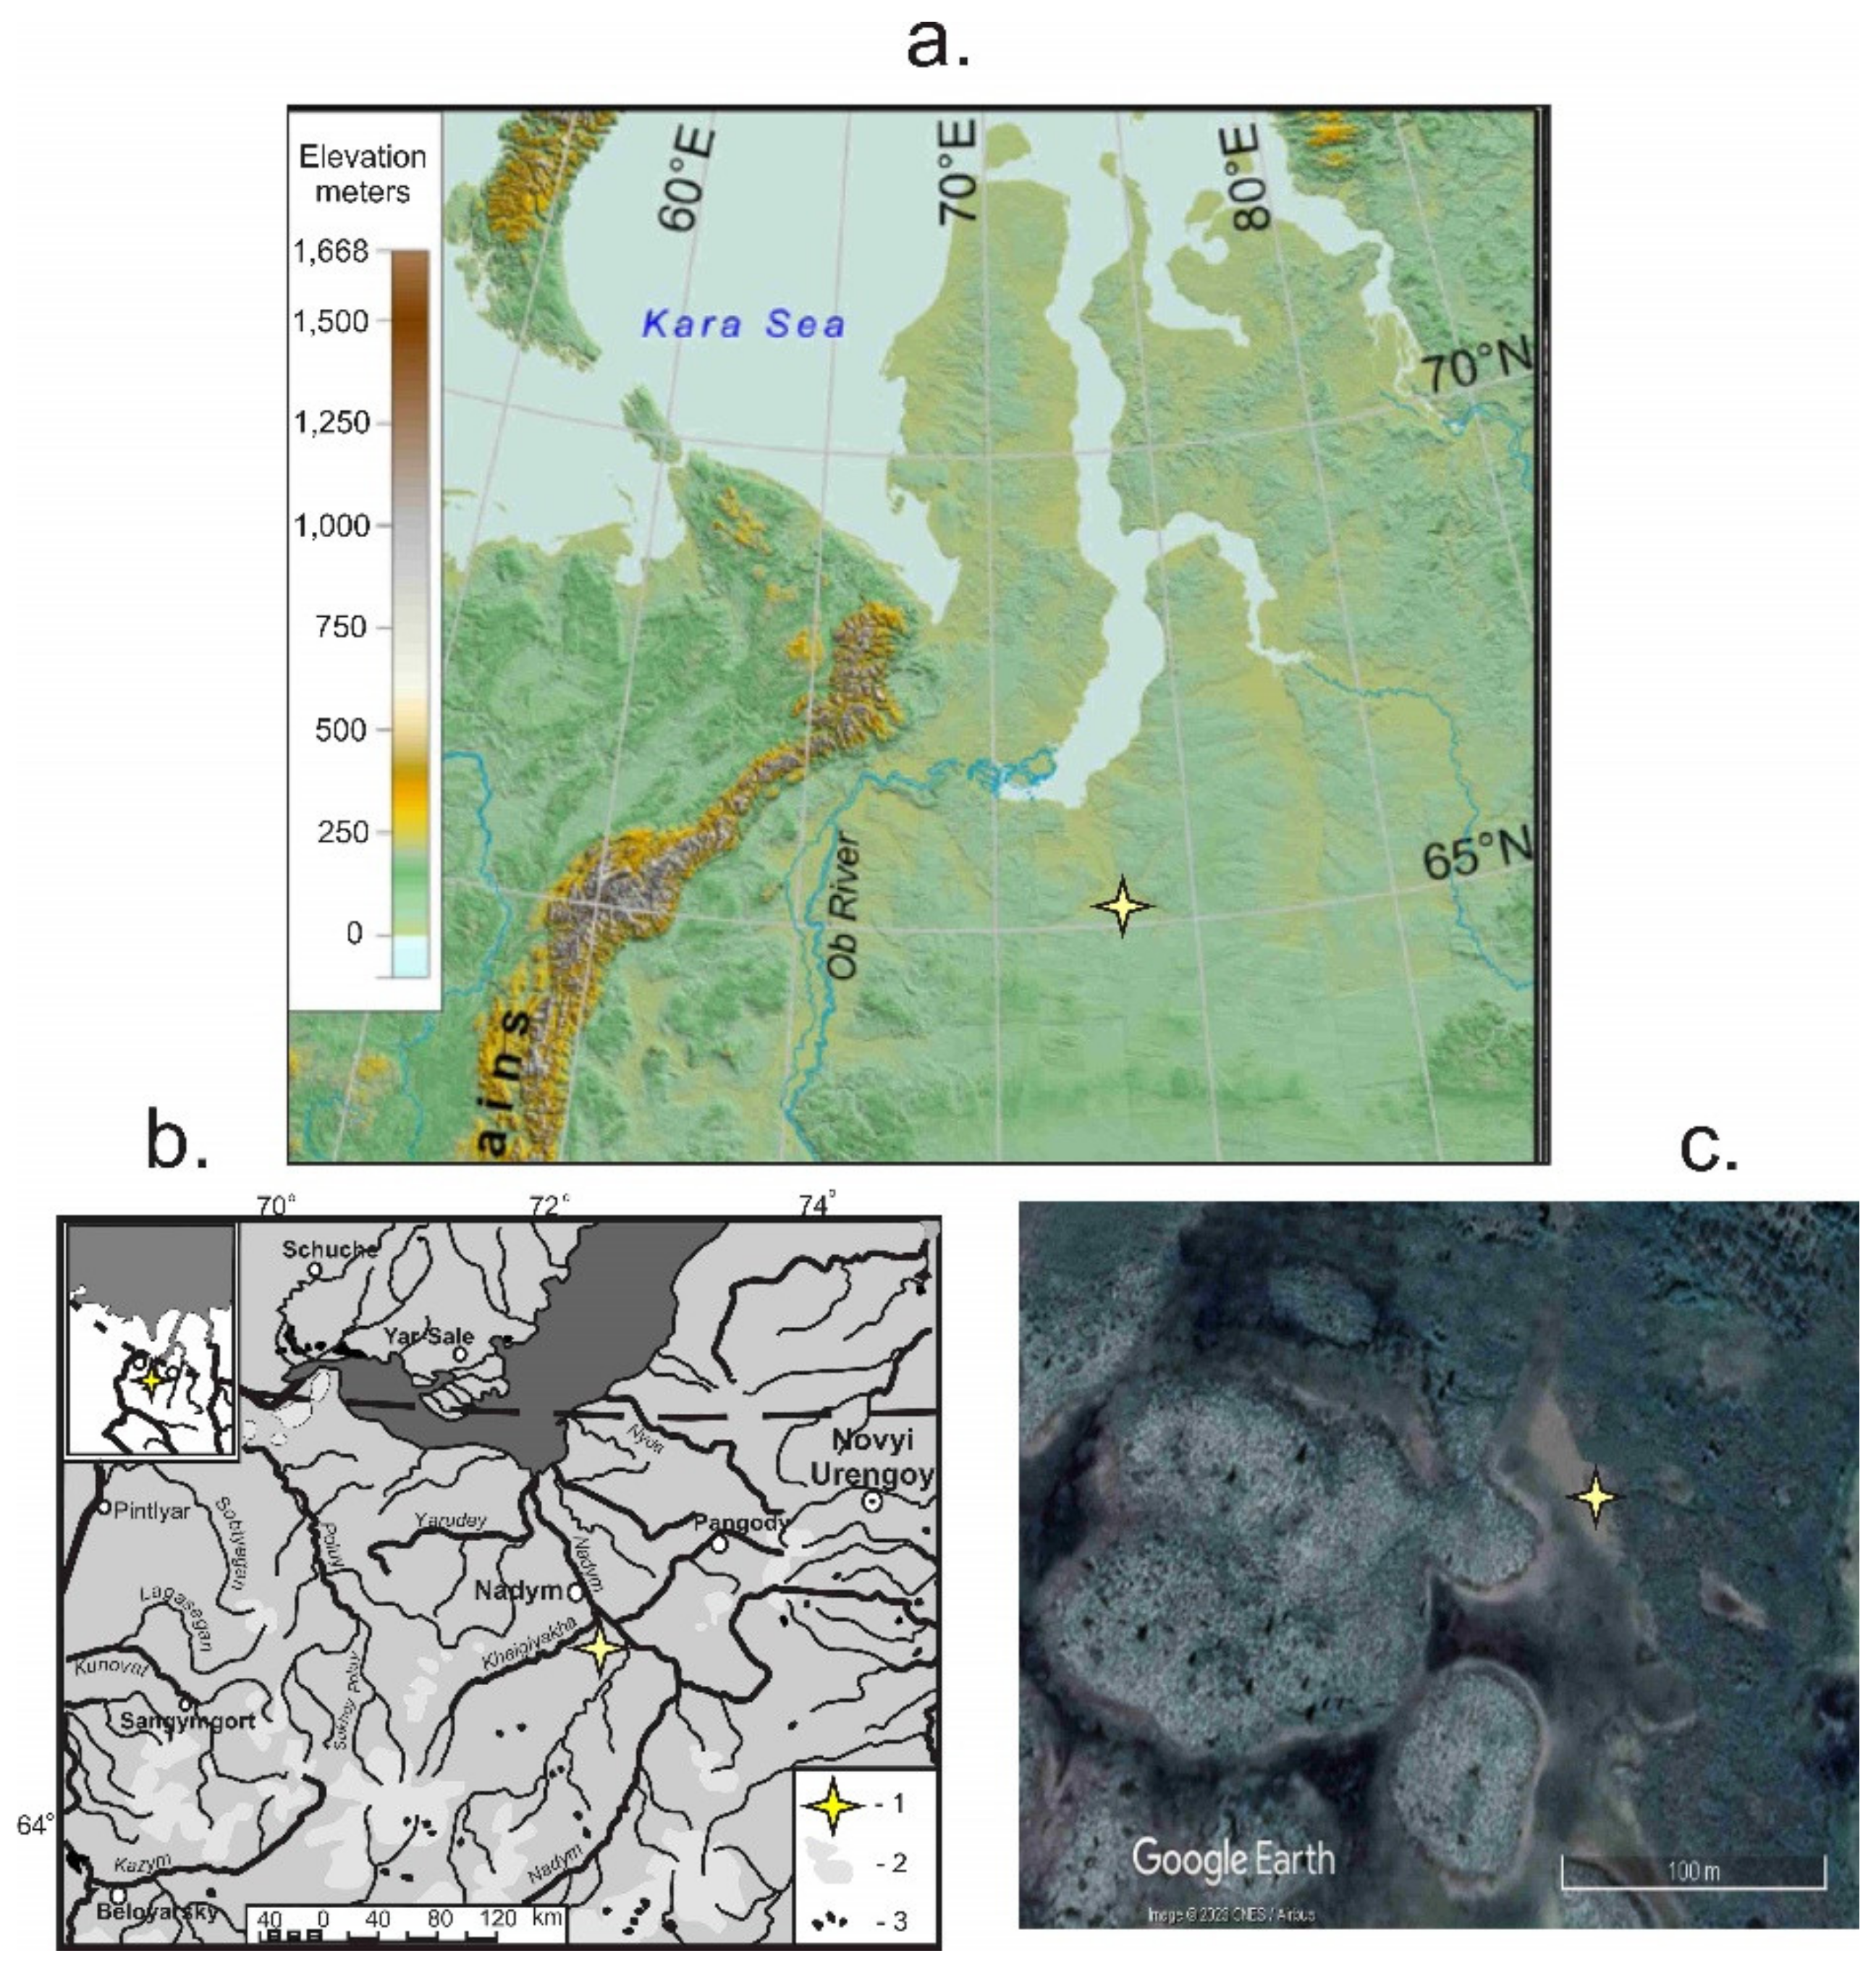
2. Study Area
3. Materials and Methods
4. Results
4.1. Lithology
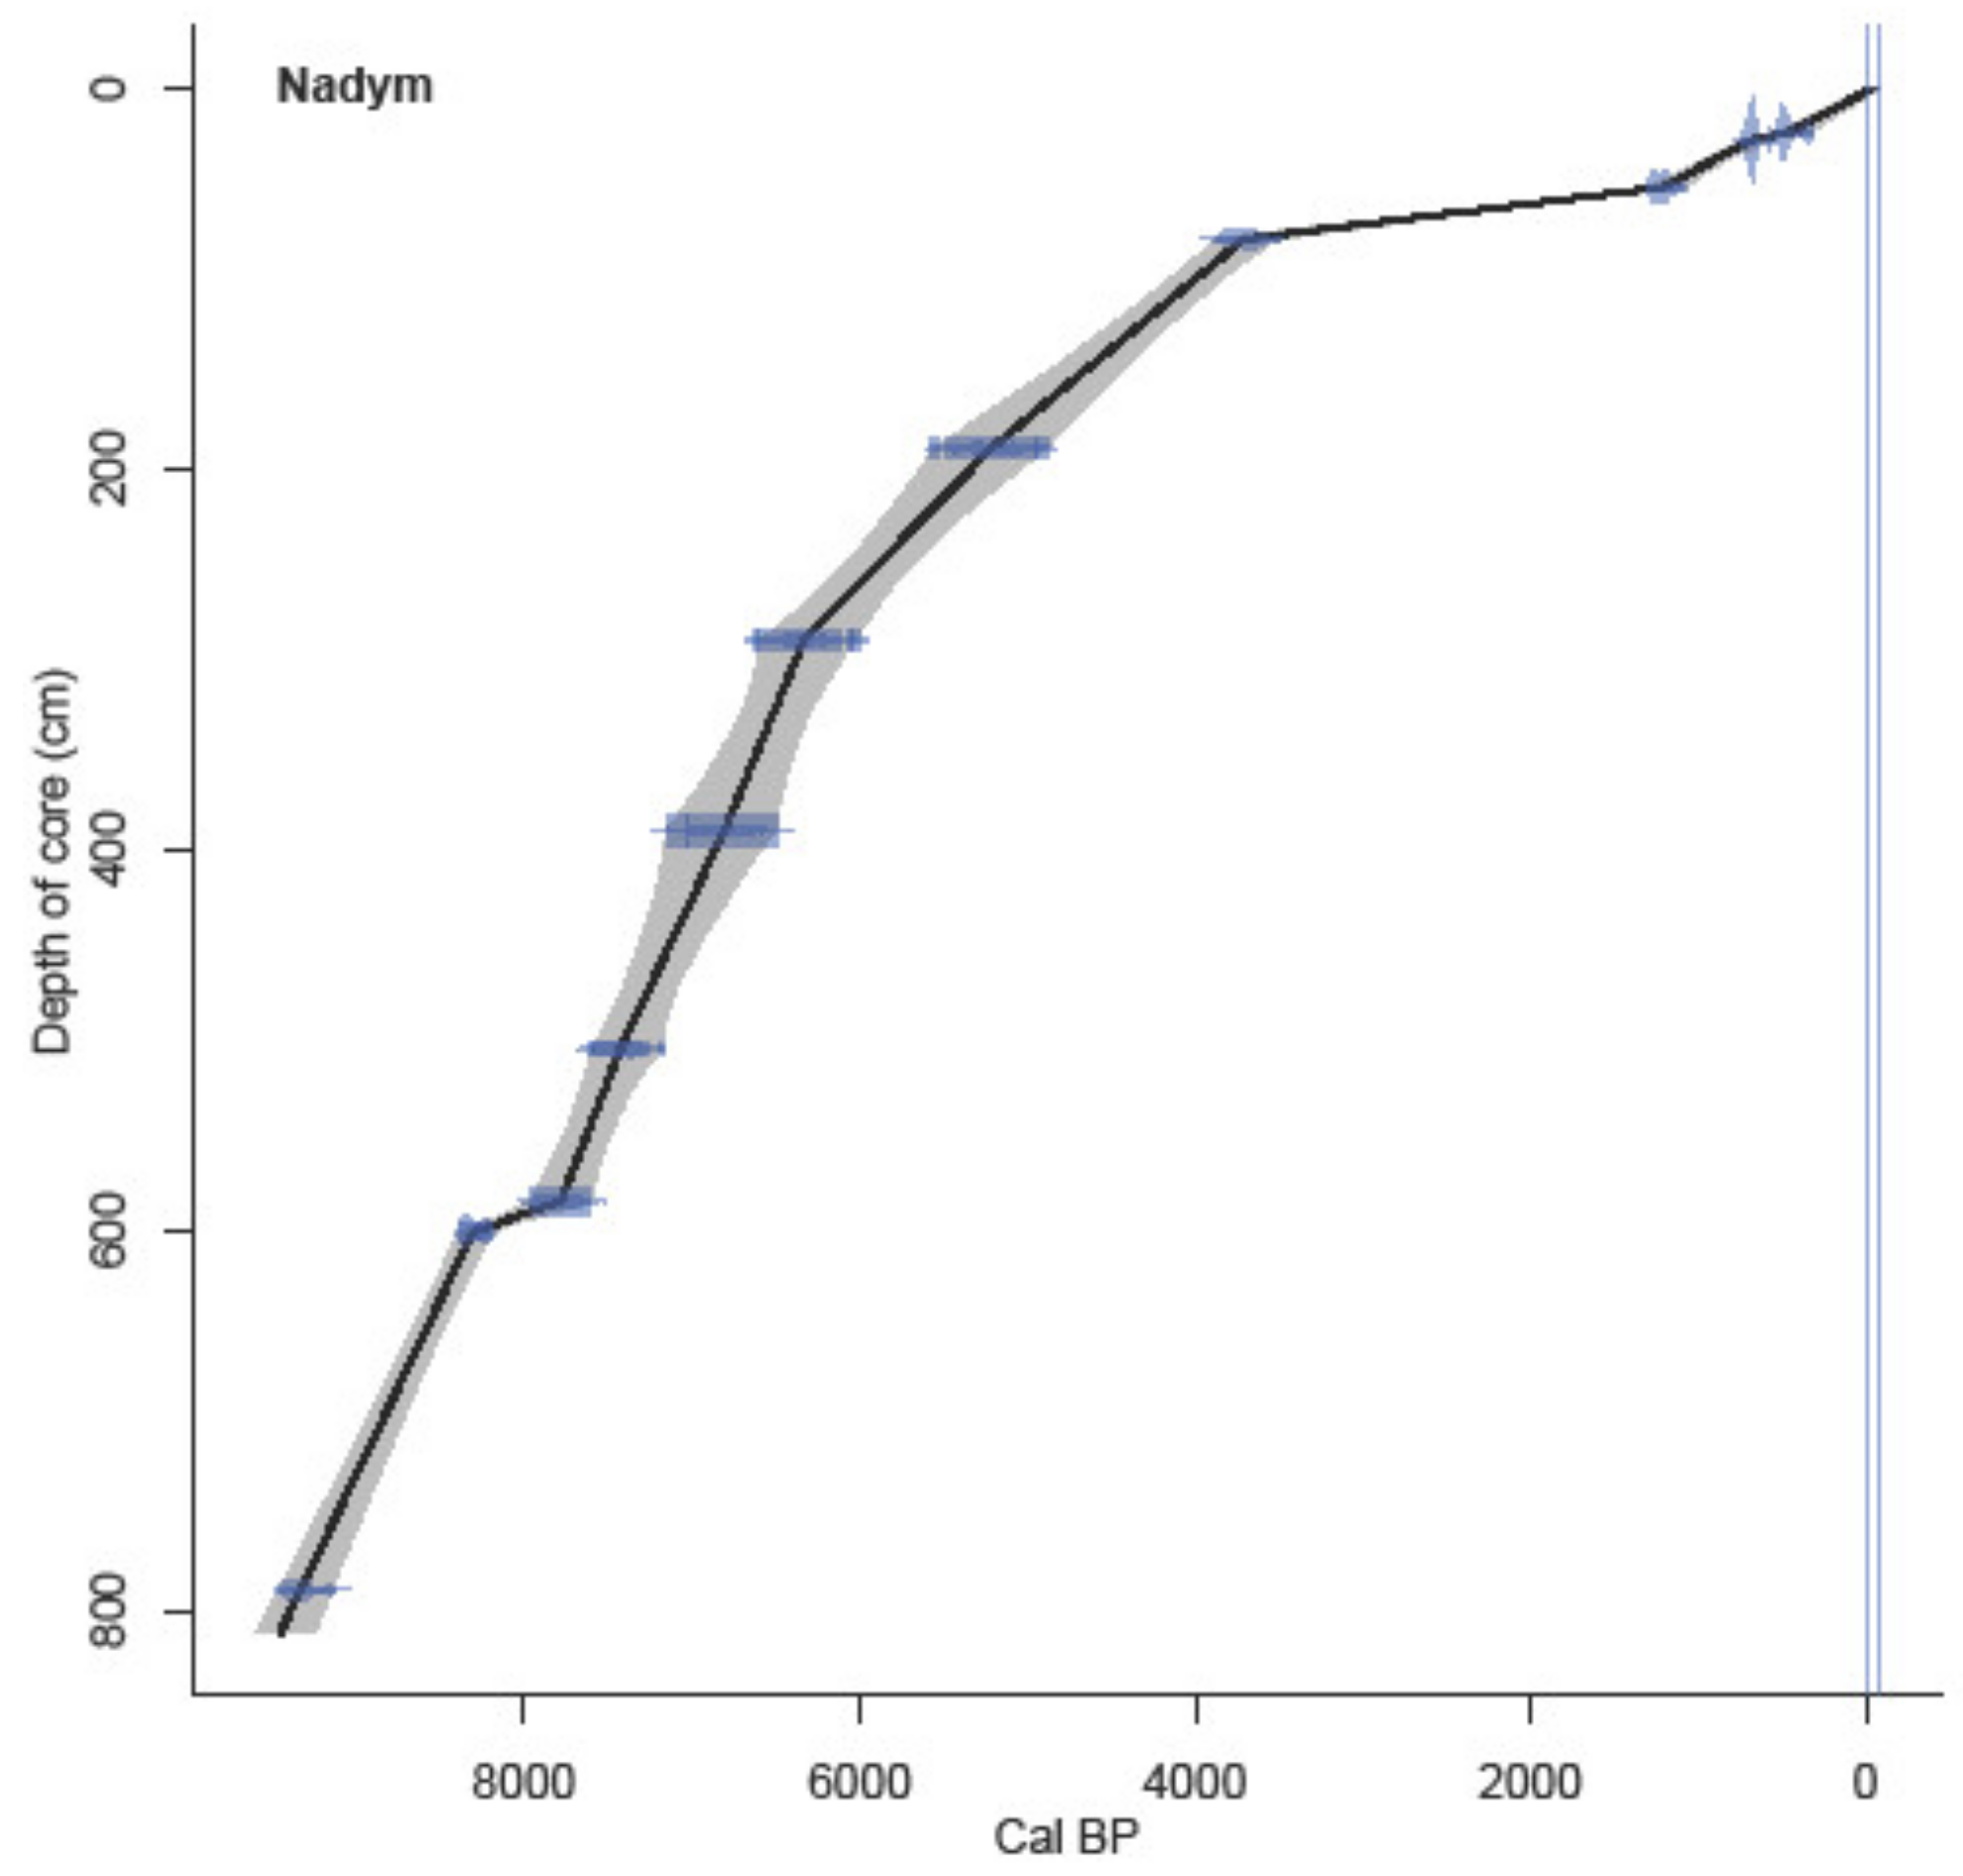
4.2. Radiocarbon Dating
4.3. Macrofossil and Humification Data
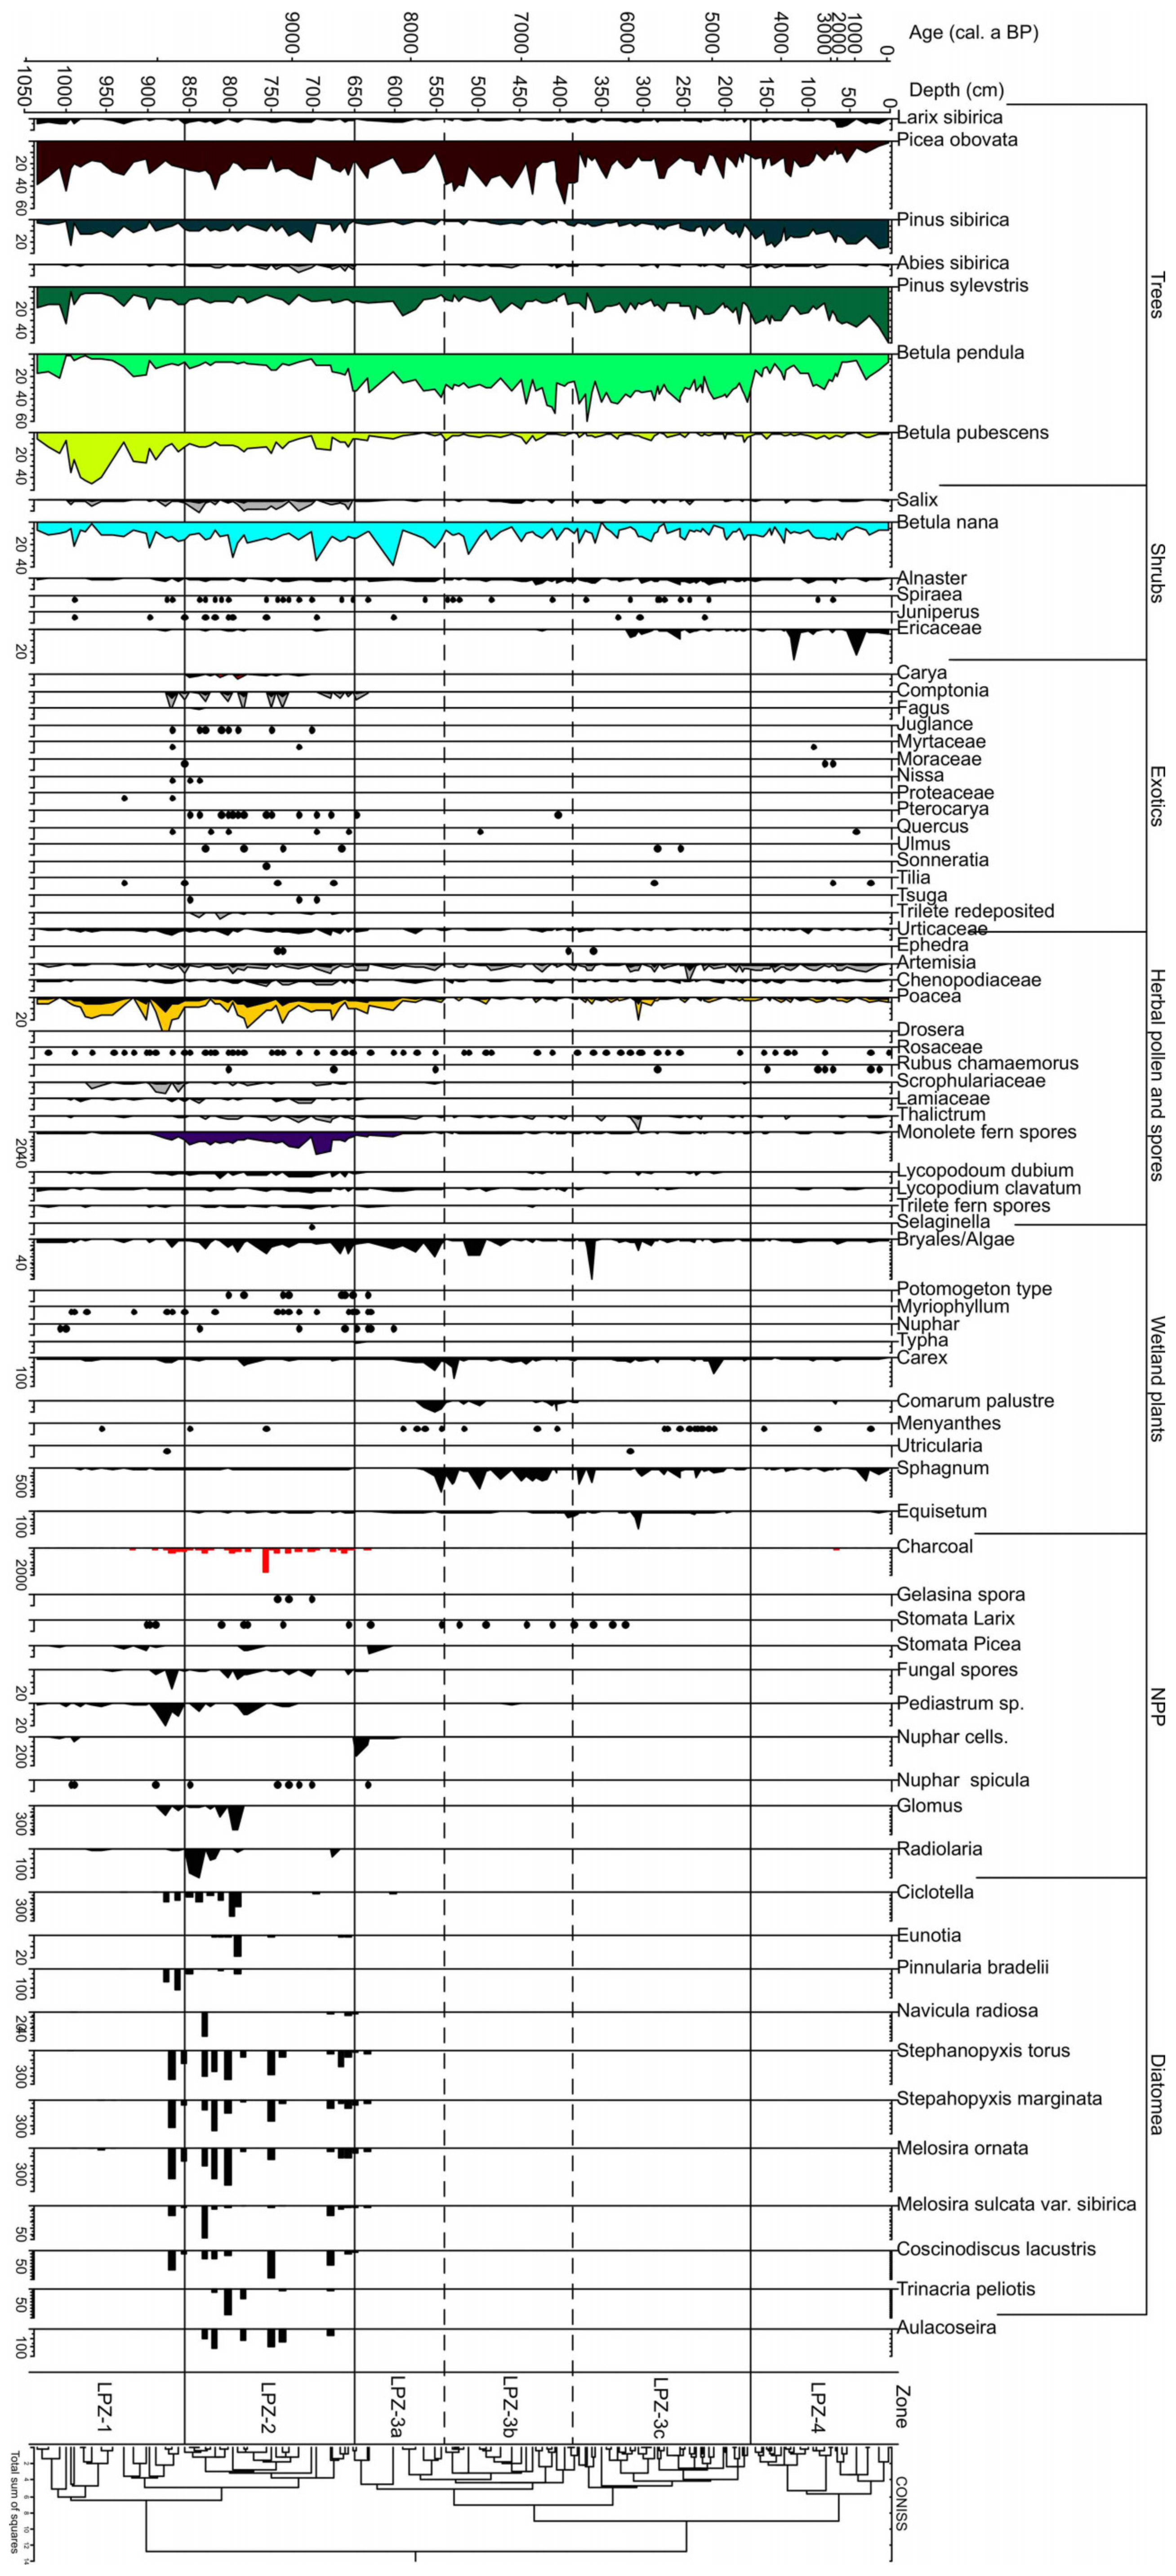
4.4. Spore–Pollen and Microcharcoal Data
- LPZ-1 of downy birch (Betula pubescens), grasses (Poaceae), spruce (Picea), and Siberian pine (Pinus sibirica) distinguished depths 1040–850 cm. In general, this pollen zone covers bottom red-brown deposits in which radiocarbon dating was unsuccessful; therefore, the age of this zone is unknown. The pollen zone is not uniform in the ratio of pollen components, but the most characteristic feature of this pollen zone is the maximum abundance of downy birch pollen (Betula pubescens) and pollen of grasses (Poaceae). In addition, there is quite a lot of Siberian pine (Pinus sibirica) and spruce (Picea) pollen in LPZ-1. The abundance of pollen of larch (Larix), silver birch (Betula pendula), and Scots pine (Pinus sylvestris) varies greatly. It is possible to divide LPZ-1 into three subzones according to the abundance of the last three components. There is relatively little pollen from dwarf birch (Betula nana) and wormwood (Artemisia) in this zone. Microcharcoal is present in small amounts.
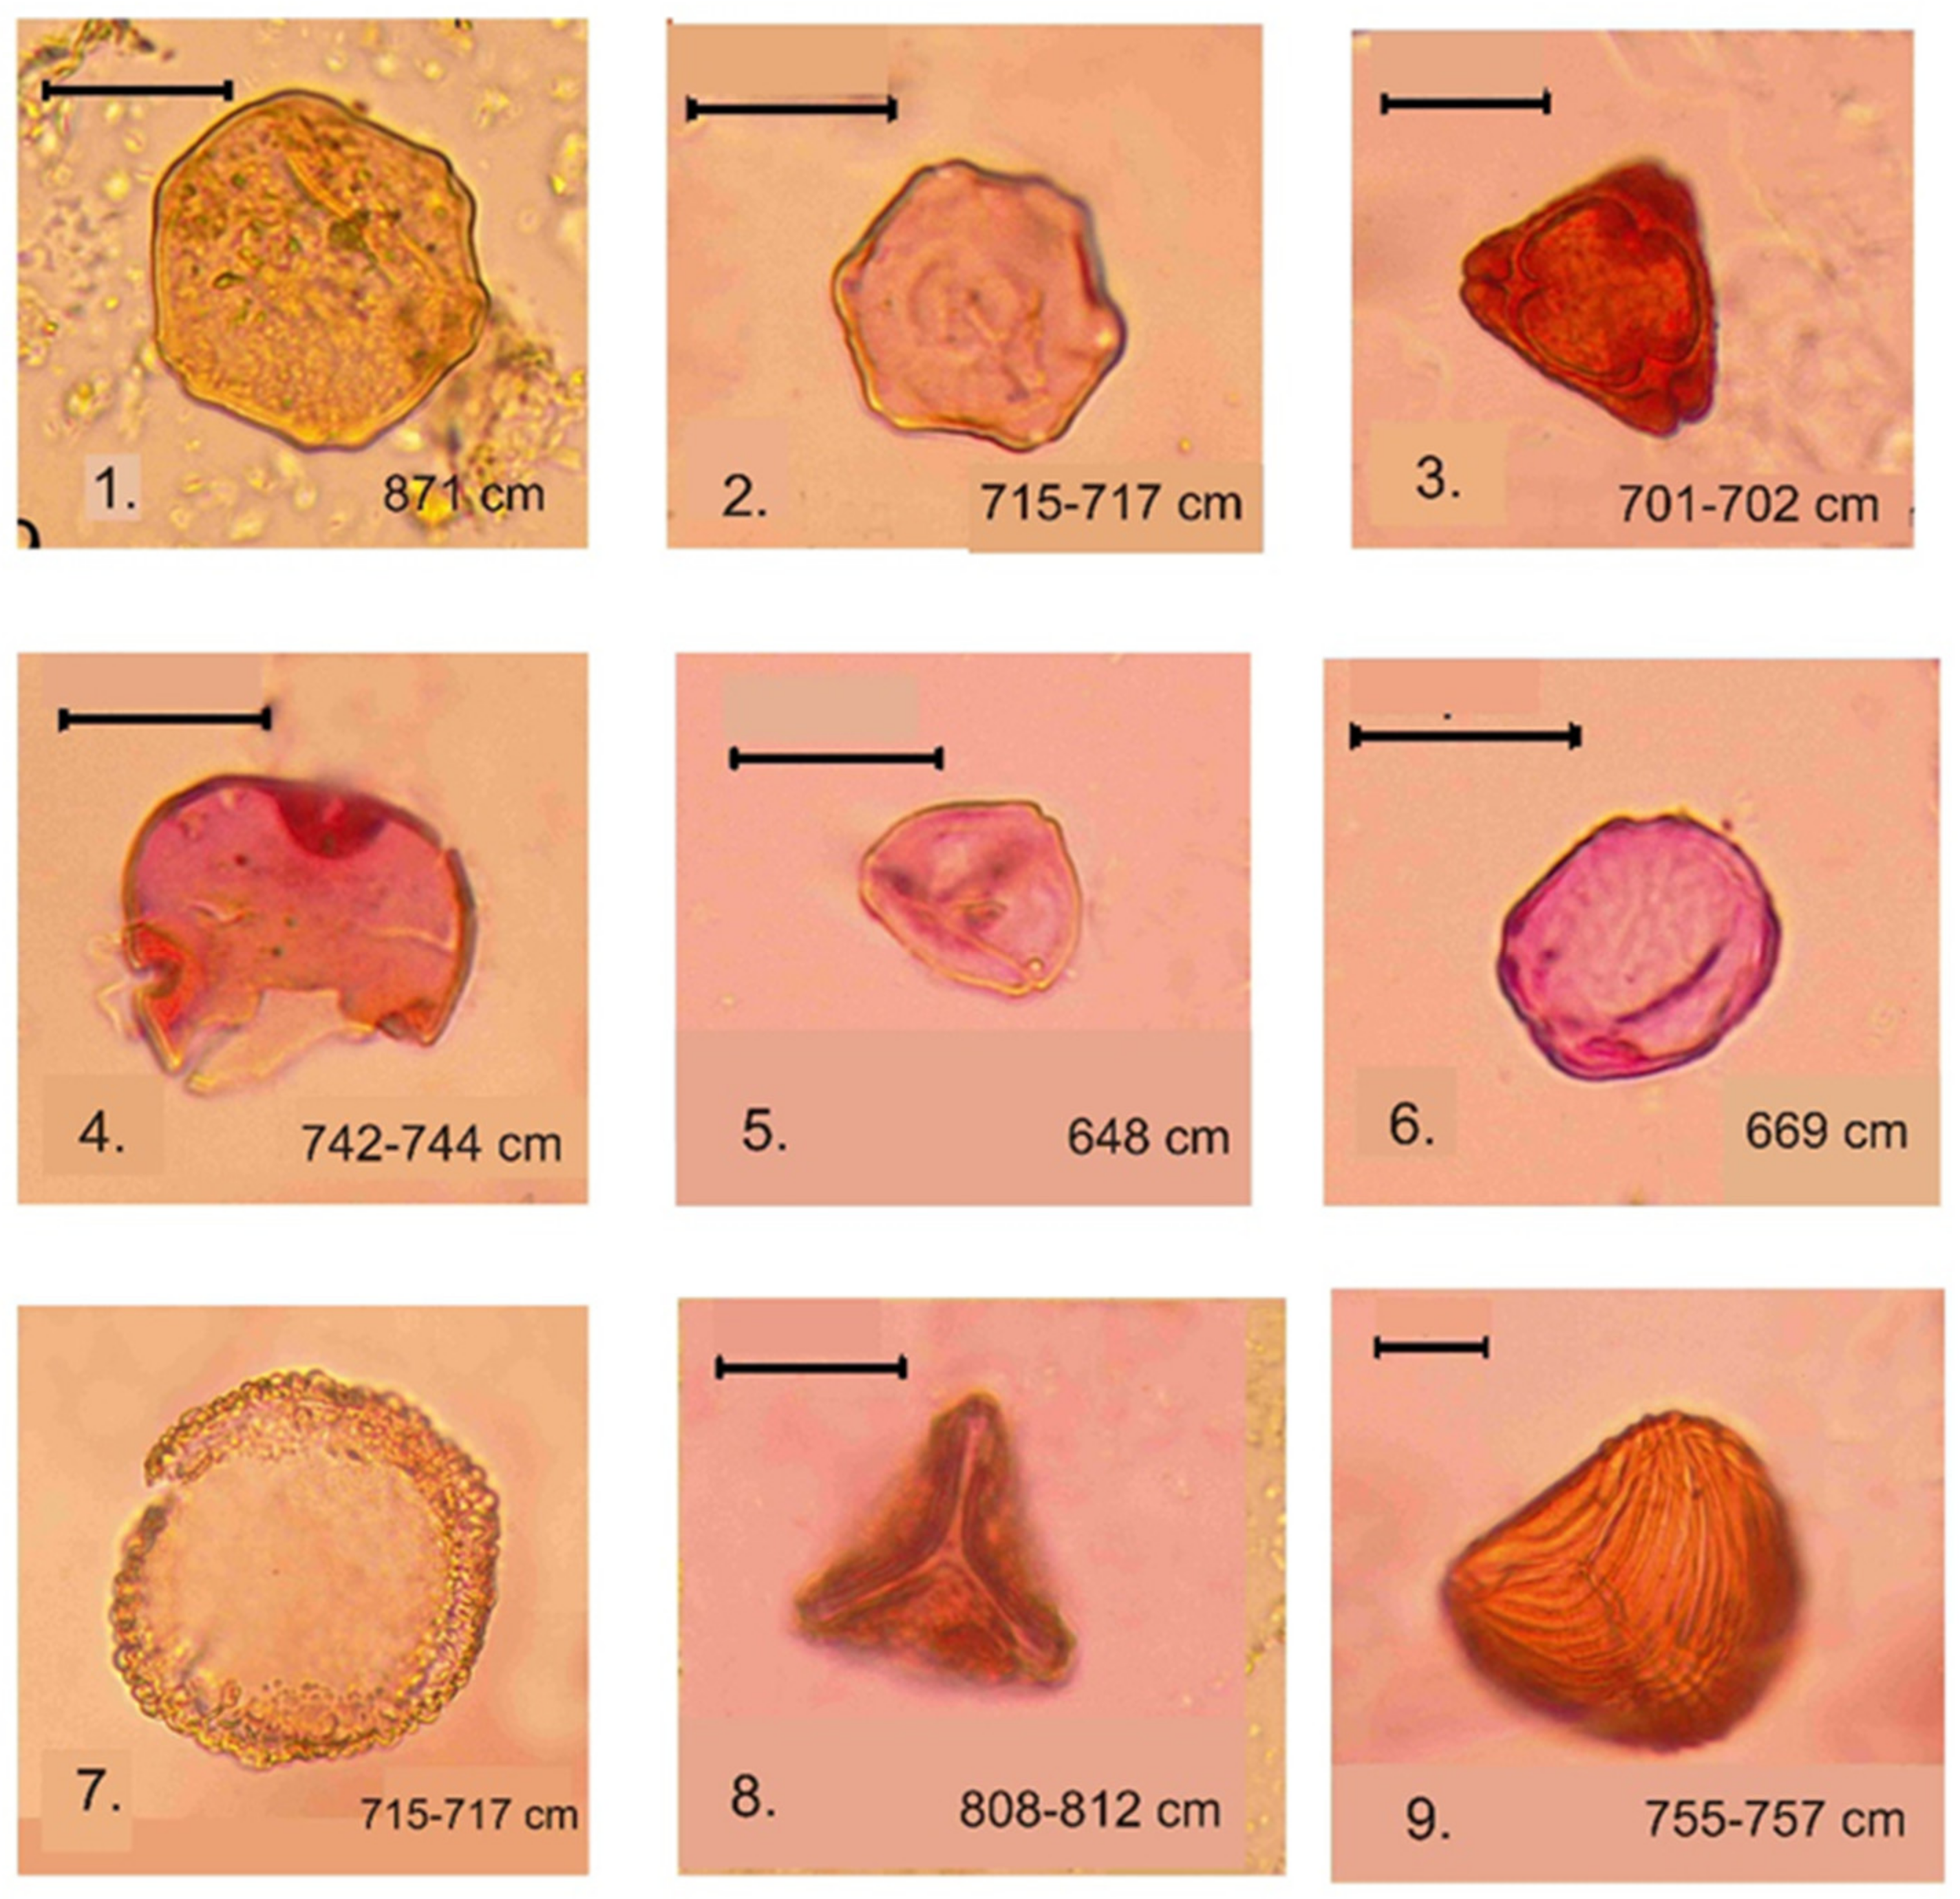
- LPZ-2 of spruce, larch, Siberian pine, and wormwood (Artemisia) was recognized at the depth 850–650 cm in gray lacustrine sediments. The reliable radiocarbon date for lacustrine sediments is for a depth of 789–791 cm (Table 3), which allows the LPZ-2 to be dated c. 9800 to 8600 cal. a BP. This pollen zone is characterized by the dominance of spruce, Siberian cedar, and larch pollen. Pollen of Scots pine and silver birch is present at a lower abundance. The abundance of downy birch pollen (Betula alba) is significantly reduced in comparison with the previous pollen zone, whereas the abundance of willow (Salix) and spirea (Spiraea) pollen increased. Of the herbal group, pollen of grasses, wormwood, and haze (Chenopoduiaceae) dominate. The abundance of pollen of Urticaceae, Lycopodium dubium, Lycopodium clavatum, Monolete, and Trilete fern spores also increased, as did spores of common mosses (Bryales). Microcharcoal particles are most abundant in this zone. A characteristic feature of this LPZ is an abundance and diversity of exotic Neogene and Paleogene pollen and spores (Tilia, Pterocarya, Carya, Mirica, Comptonia, Quercus, Tsuga, Trudopollis, and Ceratopteris identified according to [38,39,41]; see Figure 6).
- 3.
- LPZ-3 of spruce and silver birch pollen is found at the depth of 650–150 cm and covers layers of peaty gyttja and peat. The estimated age of the pollen zone according to the depth–age model is c. 8500–4300 cal. a BP. On the whole, the entire LPZ-3 is characterized by the dominance of the pollen of silver birch (Betula pendula) with a smaller proportion of the pollen of Scots pine and spruce and a very small proportion of Siberian pine (Pinus sibirica) pollen. Alder (Alnaster) is typically present and the abundance of dwarf birch pollen (Betula nana) gradually decreases toward the end of the zone. There is very little pollen from downy birch and wormwood. Components of local pollen are presented first by Myriophyllum, Nuphar, Tipha, and Menyanthes, then by Carex and Bryales, and, finally, by Sphagnum spores. Pollen of ericoid shrubs (Ericaceae) appears from about 316 cm (5980 cal. a BP).
4.5. Non-Pollen Palynomorph (NPP) Data
5. Discussion
5.1. Interpretation of Radiocarbon Dating
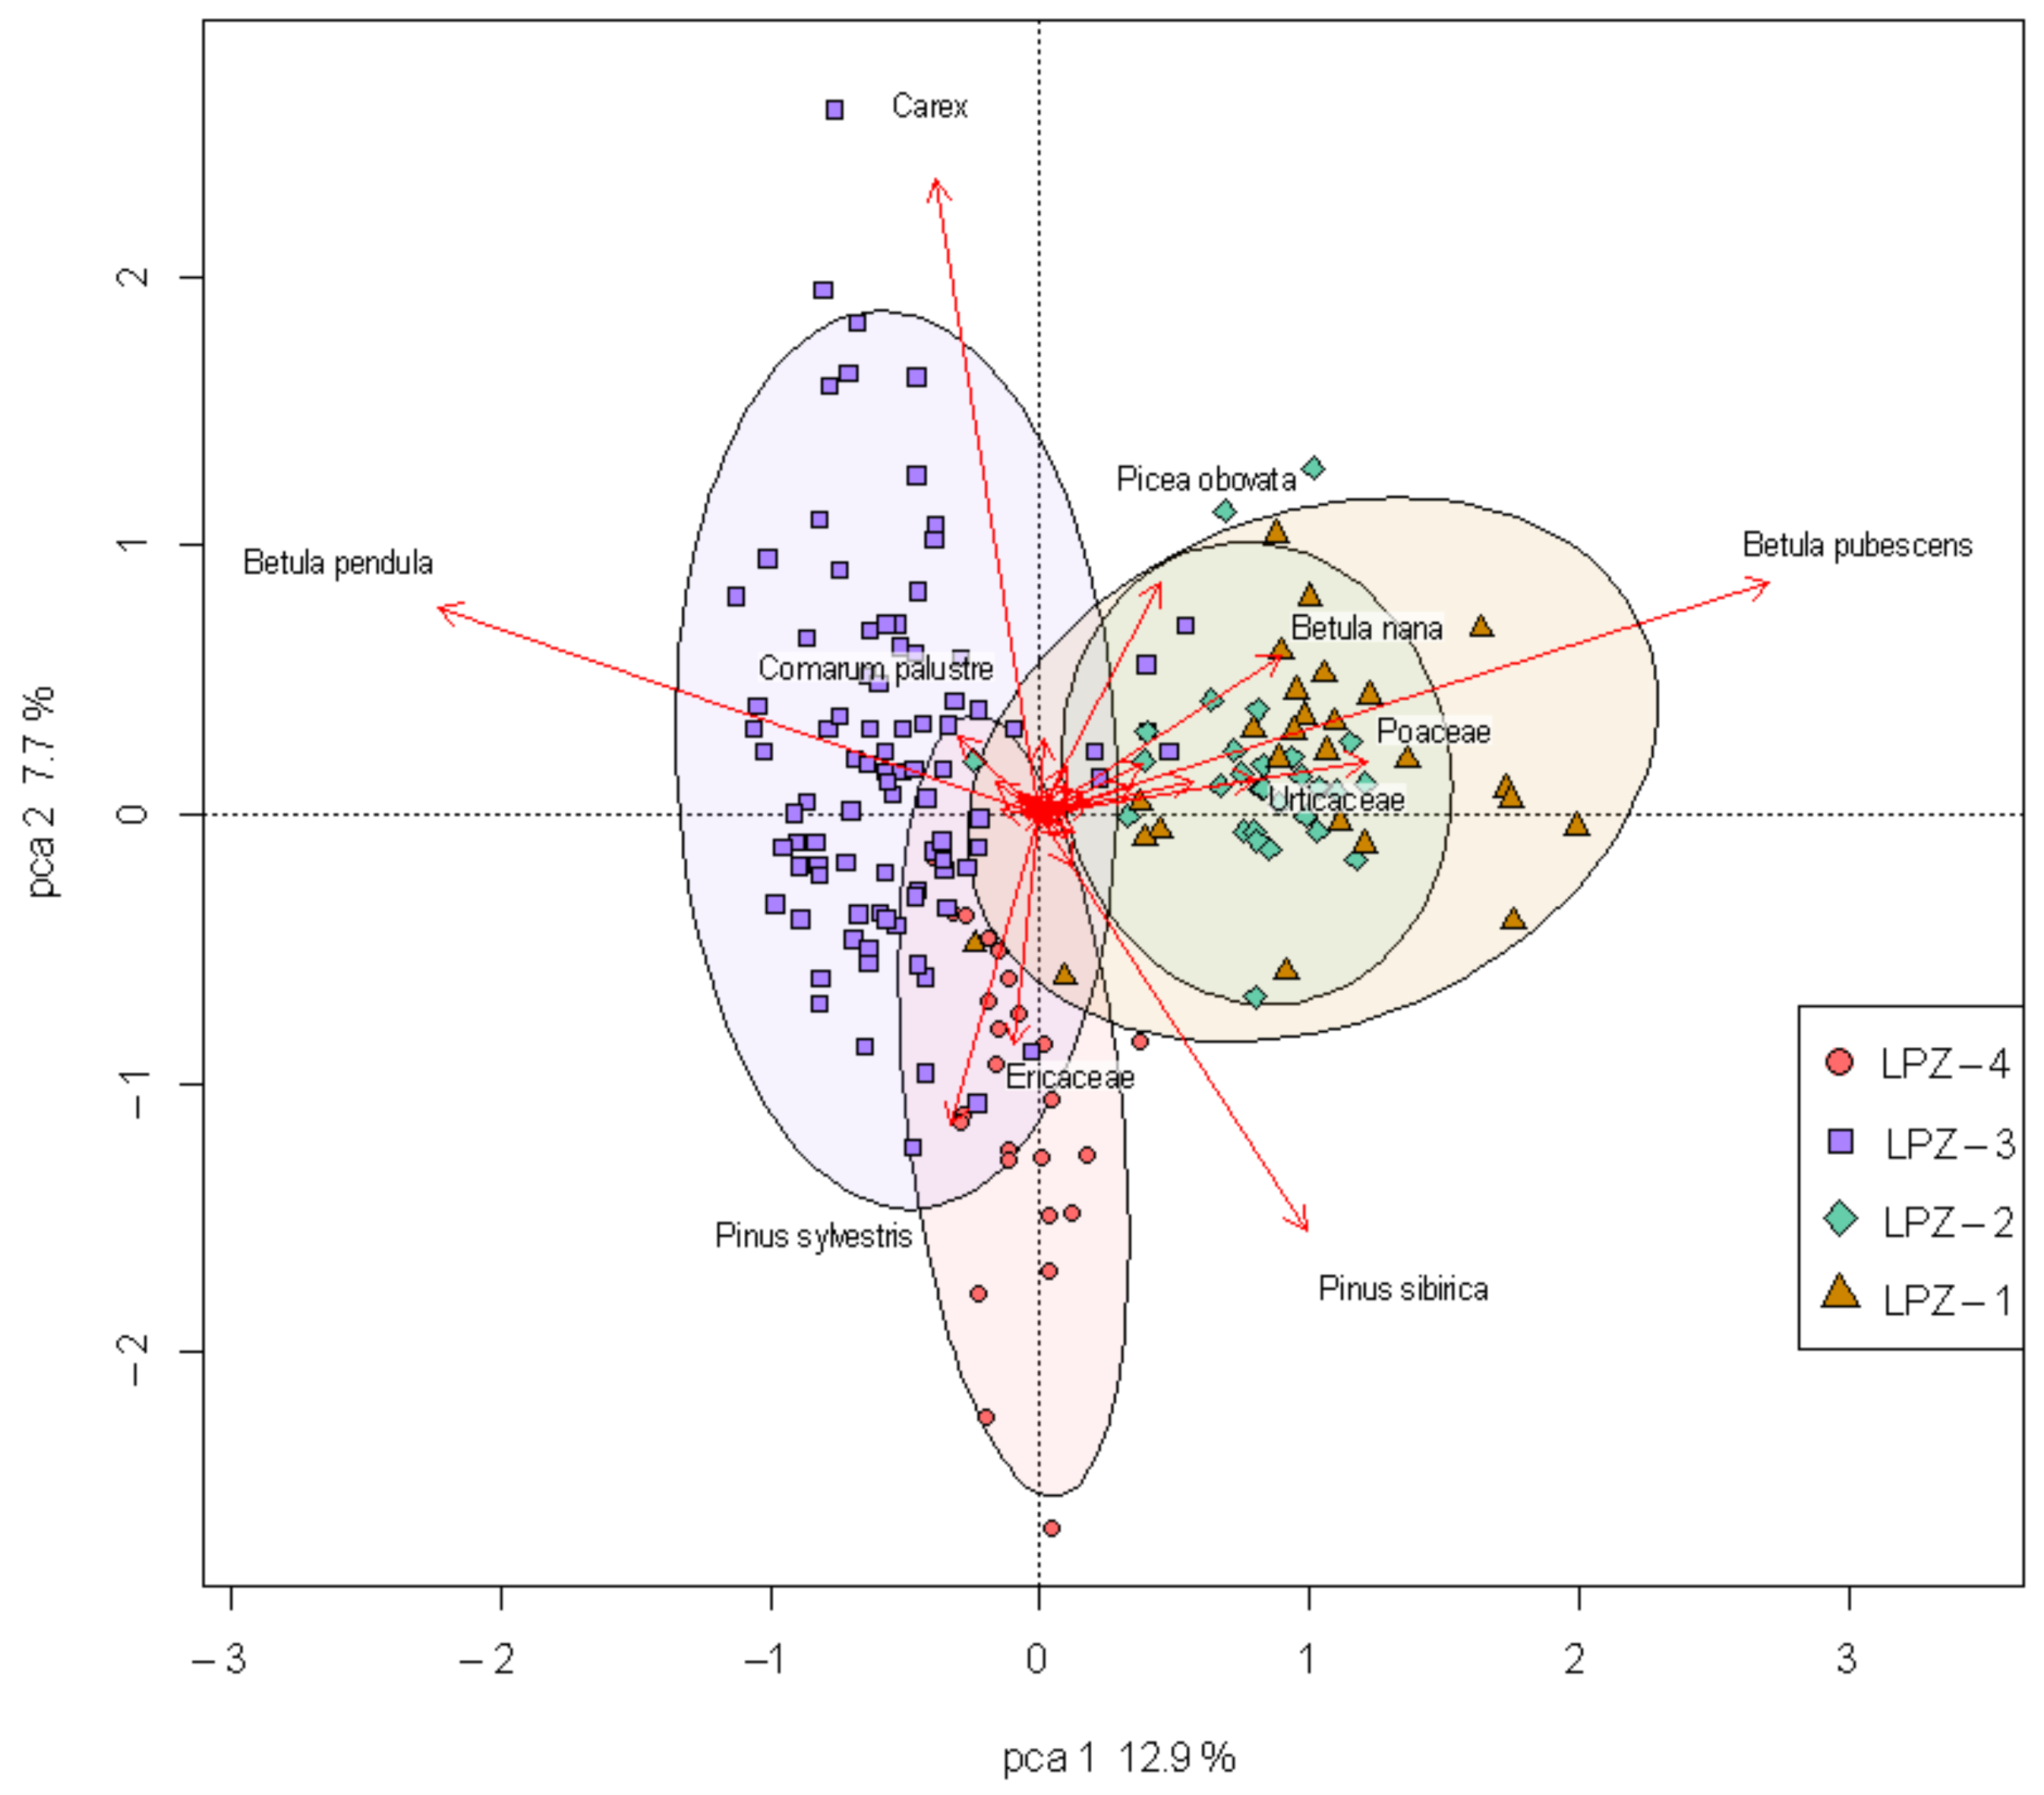
5.2. Principal Component Analysis of Nadym Pollen Data and Its Interpretation
- The first stage in landscape development is based on samples from deposits at a 1034–850 cm depth (LPZ-1) (non-defined age). Betula pubescens is the dominant component of this pollen assemblage. It is also characterized by a large species diversity of herbs (Poaceae, Apiaceae, Scrophulariaceae, Thalictrum, Onagraceae, Rosaceae, Galium, Potentilla, Lamiaceae), positively correlated with each other and with such tree species as Betula pubescens, Picea, Abies. Pollen of xerophytic species Artemisia and Chenopodiaceae and pollen of aquatic plants Nuphar, Myriaphyllum, and Typha are also associated with this period. Such pollen spectra reflect the dominance of birch–coniferous forests and lakes surrounded by thickets of willows and cattail in landscapes. Different water macrophytes (Nuphar, Myriophyllum) thrived in the lake. However, the same pollen assemblage indicates a presence of open dry tundra based on the abundance of xerophyte and dwarf birch pollen (Betula nana, Artemisia, Poaceae). The large ecological diversity of the pollen components probably reflects the mixed nature of the pollen assemblages at these depths, which include pollen from both glacial and interglacial landscapes. Pollen complexes of this stage are not in concert with literature data for this area [6], and the Early Holocene age of this stage is not supported through realistic radiocarbon dating. Thus, we assume that the first pollen assemblage can reflect ancient deposits of an (indetermined) Quaternary interstadial period. An alternative hypothesis could be that very warm and wet climatic conditions existed during the Late Glacial and Early Holocene time in northern West Siberia, which is inconsistent with previously published data. Both hypotheses, however, must be tested through additional research in the north of West Siberia.
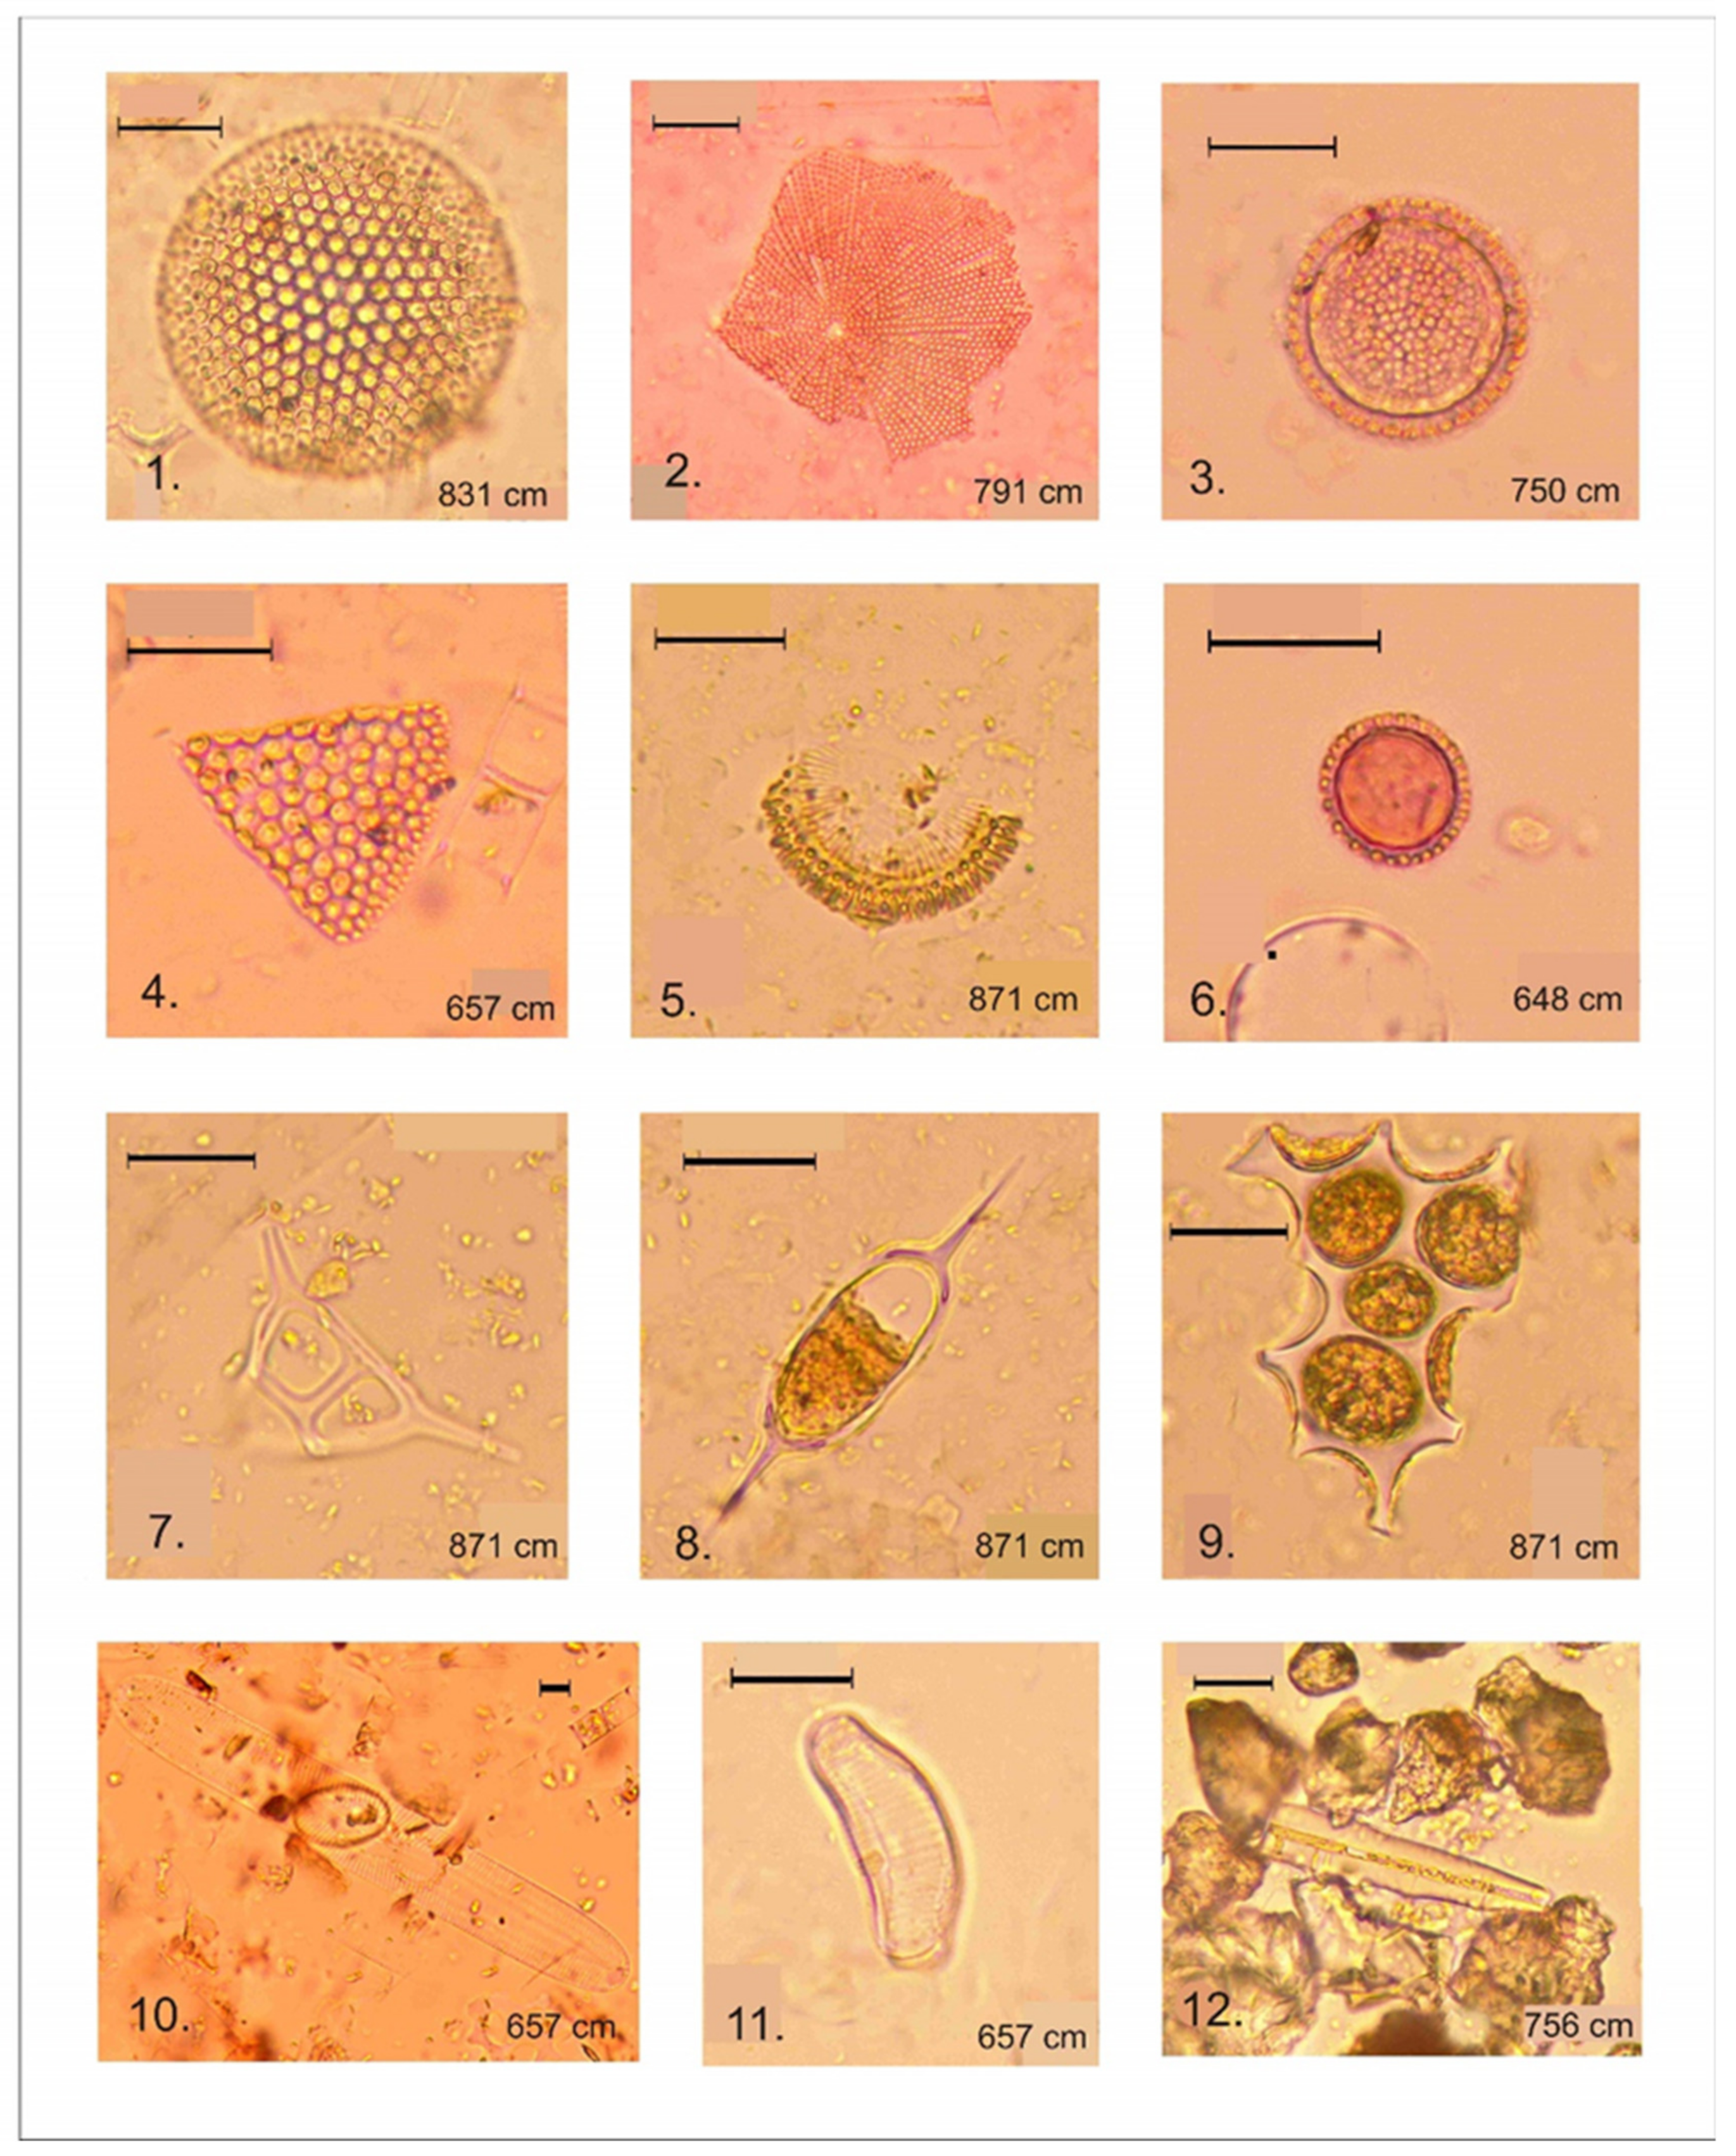
- The second stage in the development of landscape represented by pollen complexes of LPZ-2. In this stage, the xerophytic species of Artemisia and Chenopodiaceae and pollen shrub birch (Betula nana) together with aquatic and wetland plants—Typha and Myriaphyllum—are the most important. The radiocarbon dating of LPZ-2 is more realistic, covering c. 9800–8400 cal. a BP of the Early Holocene. The spectra are enriched by diatoms, exotic pollen, and NPPs (charcoal, Glomus, fungal spores), indicating intensive erosion of soil material into the lake basin. We assume that during the Early Holocene, the north part of West Siberia experienced increasingly wet conditions that caused redeposition of exotic pollen by flowing surface waters. Exotic pollen includes both very old Neogene pollen [40] and pollen redeposited from Quaternary interstadials. Thus, the pollen spectra of LPZ-2 became enriched in pollen of Picea and Pinus. Possibly, only pollen of Poaceae, Chenopodiaceae, Betula nana, and Lycopodium spores originates from Early Holocene vegetation. In general, however, the pollen spectra of this part of the sequence are mostly redeposited, and can be used for reconstruction of real vegetation of that time with great caution. The overlap of LPZ-1 and LPZ-2 in Figure 8 also visualizes the hypothesis about the mixed origin of pollen in LPZ-2.
- The third stage in the development of landscape is represented by LPZ-3. Betula pendula and Carex are taxa-abundant in LPZ-3, and plotted on the left side of the PCA biplot (Figure 8). During this stage, c. 8200–6000 cal. a BP, the landscapes of Nadym began to be dominated by birch swamp forests, combined with thawed sedge mires in eutrophic and mesotrophic states. Thickets of alder (Alnaster), whitehead (Filipendula), and burnet (Sanguissorba) were common at the margins of the mires. Sedges (Carex) alternated with areas of Menyanthes and Comarum palustre dominated the swamps. The pollen of all these species positively correlates with each other in the PCA biplot (Figure 8). We argue that these pollen complexes have an autochthonous origin and represent the real vegetation types that existed in the study area during the middle Holocene. It reflects spreading of birch forests and complex meso-oligotrophic bogs with trefoil (Menyanthes trifoliata) and scheuchzeria (Scheuchzeria palustris) thriving in wet hollows and cloudberries (Rubus chamaemorus) growing on ridges.
- The fourth stage in landscape development is reflected in LPZ-4. Typical taxa for LPZ-4 are located in the lower part of the PCA biplot. The leading pollen components are Pinus sylvestris and Ericaceae. They reflect dominance of pine forests and oligotrophic frozen peatlands (palsa bogs) in the landscape of Nadym. In these assemblages, pollen of Pinus sylvestris, Pinus sibirica, Larix sibirica, Ericaceae, and Drozera is positively correlated with each other.
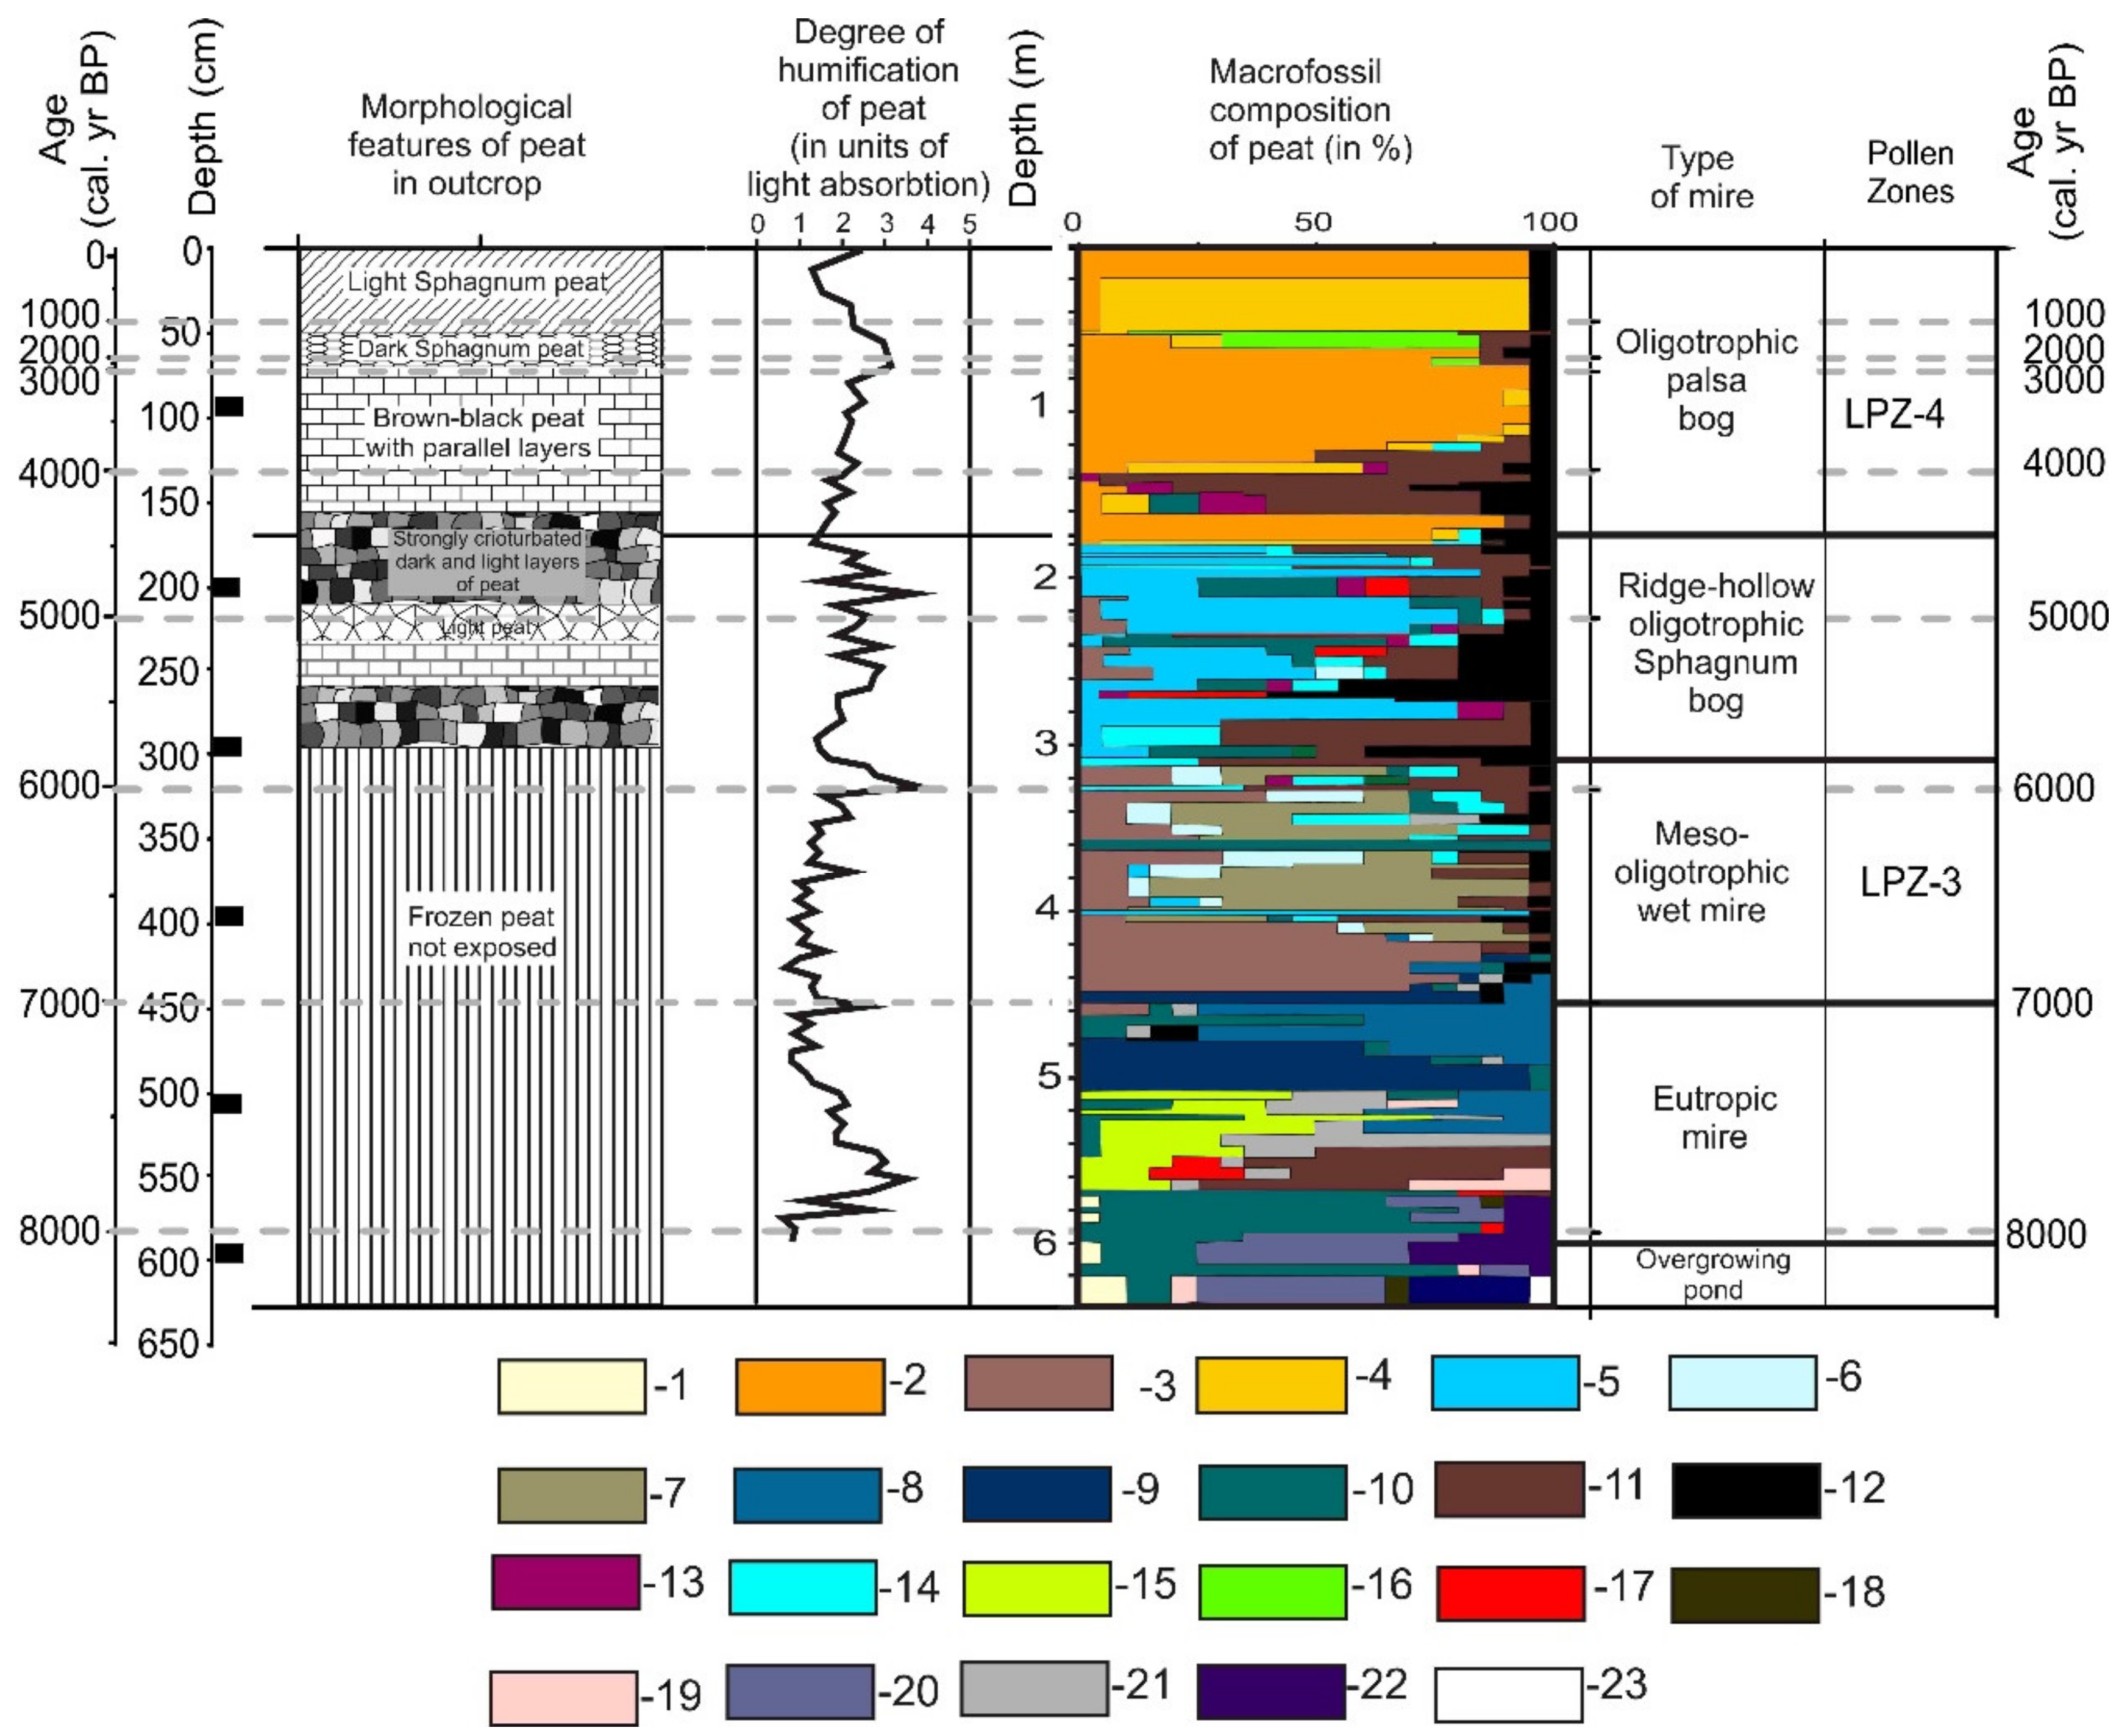
5.3. Interpretation of Macrofossil Data
- The stage of an overgrowing shallow lake (650–590 cm, 8400–8000 cal. a BP) was where aquatic macrophytes—Nuphar and Myriophyllum—thrived. Cattail (Typha) and dwarf birch (Betula nana) grew on the banks of the lake.
- A eutrophic (minerotrophic) mire was formed through the lake infilling process, c. 8000 cal. a BP. It existed from about 8000 to 7000 cal. a BP. In the peat core, this stage can be traced at the depth of 600–450 cm. It is represented first by layers of common moss (Hypnum) and cotton grass (Eriophorum), then by horsetail–sedge peat, and finally by pure minerotrophic Sphagnum peat. At the depth of 510 cm, the last herb–grass mire plant assemblage was replaced by a purely Sphagnum assemblage of the eutrophic (minerotrophic) hydrophytic Sphagnum species—Sphagnum teres—which was later replaced by the mesotrophic hydrophytic species—Sphagnum riparium. It reflects a gradual autogenic successional pathway of mire development from wet common moss carpets (Hypnum) with cotton grass tussocks to a wet horsetail–sedge mire and finally to a minerotrophic sphagnum mire. This succession reflects nutrient impoverishment as 140 cm of peat accumulates. Herbaceous peat has a high degree of humification, which decreased considerably with transition to Sphagnum peat. One can mention a sharp change in the dominance of some plant macrofossils compared to others.
- As peat accumulated, the mire became mesotrophic around c. 7000 cal. a BP (160 cm) and gradually transitioned to a meso-oligotrophic stage. Based on the ecology of plant species, the mire was thawed at this stage and heavily waterlogged (lawns of hydrophytic bog mosses and common mosses). The mesotrophic wet moss stage continued until c. 5800 cal. a BP (~1200 years between 450 and 300 cm). The peat was composed by Sphagnum mosses preferring meso-oligotrophic ecology. In the lower part of the stratum, there is a peat layer formed by the mesotrophic hydrophytic moss Sphagnum riparium. Above it lies a rather thick layer of peat formed by the meso-oligotrophic hydrophytic Sphagnum angustifolium. Above it, there is a layer of peat formed by Sphagnum jensenii, a species growing in transit spring mires and in wet hollows of oligotrophic string–flark patterned bogs. All of these plant species grow well in thawed waterlogged mires. At the end of the meso-oligotrophic stage, the species of cotton grass (Eryophorum sp.) and marsh dwarf shrubs increasingly spread on the mire. Heterogeneous microtopography of the string–flark pattern probably formed at the end of this stage. Cotton grass–dwarf shrub assemblages grow on the ridges and hydrophilic mosses in the hollows.
- After c. 5800 cal. a BP, the mire passed into the oligotrophic stage of development with the oligotrophic ridge–hollow patterns, which lasted for about 1300 years until c. 4400 cal. a BP (300–170 cm). The sequence is composed of alternating layers of cotton grass, Sphagnum, and common moss (Hypnum) peat. The contrasting ecology of plants, forming sharply alternating independent layers of peat, provides evidence for the existence of small-scale ridge–hollow surface patterns on the bog. Humid hollows were occupied by hydrophytic Sphagnum balticum (Russ.) Russ. Ex C. Jens, and ridges were covered by cotton grass–shrub cover and common moss Straminergon stramineum Dicks. Ex Rid.
- At the depth of 180 cm in the peat deposit, there is an abrupt change in peat formed by hydrophytic oligotrophic species Sphagum balticum to the peat of more xerophytic oligotrophic species—Sphagnum fuscum. This change took place at c. 4500 cal. a BP. Currently, such plant communities dominate the vegetation cover of low frozen peat mounds (palsa bogs). An abrupt change probably marks the beginning of frost heaving in the bog. Epigenic freezing of a previously thawed bog caused strong cryoturbation in the moisture-saturated peat layers (see Table 2, Figure 4), deposited earlier in the stage of the ridge–hollow patterned bog. An interlayer of peat formed by Carex juncella (Fries) Th. Fries together with the macroresidues of cotton grass, dwarf shrubs, and two Sphagnum species (Sphagnum jensenii and Sphagnum magellanicum) were observed at a depth of 52–54 cm. The intrusion of sedge–sphagnum peat can be evidence of thermokarst activity, which formed on a frozen mound at the turn of the new era, c. 2000 cal. a BP. Afterwards, the surficial layer of Sphagnum fuscum peat was formed again.
5.4. Interpretation of Humification Data
5.5. Quantitative Reconstruction of Paleoclimate
5.6. Holistic Synthesis of Multi-Proxy Paleoecological Data and Discussion
5.6.1. Reconstruction of Lake–Mire Development of the Nadym Section in Light of Quaternary Landscape and Climate Change
5.6.2. Joint Reconstruction of Landscape, Climate, Mire Development, and Vegetation Change during the Holocene Based on Paleoecological Data and Quantitative Reconstructions of Paleoclimate
- Phase of spruce–birch forests with open meadow spaces (LPZ-3a). At around c. 8400–7700 cal. a BP, open herbaceous meadows probably still played a significant role (based on the abundance of grass pollen). During this period, the overgrowing lake infilled and turned into a eutrophic wet swamp, in which common mosses and species of cotton grass (Eryophorum) and horsetail (Equisetum) dominated (Figure 4). At the beginning of peat accumulation, the low degree of humification indicates waterlogged mire conditions. A layer of peat with sharply increased humification seems to connect with remains of herbal plants (Carex cespitisa, horsetail, Menyanthes) [50,53]. These species assemblages reflect unstable hydrological environments, which form heterogeneous microtopography in the form of tussocks of sedges, which are raised above the water level, with bogbean and horsetail in wet areas between them. Such conditions eventually cause increased decomposition of plant remains and increased humification of forming peat. Quantitative reconstruction of paleoclimate using the Klimanov information–statistical method showed that mean annual temperatures were close to modern ones, but mean January temperatures were lower than modern ones at the beginning of this phase (8400–8200 cal. a BP) and higher than modern ones at the end of this phase (Figure 9). Thus, data from the Nadym core are in agreement with an episode of global cooling of 8200 cal. a BP, reconstructed in a number of studies on temperature change in the northern hemisphere [67].
- The phase of maximum spread of spruce forests (LPZ-3b). This phase lasted from c. 7700 to 6500 cal. a BP. Based on available proxy data, this was the Holocene optimum, during which winter temperatures were higher compared to modern ones (Figure 9). This probably contributed to the decrease in or complete disappearance of permafrost in soils, which, in turn, favored the northward shifting of taiga forests. Reconstructions of winter temperatures using the Nadym sequence are generally higher than modern ones, and were highly variable. During this period, the mire was in the eutrophic stage of development and eutrophic hydrophilic species of sphagnum Sphagnum teres spread, forming wide wet lawns. It is worthwhile to note that Sphagnum teres expansion coincides with the second peak of the increase in the degree of humification of peat, dated c. 7500 cal. a BP. This was followed by a sharp change from Sphagnum teres to the less hydrophilic mesotrophic Sphagnum angustifolium after the third maximum of humification (Figure 4). The last maximum in humification coincides with the series of decreases in total solar irradiance [56] (Figure 9c).
- The phase of coniferous–birch forests (LPZ-3c) lasted from 6500 to 4500 cal. a BP. During this 2000-year period, birch dominated the forest cover, and the role of spruce was significantly reduced compared to the previous period. At the same time, the role of the Siberian pine in the forests began to increase. This was a long and climatically stable period in which average global temperatures of the northern hemisphere gradually decreased [67,68]. Our quantitative temperature reconstructions using the information–statistical method of V.A. Klimanov (Figure 9) indicate mean annual temperatures that are stable and similar to modern ones. January temperatures decreased compared with the previous phase and were also similar to modern ones. Against this background of relatively stable temperatures, there were three episodes of a strong decrease in January temperatures (colder than modern), c. 6200, 5000, and 4650 cal. a BP. These episodes of low winter temperatures had a decisive influence on the endogenic development of the mire. The first episode of cooling, c. 6200 cal. a BP, is close to the fourth maximum in peat humification (Figure 4). Although this short-term cooling of the climate did not cause any noticeable changes in the vegetation cover of dry areas, it stimulated the transition of the mire from the mesotrophic stage to the stage of the oligotrophic ridge–hollow bog. The second episode of a sharp decrease in winter temperatures, which took place at c. 5000 cal. a BP, was also accompanied by a series of maxima in the degree of peat humification. As mentioned above, we believe that the alternation of peat layers composed of the remains of hydrophilic sphagnum mosses (Sphagnum jensenii, Sph. Angustifolium, and Sph. balticum) with layers of cotton grass and shrub peat during this period reflects the formation of a ridge–hollow micro relief on the bog. Frost heaving of peat could repeatedly occur in the ridges. They are marked by peaks of peat humification. The frequency of frost heaving increased toward the end of phase LPZ-3c, when there was a noticeable decrease in the average global temperature of the northern hemisphere [68]. A strong cryoturbation of these peat layers at the depth of 125–210 cm (3000–4800 cal. a BP) and deeper than 260 cm (over 5500 cal. a BP) is evidence of repeated epigenetic freezing of heavily waterlogged peat layers (Figure 4).
- The birch–pine forest phase (LPZ-4) covers the last 4500 cal. a BP. During this period, the abundance of Siberian pine and Scots pine increased sharply in the vegetation cover of the study area, while spruce and birch decreased. As noted above, since that time, the rate of peat accumulation has sharply slowed down. A sharp change in the macrofossil composition of peat from the remains of hydrophilic plants to more xerophytic plants of oligotrophic ecology took place at the depth of 160 cm at about 4400 cal. a BP and probably marks the freezing of the mire and the beginning of the formation of the palsa bog (Figure 3). Probably due to freezing and bulging of the peat bog, its surface dried up to such an extent that the main types of peat formers (bog mosses and common mosses) perished. The lichens that were established in their place did not form peat, but contributed to the decomposition of the previously deposited peat. The degree of peat humification increased sharply at a depth of 80 cm (about 3000 cal. a BP) (Figure 4). Siberian pine settled on its bulk surface. Individual Siberian pine trees with full crowns are presently found on the palsa bogs of the northern taiga (Supplemental Materials, Figure S1). A particularly strong decrease in winter temperatures according to the reconstructions of the Nadym sequence took place at c. 3000 cal. a BP (Figure 9). In the period of 3000–2000 cal. a BP, almost no peat was formed on the studied bog, and it is this thin layer of peat that has the maximum degree of humification over the entire period of peat accumulation. Samples from this depth (60–70 cm) have high concentrations of fine mineral detritus and had a relatively high content of microcharcoal particles. These features indicate long-term exposure of the surface of the peat bog without peat accumulation. Above and below this layer, mineral and charcoal pollution disappears. Perhaps this is a reflection of the increasing continentality of the climate, which would feature both colder winters and hotter summers. This does not contradict our reconstruction of the average January and average July temperatures for this time (Figure 9). The latter could stimulate thermokarst subsidence on the surface of the palsa bog. Evidence of such thermokarst activity is a layer of peat formed by the remains of sedge and cotton grass at the depth of 62–52 cm. Afterwards, the accumulation of Sphagnum peat from the remains of Sphagnum fuscum resumed. But the peat of the upper 50 cm has a low degree of humification, which increases only in the uppermost samples. These layers probably reflect the features of the accrotelm zone, complicated by a new frost-heave of the bog surface during the cooling period of the Little Ice Age (LIA).
6. Conclusions
- Deposits of the palsa bog have a thickness of 1050 cm, including 610 cm of peat, and are underlain by 440 cm of lacustrine and mineral deposits. Radiocarbon-dated Holocene deposits cover the upper 790 cm of sediments (including peat and lake sediments accumulated during the past 9400 cal. years). The radiocarbon dating of underlaying sediments (from 790 to 1050 cm) failed, demonstrating a too young or modern age. To explain this phenomenon, we assume that these sediments can be too old for the radiocarbon method containing radiocarbon ‘dead’ material. This hypothesis can be supported by 10 unsuccessful AMS radiocarbon dates and through composition of pollen and NPP spectra from these sediments. An alternative hypothesis suggests very warm and humid climate in the Late Glacial and Early Holocene period in the north of West Siberia favorable for spreading extensive coniferous forests. Further studies of additional sediment cores have to be conducted in this area to confirm one of the hypotheses.
- Well-dated Holocene lacustrine deposits underlying the peat in the Nadym sequence are enriched in redeposited pollen of the Neogene and Paleogene age, as well as remains of brackish and freshwater diatoms. We interpret this as evidence of an increasingly wet climate in combination with glacio-isostatic subsidence of the landscape, leading to lake formation during the Early Holocene. This caused run-off and erosion from areas of higher relief and redeposition of exotic pollen and diatom shells in a lake.
- The pollen data of the Nadym section are arranged in four local pollen zones (LPZs). The two bottom pollen zones LPZ-1 and LPZ-2 were distorted by redeposited pollen. Zones LPZ-3 and LPZ-4 reflect vegetation history more correctly. Based on pollen and macrofossil data, the history of dry land and mire vegetation was reconstructed.
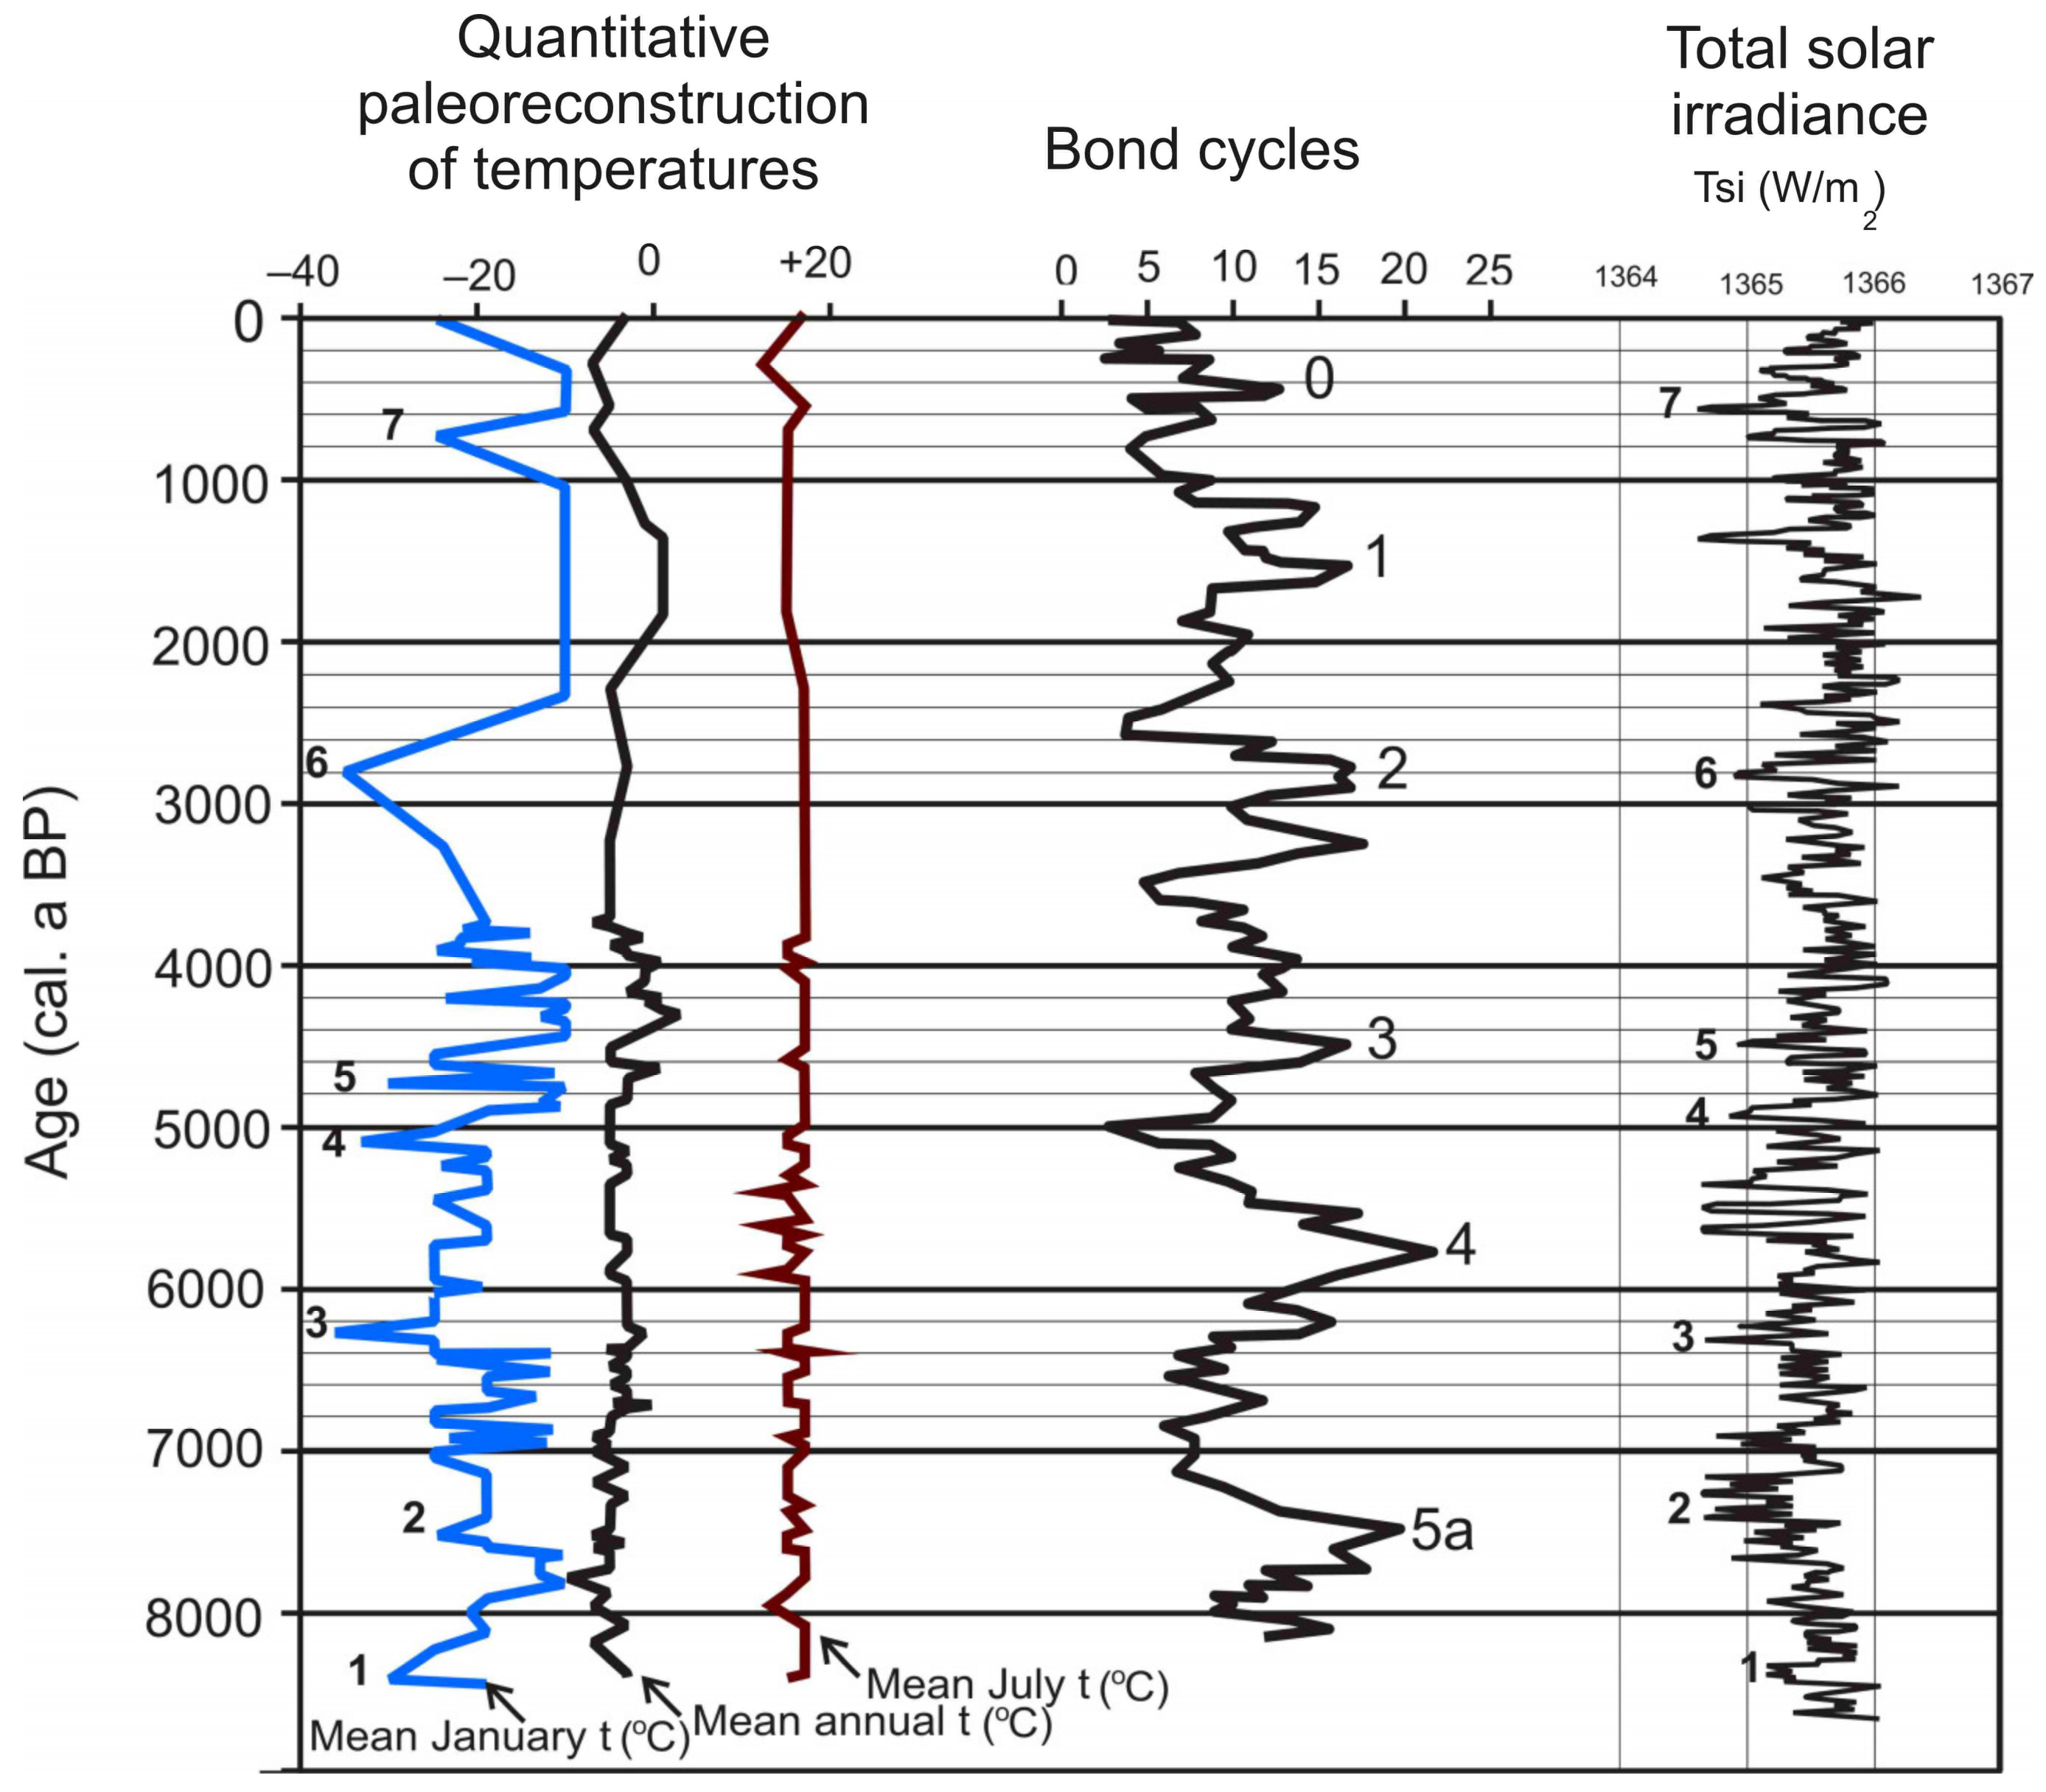
- Because of the complex history of sediments underlying the peat deposits, a quantitative reconstruction of paleoclimate was applied only to pollen data covering well-dated peat and lacustrine deposits above 790 cm (after c. 8200 cal. a BP). The reconstruction indicated seven periods of a strong decrease in the mean January temperatures and the relative stability of the mean July temperatures over this period.
- Most of the episodes with a sharp drop in mean January temperature reconstructed from the pollen data of the Nadym sequence coincide with periods of reduced solar activity [56] and they coincide with Bond cycles. Our results suggest a leading role for changes in solar radiation in the decrease in winter temperatures and in the formation of permafrost in soils and mires in the study area. Our reconstruction of the Nadym mire development confirms the “phase theory” of Barber [49,65], according to which climatic changes drive the growth of a raised bog. Impact of climate, however, is superimposed on autogenic successional development of the mire.
Supplementary Materials
Author Contributions
Funding
Data Availability Statement
Acknowledgments
Conflicts of Interest
References
- Groisman, P.V.; Blyakhrachuk, T.A.; Chernokulsky, A.V. Climate Change in Siberia. In Regional Environmental Changes in Siberia and their Global Consequences; Groisman, P.V., Gutman, G., Eds.; Springer Environmental Science and Engineering: Dordrecht, Germany, 2013; pp. 57–107. [Google Scholar]
- Callaghan, T.V.; Shauyko, O.; Kirpotin, S.N. Siberian environmental change: Synthesis or recent studies and opportunities for networking. Ambio 2021, 50, 2114–2127. [Google Scholar] [CrossRef] [PubMed]
- Stocker, T.F.; Qin, D.; Plattner, G.-K.; Tignor, M.; Allen, S.K.; Boschung, J.; Nauels, A.; Xia, Y.; Bex, V.; Midgley, P.M. (Eds.) IPCC, Summary for Policymakers. In Climate Change 2013: The Physical Science Basis. Contribution of Working Group I to the Fifth Assessment Report of the Intergovernmental Panel on Climate Change; Cambridge University Press: Cambridge, UK; New York, NY, USA, 2013. [Google Scholar]
- Khrustalev, L.N.; Klimenko, V.V.; Emel’yanova, L.V.; Ershov, E.D.; Parmuzin, S.Y.; Mikushina, O.V.; Tereshin, A.G. Dynamics of permafrost temperature in southern regions of cryolithozone under different scenarios of climate change. Kriosf. Zemli 2008, 12, 3–11. [Google Scholar]
- Slater, D.M.; Lawrence, D.M. Diagnosing present and future permafrost from climate models. J. Clim. 2013, 26, 5608–5623. [Google Scholar] [CrossRef]
- Kirpotin, S.N.; Blyakharchuk, T.A.; Vorobiev, S.N. The dynamics of the Subarctic flat-hillock bogs of the West Siberian Plain as an indicator of global climatic changes. Tomsk. Univ. Bull. Ser. Biol. Sci. 2003, 7, 122–134. [Google Scholar]
- Ponomereva, O.E.; Gravis, A.G.; Berdnikov, N.M.; Blyakharchuk, T.A. Climate change, frost action, and permafrost-related processes in the northern taiga region of West Siberia. In Proceedings of the Tenth International Conference on Permafrost, Salekhard, Russia, 25–29 June 2012; Volume 2, pp. 343–347. [Google Scholar]
- Bickaborn, B.K.; Smith, S.L.; Noetzli, J.; Matthes, H.; Vieira, G.; Streletskiy, D.A.; Schoeneich, P.; Romanovsky, V.E.; Lewkowicz, A.G.; Abramov, A.; et al. Permafrost is warming at a global scale. Nat. Commun. 2019, 106, 264–278. [Google Scholar] [CrossRef] [PubMed]
- Romanovsky, V.; Smith, S. Permafrost thermal state in the polar Northern hemisphere during the international polar year 2007–2009: A synthesis. Permafr. Periglac. Process 2010, 21, 106–116. [Google Scholar] [CrossRef]
- Streletskiy, D.; Anisimov, O.; Vasiliev, A. Permafrost degradation. In Snow and Ice-Related Hazards and Disasters; Haeberli, W., Whiteman, C., Shroder, J.F., Eds.; Elseivier Inc.: Amsterdam, The Netherlands, 2015; pp. 303–344. [Google Scholar] [CrossRef]
- Ponomareva, O.E.; Moskalenko, N.G.; Berdnikov, N.M.; Blyakharchuk, T.A.; Bochkarev, Y.N.; Ustinova, E.V.; Gravis, A.G.; Lobotrosova, S.A.; Matyshak, G.V.; Popov, K.A.; et al. Transformation of cryogenic geosystems in the southern part of the Arctic in Western Siberia under the influence of climate warming. Sci. Bull. Yamal-Nenets Auton. Okrug 2015, 2, 123–130. [Google Scholar]
- Turnocai, C.; Candell, J.; Achuur, E.; Kuhry, P.; Mazhitova, G.; Zimov, S. Soil organic carbon pools in the northern circumpolar permafrost region. Glob. Biogeochem Cycles 2009, 23, GB2023. [Google Scholar] [CrossRef]
- Wisser, D.; Marchenko, S.; Talbot, J.; Treat, C.; Frolking, S. Soil temperature response to 21-st century global warming: The role of and some implications for peat carbon thaving permafrost soils in North America. Earth Syst. Dyn. 2011, 2, 161–210. [Google Scholar] [CrossRef]
- Christensen, T.R.; Arora, V.K.; Gauss, M.; Höglund-Isaksson, L.; Parmentier, F.-J.W. Tracing the climate signal: Mitigation of anthropogenic methane emissions can outweigh a large Arctic natural emission increase. Nat.-Sci. Rep. 2019, 9, 1146–1153. [Google Scholar] [CrossRef]
- Routh, J.; Hugelius, G.; Kuhry, P.; Filley, T.; Tillman, P.K.; Becher, M.; Crill, P. Multi-proxy data of soil organic matter dynamics in permafrost peat deposits revealed vulnerability to climate change in the European Russian Arctic. Chem. Geol. 2014, 368, 104–117. [Google Scholar] [CrossRef]
- Mel’nikov, V.P. Complex Monitoring of Northern Taiga Geosystems in Western Siberia; Academic publishing house “Geo”: Novosibirsk, Russia, 2012. [Google Scholar]
- Gallego-Sala, A.V.; Charman, D.J.; Brewer, S.; Page, S.E.; Prentice, I.C.; Friedlingstein, P.; Moreton, S.; Amersbury, M.J.; Beilman, D.W.; Björck, S.; et al. Latitudinal limits to the predicted increase of the peatland carbon sink with warming. Nat. Clim. Chang. 2018, 8, 907–913. [Google Scholar] [CrossRef]
- Walter Anthony, K.M.; Zimov, S.A.; Grosse, G.; Jones, M.C.; Anthony, P.M.; Chapin, F.S., III; Finlay, J.C.; Mack, M.C.; Davydov, S.; Frenzel, P.; et al. A shift of thermokarst lakes from carbon sources to sinks during the Holocene epoch. Nature 2014, 511, 452–456. [Google Scholar] [CrossRef] [PubMed]
- Rull, V. Strong Fuzzy EHLFS: A general Conceptual Framework to Addr4ess past Recods of Environmental, Ecological and Cultural Change. Quaternary 2018, 1, 10. [Google Scholar] [CrossRef]
- Ershov, E.D. Geokriologiya SSSR. Zapadnaya Siber’ (Geocryology of the USSR. Western Siberia); Nedra: Moscow, Russia, 1989. [Google Scholar]
- Mel’nikov, E.C. Landscapes of the Permafrost Zone of the West Siberian Gas-Bearing Province; Nauka: Novosibirsk, Russia, 1983. [Google Scholar]
- Streletskaya, I.D.; Pismeniuk, A.A.; Vasiliev, A.A.; Gusev, E.A.; Oblogov, G.E.; Zadorozhnaya, N.A. Formation of ice rich permafrost and underground ice in the Late Neopleystic-Holocene in the north of Western Siberia. In Routes of Evolutionary Geography. Proceedings of the 2nd Scientific Conference in Memory of Prof. A.A. Velichko (Moscow, November 22-25, 20210 V.2); Institute of Geography RAS Press: Moscow, Russia, 2021; pp. 377–380. [Google Scholar]
- Moskalenko, N.G.; Ponomareva, O.E. Changes in vegetation and geocryological conditions of heaving mounds disturbed by linear construction in the northern taiga of Western Siberia. Earth’s Cryosphere 2004, 8, 10–16. [Google Scholar]
- Blaauw, M. Methods and code for ‘classical’ age-modelling of radiocarbon sequences. Quat. Geol. 2010, 5, 512–518. [Google Scholar] [CrossRef]
- Christen, J.A.; Perez, E.S. A new robust statistical model for radiocarbon data. Radiocarbon 2009, 51, 1047–1059. [Google Scholar] [CrossRef]
- Kulikova, G.G. A Short Guide to Botanical Analysis of Peat; Nedra: Moscow, Russia, 1974. [Google Scholar]
- Dombrovskaya, A.V.; Koreneva, M.M.; Tyuremnov, S.N. Atlas of Plant Macrofossils Found in Peat; Gosenergoizdat Press: Moscow-Leningrad, Russia, 1959. [Google Scholar]
- Savich-Lyubitskaya, L.I.; Smirnova, Z.N. Key to Sphagnum Mosses of the USSR; “Nauka” Press: Leningrad, Russia, 1968. [Google Scholar]
- Kats, N.Y.; Kats, S.V.; Skobeeva, E.I. Atlas of Plant’s Remnants in Peat; Nedra Publ.: Moscow, Russia, 1977. [Google Scholar]
- Mul’diyarov, E.Y. Key to Leaf-Stem Mosses of the Tomsk Region; Tomsk University Press: Tomsk, Russia, 1990. [Google Scholar]
- Revushkin, A.S. Reference Book of Plants of the Tomsk Region; Publishing house of Tomsk University: Tomsk, Russia, 2014. [Google Scholar]
- Chambers, F.M.; Beilman, Z.Y. Methods for determining peat humification and for quantifying peat bulk density, organic matter and carbon content for palaeostudies of climate and peatland carbon dynamics. Mires Peat 2011, 7, 1–10. [Google Scholar]
- Caseldine, C.J.; Baker, A.; Charman, D.J.; Hendeon, D.A. comparative study of optical properties of NaOH peat extracts: Implication for humification studies. Holocene 2000, 10, 649–658. [Google Scholar] [CrossRef]
- Grichuk, V.P.; Zaklinskaya, E.D. Analysis of Fossil Pollen and Spores and its Application in Paleogeography; Geografizdat Press: Moscow, Russia, 1948. [Google Scholar]
- Kupriyanova, L.A.; Aleshina, L.A. Pollen of Dicot Plant of the Flora of the European Part of the USSR; Nauka Press: Leningrad, Russia, 1978. [Google Scholar]
- Bobrov, A.E.; Kupriyanova, L.A.; Litvintseva, I.D.; Tarasevich, V.F. Spores of Fern-Like and Monocotyledonous Flora of the European Part of the USSR; Nauka Press: Leningrad, Russia, 1983. [Google Scholar]
- Moore, P.D.; Web, J.A.; Collinson, M.E. Pollen Analysis; Blackwell Science Ltd.: London, UK, 1991. [Google Scholar]
- Volkova, V.S.; Panova, L.A. Palynological characteristics of the Neogene deposits of Western Siberia. In Cenozoic Palynology; Volkova, V.S., Ed.; Nauka Press: Novosibirsk, Russia, 1975; pp. 34–52. [Google Scholar]
- Boitsova, E.P.; Panova, L.A.; Бoйцoва, E.П.; Панoва, Л.A. On the issue of the boundary between the Cretaceous and Paleogene systems in the south of Western Siberia. In Cenozoic Palynology; Volkova, V.S., Ed.; Nauka Press: Novosibirsk, Pussia, 1976; pp. 89–93. [Google Scholar]
- Ananova, E.N. Pollen in the Neogene Deposits of the South of the Russian Plain; Leningrad University Press: Leningrad, Russia, 1974. [Google Scholar]
- Kul’kova, I.A.; Laukhin, S.A. Palynology of the Paleogene deposits of the Yenisei Ridge. In Cenozoic Palynology; Volkova, V.S., Ed.; Nauka Publishing House: Novosibirsk, Russia, 1975; pp. 98–99. [Google Scholar]
- Paramonova, N.V. Materials by diatom algae from Palaeogene deposits of the north of West Siberia. In Palephitological Sbornik; Samoilovich, S.R., Ed.; Nedra Press: Moscow, Russia, 1965; pp. 234–246. [Google Scholar]
- Kramer, K.; Lange-Bertalot, H. Bacillariophyceae 3 Teil. Centrales, Fragillariaceae, Eunotiaceae; Spektrum Akademischer Verlag: Berlin/Heidelberg, Germany, 1991. [Google Scholar]
- Van Geel, B. A palaeoecological study of Holocene peat bog sections in Germany and The Netherlands. Rev. Palaebot. Palynol. 1987, 25, 1–120. [Google Scholar] [CrossRef]
- Van Geel, B.; Bohncke, S.J.P.; Dee, H. A palaeoecological study of an upper Late Glacial and Holocene sequence from “De Borchert”, The Netherlands. Rev. Palaeobot. Palynol. 1981, 31, 367–448. [Google Scholar] [CrossRef]
- Sweeney, C.A. A key for identification of stomata of the native conifers of Scandinavia. Rev. Palaeobot. Palynol. 2004, 128, 281–290. [Google Scholar] [CrossRef]
- Klimanov, V.A. Connection of subfossile spore-pollen spectra with modern climatic condition. Izv. Akad. Nauk. SSSR. Ser. Geogr. 1981, 5, 101–114. [Google Scholar]
- Grimm, E.C. TGView Version 2.0.41; Illinois State Museum Research and Collections Center: Springfield, IL, USA, 2004. [Google Scholar]
- Barber, K.E. Peat Stratigraphy and Climatic Change; Balkema Press: Rotterdam, The Netherlands, 1981. [Google Scholar]
- Overbeck, F. Studien zur Hochmoorentwicklung in Niedersachsen und die Bestimmung der Humifizierung bei stratigraphisch-pollenalalytischen Mooruntersuchungen. Planta 1947, 35, 1–56. [Google Scholar] [CrossRef]
- Clymo, R.S. Peat growth. In Quaternary Landscapes; Shane, I.C.K., Cushing, E.J., Eds.; Belhaven Press: London, UK, 1991; pp. 76–112. [Google Scholar]
- Payne, R.J.; Blackford, J.J. Peat humification and climate change: A multi-site comparison from mires in south-east Alaska. Mires Peat 2008, 3, 1–11. [Google Scholar]
- Yeloff, D.; Maquoy, D. The influence of vegetation composition on peat humification: Implications for palaeoclimatic studies. Boreas 2006, 35, 662–673. [Google Scholar] [CrossRef]
- Shumilova, L.V. Botanical Geography of Siberia; Tomsk University Press: Tomsk, Russia, 1966; 430p. [Google Scholar]
- Bond, G.; Kromer, B.; Beer, J.; Muscheler, R.; Evans, M.N.; Showers, W.; Hoffmann, S.; Lotti-Bond, R.; Hajdas, I.; Bonani, G. Persistent Solar Influence on North Atlantic climate during the Holocene. Science 2001, 294, 2130–2136. [Google Scholar] [CrossRef]
- Steinhilber, F.; Beer, J.; Fröhlich, C. Total solar irradiance during the Holocene. Geophis. Res. Lett. 2009, 36, L19704. [Google Scholar] [CrossRef]
- Zigert, H.G. Mineral formation in the area of permafrost. In Structure and Thermal Regime of Sear Rocks; Katasonova, E.G., Pavlov, A.V., Eds.; Nauka Press: Novosibirsk, Russia, 1981; pp. 14–21. [Google Scholar]
- Rogov, V.V. Fundamentals of Cryogenesis (Educational Manual); Academic publishing house “GEO”: Novosibirsk, Russia, 2009. [Google Scholar]
- Velichko, A.A.; Timireva, S.N.; Kremenetski, K.V.; MacDonald, G.M.; Smith, L.C. West Siberian Plain as a late glacial desert. Quat. Int. 2011, 237, 45–53. [Google Scholar] [CrossRef]
- Vink, A.; Steffen, L.; Reinhard, L.; Kaufmann, G. Holocene relative sea-level change, isostatic subsidence and the radial viscosity structure of the mantle of northwest Europe (Belgium, the Netherlands, Germany southern North Sear). Quat. Sci. Rev. 2007, 26, 3249–3275. [Google Scholar] [CrossRef]
- Engelhart, S.E.; Horton, B.P.; Kopp, R.E.; Nelson, A.R.; Vacchi, M. A sea-level database for the Pacific coast of central North America. Quat. Sci. Rev. 2015, 113, 78–92. [Google Scholar] [CrossRef]
- Baranskaya, A.V.; Khan, N.S.; Romanenko, F.Q.A.; Roy, K.; Peltier, W.R.; Horton, B.P. A postglacial relative sea-level database for the Russian Arctic coast. Quat. Sci. Rev. 2018, 199, 188–205. [Google Scholar] [CrossRef]
- Baranskaya, A.V.; Zakharov, A.L.; Sorokovikov, V. Holocene sea-level changes in the Russian arctic, and sediments of laides and shallow bays as their indicators. In Routes of Evolutionary Geography. Proceedings of the 2nd Scientific Conference in Memory of Prof. A.A. Velichko (Moscow, November 22-25, 2021); Institute of Geography RAS Press: Moscow, Russia, 2021; pp. 32–36. [Google Scholar]
- Stein, R.; Niessen, F.; Dittmers, K.; Levitan, M.; Schoster, F.; Simstich, J.; Steinke, T.; Stepanets, O.V. Siberian river run-off and|Late Quaternary glaciation in the southern Kara Sear, Arctic ocean: Preliminary results. Polar Res. 2002, 21, 315–322. [Google Scholar] [CrossRef]
- Janssens, J.A.; Hansen, B.C.S.; Glaser, P.H.; Whitlock, C. Development of Raised-Bog Complex. In The Patterned Peatlands of Minnesota; Wright, H.E., Jr., Coffin, B., Aeseng, N.E., Eds.; University of Minnesota Press: Minneapolis, MN, USA; London, UK, 1992; pp. 189–221. [Google Scholar]
- Pastukhov, A.; Marchenko-Vagapove, T.; Loiko, S.; Kaverin, D. Vulnerability of the Ancient Peat Plateaus in Western Siberia. Plants 2021, 10, 2813. [Google Scholar] [CrossRef]
- Kaufman, D.; KcKay, N.; Routson, C.; Erb, M.; Dätviler, C.; Sommer, P.S.; Heiri, O.; Davis, B. Holocene global mean surface temperature, a multi-method reconstruction approach. Sci. Data 2020, 7, 201. [Google Scholar] [CrossRef]
- Wanner, H.; Solomina, O.; Grosjean, M.; Ritz, S.P.; Jetel, M. Structure and origin of Holocene cold events. Quat. Sci. Rev. 2011, 30, 3109–3123. [Google Scholar] [CrossRef]


| Average Monthly t (°C) | Average Annual t (°C) | Annual Precipitation (mm) | |
|---|---|---|---|
| January | July | ||
| −24 | 13.5 | −6.6 | 449 |
 |
| Depth (cm) | Age C14 (yr BP) | Calibrated Age ** (cal. a BP) | Laboratory № | Method | Material |
|---|---|---|---|---|---|
| 23–25 | 422 ± 45 | 529–425 | SUERC-48843 | AMS | Peat bulk |
| 27–29 | 740 ± 45 | 732–644 | SUERC-48844 | AMS | Peat bulk |
| 2–54 | 1288 ± 45 | 1236–1174 | UBA-44701 | AMS | Peat bulk |
| 79–82 | 3450 ± 65 | 3883–3560 | SOAN-8379 | LSA | Peat bulk |
| 189–200 | 4560 ± 120 | 5478–4953 | SOAN-8380 | LSA | Peat bulk |
| 290–300 | 5540 ± 115 | 6564–6171 | SOAN-8381 | LSA | Peat bulk |
| 390–406 | 5960 ± 125 | 7031–6498 | SOAN-8382 | LSA | Peat bulk |
| 505–512 | 6530 ± 110 | 7597–7255 | SOAN-8383 | LSA | Peat bulk |
| 585–598 | 6945 ± 110 | 7964–7604 | SOAN-8384 | LSA | Peat bulk |
| 601–610 | 7503 ± 47 | 8388–8276 | NTU AMS-3485 | AMS | Peat bulk |
| 681–683 | 7173 ± 122 * | NTU AMS-3487 | AMS | Gyttja bulk | |
| 728–730 | 5365 ± 31 * | NTU AMS-3486 | AMS | Gyttja bulk | |
| 789–791 | 8321 ± 45 | 9463–9249 | NSK00474 | AMS | Gyttja bulk |
| 829–831 | 7110 ± 60 * | NTUAMS-3777 | AMS | Gyttja bulk | |
| 882–884 | Failed * | UBA-44702 | AMS | Macrofossils | |
| 961–962 | 2048 ± 35 * | UBA-44703 | AMS | Macrofossils | |
| 966–968 | 2048 ± 35 * | UBA-44703 | AMS | Macrofossils | |
| 1000–1007 | Failed * | UBA-44704 | AMS | Macrofossils | |
| 1063–1076 | Modern * | UBA-44705 | AMS | Macrofossils | |
| 1074–1076 | Modern * | NTUAMS-3478 | AMS | Gyttja bulk | |
| 1074–1076 | Failed * | UBA-44706 | AMS | Macrofossils |
Disclaimer/Publisher’s Note: The statements, opinions and data contained in all publications are solely those of the individual author(s) and contributor(s) and not of MDPI and/or the editor(s). MDPI and/or the editor(s) disclaim responsibility for any injury to people or property resulting from any ideas, methods, instructions or products referred to in the content. |
© 2023 by the authors. Licensee MDPI, Basel, Switzerland. This article is an open access article distributed under the terms and conditions of the Creative Commons Attribution (CC BY) license (https://creativecommons.org/licenses/by/4.0/).
Share and Cite
Blyakharchuk, T.; Shefer, N.; Ponomareva, O.; Li, H.-C. Late Quaternary Dynamics of Landscape and Climate in the North of the West Siberian Plain Revealed by Paleoecological Studies of Peat and Lake Sediments. Quaternary 2024, 7, 1. https://doi.org/10.3390/quat7010001
Blyakharchuk T, Shefer N, Ponomareva O, Li H-C. Late Quaternary Dynamics of Landscape and Climate in the North of the West Siberian Plain Revealed by Paleoecological Studies of Peat and Lake Sediments. Quaternary. 2024; 7(1):1. https://doi.org/10.3390/quat7010001
Chicago/Turabian StyleBlyakharchuk, Tatina, Nikita Shefer, Olga Ponomareva, and Hong-Chun Li. 2024. "Late Quaternary Dynamics of Landscape and Climate in the North of the West Siberian Plain Revealed by Paleoecological Studies of Peat and Lake Sediments" Quaternary 7, no. 1: 1. https://doi.org/10.3390/quat7010001