
Clinical Phenotype Imprints on Brain Atrophy Progression in Parkinson’s Disease

 , , ,
, , ,
Abstract
:1. Introduction
2. Materials and Methods
2.1. Study Population
2.2. Clinical Assessment
2.3. Brain MRI
2.4. MRI Data Pre-Processing
2.5. Statistical Analysis
3. Results
3.1. Clinical Phenotype
3.2. Brain Anatomy
Rate of Volume Change
4. Discussion
Supplementary Materials
Author Contributions
Funding
Institutional Review Board Statement
Informed Consent Statement
Data Availability Statement
Acknowledgments
Conflicts of Interest
References
- Postuma, R.B.; Berg, D.; Stern, M.; Poewe, W.; Olanow, C.W.; Oertel, W.; Obeso, J.; Marek, K.; Litvan, I.; Lang, A.E.; et al. MDS clinical diagnostic criteria for Parkinson’s disease. Mov. Disord. 2015, 30, 1591–1601. [Google Scholar] [CrossRef] [PubMed]
- Schneider, S.A.; Obeso, J.A. Clinical and pathological features of Parkinson’s disease. Curr. Top. Behav. Neurosci. 2015, 22, 205–220. [Google Scholar] [PubMed]
- Draganski, P.B.; Accolla, E.A. Morphometric Analyses in Movement Disorders. In Neuroimaging of Movement Disorders; Nahab, F.B., Hattori, N., Eds.; Humana Press: Totowa, NJ, USA, 2013; pp. 25–47. [Google Scholar]
- Gee, M.; Dukart, J.; Draganski, B.; Wayne Martin, W.R.; Emery, D.; Camicioli, R. Regional volumetric change in Parkinson’s disease with cognitive decline. J. Neurol. Sci. 2017, 373, 88–94. [Google Scholar] [CrossRef] [PubMed] [Green Version]
- Uribe, C.; Segura, B.; Baggio, H.C.; Abos, A.; Marti, M.J.; Valldeoriola, F.; Compta, Y.; Bargallo, N.; Junque, C. Patterns of cortical thinning in nondemented Parkinson’s disease patients. Mov. Disord. 2016, 31, 699–708. [Google Scholar] [CrossRef] [PubMed] [Green Version]
- Mak, E.; Su, L.; Williams, G.B.; Firbank, M.J.; Lawson, R.A.; Yarnall, A.J.; Duncan, G.W.; Owen, A.M.; Khoo, T.K.; Brooks, D.J.; et al. Baseline and longitudinal grey matter changes in newly diagnosed Parkinson’s disease: ICICLE-PD study. Brain J. Neurol. 2015, 138 Pt 10, 2974–2986. [Google Scholar] [CrossRef]
- Hanganu, A.; Bedetti, C.; Degroot, C.; Mejia-Constain, B.; Lafontaine, A.L.; Soland, V.; Chouinard, S.; Bruneau, M.-A.; Mellah, S.; Belleville, S.; et al. Mild cognitive impairment is linked with faster rate of cortical thinning in patients with Parkinson’s disease longitudinally. Brain J. Neurol. 2014, 137 Pt 4, 1120–1129. [Google Scholar] [CrossRef] [Green Version]
- Segura, B.; Baggio, H.C.; Marti, M.J.; Valldeoriola, F.; Compta, Y.; Garcia-Diaz, A.I.; Vendrell, P.; Bargallo, N.; Tolosa, E.; Junque, C. Cortical thinning associated with mild cognitive impairment in Parkinson’s disease. Mov. Disord. 2014, 29, 1495–1503. [Google Scholar] [CrossRef]
- Pieperhoff, P.; Südmeyer, M.; Dinkelbach, L.; Hartmann, C.J.; Ferrea, S.; Moldovan, A.S.; Minnerop, M.; Diaz-Pier, S.; Schnitzler, A.; Amunts, K. Regional changes of brain structure during progression of idiopathic Parkinson’s disease—A longitudinal study using deformation based morphometry. Cortex J. Devoted Study Nerv. Syst. Behav. 2022, 151, 188–210. [Google Scholar] [CrossRef]
- Tessa, C.; Lucetti, C.; Giannelli, M.; Diciotti, S.; Poletti, M.; Danti, S.; Baldacci, F.; Vignali, C.; Bonuccelli, U.; Mascalchi, M.; et al. Progression of brain atrophy in the early stages of Parkinson’s disease: A longitudinal tensor-based morphometry study in de novo patients without cognitive impairment. Hum. Brain Mapp. 2014, 35, 3932–3944. [Google Scholar] [CrossRef]
- Menke, R.A.L.; Szewczyk-Krolikowski, K.; Jbabdi, S.; Jenkinson, M.; Talbot, K.; Mackay, C.E.; Hu, M. Comprehensive morphometry of subcortical grey matter structures in early-stage Parkinson’s disease. Hum. Brain Mapp. 2014, 35, 1681–1690. [Google Scholar] [CrossRef]
- Ashburner, J.; Csernansky, J.G.; Davatzikos, C.; Fox, N.C.; Frisoni, G.B.; Thompson, P.M. Computer-assisted imaging to assess brain structure in healthy and diseased brains. Lancet Neurol. 2003, 2, 79–88. [Google Scholar] [CrossRef]
- Hallgren, B.; Sourander, P. The effect of age on the non-haemin iron in the human brain. J. Neurochem. 1958, 3, 41–51. [Google Scholar] [CrossRef]
- Gibb, W.R. Accuracy in the clinical diagnosis of parkinsonian syndromes. Postgrad. Med. J. 1988, 64, 345–351. [Google Scholar] [CrossRef] [Green Version]
- Lorio, S.; Fresard, S.; Adaszewski, S.; Kherif, F.; Chowdhury, R.; Frackowiak, R.S.; Ashburner, J.; Helms, G.; Weiskopf, N.; Lutti, A.; et al. New tissue priors for improved automated classification of subcortical brain structures on MRI. NeuroImage 2016, 130, 157–166. [Google Scholar] [CrossRef] [Green Version]
- Ashburner, J.; Ridgway, G.R. Symmetric diffeomorphic modeling of longitudinal structural MRI. Front. Neurosci. 2012, 6, 197. [Google Scholar] [CrossRef] [Green Version]
- Ashburner, J. A fast diffeomorphic image registration algorithm. NeuroImage 2007, 38, 95–113. [Google Scholar] [CrossRef]
- Benninger, D.H.; Thees, S.; Kollias, S.S.; Bassetti, C.L.; Waldvogel, D. Morphological differences in Parkinson’s disease with and without rest tremor. J. Neurol. 2009, 256, 256–263. [Google Scholar] [CrossRef] [Green Version]
- Pan, P.L.; Song, W.; Shang, H.F. Voxel-wise meta-analysis of gray matter abnormalities in idiopathic Parkinson’s disease. Eur. J. Neurol. 2012, 19, 199–206. [Google Scholar] [CrossRef]
- Christopher, L.; Koshimori, Y.; Lang, A.E.; Criaud, M.; Strafella, A.P. Uncovering the role of the insula in non-motor symptoms of Parkinson’s disease. Brain 2014, 137, 2143–2154. [Google Scholar] [CrossRef] [Green Version]
- Criaud, M.; Christopher, L.; Boulinguez, P.; Ballanger, B.; Lang, A.E.; Cho, S.S.; Houle, S.; Strafella, A.P. Contribution of insula in Parkinson’s disease: A quantitative meta-analysis study. Hum. Brain Mapp. 2016, 37, 1375–1392. [Google Scholar] [CrossRef] [Green Version]
- Chikama, M.; McFarland, N.R.; Amaral, D.G.; Haber, S.N. Insular cortical projections to functional regions of the striatum correlate with cortical cytoarchitectonic organization in the primate. J. Neurosci. 1997, 17, 9686–9705. [Google Scholar] [CrossRef] [PubMed] [Green Version]
- Cauda, F.; Costa, T.; Torta, D.M.; Sacco, K.; D’agata, F.; Duca, S.; Geminiani, G.; Fox, P.T.; Vercelli, A. Meta-analytic clustering of the insular cortex: Characterizing the meta-analytic connectivity of the insula when involved in active tasks. Neuroimage 2012, 62, 343–355. [Google Scholar] [CrossRef] [PubMed] [Green Version]
- Braak, H.; Del Tredici, K.; Rüb, U.; de Vos, R.A.I.; Jansen Steur, E.N.H.; Braak, E. Staging of brain pathology related to sporadic Parkinson’s disease. Neurobiol. Aging 2003, 24, 197–211. [Google Scholar] [CrossRef]
- Mak, E.; Su, L.; Williams, G.B.; Firbank, M.J.; Lawson, R.A.; Yarnall, A.J.; Duncan, G.W.; Mollenhauer, B.; Owen, A.M.; Khoo, T.K.; et al. Longitudinal whole-brain atrophy and ventricular enlargement in nondemented Parkinson’s disease. Neurobiol. Aging 2017, 55, 78–90. [Google Scholar] [CrossRef] [PubMed] [Green Version]
- Jankovic, J.; McDermott, M.; Carter, J.; Gauthier, S.; Goetz, C.; Golbe, L.; Huber, S.; Koller, W.; Olanow, C.; Shoulson, I.; et al. Variable expression of Parkinson’s disease: A base-line analysis of the DATATOP cohort. The Parkinson Study Group. Neurology 1990, 40, 1529–1534. [Google Scholar] [CrossRef]
- Marras, C.; Rochon, P.; Lang, A.E. Predicting motor decline and disability in Parkinson disease: A systematic review. Arch. Neurol. 2002, 59, 1724–1728. [Google Scholar] [CrossRef] [Green Version]
- Josephs, K.A.; Matsumoto, J.Y.; Ahlskog, J.E. Benign tremulous parkinsonism. Arch. Neurol. 2006, 63, 354–357. [Google Scholar] [CrossRef] [Green Version]
- Pahapill, P.A.; Lozano, A.M. The pedunculopontine nucleus and Parkinson’s disease. Brain J. Neurol. 2000, 123 Pt 9, 1767–1783. [Google Scholar] [CrossRef] [Green Version]
- Lorio, S.; Lutti, A.; Kherif, F.; Ruef, A.; Dukart, J.; Chowdhury, R.; Frackowiak, R.; Ashburner, J.; Helms, G.; Weiskopf, N.; et al. Disentangling in vivo the effects of iron content and atrophy on the ageing human brain. Neuroimage 2014, 103, 280–289. [Google Scholar] [CrossRef] [Green Version]
- Kassubek, J.; Juengling, F.D.; Hellwig, B.; Spreer, J.; Lücking, C.H. Thalamic gray matter changes in unilateral Parkinsonian resting tremor: A voxel-based morphometric analysis of 3-dimensional magnetic resonance imaging. Neurosci. Lett. 2002, 323, 29–32. [Google Scholar] [CrossRef]


| PD Patients | Controls | |||||
|---|---|---|---|---|---|---|
| TP1 | TP2 | p | TP1 | TP2 | p | |
| Number | 22 | 22 | - | 21 | 21 | - |
| Age (years; mean ± SD) | 61.7 ± 4.3 | 63.6 ± 4.3 | <0.001 * | 60.2 ± 11.7 | 62 ± 11.7 | n.s. |
| Gender (m:f; count) | 22:0 | 17:4 | 0.04 ** | |||
| MMSE (score) | 28.5 ± 1.0 | 28.2 ± 1.4 | n.s | 29.5 ± 0.6 | 29.6 ± 0.8 | n.s. |
| Disease duration (months; mean ± SD) | 86.8 ± 47.4 | 110.8 ± 47.4 | <0.001 * | - | - | - |
| LED (mg; median (range)) | 1030 (100–1790) | 1022 (500–1840) | n.s. | - | - | - |
| Motor score (UPDRS III) (score; median (range)) | 26 (12–35) | 25 (11–42) | n.s. | - | - | - |
| Impaired balance (HY ≥ 2.5) (% (n)) | 64% (14) | 91% (20) | 0.03 * | - | - | - |
| Balance and Gait (UPDRS items 27–30) (median (range)) | 4 (0–6) | 4 (1–7) | n.s. | - | - | - |
| Total Intracranial Volume (mm3; mean ± SD) | 1611/15.8 | 1504/13.9 | 0.02 ** | |||
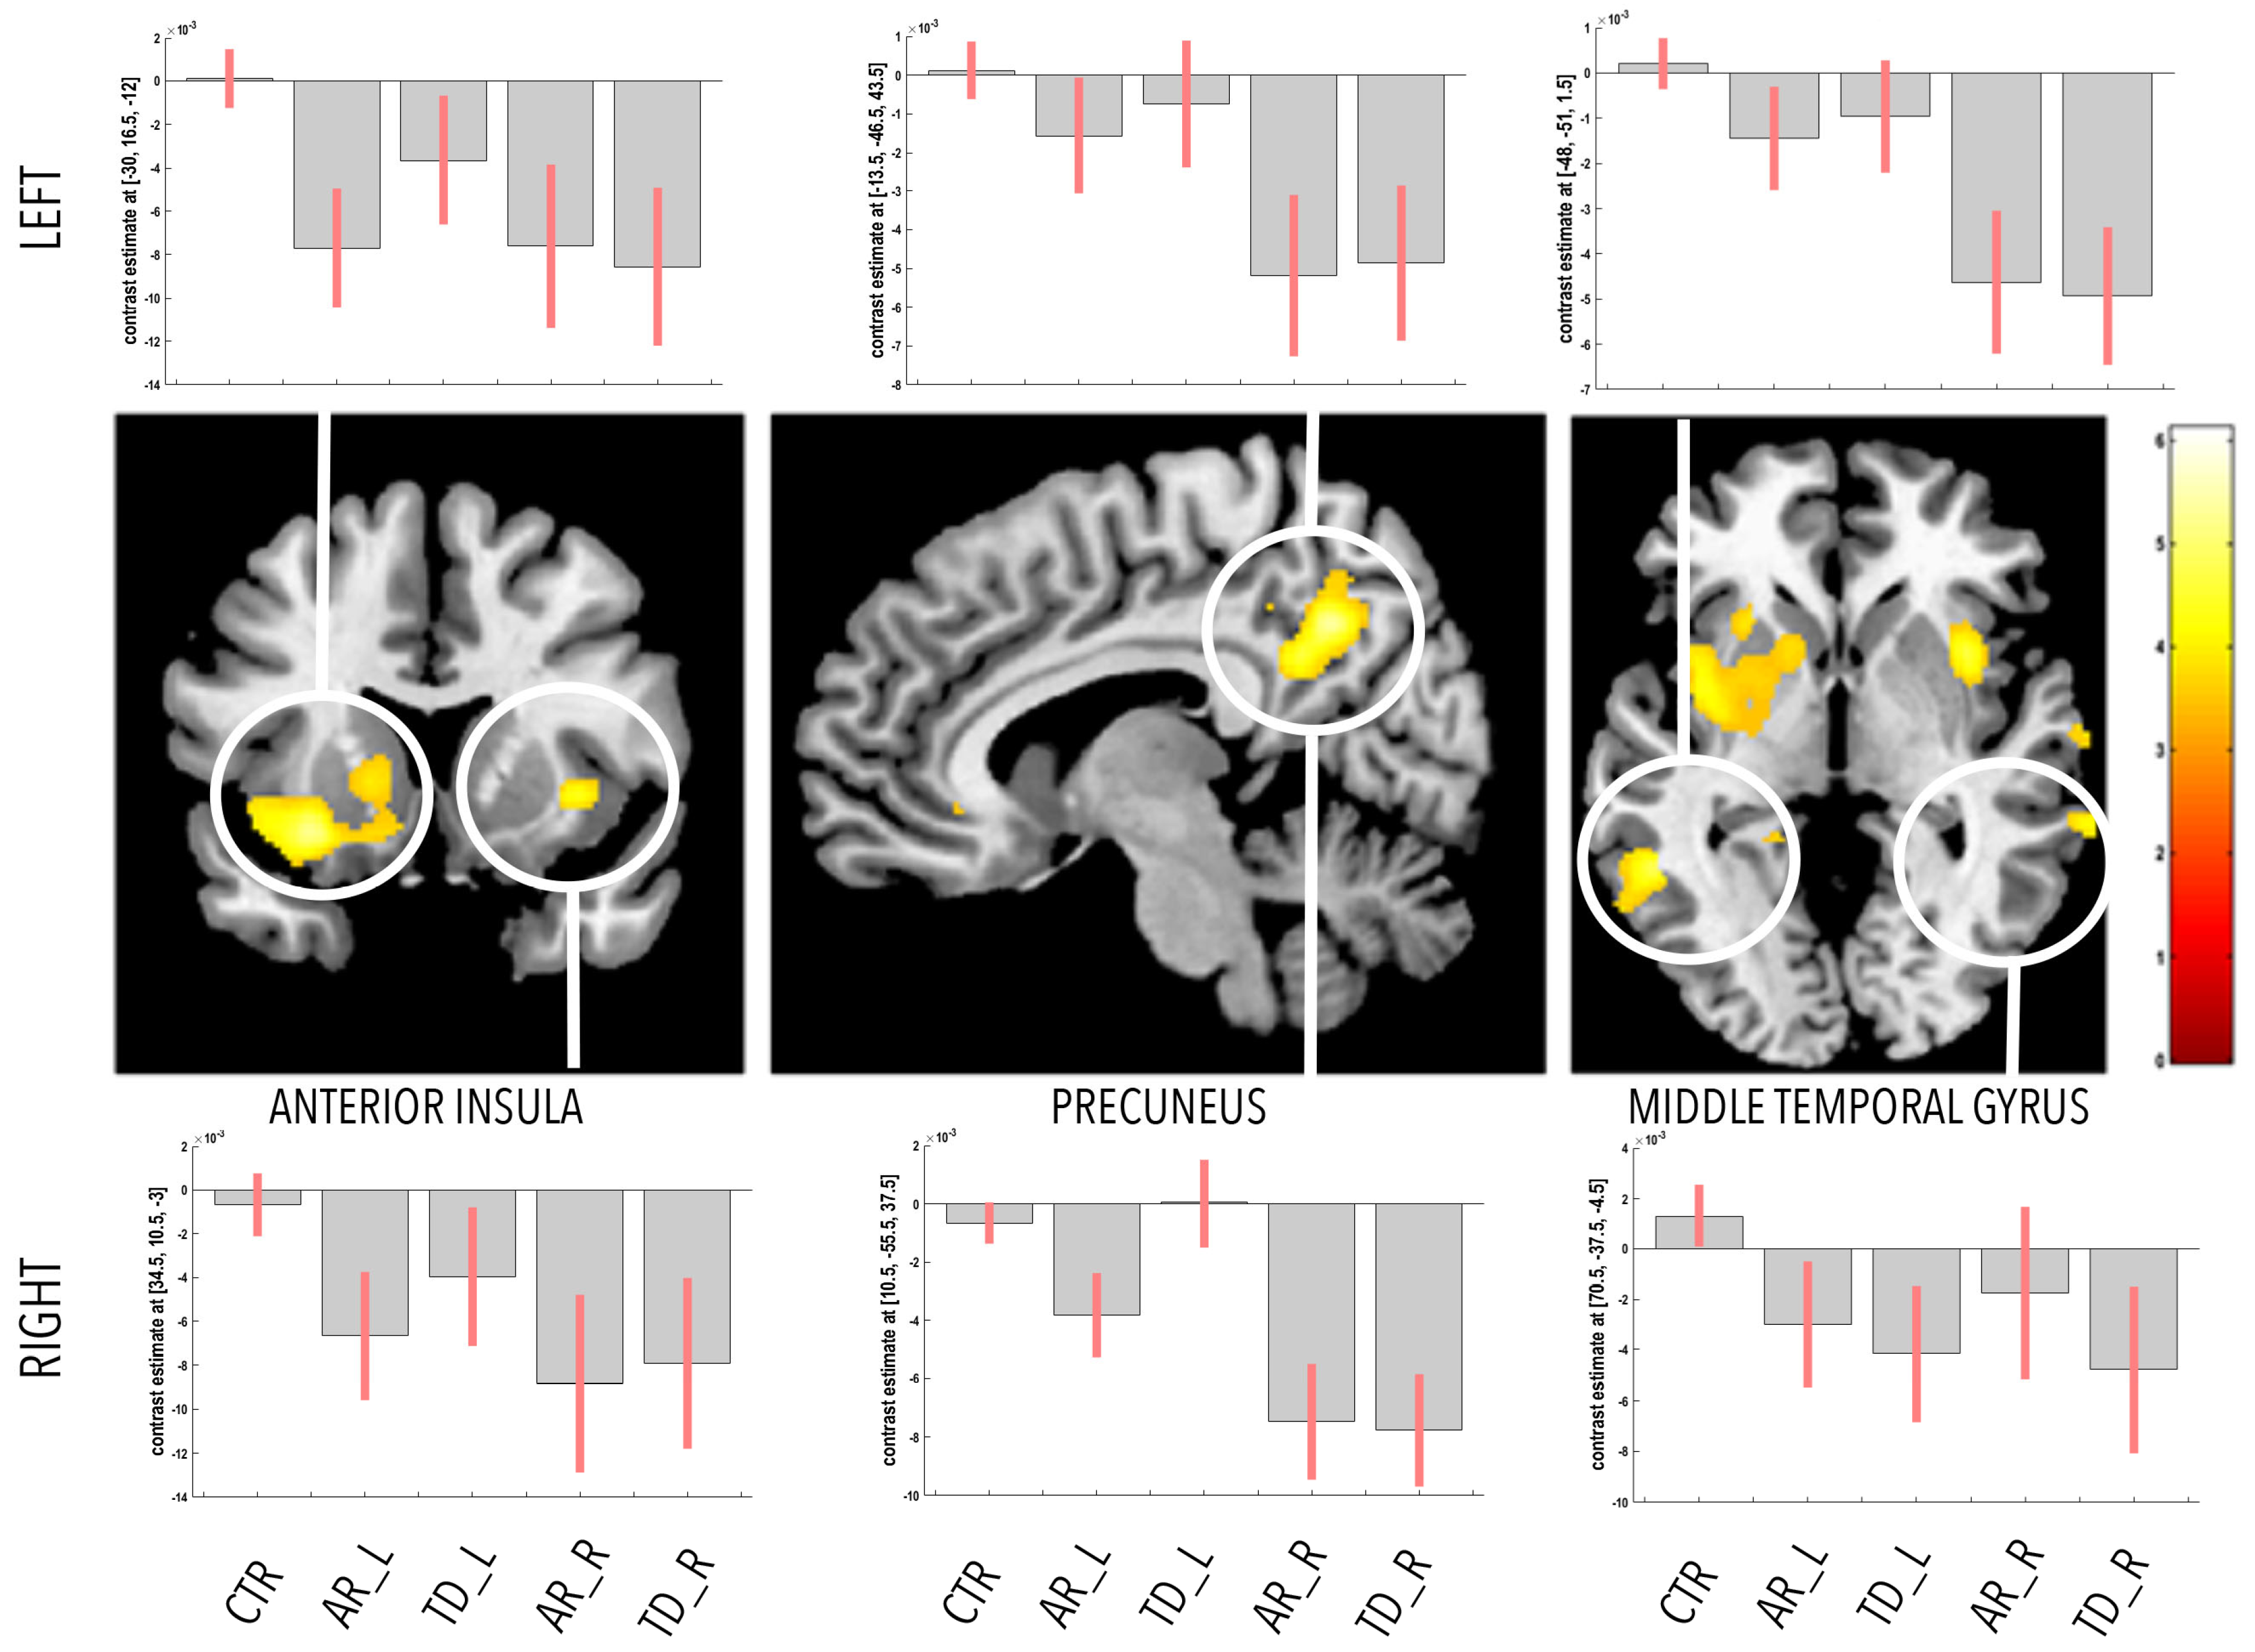
| Main Effects | Region | Side | MNI Coordinates (mm) | p-Value (FWE-Corr) | ||
|---|---|---|---|---|---|---|
| x | y | z | ||||
| PD < HC | Parahippocampal gyrus | R | 30 | −32 | −15 | p = 0.037 |
| Parahippocampal gyrus | L | −21 | −35 | −12 | p = 0.56 o | |
| Anterior insula | R | 36 | 9 | −2 | p = 0.29 o | |
| Anterior insula | L | −30 | 17 | −12 | p = 0.04 | |
| Precuneus | R | 11 | −56 | 38 | p = 0.01 | |
| Precuneus | L | −14 | −44 | 44 | p = 0.23 o | |
| Middle temporal gyrus | R | 71 | −38 | −5 | p = 0.5 o | |
| Middle temporal gyrus | L | −48 | −51 | 2 | p = 0.012 | |
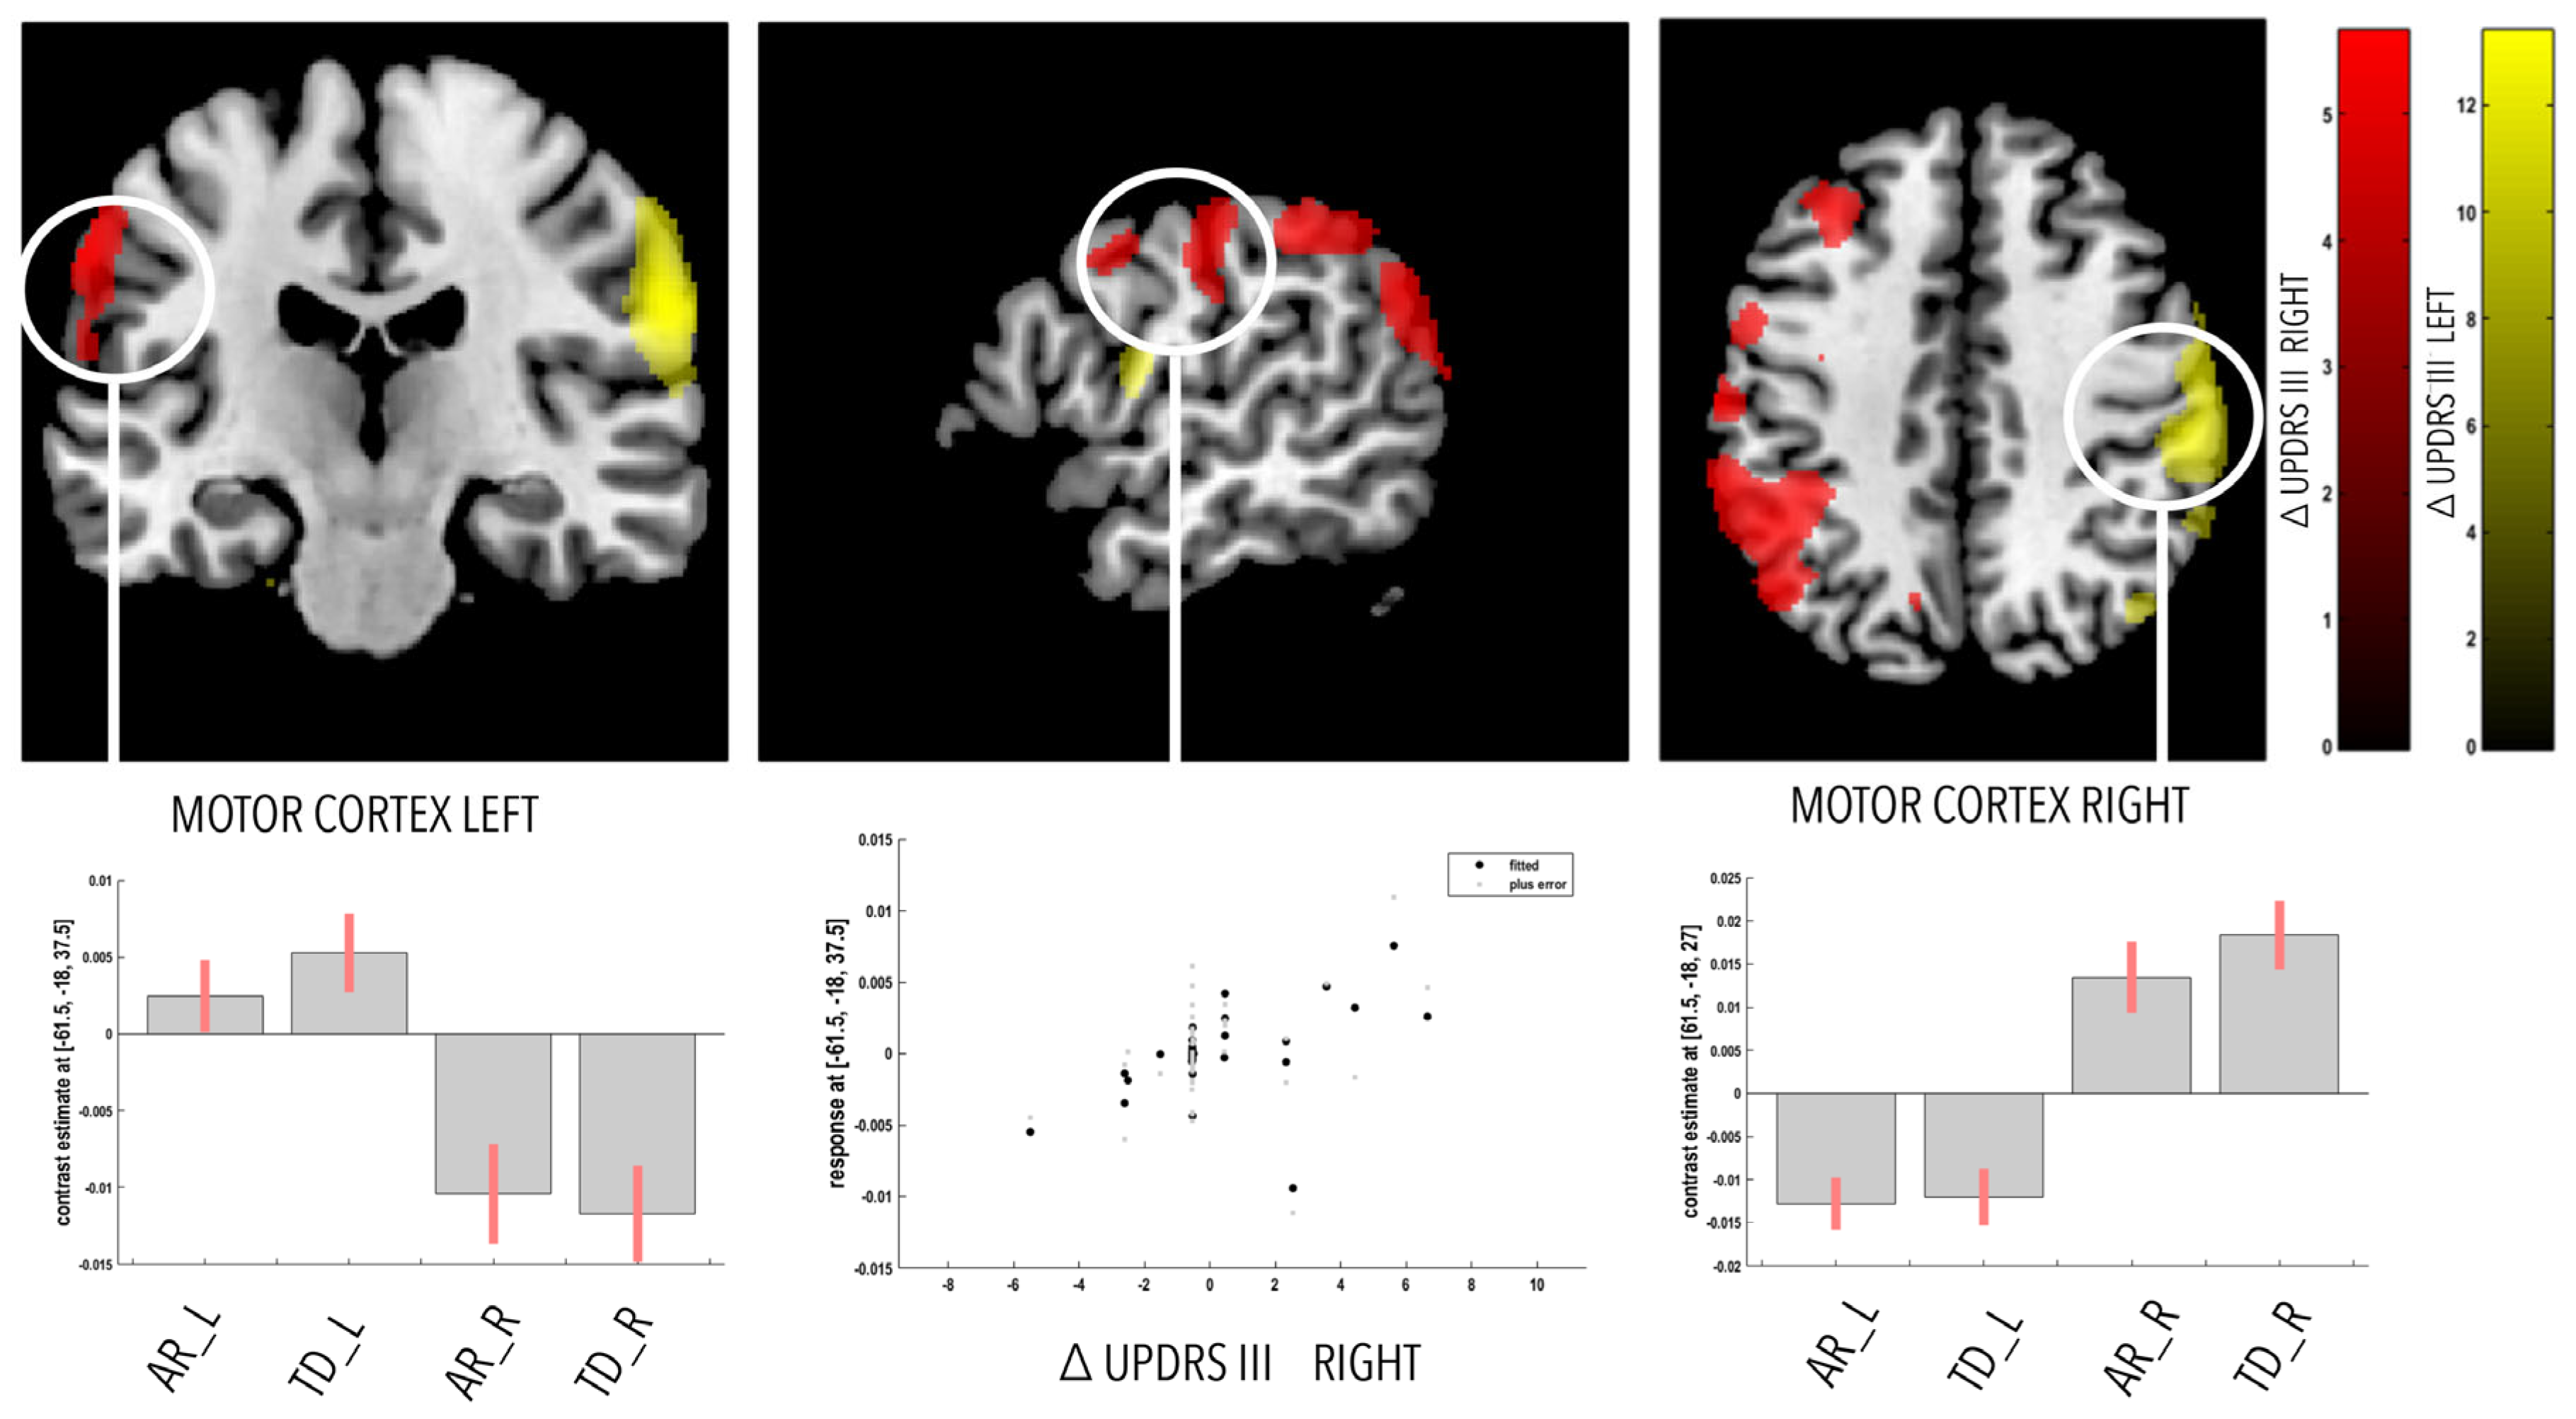
| Correlation | Region | Side | MNI Coordinates (mm) | p-Value (FWE-Corr) | ||
|---|---|---|---|---|---|---|
| x | y | z | ||||
| UPDRS_PD LEFT | Motor cortex—M1 | R | 62 | −18 | 27 | p < 0.001 |
| Angular gyrus | R | 57 | −54 | 27 | p = 0.035 | |
| Middle frontal gyrus | R | 51 | 40 | 20 | p = 0.03 | |
| UPDRS_PD RIGHT | Motor cortex—M1 | L | 62 | −18 | 38 | p = 0.028 |
| Angular gyrus | L | −33 | −60 | 33 | p = 0.03 | |
| Middle frontal gyrus | L | −42 | 36 | 35 | p = 0.05 | |
Disclaimer/Publisher’s Note: The statements, opinions and data contained in all publications are solely those of the individual author(s) and contributor(s) and not of MDPI and/or the editor(s). MDPI and/or the editor(s) disclaim responsibility for any injury to people or property resulting from any ideas, methods, instructions or products referred to in the content. |
© 2023 by the authors. Licensee MDPI, Basel, Switzerland. This article is an open access article distributed under the terms and conditions of the Creative Commons Attribution (CC BY) license (https://creativecommons.org/licenses/by/4.0/).
Share and Cite
Benninger, D.H.; von Meyenburg, J.; Dukart, J.; Bassetti, C.L.; Kollias, S.S.; Iseki, K.; Draganski, B. Clinical Phenotype Imprints on Brain Atrophy Progression in Parkinson’s Disease. Clin. Transl. Neurosci. 2023, 7, 8. https://doi.org/10.3390/ctn7010008
Benninger DH, von Meyenburg J, Dukart J, Bassetti CL, Kollias SS, Iseki K, Draganski B. Clinical Phenotype Imprints on Brain Atrophy Progression in Parkinson’s Disease. Clinical and Translational Neuroscience. 2023; 7(1):8. https://doi.org/10.3390/ctn7010008
Chicago/Turabian StyleBenninger, David H., Jan von Meyenburg, Juergen Dukart, Claudio L. Bassetti, Spyridon S. Kollias, Kazumi Iseki, and Bogdan Draganski. 2023. "Clinical Phenotype Imprints on Brain Atrophy Progression in Parkinson’s Disease" Clinical and Translational Neuroscience 7, no. 1: 8. https://doi.org/10.3390/ctn7010008